
i SUBURBAN MORPHOLOGY SESSION 2021 22 UNDER GUIDANCE OF - AR. SACHIN PALIWAL SUBMITTED TO SUBMITTED BYAR. ANUGAYA SHARAN SAKINA ALI AR. YASHIKA GUPTA 0809AR181091 School of Architecture IPS Academy, Indore

I would like to take this opportunity to express my heartily gratitude and acknowledge the contributions to all those who enabled me to complete and present this dissertation work.
First, I am grateful to my guide Ar. Sachin Paliwal for guiding me for the proper methodology of the research. I am thankful to our coordinators Ar. Anugya Sharan and Ar. Yashika Gupta for their valuable guidance.
I am also thankful to my other faculty members of our college who contributed to my dissertation by their advice. Moreover, I am thankful to my parents for their encouragement and financial support and friends for emotional support that leads me to the completion of this work.
I must express my deep gratitude towards our H.O.D. Prof. Ar. Manita Saxena for providing us proper guidance.
B.Arch. VII SEM SAKINA ALII declare that the research entitled “Suburban Morphology” is the bonafide research work carried out by me, under the guidance of Ar.Sachin Paliwal, further I declare that this has not been previously formed the basis of award of any degree, diploma, associateship or other similar degrees or diplomas and has not been submitted anywhere else. I hereby, give consent for my dissertation, if accepted, to be available for photocopy and inter library loan, and for the title and summary to be made available to other organizations.
Place: Indore SAKINA ALI
Date: 03/12/2021
B.Arch. VII SEM
This is to certifythat the dissertation entitled “Suburban Morphology” is the bonafide work of Sakina Ali, in partial fulfilment of the academic requirements for the award of “Bachelors of Architecture Degree”. This work is carried out by him, under my guidance and supervision.
Ar. Sachin Paliwal
Place: Indore
Date: 03/12/2021
Numerous academics have emphasised the importance of open and undeveloped neighbourhood spaces in residential developments. These areas, which have a variety of names and are used in a variety of contexts, are essential but are frequently overlooked and labelled as "leftovers" in modern planning practise. Due to the pressure of providing for the rapidly growing population coupled with mass migratory patterns, such spaces are rapidly losing their place in modern day residential environments, despite their usefulness in the Indian context of socially active and sometimes even intrusive communities. Due to their inherent order and integrity, the neighbourhood spaces that provide physical, psychological, and perceptual comfort to residents have been present in spontaneously developed traditional Indian cities
Suburbanization is the growth of areas on the fringes of cities. It is one of the many causes of the increase in urban sprawl. Manyresidents of metropolitan regions work within the central urban area, and choose to live in satellite communities called suburbs and commute to work via automobile or mass transit. The aim of this dissertation is to investigate and study the framework of the Suburban community settlements. It briefly communicates the effects of urbanization and geopolitical consequences on the informal settlements, which reflects the need of suburban development on the periphery of the city. Following the lines of this necessity, this also highlights the journey from a city to the suburb. However, the terminology is new, but the idea of the suburban development is since the humanity existed. The evolution of the concept of human settlement through different eras with the proposed development theories is discussed. From all the historical analysis, a standard framework and elements of the suburban development is studied as proposed by the renowned institutions. In order to justify the applied theories and framework, it includes few case studies of the subject. The dissertation will try to compare the data and connect the studied development patterns with the Indian context. Hence completing the circle, it will end on the very first concern of plausible suburbanization in India.
3.2
3.2.1
3.2.2
3.3
3.3.1
4.1
4.1.1
4.2 COST STUDY
5.2.3
5.2.4
5.2.5
5.3
5.3.1
5.3.2
5.3.3
5.3.4
5.3.5
6 STUDIES
6.1 MARYLAND’S TRADITIONAL SETTLEMENT
6.1.1 DESIGN CHARACTERISTICS OF HISTORIC
6.1.2 TYPES
6.1.3 DISTORTED GRIDS, AND BROKEN GRIDS
6.1.4 HIERARCHY AND OPEN
6.1.5
6.1.6
6.1.7 METROPOLITAN
6.2
6.2.1 CITADEL THE LOWER CITY
6.2.4 MAIN STREET AND THE AXIS OF ALIGNMENT
6.2.5 THE PATTERN OF PLOTS AND BLOCK DIVISION
6.3 (BANGLORE SECTOR 307)_
6.3.1
6.3.2
Figure 1Percentage of poor population in different size class of towns 16
Figure 2Comparison between urban and rural population from 1901 2001..... ERROR! BOOKMARK NOT DEFINED.
Figure 3Urbanization in different state of India ERROR! BOOKMARK NOT DEFINED.
Figure 4 The spatial structure of five cities. This figure shows the spatial distribution of the population at midnight of 5 large world cities. The built up area and the 21
Figure 5Pattern of trips in monocentric and polycentric cities 22
Figure 6Patterns of trips in polycentric cities 23
Figure 7Urban poor village ....................................................................................................................24
Figure 8Partial plans of public structure of village ................................................................................25
Figure 9Narrow lane 25
Figure 10Milwaukee Washington Highlands 26
Figure 11Washington Circle ..................................................................................................................27
Figure 12General plan of Wyomissing Park 28
Figure 13Cross section of streets of Wyomissing Park 29
Figure 14Wyomissing lake view avenue 30
Figure 15Wyomissing Holland Square ..................................................................................................30
Figure 16Plan prepared in connection with research into “The Economics of Land Subdivision.” It represents an attempt to 33
Figure 17 Diagram suggesting the type of plan that might be devised for a more .................................36
Figure 18 Diagram of an apartment house district such as might be laid out on the edge of a subsidiary business district and in a region in which the 38
Figure 19 Plan illustrating a five block apartment unit suitable for a rebuilding operation in a central section that had suffered deterioration 40
Figure 20Radburn: plan of the residential districts, 1929. Courtesy New York City Housing Authority. 43
Figure 21Plan of Radburn completed by 1930. 45
Figure 22 General plan showing neighborhoods. 47
Figure 23 Perspective, 1929, Courtesy New York City Housing Authority. .........................................48
Figure 24Greek city plan 50
Figure 25Roman city plan 51
Figure 26The basic plot layout of Manhattan is shown in the dotted lines. On this, four wards of the Savannah type of development have been superimposed. The example shows the effective way in which this layout opens up broad bands of green space and public buildings running across the developed areas. 53
Figure 27The basic plot layout of Manhattan is shown again in the dotted lines. The building forms show three stages of development including the original 4 6 story perimeter form with a garden at the centre, which was characteristic of the city in the 1850s, and two examples of the more intensive development during the present.....................................................................................54
Figure 28The illustration shows building plot development in its most inten sive form. 55
Figure 29 FL Wright country planning 56
Figure 30 Barnesville component site plan. ...........................................................................................67
Figure 31 Barnesville base map. ............................................................................................................69
Figure 32 Shapsburb town plan 70
Figure 33 Easton component site location map. 70
Figure 34 Stoneleigh neighborhood plan showing growth over time.....................................................72
Figure 35 Stoneleigh pool component site plan. ....................................................................................73
Figure 36 Stoneleigh location relative to the City of Baltimore. 74
Figure 37 Indus and Kathmandu Valley 76
Figure 38 Site plan of Mohenjodaro 77
Figure 39 Plan of the lower city of Mohenjodaro...................................................................................78
Figure 40 Mohenjodaro Aerial Photograph 79
Figure 41Layout plan of VS area 79
Figure 42 Layout Plan of HR area..........................................................................................................80
Figure 43 Grid Pattern of VS and DK Area, Mohenjodaro ....................................................................81
Figure 44 Axes of Mohenjodaro 81
Figure 45 Grid Modules of Mohenjodaro. 81
Figure 46Banglore sector 307 plan 83
Figure 47Yelahanka city view................................................................................................................84
Figure 48 Road connectivity diagram of Yelahanka 85
Figure 49 Google map plan of Yelahanka 86
Figure 50 Yelahanka street map 87
Figure
Figure
Figure
Figure
Among the developing countries, India has the most striking urbanisation characteristics. According to the Census of India, there were 1,827 cities and towns in 1991, 5,161 in 2001, and 7,935 in 2011. The increasing attraction of larger cities causes them to outgrow their spatial boundaries, causing them to annex surrounding agricultural lands in order to meet land demand. The relentless spread of cities has been constrained to some extent by the creation of suburbs between urban and rural land, by separating urban and suburban areas, and bycreatingopen spaces to avoid compact and congested planning and spaces because of increasing migration to cities and rising population.
A mixed use or residential area is referred to as a suburb. It can exist as a separateentityoraspartofalargerurbanarea,anditfrequentlyemploysalargenumber of people. Industrial suburbs, planned communities, and satellite cities, for example, have lower population densities than inner city neighbourhoods within a metropolitan area and most residents commute to central cities or other business districts; however, there are many exceptions, such as industrial suburbs, planned communities, and satellite cities. Suburbs tend to grow in abundance around cities with a lot of flat land nearby.
The nature of suburban design suggests that it was designed with a specific purpose in mind rather than by chance. However, it is more of a matter of adhering to a set of development rules or a means of putting the government's political will into action.
Suburbanization has received little attention in developing countries, particularly in large countries like India, which has a large number of urban
The purpose of this dissertation is to examine historical traditional settlements and compare them to the basic formwork of suburban development.
• I will be studying the conventional, traditional and historical patterns and systems of suburban planning, in order to understand there relevance for today.
• Basic framework of community development.
• Contextual and topographic considerations.
• Historical planned cities and proposed ideas for socio economic landscape of the comping suburban society.
• Case studies of planned suburbia.
• The study will focus on general formwork of the suburban development.
IT IS VERYPLAUSIBLE TO BELIEVETHAT SUBURBANIZATIONIS IMMINENT ON THE BASIS OF THESE DATA.
• The scope of study is to analyze the design consideration for facilities of house, shop, work and relax.
• Specific for the suburban developments taking place in the tier one cities.
• Effects of development on socio economic relation between people.
• Unplanned and Haphazard settlements are not covered in the study.
• Sample size The amount of books and articles that can be approached for dissertation is limited, in the given period
• Access to sample It is difficult to access most of the physical data, because of the current pandemic.
• Most of the study is based on secondary data available.
• Perception There is limit on how much I can perceive with limited access to samples and sample size.
• Because of topographic and contextual differences, general framework of the development is limited to some scale.
The methods adopted for the research includes,.
• Analysing the current statistics of Urban economics in India, to reflect the importance of suburbanization.
• Analyse the current statistics and Census data of the urban sprawl and suburban development.
• Defining the route from a city to suburb, and its formation, with collected data from books, articles, research papers and citations.
• National and International case studies.
• Studying the basic framework of suburban community development
• Study the published data from institutions and architecture standard books.
The worldwide scale and effect of metropolitan settlements and urban areas will decide the course of the rising 21st century. Urban areas are presently not confined and reacting just to neighbourhood and provincial impacts. Exceptionally huge urban communities megacities are detonating in size and development, generally in recently creating areas of the globe. The effect of this development, in any case, is not confined. The metropolitan blast is worldwide in its beginnings and in its persuasions, influencing each mainland and nation. Because of globalization, worldwide political affiliations, broadcast communications, transport and trade are highly hindered.
The world's population has risen from approximately 1.6 billion to 6 billion in recent years. This quadrupling is matched by a startling twentyfold increase in the global metropolitan population. Over the next two decades, cities with populations ranging from 250,000 to one million are predicted to have the most significant urban expansion. The aggregate yearlygrowth of such cities now exceeds 28 million per year.
In fifteen years, it will have risen to 31 million per year.
Megacities, which are large metropolises with populations of more than 8 million people,have grownin popularityduringtheprevious half century. Global cities are, bydefinition, cities in the twenty first century. The implications, on the other hand, will be felt globally, not just in terms of global economic infrastructure, but also in terms of global environmental quality, health, and human culture affects that will be felt without limits. Megacities will have 400 million inhabitants by 2022, accounting for roughly 6% of the world's population. In the same year, thirty eight cities with 5
10 million residents are predicted, accounting for more than 4% of the world's population. While cityexpansion in affluent countries has slowed slightly, the majority of increase is taking place in countries with poorer, less developed cities that are ill equipped to handle it. As a result, many planners and designers who are tasked with improving urban conditions around the world have a limited understanding of the complexities of designing world cities.
The rising pace of global urbanisation is driven by population growth, which is hastened by unplanned and unanticipated migration. Workers and families are migrating out of rural areas in developing countries around the world, enticed to cities by the promise of a better life. People are driven from their traditional homelands in other regions affected by natural disasters and civil turmoil, forcing forced migration
Such movement undermines cities’ best population stabilisation efforts, putting additional strain on infrastructure and contributing to health and sanitation issues, unemployment, crime, and the poverty cycle. In such circumstances, urbanisation is a contributing factor.
At least 120 million people in the worldwide labour force are unemployed, and 700 million are categorised as "underemployed," working long hours but not earning enough money to meet their necessities. In Asia, Africa, and Latin America, more than halfoftheurbanpopulationlivesinpoverty.Over3billionpeople,orhalfoftheworld's population, live on less than $2 each day. The number of people living in extreme poverty is increasing, as is the proportion of those living in extreme poverty.
Poverty is concentrated in cities in more developed countries because, despite higher median wages, more than 75 percent of the poor live in cities. Wealth disparity exacerbates inequity, causing division in societies where justice and fairness are
required by civil society. The richest 20% of the world's population receives close to 85% of total global national product, while the poorest 20% of the population receives almost no benefits from global productivity.
Thousands of people are moving to cities in search of better opportunities or simply a better way of life, putting pressure on cities' limited space and infrastructure. As a result, sprawl, suburbanization, and the creation of satellite cities are common outcomes. Despite its dysfunctional outcomes, the horizontal expansion into green fields appears irresistible. According to one estimate, each year in the United States, suburban roads and houses replace 2.5 million acres of farmland, much of it on prime agricultural soil. Every yearin China,494,000acres ofarableland arelost to citystreets and developments.
The demand for transportation and other services is also increasing as the population grows. Cities will need to absorb between two and 4 billion more people by 2050 than they do now. Though the majority of this increase will occur in developing countries, industrialised countries will not be immune to the effects of urbanisation and population growth. Shifts.
The consequences will be global, manifesting themselves in global resource loss, unsustainable inequities in life quality, global health risks, and the instability that accompanies inequities wherever they exist unfairly. The planning of world cities is a worldwide concern. More attention will have to be paid to the poorer countries that are facing greater challenges.
India's urbanisation is neither unique nor exclusive, but rather a global phenomenon. Urbanisation in India has progressed in the same way that it has elsewhere in the world because of and because of economic change. One aspect of the
change is the shift in employment from agriculture to urban-based industry and services. At the same time, increased agricultural performance has also promoted urbanisation as noticed in several top rice and wheat producing districts in the country. To cite some examples, in the districts of Chengalpet, Krishna, Burdwan, Ludhiana or Kurukshetra, the percentage of urban population is seen to be higher than the state average.
Rapid urbanisation has resulted in issues such as urban sprawl, ribbon development, unregulated development, high costs for urban infrastructure, and pollutionbecauseofinsufficientwastedisposal. Alloftheseissues revolvearoundland. Agriculture, forestry, grazing, industrial and urban uses, utility corridors, roads, waste disposal, and recreation are all possible uses for land. As the urban population has grown, more and more agricultural land has been converted to urban use. For example, between 1981 and 1991, Vishakapatnam's population increased by 75%, while its spatial expansion increased by 230 percent, resulting in a threefold increase.
Land resources must be inventoried, their spatial relationships delineated, and their capacities for all likely uses determined in order to make the best use of land.
Much of the land use planning legislation is already in place. Many Master Plans have failed, according to the evidence, because they were overly ambitious, lacked financial resources, and lacked public participation. Traditional land use systems are ineffective at controlling the quality, pace, or distributional effects of land development.
The record shows that public land development and regulatory agencies have struggled to keep up with the rapidly changing needs of urban economies and populations. Local governments must facilitate people's participation in and commitment to land use planning and control, and make it more dynamic in response to changing needs.

Afterindependence, India's urbanisation beganto acceleratedueto thecountry's adoption of a mixed economy, which facilitated the growth of the private sector. Due to the large demands of the growing population and the primary sector's inability to meet them, urbanisation creates market disparities.
It is possible to argue that urbanisation has a variety of effects on migrants. During the early stages of transformation and the struggle to find work in a fast paced environment, friends and family become support systems. It could take months, if not years, for them to adjust to their new surroundings and find a stable job. Migrants must support themselves in the city as well as their families who remain at home.
The formation of urban agglomerations, which are defined as geographic concentrations of urban population and economic activities, is one of the most recent phenomena observed in India. This means that urban agglomeration is related to, but not the same as, urbanisation. Urban India has seen a steady increase in the proportion of its population living in cities, the emergence of new cities or towns, a significant contribution to the country's national income, poverty reduction, increasing inequality, and a lower level of inclusive growth.
Figure 1Percentage of poor population in different size class of townsFigure 2 Urbanization in different state of India

The transition from traditional rural societies to modern urban communities is known as urbanisation. It is a long term, ongoing procedure. These changes are manifested in the increasing concentration of population in human settlements larger than villages, in people's increased involvement in secondary and tertiary production functions, and in the progressive adoption of certain social traits typical of traditional rural societies." Urbanization is not only a by-product of industrialization, but it is also linked to modernization, and the three can sometimes coexist.

The uneven regional distribution of urban population in India causes lopsided urban growth. Maharashtra, Gujarat, Tamil Nadu, Karnataka, Punjab, and West Bengal are the six largest states in India, accounting for roughly half of the country's urban population. The concentration of most economic activities near big metro cities has caused the level and growth of urban population in recent decades to be concentrated primarily near some of India's largest cities.
People migrate from rural areas to urban areas in search of work and a better standard of living.
The ramifications are more severe, and it has resulted in The process of urbanisation is progressing at a breakneck speed, with no parallel increase in industrialization or overall economic development. Unplanned urban growth, for example, leads to the expansion of slums and squatter settlements, resulting in varying degrees of environmental degradation and increased strain on existing infrastructure. The following are some of the general issues that arise because of a particular type of urbanisation found in low income countries:
1. Housing shortage
2. Critical flaws in public utilities, such as power, water, health care, and sanitation.
3. Deteriorating urban environments, urban unemployment, and traffic congestion, to name a few issues.
4. Severe poverty
5. The growth of slums.
Suburbanization is a global phenomenon that involves low density settlement on the outskirts of cities. It is exacerbated byurbanisation, improved transportation, job decentralisation, public policy, and a widespread desire to live in the suburbs. The majority of suburbs are built by private agents who are guided by the government.
The main cause of suburbanization over the last two centuries has been the growth of urban populations, despite the fact that many accounts overlook this fact. In most regions, such growth was aided by both population growth and urbanisation, or an increase in the proportion of people living in urban areas. Because cities were unhealthy until the mid-twentieth century, urbanisation was fuelled by rural urban migration. However, improvements in public health have recently made cities healthier than rural areas in most parts of the world. Natural growth has played a role in urbanisation and, as a result, suburbanization.

The spatial structure of a city can be defined by two complementary components: first, the spatial distribution of population as recorded by census data, and second, the pattern of trips taken by people as they travel from their home to their place of work, schools, shops, social gatherings, and any other location where they will engage in productive or social activity. The spatial distribution of population is thus a static representation of the city when its inhabitants are at home, whereas the pattern of trips is a schematic representation of the complex trajectories that these same citizens will take when they are not at home.

The spatial distribution of population is an image of where the majority of a city's population is between the hours of midnight and 6 a.m. As a result, the density maps created by urban planners show densities around midnight rather than densities during the day.
Figure 3 the spatial structure of five cities. This figure shows the spatial distribution of the population at midnight of five large world cities. The built up area and the
The population's spatial distribution can be graphically represented by combining census data and land use maps to create a three-dimensional object, with the built up area map in the X Y plane and population density within the built up area in the Z dimension. The geometrical properties of this 3 dimensional graph must be examined in order to better understand the spatial structure of a city.
Every day, residents of a city travel from their homes to various locations throughout the city, including places of work, shopping areas, and cultural and social facilities. They also travel to see each other's homes. Many jobs require you to travel to multiple locations in the same day. The simplistic view that trip patterns are generated by daily return trips from home to work should be rejected. To avoid any misunderstanding, the term "meeting places" refers to the places where people go after they leave the office. Trip patterns will thus depend on the relative location of residences and meeting places within the metropolitan area.
The majority of these meeting places in a monocentric city are heavily concentrated in a central area. The majority of meeting places in a polycentric city are clustered around metropolitan areas, with the number of clusters ranging from three to several hundred.
Figure 4Pattern of trips in monocentric and polycentric cities


A monocentric city can maintain a unified labour market by allowing easy movement from the periphery to the centre along radial roads or rails. The higher the value of land, the closer it is to the CBD. When land prices are determined by the market, densities tend to follow it.
The utopian concept of a polycentric city as a cluster of urban villages persists in the minds of many planners, despite the fact that it has never been seen in the real world. For example, in some Stockholm suburbs, developers are only permitted to construct new dwelling units if they can demonstrate that a sufficient number of jobs are available in the area. Another example of the urban village concept is the satellite towns built around Seoul and Shanghai. The majority of the residents of these towns work and commute to the central city on a daily basis, and those who commute from the central city perform the majority of the jobs in the satellite towns.
In reality, a polycentric cityworks in much the same way as a monocentric city: jobs attract peoplefrom all overthecity,regardless ofwheretheyarelocated.However, thepatternoftrips is different. Eachsub centrein a polycentriccitygenerates trips from all over the city's built up area (Fig. 3C). Trips have a wide range of origin and destination, making them appear almost random. Trips in a polycentric city will, on average, take longer than in a monocentric city. However, the higher the value of land should be for a given point, the shorter the trip to all potential destinations.
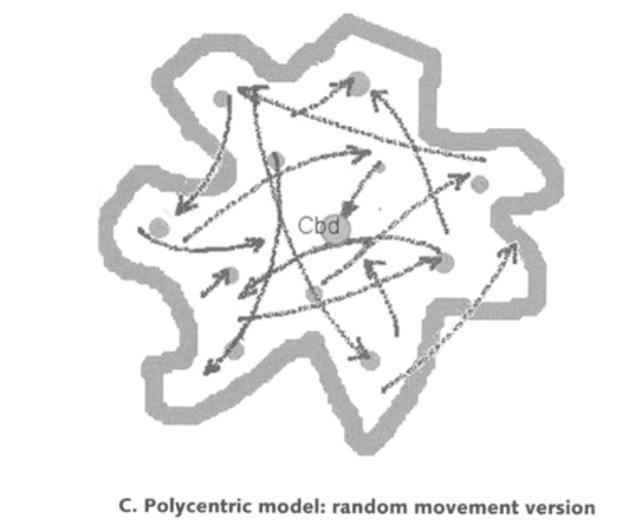
The original monocentric structure of large metropolises tends to dissolve over time into a polycentric structure as they grow in size. The CBD loses its prominence, and clusters of activities that generate trips are dispersed throughout the urban area. Large cities do not start out as polycentric; however, they may evolve in that direction. Monocentric and polycentric cities are thus members of the same species, albeit at different stages of their evolution.
 Figure 5Patterns of trips in polycentric cities
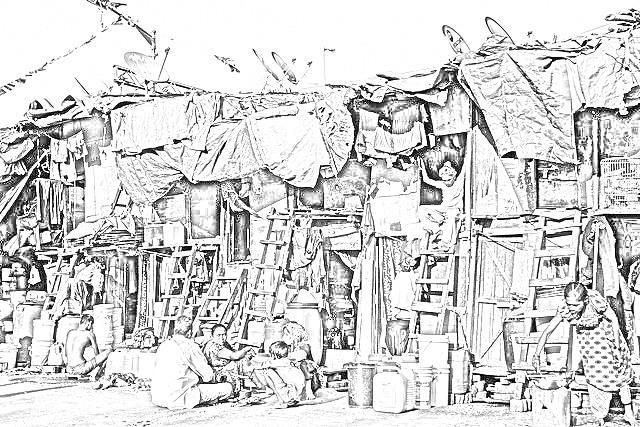
The CBD district is formed by the congestion of all the commercial and administrative powers of the city. That makes it the most costly area of the city. Migrants get attracted towards these hotspots, but because of high land value, theyhave to settle on the periphery of the city. This type of unnatural growth of the city leads to the development of informal settlements on the periphery. Most of the people residing in these areas are poor and lack basic amenities.
Figure 6Urban poor village
The scale and severity of the urban poor's shelter problems in less developed countries has grown because of cities' rapid and extraordinary growth. Because traditional resources are insufficient to address this problem, the majority of low income urban housing is provided by the so called informal sector, which exists and thrives outside of the traditional market economy. Even
The most dramatic and large-scale efforts to improve people's quality of life in rural areas may not be enough to stop the flow of migrants into cities.


These informal settlements on the edge of the city are converted to a small community residential block. These residential these are called the suburbs. People living in the same suburb usually share similar backgrounds with regard to race, socioeconomic status, and age.
Suburbs, in comparison to other types of living environments, are generally spread out over greater distances. People may choose to live in the suburbs in order to avoid the city's density and disorder. Automobiles are common sights in suburbs because people need to get around these vast stretches of land. Transportation (including, to a lesser extent, trains and buses) is essential in the life of a suburban resident who commutes to work.
Figure 7Partial plans of public structure of village Figure 8Narrow lane Figure 9Milwaukee Washington Highlands
On the eastern edge of Wauwatosa, between 68th and 60th Streets, the Washington Highlands neighbourhood consists of 375 beautiful, large houses spread out over 133 acres. We can call it the "high rent district" with impunity.
The straight: street that dominates the design is a continuation of a straight city boulevard that runs out from a large park, his formal axis, which drops ten feet to its middle point and then rises twenty, both are straight grades, and bridges over a creek valley serve as an informal cross axis. The axis feet carried up by a steep orchard park and terminates in a group of large houses at the high point of the tract, a hundred feet above the valleypark, above the end of the straight street (whose execution was tapered from ahundredfeet at the east endto fifty six feet at theeast). Streets adaptedas closely as possible to the difficult terrain provide access to this high ground.
The northern part of the property is connected to the main axis by Washington Circle (the void), which provides an easy grade for those who want to avoid the steep ascent of Mount Veraon Avenue. Fine existing trees inspire Two Tree Lane and Elm Plaza. A hedge surrounds the entire property, and hedges line the main axis street. All entrances are identified by uniform entrance posts, varying hedge, and clipped linden plantings. The subdivision's construction was completed in 1920.An attempt to add a Figure 10Washington Circle

pleasant variation to an existing gridiron. The plan made it possible to build a garage court in the round block's centre, accessible via a lane from the street. Because the drawing had to be suitable for use as a newspaper advertisement, there are varieties of doll houses.
WyomissingParkisalargelanddevelopment in Wyomissing,aReadingsuburb (See the general plan, Fig. 1171.) The first principle established in developing the plan was to divide the tract roughly into three zones: the one closest to the city and the knitting mills in Wyomissing should be built up with grouped houses; the next, on the slopes toward Wyomissing creek, should be divided into fairly large lots for freestanding houses; and the third, beyond the creek valley, should be divided into estates of various sizes.
 Figure 11General plan of Wyomissing Park
Hard gridiron streets and endless row houses are to blame for making Philadelphia so drab, with William Penn's original plan's open squares providing the only respite. Even so, as one looks down on the city from the peaks of Mt. Penn, one's gaze is drawn inexorably to the beautiful open countryside. The plan for Wyomissing Park paid more attention to the lesson of the great father of the state and dutifully reinstated his open squares, which were the best part of his Philadelphia plan, to their important place in city planning.
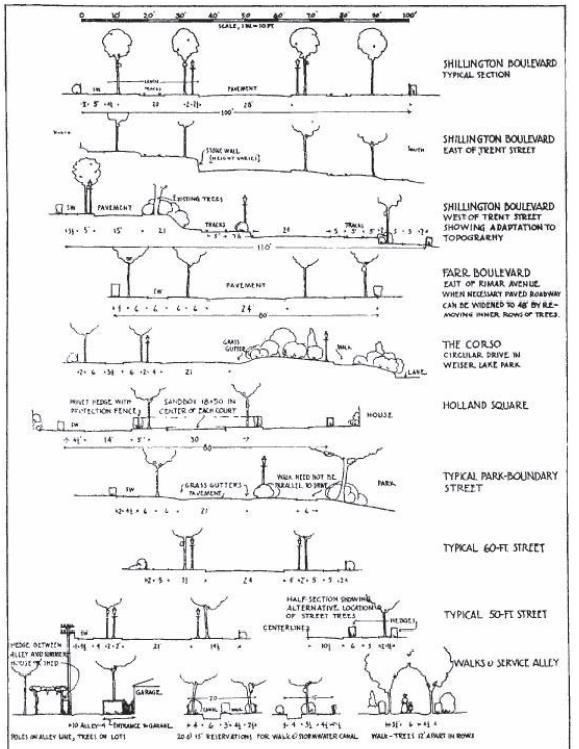 Figure 12Cross section of streets of Wyomissing Park
Row houses are valued for their aesthetic and economic value in the region's building traditions. As a result, the first zone could be designed primarily as a series of courts surrounded by rows of houses, similar to the English garden cities. Trebor Court and Holland Square are two of them that have been completed, with more on the way. The Wyomissing Creek valley is a pleasant natural park with a meadow fringed with elms. In colonial times, iron was extracted from a mine near the small lake in the northern part of the tract.

The term "neighbourhood unit" refers to the scheme of arrangement for family life community .Residential communities that meet the universal needs of family life have similar parts performing similar functions, according to research. Those components have been assembled as an organic whole in the neighbourhood unit system. Within this area, there are definite political entities, such as villages, counties, and citiesthat serveas usefuldivisions forsub regional planningandwithin thoseunits, there are definite local or neighbourhood communities that are devoid of governmental boundaries and occasionally overlap two or more municipal areas. As a result, we find three types of communities involved in the planning of any large metropolitan area.
1. The regional community, which embraces many municipal communities and is therefore a family of communities;
 Figure 14Wyomissing Holland Square
Figure 13Wyomissing lake view avenue
Figure 14Wyomissing Holland Square
Figure 13Wyomissing lake view avenue
2. The village, county or city community;
3. The neighbourhood community
The scheme's underlying principle is that an urban neighbourhood should be considered both as a part of a larger completely and as a separate entity. The municipality is responsible for government, fire and police protection, and a variety of other services. The majority of the neighbourhood’s residents work outside of the neighbourhood. They must go to the "downtown" district to invest in bonds, attend the opera or a museum, and possibly even buy a piano.
Other facilities, functions, or aspects, on the other hand, are strictly local and unique to a well-planned residential community. They can be divided into four categories. Other institutions in the area
Elementary school
Small parks and playgrounds Local shops Residential environment
A residential unit development should provide housing for the population that normally requires one elementary school, with the actual area varying depending on population density.
The unit should be surrounded on all sides by arterial streets that are wide enough to allow all through traffic to bypass it.
A system of small parks and recreation spaces should be established, with each neighbourhood’s needs in mind.
. School and other institution sites with service spheres that coincide with the unit's boundaries should be grouped around a central point, or common area.
One or more shopping districts, adequate for the population served, should be laid out around the unit's perimeter, preferably at traffic intersections and adjacent to similar districts in neighbouring neighbourhoods.
The unit should have its own street system, with each highway proportioned to its expected traffic load and the street network as a whole designed to facilitate internal circulation while discouraging through traffic.
The figures depict plans and diagrams in which the principles have been applied to provide a clear picture of each of these principles.
Figure 15Plan prepared in connection with research into “The Economics of Land Subdivision.” It represents an attempt to


. The section is still entirely open and features a gently rolling, partly wooded terrain. So far, the only roads are country roads, but they are destined to become major thoroughfares in the future. There are no commercial or industrial buildings in the area.
There are 822 single family homes, 236 double family homes, 36 row houses, and 147 apartment suites in the subdivision, which can accommodate 1,241 families. This would result in a population of 6,125 people and a school enrolment of 1,021 students at a rate of 4.93 people per family. The average density for the entire tract would be 7.75 families per gross acre.
The tract's parks, playgrounds, small greens, and circles cover 17 acres, or 10.6% of its total area. The total acreage of open space is 18.2 acres if the 1.2 acres of market squares are included. The common, which covers 3.3 acres, is the largest of these areas. This serves as a park as well as a backdrop or approach to the school.
The main playground for small children, measuring 2.54 acres, is located behind the school, and the girls' playfield, measuring 1.74 acres, is located nearby. The 2.7 acre boys' playground is located on the opposite side of the schoolyard, a short distance away. Tennis courts are conveniently located in another section of the district. Various other places
COMMUNITY CENTER
The common spaces within the group of buildings, is the layout's most important feature. The schoolhouse and two lateral structures are arranged around a small central plaza.
One of these structures could be used as a public library, while the other could be used for any suitable neighbourhood purpose. Two churches will be built, one adjacent to the school playground and the other at a nearby location. A well known street intersection the common and central buildings, in both design and landscape treatment, form an interesting and significant neighbourhood community centre.
At each of the development's four corners, there are small shopping districts. The streets leading to the stores have been widened to allow for parking, and small market squares have been built at the two most important points to provide additional parking and unloading space in the back of the stores. A total of 7.7 acres is dedicated to business blocks and market plazas. The plan provides an average of 2.3 feet of business frontage per family.
 Figure 16 Diagram suggesting the type of plan that might be devised for a more
The boundary streets have been made sufficiently wide to serve as main traffic arteries in order to implement the unit principle. One of the bounding streets is 160 feet wide, while the others are 120 feet wide. A central roadway for through traffic and two serviceroadways forlocal trafficareprovidedoneachofthesearterial highways, which are separated by planting strips. The development contributes half of the area of the boundary streets.
Theinteriorstreets aretypically40or50feet wide,which is sufficient fortraffic expectedin aneighbourhoodwith thissingle familydensity. Theareadevoted to streets is much lower than in a typical gridiron subdivision due to the careful design of blocks. Thepercent oftotal street areawouldbereducedfrom 27.4percent to around22percent if the bounding streets were not more than 50 feet wide.
This plan would accommodate 2,381 families based on five storyand basement buildings with 1,320 square feet per suite (Fig. 3). With 4.2 people per family, the total population would be 10,000 people, with about 1,600 of them in elementary school, a number that could be comfortably accommodated in a modern elementary school.
The general neighbourhood is the area where downtown businesses and residences begin to merge. One side of the unit would be dedicated to general business concerns and would face the city's main street. Both the residents of the unit and the public would benefit from a theatre and a business block punctuated by an arcade.
Wide streets bound the unit, while the interior system is divided into shorter highways that allow for easy circulation within the unit but do not run continuously through it. They tend to congregate at the community centre. Their widths vary to accommodate various traffic loads and parking requirements.
Over one acre of land is dedicated to parks and playgrounds for every 1,000 people. If the space in apartment yards is included, the average per 1,000 people is 3.17 acres.
Figure 17 Diagram of an apartment house district such as might be laid out on the edge of a subsidiary business district and in a region in which the
Six tennis courts will be able to be marked off on the smaller playground if desired. The bottleneck park is partially encircled by a cluster of apartments, but it is

open to all residents. The recreation areas should be seeded and have planting around the edges to make the vistas from the surrounding apartments more appealing.
A school, two churches, and a public building are clustered around a small common. A branch public library, a museum, a "little theatre," or a fraternal building could be the last option. In any case, it should be used for the benefit of the local community.
The common may be given a formal treatment, with a monument and possibly a bandstand included in the design. The school's ground plan indicates a type in which the auditorium, gymnasium, and classrooms are all in separate buildings connected by corridors. This arrangement greatly facilitates public use of the school plan while also allowing for efficient use of the buildings for instructional purposes.
Figure 18 Plan illustrating a five block apartment unit suitable for a rebuilding operation in a central section that had suffered deterioration
The plan is presented as an example of the type of treatment that could be given to central residential areas with high land values that are destined for reconstruction due to deterioration or the sweep of a real estate movement. The blocks chosen for the ground site are 200 feet wide and 670 feet long, a length found in several Manhattan sections.Twostreets areclosedandtwoarecarriedthroughthedevelopment as covered roadways under terraced central courts in this plan, which borders a river.

The plot measures 650 feet by 1,200 feet between the boundary streets, with a total area of approximately 16 acres. On the northern and southern boundaries, the building lines are set back 30 feet from the streets. Both of the streets at the end of the block, which were
Originally 60 feet wide, the road has been widened to 80 feet, with two 20 foot extra strips removed from the development area. From 80 to 100 feet, the western boundary has been widened. The total area dedicated to street widening and building setback is 89,800 square feet, which is 11,800 square feet more than the two streets that were appropriated.
Both end courts are 20 feet higher than the central space, and they cover the two streets that runthrough thedevelopment. Theserviceareas forthebuildings arebeneath these courts.
Tennis courts are located on one end of the central space, while a nearly one acre children's playground is located on the other. The plan achieves an unusual standard in terms of light in that no habitable room has an exposure to sunlight of less than 45 degrees due to the large open spaces and the arrangement of the buildings

Because all of the structures are 50 feet wide, two-room apartments are possible throughout the building, and buildings on adjacent blocks will never overshadow the western central rib, which is 130 feet from a 100 foot street.
The buildings can accommodate about 1,000 families, with suites ranging in size from three to fourteen rooms, the majority of which are suitable for family use. In addition, a transient hotel, an elementary school, an auditorium, a gymnasium, a swimming pool, handball courts, locker rooms, and other athletic facilities would be available. On one or more sides of the unit, the first floors of certain buildings could be devoted to shops. Motion pictures, lectures, small theatre performances, public meetings, and possibly public worship could all be held in the auditorium.
The buildings range in height from two to three stories on the street corners to ten stories in the adjacent ribs, fifteen stories in the main central ribs, and thirty three stories in the two towers. Many of the roofs could be given a garden like treatment, adding to the scheme's array of appealing possibilities.
Despite being much more compact than the other three plans, this one adheres to all of the unit principles. The community centre and shopping districts are not prominent, but they are both present.
The City Housing Corporation from the plans developed by Clarence Stein and Henry Wright started Redburn, a planned community, in 1929. It is America’s first garden community, serving as a worldwide example of the harmonious blending of private space and open area. The intent was to build a community, which made provisions for the complexities of modern life, while still providing the amenities of open space, community
service and economic viability. The community was intended to be a self sufficient entity, with residential, commercial and industrial areas each supplementing the needs of others.

Redburnwasplannedtobeaone square milecommunitywith25,000residents. However, due to the Great Depression, the development was limited to only 149 acres. There are 430 single family homes, 90 row houses, 54 semi attached houses, and 93 apartment units in the development, as well as a shopping centre, parks, and other
amenities. For this purpose, it used the following elements:
Figure 19Radburn: plan of the residential districts, 1929. Courtesy New York City Housing Authority. The Superblock in place of the characteristic narrow, rectangular block.
Specialized roads planned and built for one use instead of for all uses: service lanes for direct access to buildings; secondary collector roads around superblocks; main through roads that connect traffic from different sections, neighbourhoods, and districts; For connecting to other communities, express highways or parkways are used
Complete separation of pedestrian and automobile, or as complete separation as possible. When crossing roads, walks and paths are routed in different places and at different levels.
Houses turned around. Living and sleeping rooms facing toward gardens and parks; service rooms toward access roads.
Park as backbone of the neighbourhood. Large open areas in the centre of superblocks, joined as a continuous park.
None of the plan's components was entirely new. The integrating superblocks, specialised and separated modes of circulation, the park backbone, and the house with two fronts were all Redburn innovations. Redburn intertwined these to create a new unity that serves as a practical and appealing backdrop for today's realities.
They built their houses on the outskirts of large blocks, with farms behind them and sometimes a large garden in the centre. The Redburn blocks ranged in size from 30 to 50 acres. Their contours were shaped by their internal requirements as well as topography.
In England, the dead end lane was used for peace and to save money on roads and utilities. In colonial villages, culs de sacs were occasionally used. This was more neighbourly, and shovelling snow was easier in the winter. The cost of through street pavement and main line utilities had not yet become a significant economic factor.
Figure 20Plan of Radburn completed by 1930.

The only distinction between parkways and pseudo expressways and regular cityor town streets was the name. To plan or build roads for a specific use and no other, it was necessary to make the decision ahead of time to make the specialised use permanent or at least long lasting.
The Redburn Idea and the Redburn Plan were developed as a group effort. It was not just the idea of its architects and planners. The technicians and staff of the City Housing Corporation’s character, as well as their diverse abilities and experience influenced it.
The neighbourhoods were designed in a half mile radius around elementary schools and playgrounds. Each was supposed to have its own shopping mall. The number of children cared for by a single school determined the size of the neighbourhood. This allowed for a slightly higher concentration of population in apartments or row houses, which were found to be the best places to put them as construction progressed. Over and under passes were to connect all parts of each neighbourhood.
The neighbourhoods were designed for a population of 7,500 to 10,000 people, depending on the most desirable number of students in a school, a topic that at the time, and I believe still is, elicited a wide range of opinions. Despite making a start on the construction of two of the neighbourhoods, neither was completed.

They chose a location within a mile radius of all future houses as the main
educational and cultural centre, which is equidistant from the three proposed elementary schools. This was near the crossroads of the major north south and east west thoroughfares. The high school and town community building were to be built on a beautiful hill. A low, nearly marshy area lay below. Although not ideal for residential use, it was ideal for the central recreational field, which served the needs of both the high school and the town.
Figure 21 General plan showing neighborhoods.It is possible that the main commercial centre served as a regional market. As a result, it was placed near the proposed state throughway at Radburn's main entrance, rather than in the physical centre. The planned superblocks will have an interior area of 400,000squarefeet(37,160squaremetres)andwillbeabletoaccommodate1,250cars. This parking lot was supposed to be used by the nearby Regional Theatre in the evenings.

1. The Redburn Plan meets today's needs for good living in a more practical and enjoyable way.
It is safer and convenient
It is more spacious and peaceful
It brings people closer to nature
It costs less than other types of development with an equivalent amount of open space
2. A living plan necessitates an organisation with vision, capable leaders, and adequate financial resources for the operation of the
Figure 22 Perspective, 1929, Courtesy New York City Housing Authority.
Until competent and well funded government agencies exist for this purpose, a private organisation is required.
Be a single central organization rather than a group of separate sectional block associations.
3. A new town's construction necessitates a large capital investment in land, utilities, highways, and public buildings, all of which will yield little, if any, financial return for many years.
Grids is an urban plan type in which streets are laid out in an orthogonal network, forming a pattern of approximately rectangular blocks; also called a checkerboard plan, checkerboard plan, chessboard plan or gridiron plan.
The Greek city of (Miletus) had a plan to first articulate the grid's value as a symbol of social order and rationality.
Hippodamus completely rebuilt Athens (Piraeus), one of the most famous cities of the time, in a symmetrical manner. Parallel and straight streets intersect each other.
 Figure 23Greek city plan
According to this plan, Hippodamus rebuilt Miletus, where he was born. The plan was then implemented in southern Italy's Thurio and Rhodes. Underground sewage system was applied the entire city and there were drainpipes. They were built separately then the roads, streets and city walls. Main doors of City walls were open to an important street.
The grid of the Roman towns was derived from military camps and was organised around two main streets, called the Cardo Maximus (north south) and Decumanus Maximus (east west) (east west).
The Forum, or marketplace, the Basilica, or law court, the Curia, or meeting hall,andaCapitoliumforofficialstateworship,allofwhichwerebuiltduringHadrian's reign (AD 117 138). To impose order on occupied territory, this system was expanded across Europe.
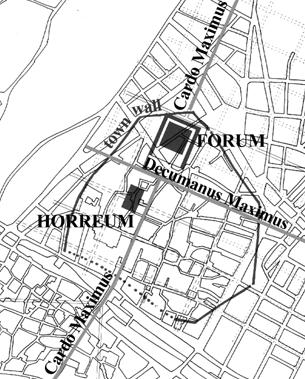 Figure 24Roman city plan
Savannah's city grid can be used as a starting point for learning about city grids. The principle is illustrated in a view of Savannah in 1734 from John Reps' book: the plots and streets of the embryo city are being laid out; some buildings are complete. The Savannah grid is divided into square units called wards, which are separated from one another by wide streets. Building plots for houses are arranged along two sides of each square (or ward), the centre is open, and on each side of this open square are sites for shops and public buildings. Savannah grew because of the addition of these wards. There were four units in 1733, and twenty four in 1856.
The city became a checkerboard of square ward units, with the street pattern separating them. However, the plaid is further elaborated within this. In one direction, intermediate roads connect each ward's central open spaces; in the other, the central areas become a continuous band of open spaces and public buildings. A unit grid with direction and orientation is shown below.
The building arrangement that developed within the grid in New York can be used to trace the grid's influence. We can immediately recognise what we might refer to as the streets and the grid based system. We know that this defines the general plot pattern if we use the language of urban geographers.
The stages of this latter process can be traced back to the 1850 plans for Manhattan. The road grid is already in place. Separate building plots are being established within this general plot pattern. A line of huts and shacks can be seen to the north, on the building frontier. More permanent but separate structures are being constructed further south. The full building arrangement has solidified into connected terraces of four to six story houses arranged around the perimeter of the site and enclosing private gardens in the most developed area further toward the tip of Manhattan.
Figure 25The basic plot layout of Manhattan is shown in the dotted lines. On this, four wards of the Savannah type of development have been superim posed. The example shows the effective way in which this layout opens up broad bands of green space and public buildings running across the devel oped areas.
However, as the demand for floor space grows, the building form shifts dramatically at certain nodal points. Deeper and higher perimeter structures submerge the internal garden space first. The individual building plots begin to be colonised, resulting in larger areas of the general plot being covered by higher buildings.

In 1916, the first single building to occupy an entire city block soared 600 feet, with roof space nearly equalling ground plan areas. This structure exemplified the need for comprehensive zoning ordinances to protect daylight in streets and adjacent buildings, which were passed that year after extensive study and political compromise. However, the grid now has a significant influence; the grid's small size suggests that the only way to
Figure 26The basic plot layout of Manhattan is shown again in the dotted lines. The building forms show three stages of development including the original 4 6 story perimeter form with a garden at the centre, which was characteristic of the city in the 1850s, and two examples of the more intensive development during the present.
increase floor space in a given area is to build tall buildings on each individual plot. The concept suggests ziggurats and towers, while the regulations shape it.

Any grid appears to impose a rigid imposition on the natural landscape. The relief from the grid's monotony became a specific goal in their opposition to it. Central Parkis an attempt to recreatewild scenerywithinthe gridbyimitating nature. Oneform of attack on the grid system, and an attempt to replace it, is the garden suburb, with its curving streets.
It is impossible to deny the gravity of the grid's criticisms. It, like curvilinear suburbia, can become monotonous. It, like the organic city, has the potential to fail.
Figure 27The illustration shows building plot development in its most inten sive form.Frank Lloyd Wright had given a similar and vivid illustration of the grid's capacity to respond to diversity and freedom in Chicago's larger and more open mile square network. In 1913, a competition was held to "awaken interest in methods of dividing land for the common good" (Yeomans 1916). The location was a standard mile square grid section. If applied rigidly, the grid could be divided into 32 rectangles, each 600 feet (189 metres) long and 250 feet (76 metres) deep. Mr. Wright accepts the city's established gridiron for subdivision "as a basis."
He accepts the "distinctive assemblage of buildings...found in everysemi urban areaofChicago."Thenumberofpeoplewhoarehousedisthesame.Thearea'sbusiness buildings, factories, heating plant, and utilities are all present. "They cling naturally to the main arteries of traffic," he says.
 Figure 28 FL Wright country planning

Of course, people's impressions of a building, a specific environment, or a whole city are more than just visual. Within the city, there are many connotations, memories, experiences, smells, hopes, crowds, places, buildings, the drama of life and death, all of which affect each person differently. Each person creates his own mental picture of the parts of the city in physical relation to one another based on his surroundings. The most important components of one's mental image, or map, overlap and complement those of his peers. As a result, a collective image map or impressions can be assumed. city map: a collective representation of what people extract from the physical environment
Walkways, streets, transit lines, canals, railroads, and interstate highways are all examples ofpaths, or corridorsofmovement, that giveshapeto a community.Ways, streets, transit lines, canals, railroads, and interstate highways are all examples of transportation infrastructure. They are the lifelines that carry the majority of activity and connect all of the functions that make a community work: government, industry, commerce, and housing. There are networks of paths for automobiles, pedestrians, bicyclists, mass transit, and wildlife in true communities. Automobiles do not take precedence over other users. The goal of street design is to create a balanced environment for a variety of users.
A city's centre, uptown, midtown, in town residential areas, train yards, factory areas, suburbs, college campuses, and so on are all made up of component neighbourhoods or districts. The Wall Street area of Manhattan, for example, is a good example of how distinct they can be in terms of form and scope. They can be quite diverse in character and have no clear boundaries, as in Manhattan's midtown district.
The edge of a district is where it ends. Some districts have no clear borders at all, but gradually fade away and merge into another. A seam is formed when two districts are joined at an edge. Central Park's eastern border is Fifth Avenue. A narrow park can serve as a link between two urban neighbourhoods.


The city's landmarks are its most visible visual features. The Empire State Building or a radio mast are examples of large landmarks that can be seen from a long distance. A street clock, a fountain, or a small statue in a park are examples of small landmarks that can only be seen up close. Landmarks are an important part of urban design because they help people find their way around the city and identify specific areas. In its urban setting, a good landmark is a distinct but harmonious element.
A node is a hub of activity in a network. It is a type of landmark, but it differs from a landmark in that it has an active function. A node is a distinct hub of activity, similar to how a landmark is a distinct visual object. New York City's Times Square is both a landmark and a hub.

These five elements of urban form are enough to provide a useful visual survey of a city's form. The fact that people think of a city's form in terms of these basic elements gives them significance.

The skeletal elements of a city form are paths, landmarks, nodes, districts, and edges. A tapestry of embellishing characteristics hangs from that basic framework, and together theymake up a city's personality. We must consider landform, natural verdure, climate, several aspects of urban form itself, certain details, and several lesser facets of form to build a broader vocabulary upon this basic framework
Every city is constructed on a plot of land. The shape of the land and its features are the most important factors in determining the shape of a city. When we talk about landforms, we are mostly talking about topography.

We look at the terrain's shape flat, gently rolling, hilly, mountainous in relation to the architecture and cities that it supports. A flat site could indicate either vertical architecture or bold horizontals. A slightly hilly site might suggest vertical architecture at the summits with a flow of cubes on the slopes, or architecture that ends just below the crests.

Cliffs, mountain peaks, horizon ranges of hills, plateaus, rivers, and lakes are all prominent features of a landscape that should be noted. These landscape elements can be used actively as sites or passively as vistas to complement architectural and urban form.
Buildings and small towns are frequently visible in their entirety within the context of nature. As a result, they serve as accents or counterpoints to their natural surroundings, bringing vitality to a serene environment. A larger town, on the other hand, is rarely visible in its entirety, but only in parts, from various vantage points.
There are three aspects to a visual survey of nature in relation to architecture and urban design. We begin by determining the aesthetic and functional characteristics of the surrounding landscape to which our architectural and urban forms must respond. Second, we assess how well our current architecture and cities complement nature. Third,wemustdeterminewhichnaturalareaswill beleft alonetoserveas complements to the urban form. We search for assets and liabilities throughout this process, preserving and enlarging the former and noting corrections to be made on the latter.
Every city has a distinctive shape. Shape can be classified in a number of ways.


Radio centric: The most frequently found urban form is the radio centric, a large circle with radial corridors of intense development emanating from the centre.

Rectilinear: A variation on radio centric form is the rectangle, which usually hastwocorridorsofintensedevelopment crossingatthecentre.Thisvariant oftheradio centric form is found in small cities rather than large. It is the radio centric form with right angles.

Star: A star shape is a radio centric form with open spaces between the outreaching corridors of development.

Ring: A ring shape is a city built around a large open space. The San Francisco Bay is such an open space for the cities of the bay area. A ring and star may be found in combination, particularly where a loop road is built around the outskirts of an expanding me tropolis.

Linear: The linear shape is usually the result of natural topography, which restricts growth, or the result of a transportation spine. Stalingrad in the Soviet Union was planned as a linear city. The megalopolis on the East Coast has become a vast metropolitan area with a linear configuration.

Branch: The branch form is a linear spine with connecting arms.

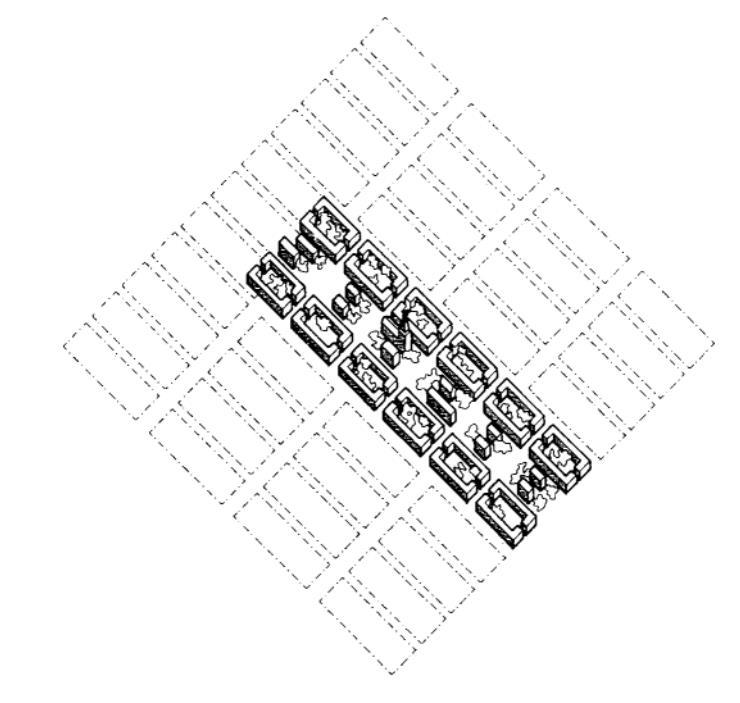
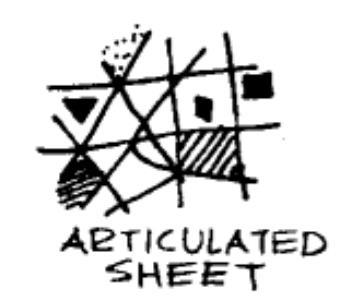
Sheet: A vast urban area with little or no articulation

Articulated Sheet: one or more central clusters accent the articulated sheet form and several sub clusters.
Constellation: The constellation is a series of nearly equal size cities in close proximity.
Satellite: The satellite is a constellation of cities around a main centre
These classifications of form have definite implications for a city’s function. They have advantages and disadvantages related to circulation, proximity to open space, and articulation of neighbourhoods or districts


The size of a city is closely related to its shape, and it is a quantitative aspect that can be approached in a varietyof ways. We first consider a city's physical size how many miles wide it is or how far it stretches from centre to outskirts. Size can also be defined in terms of the number of people who live there. The relationship between size and density is significant because it indicates population distribution and the urban massing of a city.
Studies of density is conducted on separate sectors of a city unless the city is evenly built up. Density figures show the relationship between built up and open land, so they can almost graphically depict the image of a suburban or in town row house neighbourhood. Theimpact ofdensityon various modesoftransportationis significant. It is useful to determine the density of various areas and to relate the density figures to physical patterns of land and buildings, and thus the visible form of the area, when conducting a visual survey.
As we travel along movement routes, we see landscapes, architecture, and cities as sequences. Movement routes have a significant impact on the landscape they pass
through, as well as the architecture and cities they serve. Movement routes are a major determinant of urban form. When conducting an urban design survey of a city's routes, it is best to start far outside the city limits, in the country.


Cars, buses, and delivery trucks stop and go along the through arteries, which serve an intricate network of small streets. These streets have a mix of vehicles and pedestrians.Wesurveythem to seeifvehicularand pedestrianmovement are in conflict or if they complement each other. These responses demonstrate how an inquisitive survey generates a plethora of questions and ideas.
Therefore, some of the components of the path district edge landmark node framework require more attention than others as we expand on them. The degree to which one aspect or another is emphasised will be determined by the size of the city or urban sector being surveyed. Paths, districts, and open spaces, for example, may be the most prominent elements in a large scale survey of the entire city. However, at all levels, the examination of the city's districts will almost certainly necessitate the most effort.
Figure 29 Barnesville component site plan.

Maryland's traditional land development patterns tended to produce cultural landscapes of great beauty and environmental quality in the past, with compact settlements, farms, and natural scenery coexisting in symbiotic harmony. This cultural landscape is still intact and undamaged in parts of the region.
Traditional towns achieve their attributes in different ways, but all possess the following characteristics:
• The boundaries of the historic, paradigmatic rural settlements are visually discernible, and their boundaries are compact and identifiable.
• Their designs are linear, crossroads, or gridded, with variations to accommodate terrain or circumstance, achieve spatial hierarchy, or enhance a localised "sense of place."
• Theyhave ahighlevel ofspatial hierarchy.(Publicspaces, forexample,are frequently marked in town centres; local neighbourhoods frequently have their own, less formal public open spaces.)
• They accommodate a mix of uses, even at the hamlet scale.
• They typically include a range of housing types.
• Parking is accommodated in a mix of on street and off street strategies. Large scale parking lots are rare, and anomalous.
The study settlements are divided into four categories for ease of reference: hamlets, villages, towns, and traditional suburbs. The first three categories represent "growth over time" morphology, as nearly all towns began as hamlets. Three working categories were established based on the examples:
These are compact, discernible settlements of 25 to 60 separcomate structures, with no, or a very small number of, commercial enterprises.
These are compact, discernible settlements of about 50 to perhaps 300 separate structures, accommodating a half dozen to several dozen commercial occupancies.
 Figure 30 Barnesville base map.
Figure 31 Shapsburb town plan


These are compact settlements larger than villages, containing several or a number of neighborhoods. Towns by definition have town centers (downtowns), and often play a role in governance as a jurisdictional centre or subcenter.
Figure 32 Easton component site location map.
A grid plan creates a "visually appealing" location map and maximises alternativecirculationroutes.Gridshaveaninherentproblem:thereisnoimplicitcentre or location hierarchy.
The lack of a central focus in classic Roman planned towns was addressed by designating one central street, the cardo maximus, and a central crossing street, the decumanusmaximus.Theirmeetingprovidedageographicandhierarchical focalpoint, which is usually commemorated with a civic open space. Lesser hierarchical locations were typically provided along the grid's streets by dedicating "exedral" spaces on one side of the road. Buildings on the cardo maximus or decumanus maximus had a clear advantage over those on other roads in terms of location. Chestertown is built almost identically to the classical Roman model.
Towns have downtowns, while villages have centres. For recreation and to foster a sense of community identity, local neighbourhoods require open space.
Traditional towns achieve a sense of spatial and locational hierarchy through plan disposition and distortions, as well as the provision of centralising and exedral figural space.
The majority of these areas are square or rectangular. In most neighbourhoods, open space is shaped more haphazardly and haphazardly.
In contrast to conventional suburbs, another distinguishingfeature of traditional settlements is the presence of an intimate mix of housingtypes and appropriatelyscaled commercial buildings. In traditional settlements, a variety of housing types and
commercial activities are housed in a built environment that appears to be governed by scale continuity.
The visually contained street corridor is an essential component in all of the traditional towns depicted here. It is the traditional town's basic organising device and provides its defining imagery.
Except for Stoneleigh, all of the towns in this book share one major distinguishing feature: they are visually bounded. The collector and arterial roads that surround Stoneleigh, as well as its perceptible coherent visual character, give it "edge" definition as a community. Every other town has a discernible edge, where the settlement's fabric meets natural or cultivated open space.
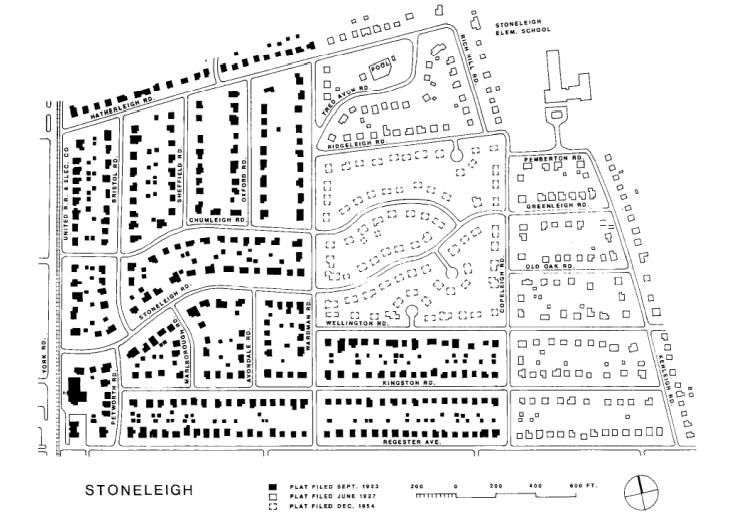 Figure 33 Stoneleigh neighborhood plan showing growth over time.
The study only takes into account Stoneleigh as a metropolitan suburb. It is an archetypal traditional "edge city" suburb, built in sections between 1923 and 1954. Except for Stoneleigh Road, which followed the curvingpath of the existing Stoneleigh House approach drive, the first streets were planned as a grid.
The gridded pattern was followed in Stoneleigh's second phase, which was platted in 1927. The final phase, platted in 1954, was laid out in gently curving streets and three short cul de sacs on the site of the recently demolished Stoneleigh House.
A hamlet and village development strategy could be used in areas already impacted by suburbanization and spot development to give form, structure, and a sense of hierarchy to what would otherwise become an environment of more or less
 Figure 34 Stoneleigh pool component site plan.
continuous sprawl and strip highways. New villages strategically placed and buffered by open space would "centre" otherwise amorphous communities and allow for a localised concentration of services. Their construction would increase the variety of housing options available in rural and suburbanizing areas of the state, possibly increasing the suburban population's sense of belonging to more understandable communities.
Figure 35 Stoneleigh location relative to the City of Baltimore.
New growth around existing settlements, as well as freestanding new settlements in important, surviving cultural landscapes, and even in suburbanizing areas, should follow the historic, regional context in terms of urban and architectural order.

Using physical design elements to create functional neighbourhoods that work not only on a physical level, but also on a social and aesthetic level is one of several ingredients in making growth areas appealing.
• Neighbourhoods should be compact and identifiable, and their boundaries visually discernible.
• Neighbourhood plans should be comprehensible. For example, plans might be linear, crossroads or gridded, with variations to achieve spatial hierarchy, or to enhance local visual assets.
• Neighbourhoods should be visually coherent. Character is established through consistent rules of organization and architecture.
• Neighbourhoods should possess a strong degree of spatial hierarchy. • Street corridors should be visually bounded, “layered,” and intimate in feeling. Street trees, sidewalks, and front yard design elements can create visual layers and contribute to the intimacy of the streetscape.
• Street blocks should be understood to describe component neighbourhoods, suggesting the role of streets and alleyways as a channel for neighbourly interaction.
• Communities should accommodate a mix of uses, even at the hamlet scale.
• Communities should typically include a range of housing types.
• Parking should be accommodated in a mix of on street and unobtrusive off-street strategies. Large scale parking lots should be avoided.
• Most important, neighbourhoods and their settings should convey a strong “sense of place.”
Mohejodaro was an ancient civilization (3300 1300BC) located in northwest Indian subcontinent (including present day, Pakistan, northwest India) on the fertile flood plain of Indus River and its vicinity. This ancient civilization has amazed historians with its unprecedented organizing principles, which were used to plan, develop and evolve the towns and cities.
The civilization demonstrates advanced application of process oriented modeling techniques with respect to organizing and optimizing its resources.
Figure 36 Indus and Kathmandu Valley

THE CITY IS DIVIDED INTO TWO PARTS
1) THE CITADEL in the west in size but higher in altitude of fortified structure, important buildings
2) THE LOWER CITY
Located in eastern part Larger in area but lower in altitude Common people lived here
The cities have citadels to the West built on higher platform and to the east of which is the hub of residential area. A massive brick wall surrounds both of them. The cities without citadel are found on high mounds.

CHARACTERISTICS ASSEMBLY HALL THE GREAT BATH STUPA FORTIFICATIONS
Figure 37 Site plan of Mohenjodaro
Figure 38 Plan of the lower city of Mohenjodaro.

• The city was laid out on a grid of streets. An orthogonal street layout was oriented toward the north south & east east directions:
• The widest streets run north south, straight through town; secondary streets run east west, sometimes in a staggered direction.
• Secondary streets are about half the width of the main streets; smaller alleys are a third to a quarter of the width of the main streets.
The excavated areas of Mohenjo Daro are distributed at different locations as can be seen in the aerial photograph. These areas have been named as HR AREA, VS AREA, DK AREA

 Figure 39 Mohenjodaro Aerial Photograph
Figure 40Layout plan of VS area
Figure 39 Mohenjodaro Aerial Photograph
Figure 40Layout plan of VS area
• The settlement blocks and dwelling clusters of Mohenjo Daro, in general, follow the orthogonal pattern in their layout with slight deviations.

• The lanes are occasionally found staggered.
• Aligning with the reference axis of the Main Street, the grids are continuous between HR Area and the VS Area that are separated by about a distance of 90 meter.
Figure 41 Layout Plan of HR areaAmong the east west and the north south boundaries of cluster blocks, the latter is comparatively more pronounced in its continuity.
The longitudinal divisions, in general, define the depth of cluster blocks, which are most evident in HR and VS Area.
The transverse divisions that give width of the blocks show a certain degree of variation.
Figure 43 Axes of Mohenjodaro
Figure 44 Grid Modules of Mohenjodaro.


 Figure 42 Grid Pattern of VS and DK Area, Mohenjo Daro
Measurement values are noted only for those blocks whose boundaries do not coincide with the grid.
•It can be seen that most of the cluster blocks have width from 9.6 m to 19.20 m, while quarter blocks with depth of 38.40 m are not uncommon in all the three areas.
•The coincidence of 9.6 m grid is considerable suggesting 9.6 m x 9.6 m as one of the standard plot sizes.
Cities of the Harappan civilization were known for their urban planning, baked brick houses, elaborate drainage systems, water supply systems, clusters of large non residential buildings, and new handicraft . Its large urban centres of Mohenjo Daro and Harappa grew to contain between 30,000 and 60,000 people, and the civilisation itself may have numbered between one and five million people during its heyday.
Thecityplanningcan be usedas abasis fortheplanningofsmall satellitetowns. The patterns and placements of this whole city with equal importance to all the major elements of the cityis tremendous.Public spaces were also nicelyplanned forthe social development of the city.
Yelahanka is a suburb of Bangalore in the state of Karnataka and one of the zones of BBMP (Bruhat Bengaluru Mahanagara Palike). It is older than the Bengaluru (Bangalore) city, which has now overgrown engulfing many of its neighboring villages and towns. It lies to the north of Bangalore City.
DISTANCE FROM BANGLORE MAIN CITY 17.7 KM

The town of Yelahanka has existed as early as the 12th century. Although located at the outskirts of the Bangalore City, this area is one of the fastest growing localities. This year, as predicted by many real estate experts, suburban areas are going to play a key role in the overall development of real estate in Bangalore. With the main parts of the city getting crowded, people have started to move and reside in the outer parts of the city. Realizing this paradigm shift, real estate giants have started investing in the outskirts of Bangalore.
Figure 45Banglore sector 307 plan

In Yelahanka, the wet season is warm, muggy, and overcast and the dry season is hot and partly cloudy. Over the course of the year, the temperature typically varies from 61°F to 93°F and is rarely below 55°F or above 99°F.
The city of Yelahanka had been in existence prior to the 12th century. The region was called 'Ilaipakka Naadu' during the rule of Cholas. Later, during Hoysala rein, the citycame to be known as 'Elavanka'and graduallyshifted to Yelahanka. It was also known as Elavank.
Some Temples in Yelahanka like the Venugopala Swamy Temple have remained as a testimony to its rich past. Although a Fort's remnant could not be traced, a street nearby the Venugopala Swamy Temple is still known as 'Kote Beedi' or 'Fort Street'.
 Figure 46Yelahanka city view
Yelahanka has excellent connectivity be it road, rail, and air. The road network to Yelahanka is one of the best in entire Bangalore. Yelahanka railway station is one of the oldest stations setup in Bangalore area and has railway lines connecting KR Puram and Byapanahalli in the east and Yeshwanthpur in the northwest


 Figure 48 Road connectivity diagram of Yelahanka
Figure 47 Heritage sites in Yelahanka
Figure 48 Road connectivity diagram of Yelahanka
Figure 47 Heritage sites in Yelahanka
A well planned township was developed during the early 1980s to the north of the city by the Karnataka Housing Board and is identified by several names like 'Yelahanka Upanagara', 'Yelahanka Satellite Town', 'Yelahanka New Town' or simply 'Housing Board'.
National Highway NH 44 passes through Yelahanka. The newly constructed Navayuga Devanahalli KIAL Expressway (Part of NH 44) also passes through the suburb and the northeastern fringes of Yelahanka, acting as a bypass road to avoid the Yelahanka suburb. State Highway 9 (Bangalore Hindupur) passing in the south of Yelahanka bisects the suburb into Old Town and New Town.
 Figure 49 Google map plan of Yelahanka
Theoverall planningoftheareais amixtureofradial and gridplanning. Aradial city plan is an urban planning approach, that, instead of using a traditional rectangular grid, is based on a series of concentric circles


Figure 50 Yelahanka street map
Figure 51 Radial planning
Figure 52 Grid Planning
Yelahanka zone has 11 wards. BJP dominated the BBMP elections 2010 in this zone, by capturing eight wards.
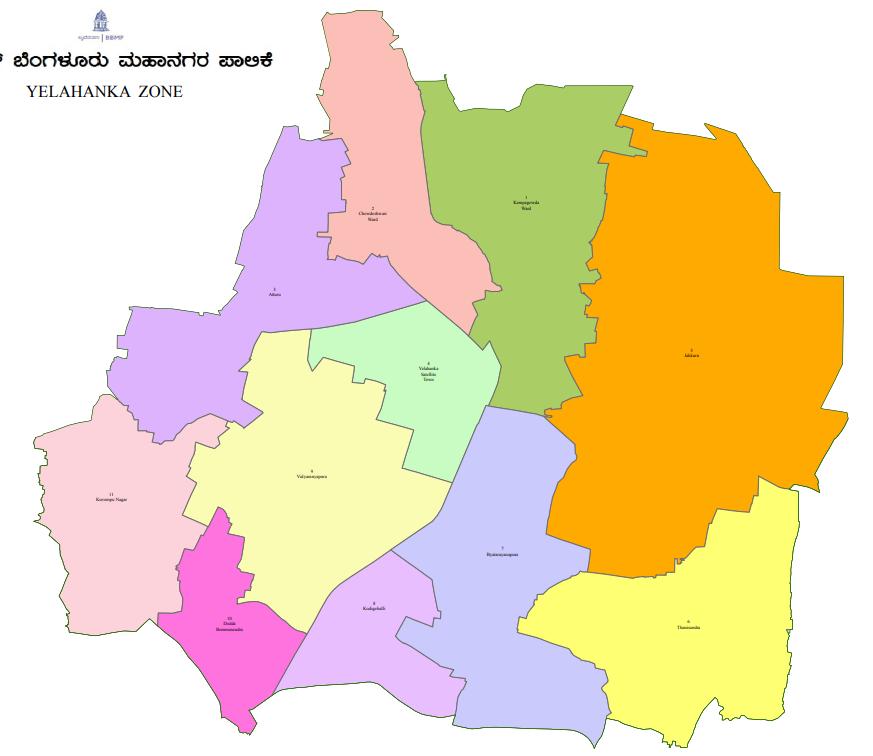
CHOWDESHWARI WARD ATTURU
YELAHANKASTELLITE TOWN JAKKURU THANISANDRA
BYATARANAYAPURA KODIGEHALLI VIDAYARANPURA DODABOMMASANDRA
KEMPEGOWDAWARD KUVEMPUNAGAR
Figure 53 Zones of YelahankaMost urban settlements are often planned in a grid layout, making adjustments for natural contours of the landscape. However, all through the history of urban planning,peoplehavebeenobsessedwiththeperfectionandsymmetrythatisembodied in a circle.
.
 Figure 54 Yelahanka Masterplan
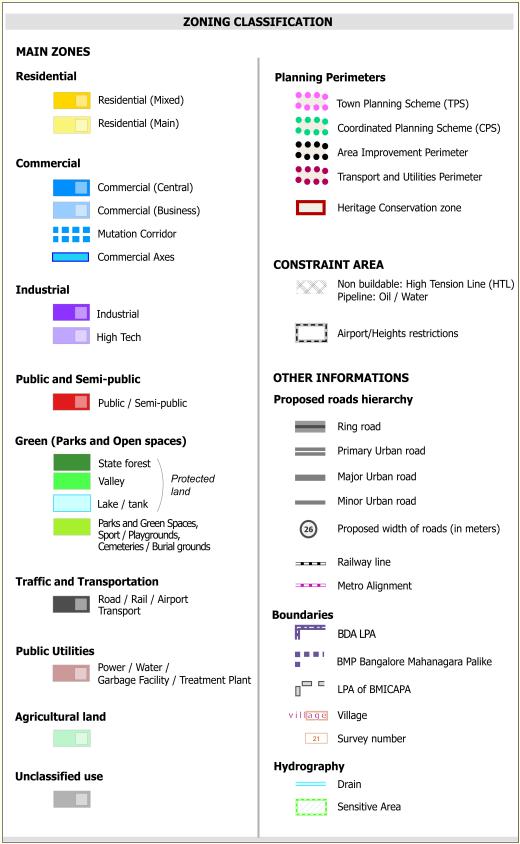
Yelahanka is a planned township of the 1960s, which is a perfect semicircle in shape, with the Doddaballapur Road acting as the diameter. Yelahanka is also the largest of such circular plans, going over a dozen roads deep.
A decade ago people who bought a piece of land in the outskirts or the suburban areas of Bangalore, are now sitting at the center of the city because of all the development and new real estate projects in the suburbs. Many people believe that North Bangalore will be the Manhattan of Bangalore City by 2020 as it has a lot of potential for future growth. After the establishment of the international airport in North Bangalore, the real estate market in here has taken off
Suburban design is the art of making sustainable living places that both thrive and adapt to people's needs for shelter, livelihood, commerce, recreation, and social order. The nature of community design suggests some predetermined intention rather than haphazard coincidence. However, it is more than the adherence to a set of rules for development or a means for implementing the political will of government. It is the merging of what we know about ourselves with what we know about our neighbours when we chose to live in proximity to one another. It is about independence and dependency. It is about architecture and landscape. It is about understanding and building on what we know the good as well as the bad. It is about creating a better place to live.
As India is on its edge of urbanization, simultaneous suburbanization is a necessity. Because of this research, the following conclusions have been developed:
1. Residential environments are more than just built in, liveable spaces. They must be equallysensitive to the unbuilt, which, in comparison to the built, plays a larger role in residents and users' comfort.
2. Physical, psychological, and perceptual factors, as well as dwellers' social needs, all affect comfort in such environments.
3. Physical aspects are influenced by climatic comfort, accessibility, and convenience that are conducive to the completion of tasks and a smooth transition from one location to another.
5. Passive and active interaction, as well as a sense of well being, are required to meet social needs.
6. The topography, climate, street network, and other skeletal elements of the region all influence the spatial pattern of a suburb. .
7. Historical theories on community design are a mix of man and nature that attempt to meet human social and environmental needs and can be used as a foundation for future developments.
Traditional Indian settlements can respond to the issues effectively, but due to rapidly growing populations, widespread negligence, and a lack of concern, contemporary examples are sometimes insufficient. Physical, perceptual, psychological, and social issues related to resident comfort must be addressed. To address such issue one should look at historical traditional settlements andsee how they compare to the fundamentals of suburban development as standardized by some renowned institutions.
Kenneth B. Hall, Jr. Gerald A. Porterfield , COMMUNITY BY DESIGN :, Donald Watson, Alan Plattus, Robert Shibley , TIME SAVER STANDARDS FOR URBAN DESIGN : Sam Bass Warner & Andrew H. Whittemore , AMERICAN URBAN FORM: Charles Correa THE NATURAL LANDSCAPE, Gilbert Bostwick Croff, MODEL SUBURBAN ARCHITECTURE:,
June Williamson ~ Urban Design Tactics for Suburban Retrofitting Futurecapetown ~ Principles for Re Designing the Suburbs for the Future
Ajay Garde 23 Jul 2008 ~ City Sense and Suburban Design: Planners' Perceptions of the Emerging Suburban Form
JOHN ARCHER 2005 ~Sennott R.S. Encyclopedia of twentieth century architecture, Vol.3 (P Z). Fitzroy Dearborn
https://smartnet.niua.org/sites/default/files/resources/eua629836_ncx.pdf https://issuu.com/thanhcn/docs/community_by_design_new_urbanism_fo
yAg&bih=521&biw=1097&hl=en#imgrc=JiARN8oXJlraWM&imgdii=0ormDyi4ou y_0M
https://books.google.com.sl/books?id=zfdRAwAAQBAJ&printsec=copyright&sour ce=gbs_pub_info_r#v=onepage&q&f=false
https://books.google.com.sl/books?id=zfdRAwAAQBAJ&printsec=copyright&sour ce=gbs_pub_info_r#v=onepage&q&f=false