
Carnegie Mellon University | MS in Sustainable design
Sanjana Nagaraj Sustainable Consultant

STORIES 02 01 03 04 05 06 07 08 09 Environmental
Simulation Building
Performance
Performance Modeling Energy + Environmental Analysis Synergy: Reviving the lost glory of Bengaluru’s waterways Ferry Terminal Circle of Nations: Cultural and community centre ReBrick Lay: A Grasshopper Plug-in Art and Design Incubation centre Architectural Internship Works
01 Environmental Performance Simulation
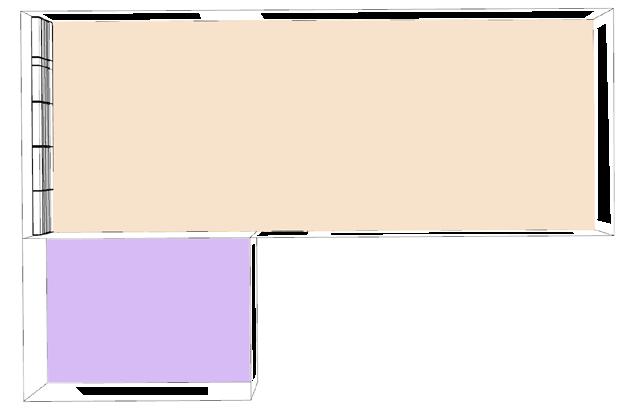
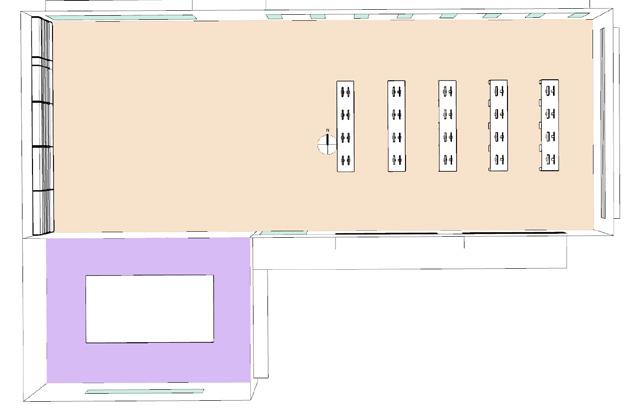
Office space
Conference space
A. Climate Analysis
A.
01. 2D + 3D Visualization - Climatic data
Carnegie Mellon University, Fall 2021
“Design of a boat is optimized for sail-driven locomotion. Buildings should be able to sail using free energy of wind, air, sun and internal heat sources to temper the indoor environment”, Brendon Lewitt. Based on this viewpoint, EPS course outlines the fundamental knowledge in building physics in relation to a range of environmentally responsive building design principles and computational approaches for increased resiliency for human habitability with minimal reliance on mechanical systems.
Instructor: Prof. Ömer T. Karagüzel
Softwares used: Rhinocerous, Grasshopper, Climate Studio, Lady Bug, Energy Plus
A. 02. Solar Photovoltaic Design
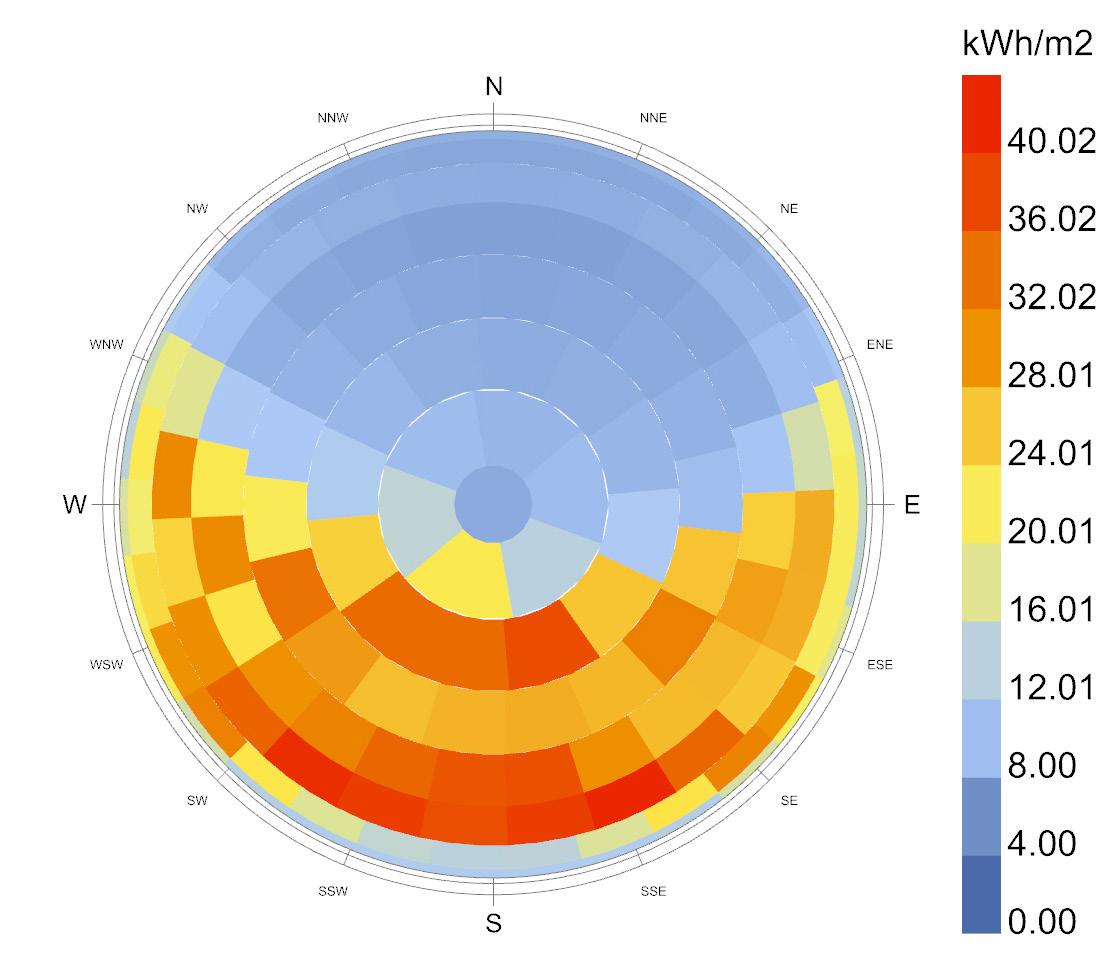
The figure shows the total radiation for the sky dome. The surface PV design should be normal to the maximum solar radiation point.From the calculation of components, the angle between the pv panel and y-axis is 41 degrees and between x-axis is 295 degrees.
B. Solar Radiation Studies
B. 01. Shadow analysis through all seasons:
A. 03. Wind Rose and Wind speed analysis
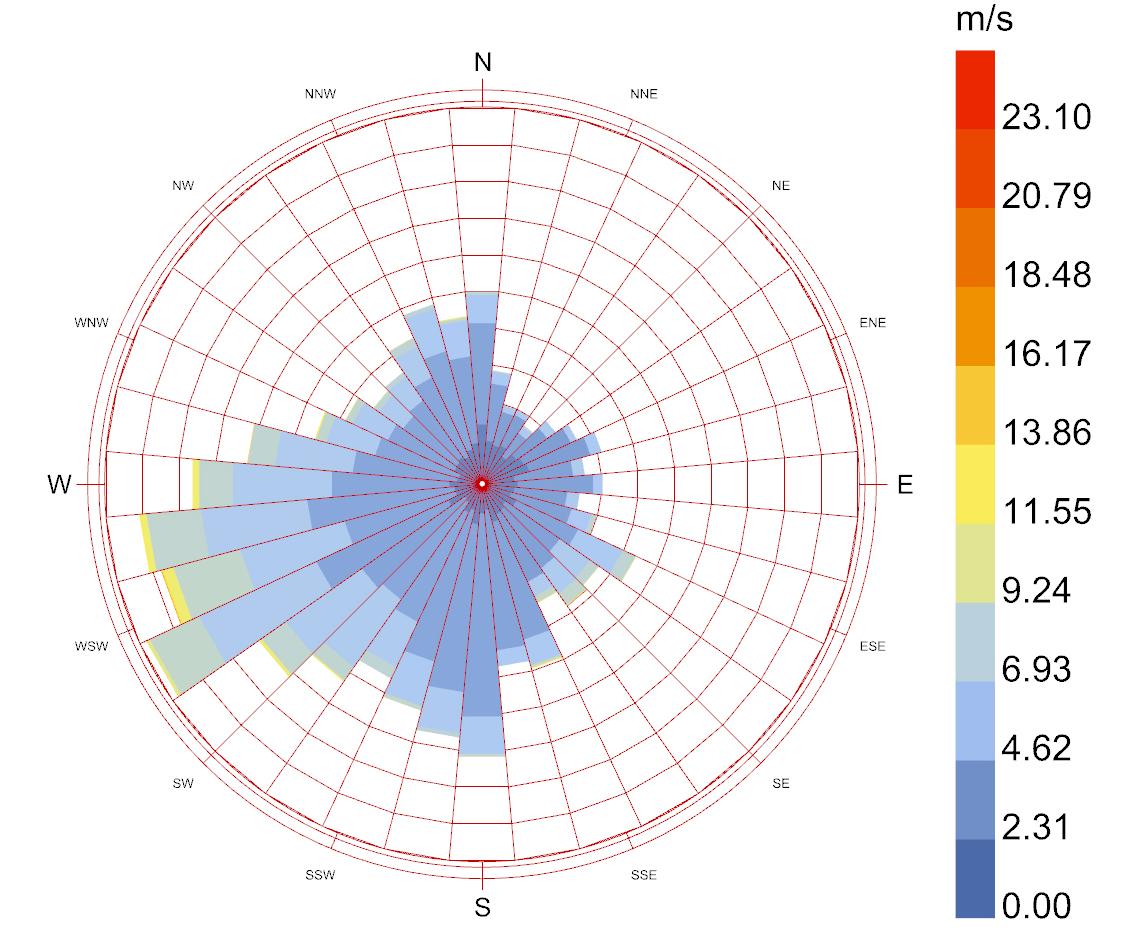
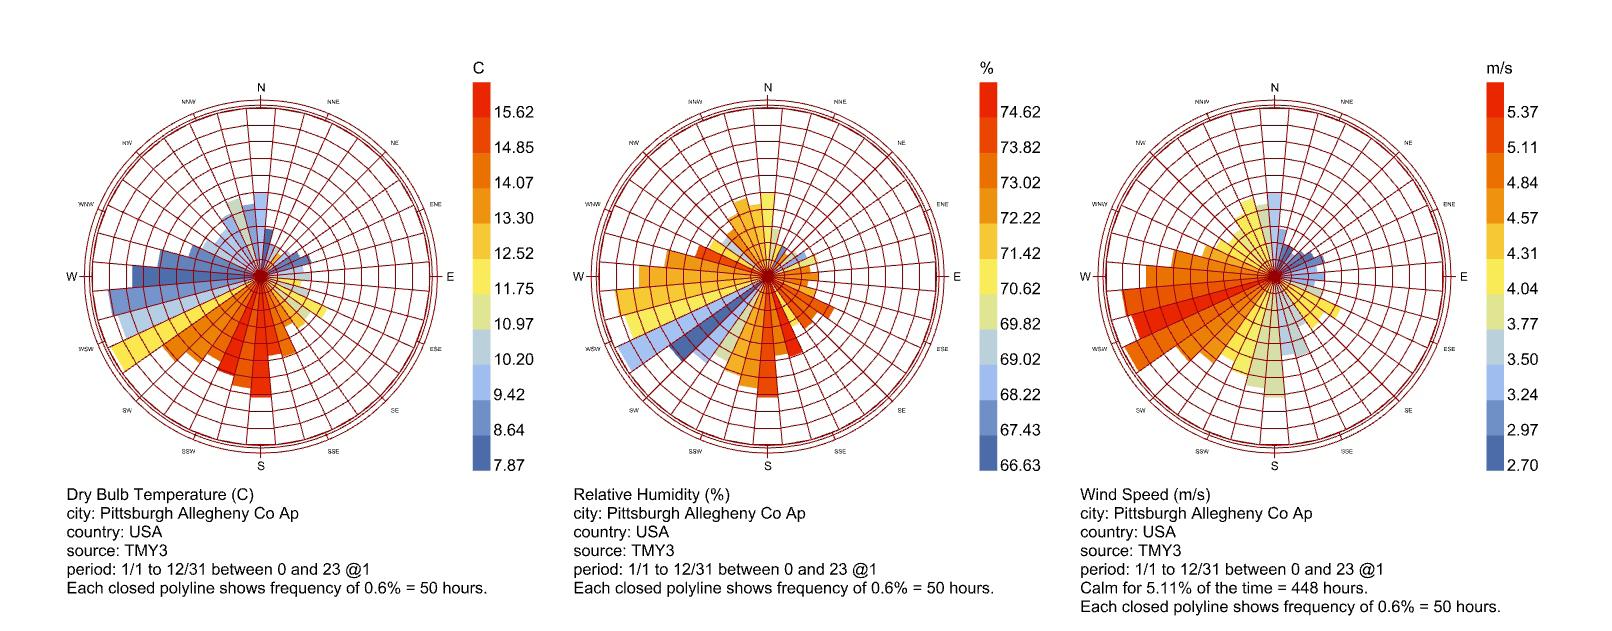
Wind prevails almost throughout the year in Pittsburgh.Although the winds coming from the West and South-West have greater velocity, upto 5.37 m/s, “calm winds” are experienced throughout the year from all the directions.South-West is the predominant wind direction observed annually.
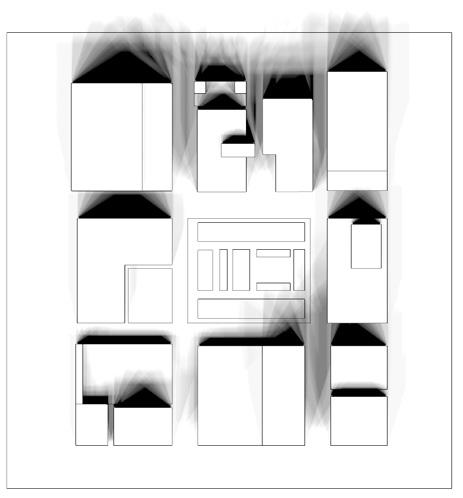
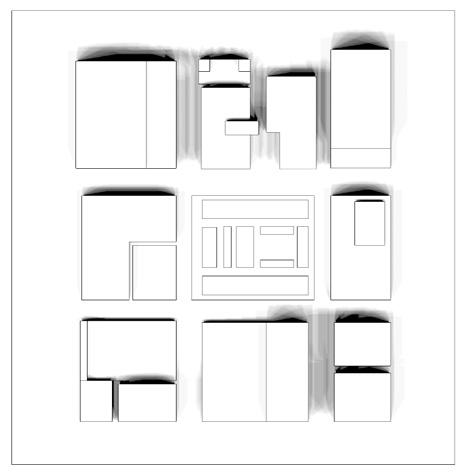
The butterfly shadow diagrams for spring and fall equinoxes are almost identical. This highlights the criticality of these two dates and how they clearly mark the change in seasons from winter to summer and vice versa.
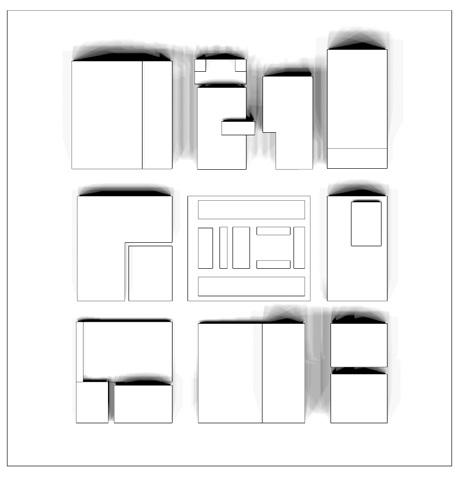
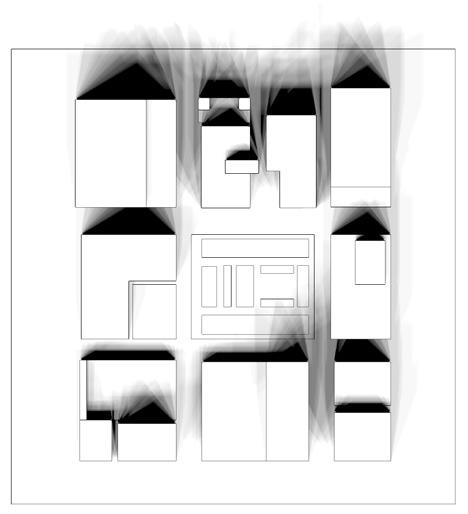
The highest and lowest sun angles are observed around noon in the summer, and the early mornings and late evenings in the winters.
Site
Fall equinox Summer solistice Winter solistice Spring equinox
Site Site Total radiation Sky Dome Wind rose diagram
Outcome
B. 02. Solar energy density - Effect of building orientation :
Outcome :





Base case: Iteration 01: Iteration 02:


C. Visible Radiation Studies


C. 01. Visual Acuity Evaluation (Baseline model):

C. 02. Visual Comfort Evaluation - Annual Glare:
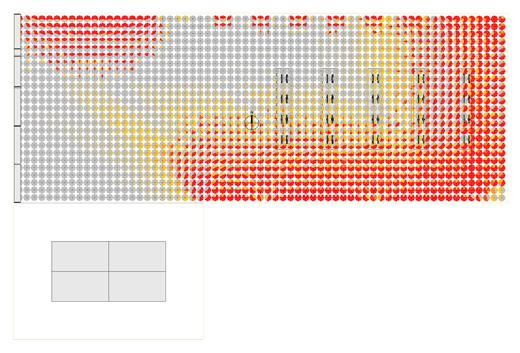
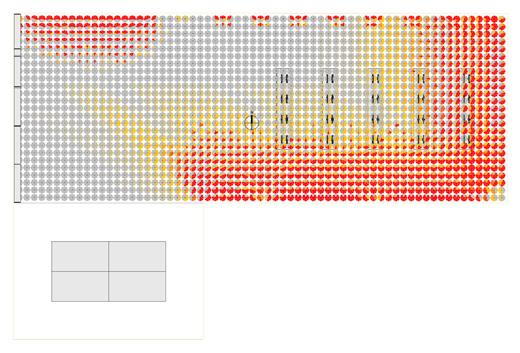
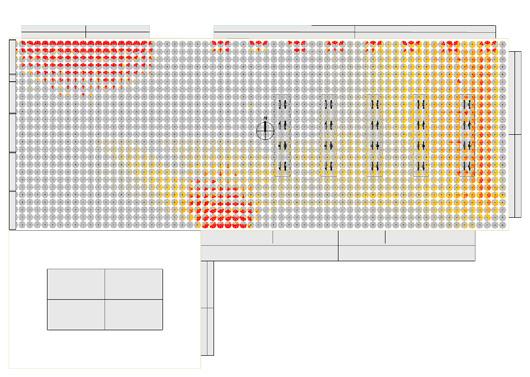

D. Thermal Radiation Studies
D. 01. Spatial Thermal Comfort Analysis:
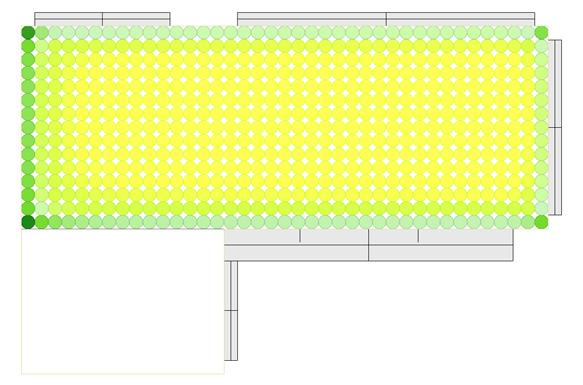


From the above results, it is evident that the building receives

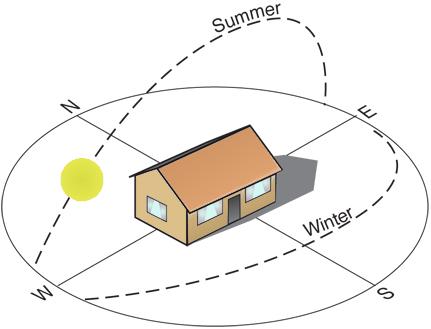
greater solar radiation when orientated in the direction of East-West axis. The total solar radiation `received in the winter is much more than the radiation received in the summer.
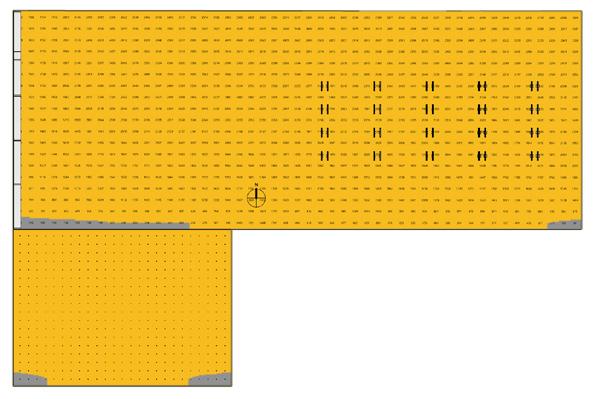
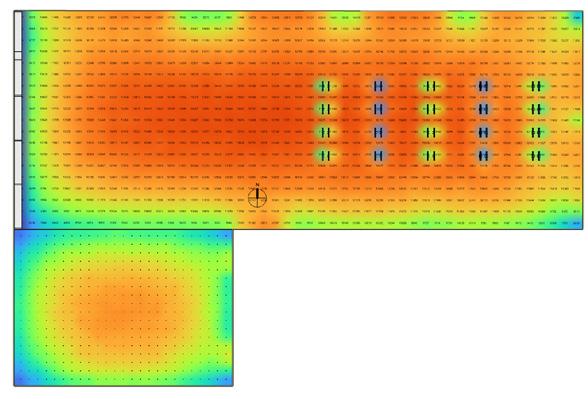
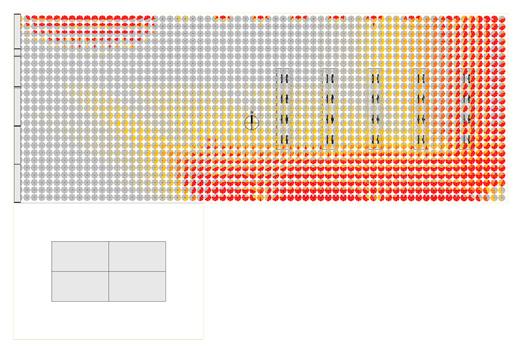

:
The daylight received through the northern glazing system

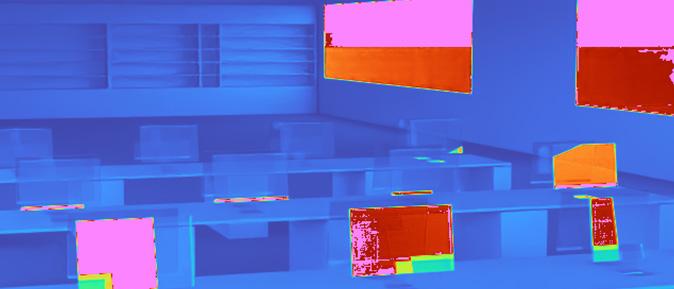
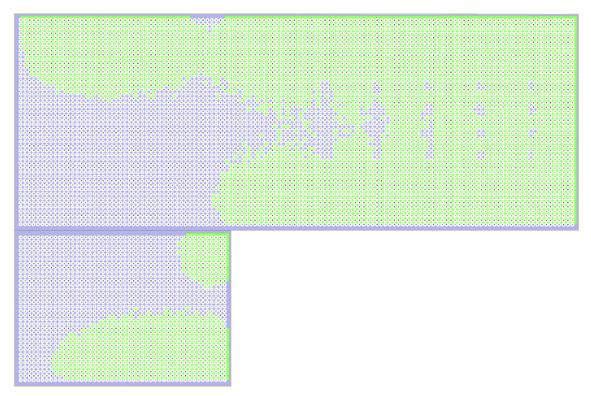
is a positive strategy to increase the daylight autonomy in space without increasing the glare. Thus the strategy which had to be adopted to reduce the ASE value from 98% to the LEED v4.1 acceptable limit, we had to tackle the glare from the southern glazing.
D. 02. High Performance Building materials

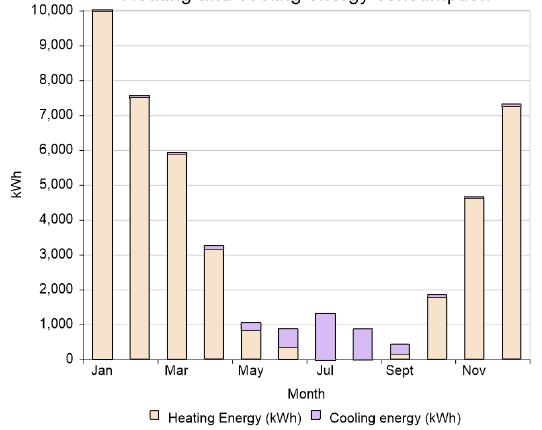
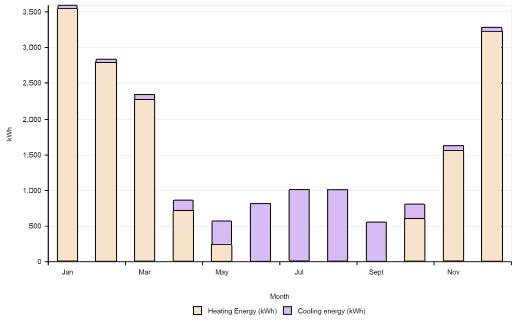
The result demonstrates reduction in the highest energy consumption from 10000 kWh to 3300 kWh. This implies that the improvement in the building envelope by choosing high performance building materials certainly helps in reducing energy consumption.
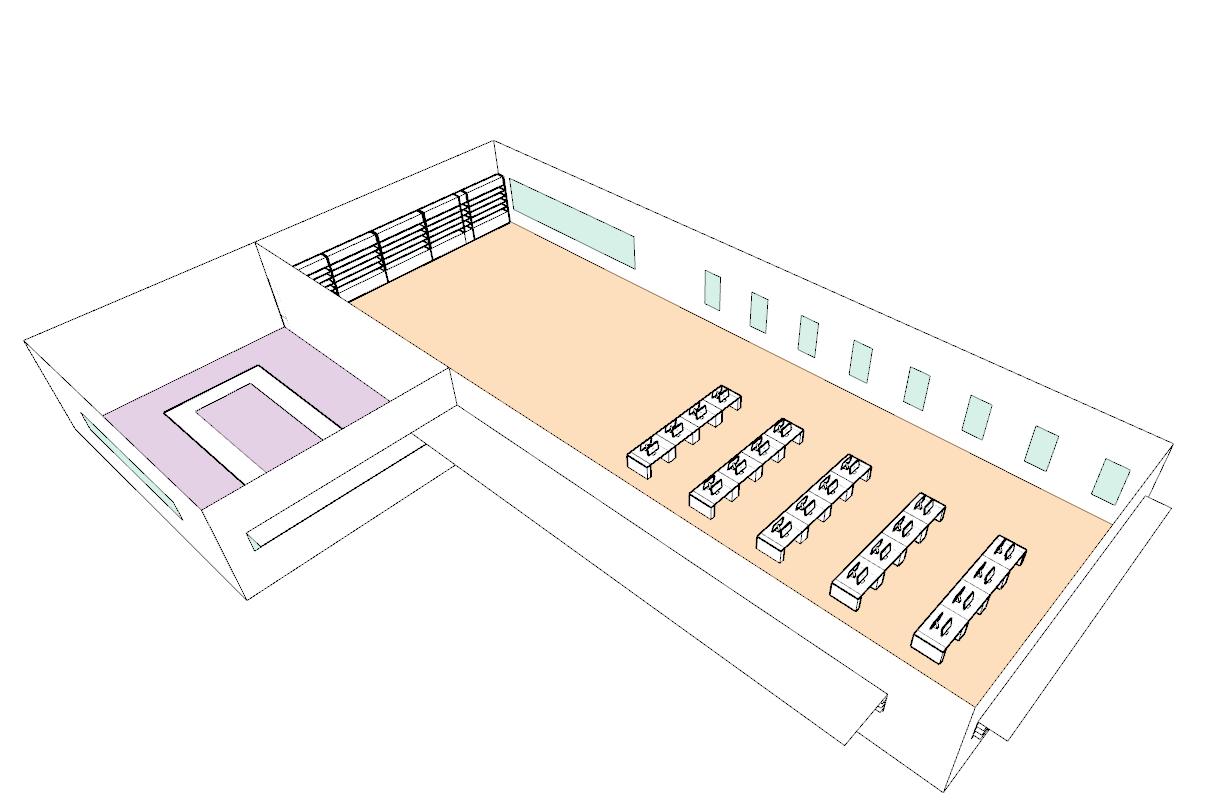
Conference space
Office space
Outcome
Outcome : Annual solar energy density 01 Annual solar energy density 02 Annual solar energy density 03
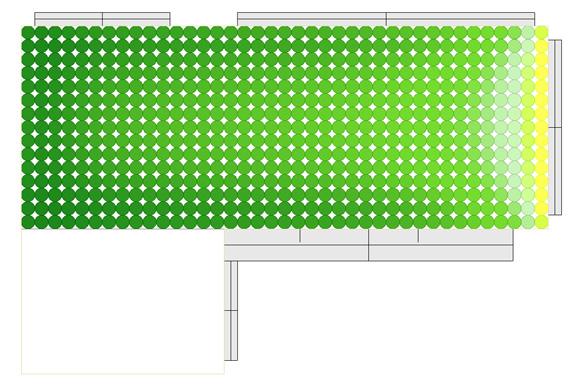
sDA - 99.9% Daylight factor Mean Radiant Temperature in the Office space during Coldest month a) HVAC system Off, b) HVAC system On, and Hottest month c) HVAC system off and, d) HVAC system off Illuminance ASE - 98% Baseline
Model with shading devices and fins: sDG - 17.76% Perceptible glare (0.35 < DGP < 0.38) Perceptible glare (0.35 < DGP < 0.38) Disturbing glare (0.38 < DGP < 0.45) Disturbing glare (0.38 < DGP < 0.45) Intolerable glare (DGP < 0.45) Intolerable glare (DGP < 0.45) sDG - 3.52% a. a. c. b. b. d.
heating and cooling energy consumption a) in Baseline model, b) after the implementation of high performance building materials
model:
Monthly
02 Building Performance Modeling
Carnegie Mellon University, Spring 2022
BPM Course introduced fundamentals and computational methods in building performance modeling. Topics included:
• Modeling and design principles for environmentally responsive buildings
• Integration of performance simulation in CAD.
• Introduction to the Building Information Model (BIM)
A. Climate Analysis
Team: Samantha Su | Sanjana Nagaraj | Xin Zhou | Zehan Zhang
My role: Developing scripts and models, analyzing results and designing for optimization.
Instructor: Wei Liang
Softwares used: Climate Consultant, eQuest, IESVE, Design Builder, EnergyPlus
B. Energy Simulation
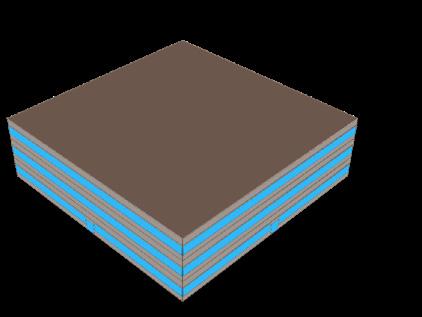

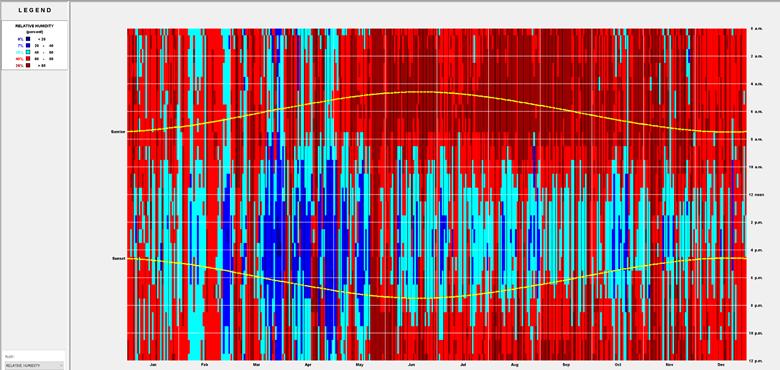
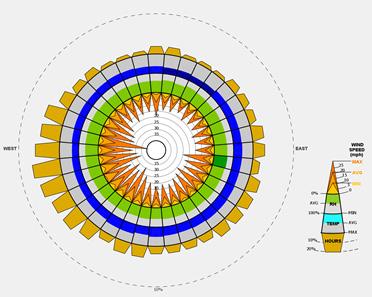
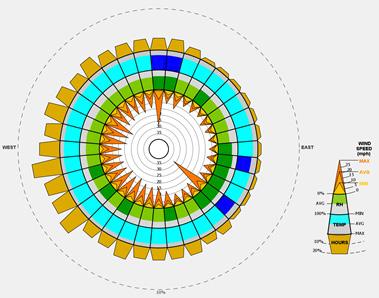
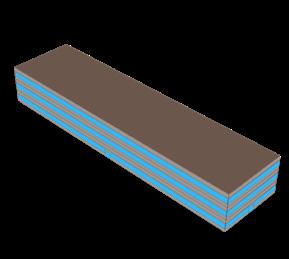
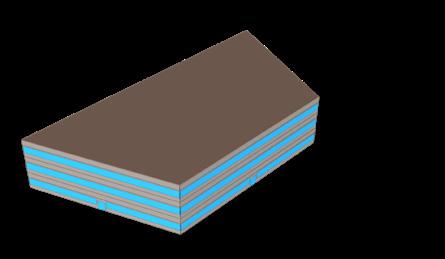
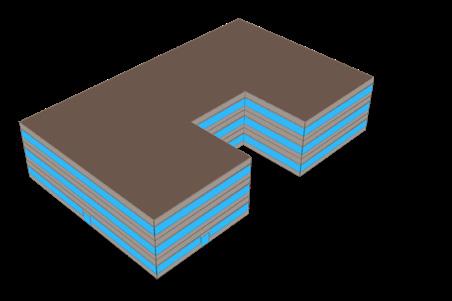
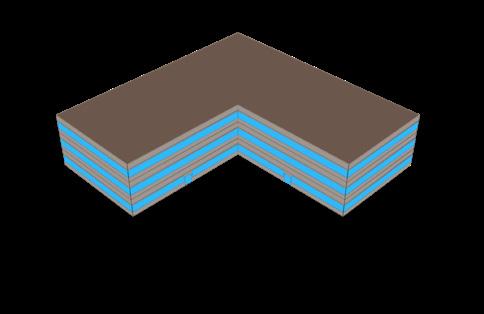

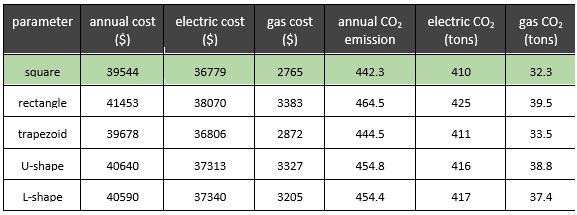


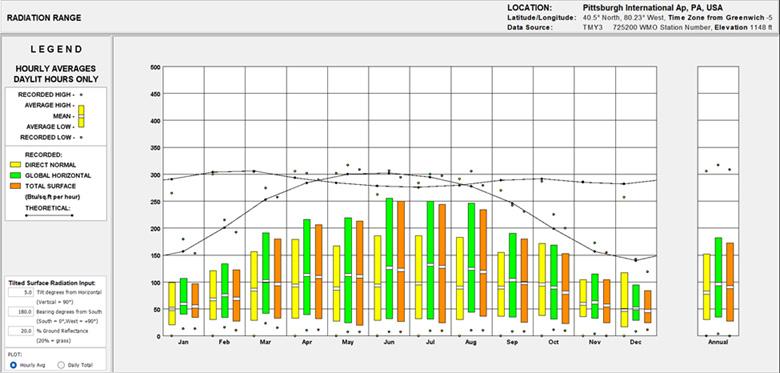

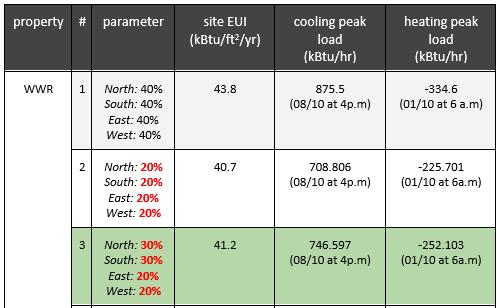
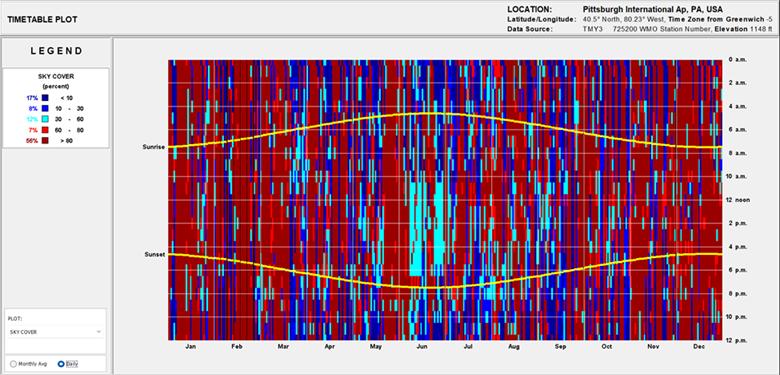

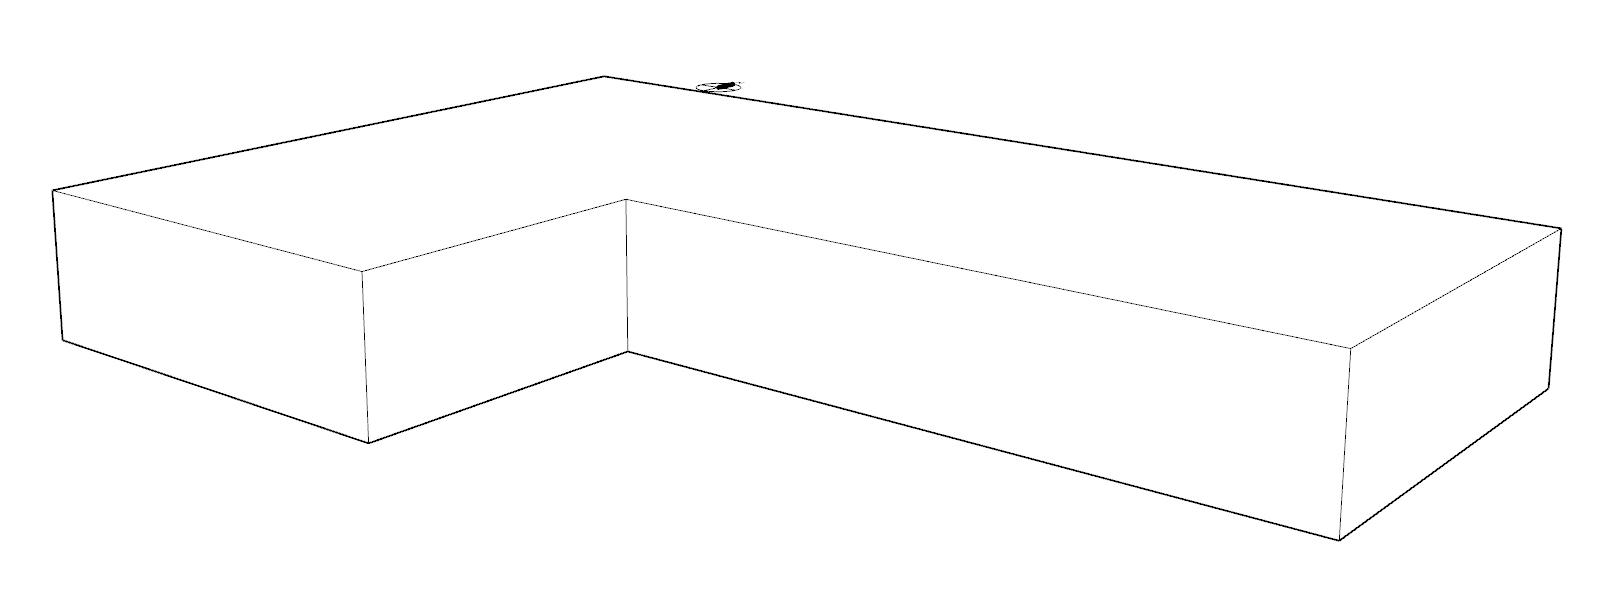
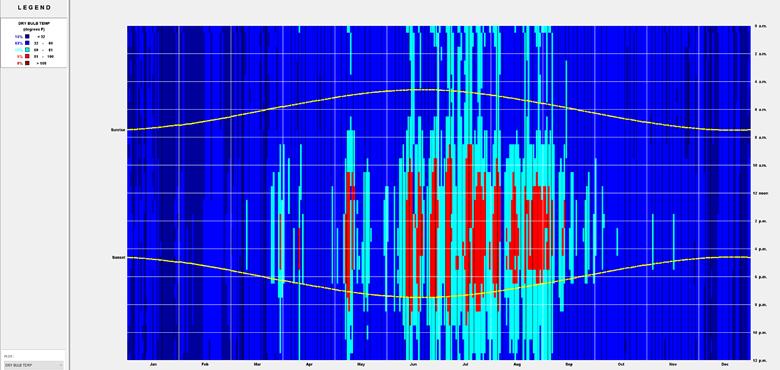
Daily Dry-bulb Temperature in Pittsburgh Energy consumption, cost and carbon emissions for baseline model Energy consumption, cost and carbon emissions for WWR (Iteration 01) Detailed information of the Optimized model 4. U-shape 5. L-shape Daily relative humidity in Pittsburgh Daily Cloud Cover in Pittsburgh a. b.

C. Energy Modeling with IESVE
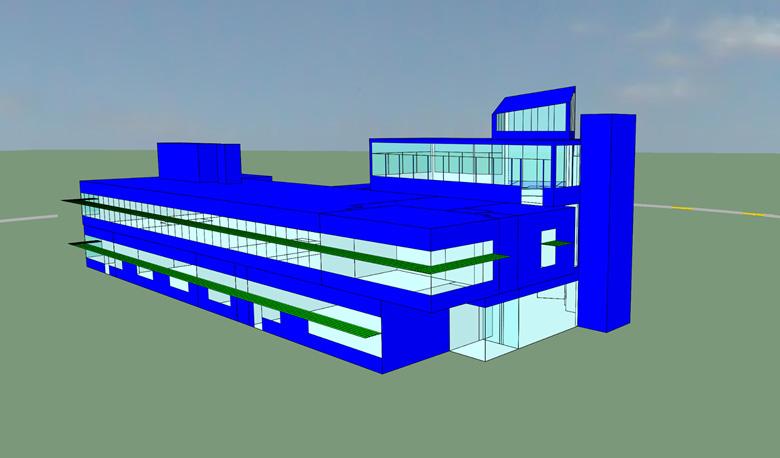
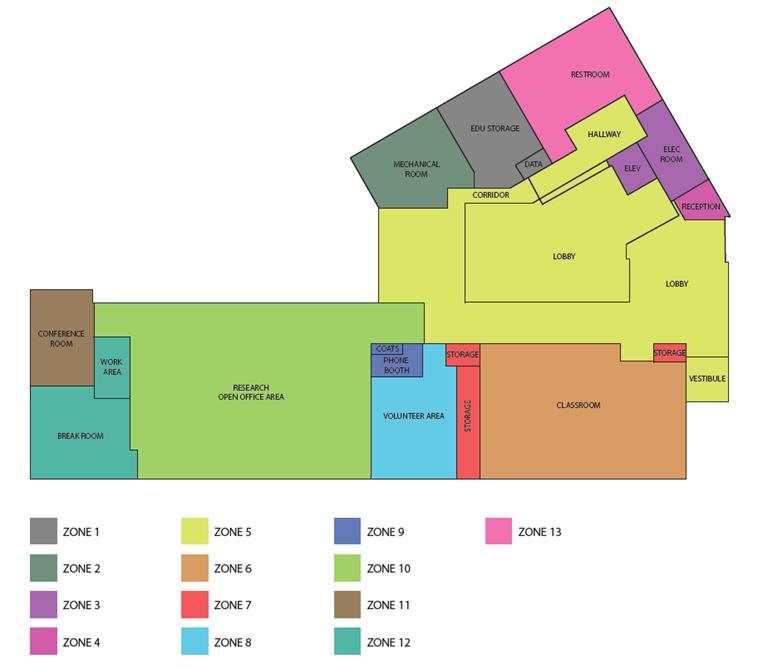
The Center for Sustainable Landscapes (CSL) is a 24,350 square foot education, research and administration facility located in One Schenley Park Drive, Pittsburgh, PA. This sustainable building consists of 3 stories & green roof that is nested into the hillside on a 2.9-acre remediated brownfield. Built to achieve net-zero energy consumption, the facility generates all of its own renewable energy and treats all stormwater and blackwater captured The climate data used is extracted from the TMY3 format from the EnergyPlus website and applied into IES-VE. In addition, the year-round sun angle calculation and sun shading analysis is conducted through IES-VE SunCast internal software.


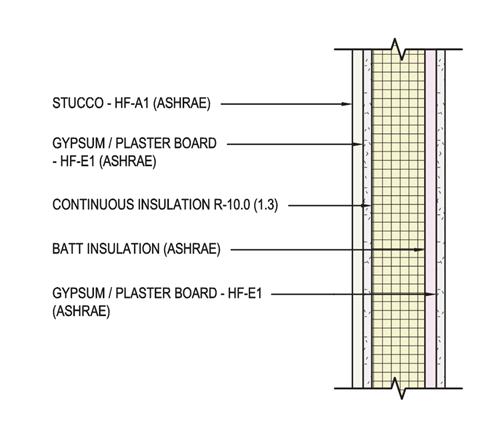
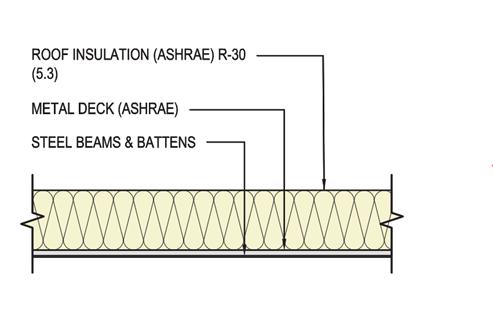
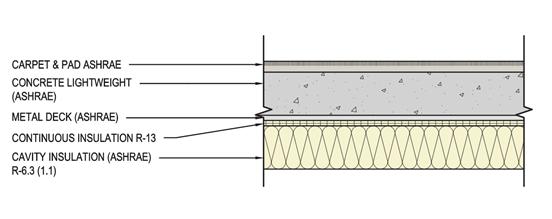
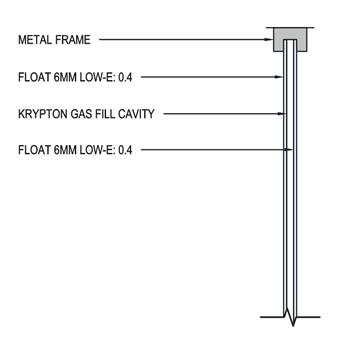
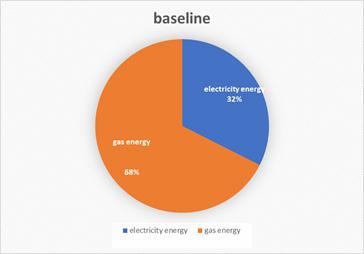
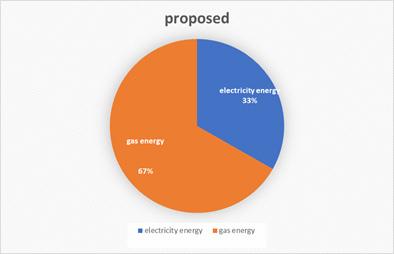

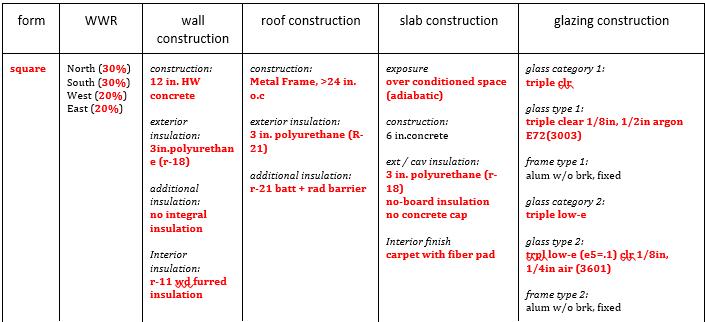
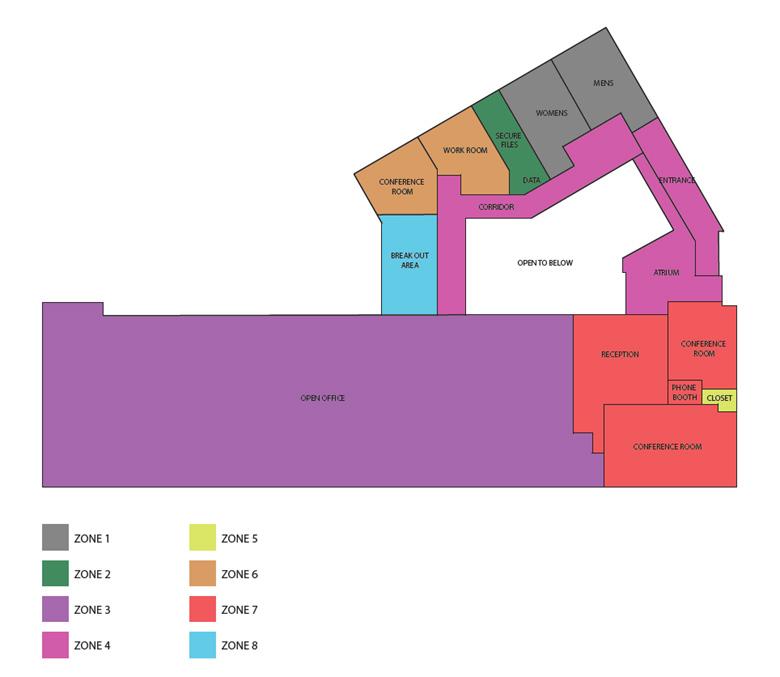
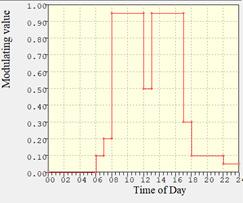
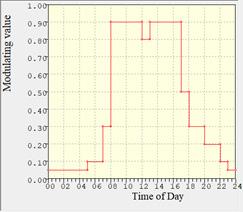
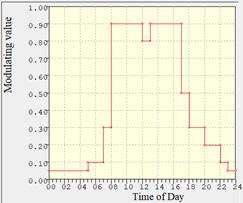
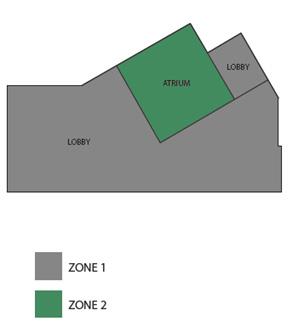
3D Model of CSL building in IES-VE Modulating value for occupancy Modulating value for lighting Modulating value for equipment Thermal zoning plan for second floor Thermal zoning plan for third floor Thermal zoning plan for first floor Monthly EUI, energy use, CO2 emission - Baseline model Comparitive analysis between Baseline and Final proposed model Slab Detail Glazing Detail Roof Detail Iteration 02: Envelope Geometric Properties Comparative Analysis of Annual Cumulative Energy Use by Fuel Source Iteration 01: WWR Change External Wall Detail
03 Energy + Environmental Analysis
Carnegie Mellon University, Fall 2021
Instructor: Prof. Vivian Loftness
Softwares used: Climate Consultant, remRate
B. CONSTRUCTED ASSEMBLIES
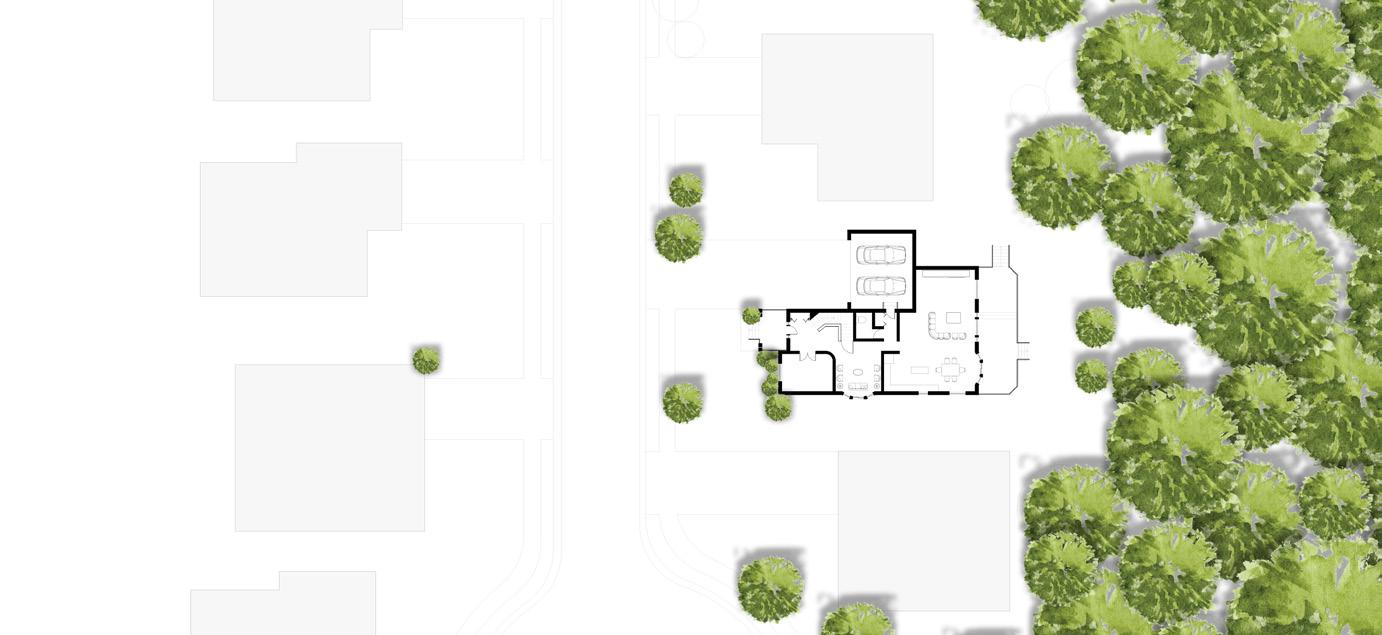
A. CALCULATION OF R AND U - VALUES FOR CONSTRUCTED ASSEMBLIES OF AN EXISTING BUILDING
ROOF ASSEMBLY
WALL ASSEMBLY
B. PEAK AND ANNUAL LOAD CALCULATION
SLAB ASSEMBLY
CONSTRUCTED ASSEMBLIES DETAIL 01 DETAIL 02 ASBESTOS CEMENT SHINGLES SELF-ADHESIVE UNDERLAYMENT VENTILATION BAFFLE 1” RIGID FOAM CLOSURE FASCIA 12” FIBERGLASST RIGID FOAM FIBERGLASS BATT INSULATION MASONRY VENEER 1” AIRSPACE FIBERGLASS BATT INSULATION PLYWOOD SHEATHING 1” AIRSPACE MASONRY VENEER VENEER TIE GYPSUM BOARD WITH LATEX PAINT SL.NOCOMPONENT R-VALUE(IP) 1INSIDE AIR FILM 0.68 2GYPSUM DRY WALL 0.32 312" FIBERGLASS INSULATION 4 4RIGID FOAM 3.8 5VENTILATION BAFFLE 4.2 6WOODEN RAFTERS 6.82 7ASBESTOS CEMENT SHINGLES0.21 8OUTSIDE AIR FILM 0.17 R-VALUE CALCULATION FOR ROOFING SL.NOCOMPONENT R-VALUE(IP) 1INSIDE AIR FILM 0.68 2GYPSUM BOARD 0.32 3WOOD STUDS 6.82 4FIBERGLASS BATT INSULATION3.2 5PLYWOOD SHEATHING 0.62 61" AIRSPACE 0.68 7MASONRY VENEER 0.79 8OUTSIDE AIR FILM 0.17 R-VALUE CALCULATION FOR WALL R-VALUE =(0.68+0.32+4+3.8+4.2+6.82+0.21+0.17) 0.2 + (0.68+0.32+4+3.8+ 6.82.2+6.82+0.21+0.17) 0.8 =(13.38*0.2) +(16.2*0.8) =2.676 + 12.96 =15.636 U-VALUE =1/15.64 =0.064 R-VALUE =(0.68+0.32+3.2+0.62+0.68+0.79+0.17) 0.2 + (0.68+0.32+6.82+0.6 2+0.68+0.79+0.17) 0.8 =(6.46*0.2) +(10.08*0.8) =1.292 + 8.064 =9.356 U-VALUE =1/9.356 =0.1068
B.
FOOTING ASSEMBLY
DOOR COMPONENT WINDOW COMPONENT
DETAIL 03 DETAIL 04 FIBERGLASS BATT INSULATION MASONRY VENEER GYPSUM BOARD WITH LATEX PAINT 1” AIRSPACE STEEL LINTEL WINDOW FRAME WINDOW SINGLE GLAZING SILL TIE WINDOW BOTTOM RAIL FIBERGLASS BATT INSULATION GYPSUM WALL BOARD WITH LATEX PAINT 1” AIRSPACE MASONRY VENEER VENEER TIE DOOR FRAME SOLID CORE FLUSH GLASS SL.NOCOMPONENT R-VALUE(IP) 1INSIDE AIR FILM 0.68 2ALUMINIUM FRAME 0.26 3TOP AND BOTTOM RAILS 0.13 3SINGLE GAZING 0.91 4OUTSIDE AIR FILM 0.17 R-VALUE CALCULATION FOR WINDOW SL.NOCOMPONENT R-VALUE(IP) 1INSIDE AIR FILM 0.68 2LUMBER FRAME 4.38 3SOLID CORE FLUSH 2.17 4SINGLE GAZING 0.91 5OUTSIDE AIR FILM 0.17 R-VALUE CALCULATION FOR DOOR R-VALUE =0.68+0.26+0.13+0.91+0.17 =2.15 U-VALUE =1/2.15 =0.456 R-VALUE =0.68+4.38+2.17+0.91+0.17 =8.31 U-VALUE =1/8.31 =0.12 B. CONSTRUCTED ASSEMBLIES DETAIL 03 DETAIL 04 FIBERGLASS BATT INSULATION MASONRY VENEER GYPSUM BOARD WITH LATEX PAINT 1” AIRSPACE STEEL LINTEL WINDOW FRAME WINDOW SINGLE GLAZING SILL TIE WINDOW BOTTOM RAIL FIBERGLASS BATT INSULATION GYPSUM WALL BOARD WITH LATEX PAINT 1” AIRSPACE MASONRY VENEER VENEER TIE DOOR FRAME SOLID CORE FLUSH GLASS SL.NOCOMPONENT R-VALUE(IP) 1INSIDE AIR FILM 0.68 2ALUMINIUM FRAME 0.26 3TOP AND BOTTOM RAILS 0.13 3SINGLE GAZING 0.91 4OUTSIDE AIR FILM 0.17 R-VALUE CALCULATION FOR WINDOW SL.NOCOMPONENT R-VALUE(IP) 1INSIDE AIR FILM 0.68 2LUMBER FRAME 4.38 3SOLID CORE FLUSH 2.17 4SINGLE GAZING 0.91 5OUTSIDE AIR FILM 0.17 R-VALUE CALCULATION FOR DOOR R-VALUE =0.68+0.26+0.13+0.91+0.17 =2.15 U-VALUE =1/2.15 =0.456 R-VALUE =0.68+4.38+2.17+0.91+0.17 =8.31 U-VALUE =1/8.31 =0.12 B. CONSTRUCTED ASSEMBLIES DETAIL 03 DETAIL 04 FIBERGLASS BATT INSULATION MASONRY VENEER GYPSUM BOARD WITH LATEX PAINT 1” AIRSPACE STEEL LINTEL WINDOW FRAME WINDOW SINGLE GLAZING SILL TIE WINDOW BOTTOM RAIL FIBERGLASS BATT INSULATION GYPSUM WALL BOARD WITH LATEX PAINT 1” AIRSPACE MASONRY VENEER VENEER TIE DOOR FRAME SOLID CORE FLUSH GLASS SL.NOCOMPONENT R-VALUE(IP) 1INSIDE AIR FILM 0.68 2ALUMINIUM FRAME 0.26 3TOP AND BOTTOM RAILS 0.13 3SINGLE GAZING 0.91 4OUTSIDE AIR FILM 0.17 R-VALUE CALCULATION FOR WINDOW SL.NOCOMPONENT R-VALUE(IP) 1INSIDE AIR FILM 0.68 2LUMBER FRAME 4.38 3SOLID CORE FLUSH 2.17 4SINGLE GAZING 0.91 5OUTSIDE AIR FILM 0.17 R-VALUE CALCULATION FOR DOOR R-VALUE =0.68+0.26+0.13+0.91+0.17 =2.15 U-VALUE =1/2.15 =0.456 R-VALUE =0.68+4.38+2.17+0.91+0.17 =8.31 U-VALUE =1/8.31 =0.12 B. CONSTRUCTED ASSEMBLIES DETAIL 03 DETAIL 04 FIBERGLASS BATT INSULATION MASONRY VENEER GYPSUM BOARD WITH LATEX PAINT 1” AIRSPACE STEEL LINTEL WINDOW FRAME WINDOW SINGLE GLAZING SILL TIE WINDOW BOTTOM RAIL FIBERGLASS BATT INSULATION GYPSUM WALL BOARD WITH LATEX PAINT 1” AIRSPACE MASONRY VENEER VENEER TIE DOOR FRAME SOLID CORE FLUSH GLASS SL.NOCOMPONENT R-VALUE(IP) 1INSIDE AIR FILM 0.68 2ALUMINIUM FRAME 0.26 3TOP AND BOTTOM RAILS 0.13 3SINGLE GAZING 0.91 4OUTSIDE AIR FILM 0.17 R-VALUE CALCULATION FOR WINDOW SL.NOCOMPONENT R-VALUE(IP) 1INSIDE AIR FILM 0.68 2LUMBER FRAME 4.38 3SOLID CORE FLUSH 2.17 4SINGLE GAZING 0.91 5OUTSIDE AIR FILM 0.17 R-VALUE CALCULATION FOR DOOR R-VALUE =0.68+0.26+0.13+0.91+0.17 =2.15 U-VALUE =1/2.15 =0.456 R-VALUE =0.68+4.38+2.17+0.91+0.17 =8.31 U-VALUE =1/8.31 =0.12 B. CONSTRUCTED ASSEMBLIES DETAIL 05 DETAIL 06 FIBERGLASS BATT INSULATION GYPSUM BOARD WITH LATEX PAINT AIRSPACE MASONRY VENEER FLOOR FINISH GYPCRETE FIBERGLASS BATT INSULATION CONCRETE SLAB 2” RIGID EPS INSULATION WOOD FILLER GROUND GYPSUM BOARD WITH LATEX PAINT FIBERGLASS BATT INSULATION 2” RIGID EPS INSULATION CONCRETE WALL DAMP PROOFING CONCRETE SLAB CONCRETE FOOTING COARSE GRAVEL GRANULAR CAPPILARY BREAK AND DRAINAGE PAD SL.NOCOMPONENT R-VALUE(IP) 1INSIDE AIR FILM 0.68 2 FLOOR FINISH (CARPET WITH FIBROUS PAD 2.08 3GYPCRETE 0.2 4HARDWOOD 0.9 5WOOD STUDS 6.82 6FIBERGLASS BATT INSULATION3.2 7PLYWOOD SHEATHING 0.62 8OUTSIDE AIR FILM 0.17 R-VALUE CALCULATION FOR FLOOR SL.NOCOMPONENT R-VALUE(IP) 1INSIDE AIR FILM 0.68 2 GYPSUM BOARD WITH LATEX PAINT 0.32 3FIBERGLASS BATT INSULATION3.2 42" RIGID EPS INSULATION 4.8 5CONCRETE WALL 0.9 6OUTSIDE AIR FILM 0.17 R-VALUE CALCULATION FOR FOOTING R-VALUE =(0.68+2.08+0.2+0.9+3.2+0.62+0.17) 0.2 + (0.68+2.08+0.2+0.9+6.82+0.62+0.17) 0.8 =(7.85*0.2) +(11.47*0.8) =1.57 + 9.176 =10.746 U-VALUE =1/10.746 =0.093 R-VALUE =0.68+0.32+3.2+4.8+0.9+0.17 =10.07 U-VALUE =1/10.07 =0.099 B. CONSTRUCTED ASSEMBLIES DETAIL 05 DETAIL 06 FIBERGLASS BATT INSULATION GYPSUM BOARD WITH LATEX PAINT AIRSPACE MASONRY VENEER FLOOR FINISH GYPCRETE FIBERGLASS BATT INSULATION CONCRETE SLAB 2” RIGID EPS INSULATION WOOD FILLER GROUND GYPSUM BOARD WITH LATEX PAINT FIBERGLASS BATT INSULATION 2” RIGID EPS INSULATION CONCRETE WALL DAMP PROOFING CONCRETE SLAB CONCRETE FOOTING COARSE GRAVEL GRANULAR CAPPILARY BREAK AND DRAINAGE PAD SL.NOCOMPONENT R-VALUE(IP) 1INSIDE AIR FILM 0.68 2 FLOOR FINISH (CARPET WITH FIBROUS PAD 2.08 3GYPCRETE 0.2 4HARDWOOD 0.9 5WOOD STUDS 6.82 6FIBERGLASS BATT INSULATION3.2 7PLYWOOD SHEATHING 0.62 8OUTSIDE AIR FILM 0.17 R-VALUE CALCULATION FOR FLOOR SL.NOCOMPONENT R-VALUE(IP) 1INSIDE AIR FILM 0.68 2 GYPSUM BOARD WITH LATEX PAINT 0.32 3FIBERGLASS BATT INSULATION3.2 42" RIGID EPS INSULATION 4.8 5CONCRETE WALL 0.9 6OUTSIDE AIR FILM 0.17 R-VALUE CALCULATION FOR FOOTING R-VALUE =(0.68+2.08+0.2+0.9+3.2+0.62+0.17) 0.2 + (0.68+2.08+0.2+0.9+6.82+0.62+0.17) 0.8 =(7.85*0.2) +(11.47*0.8) =1.57 + 9.176 =10.746 U-VALUE =1/10.746 =0.093 R-VALUE =0.68+0.32+3.2+4.8+0.9+0.17 =10.07 U-VALUE =1/10.07 =0.099 Component U-value (Btu/hrft2 F) Total area (ft2) Heat loss co-efficient (UA = Btu/hr F) 0.111098 120.78 0.11270 127 Windows 0.45200 90 0.12 21 2.52 0.43 21 9.03 Roof 0.0642100 134.4 0.0934200 390.6 Heated volume Heat capacityHeat loss co-efficient 13,6000.018 146.88 BTU/hr 76590.8 BTU 127348972 BTU/sqft. 30,321.18 (Annual heat loss)/ area in sqft 1021.21 * 24 * 5196 (127348972/4200 ) Infiltration HEATING ENERGY INDEX Total UA*T(Design Indoor-Design Outdoor) 1021.21 * {65 - (-10)} Total UA * 24hrs * Annual Degree Days HDD BUILDING HEATING ENERGY PERFORMANCE (kWh/m2/yr) 95.96 Floor PEAK HEAT LOSS ANNUAL HEAT LOSS 1. Roof Air changes per hour 0.6 1021.21 (above grade, over vented crawl spaces U, over heated spaces 1/2 U) 1.Floor (heated volume of the building x number of air changes x the heat capacity of air 0.018 Btu ft3 F) TOTAL HEAT LOSS CO-EFFICIENT (total UA) Btu/hr F) 3. Glass door Detail # 1. with veneer siding 2. with masonry siding TABLE A: Peak and Annual Loads Simplified calculation of building Heat Loss Coefficient 1. Single glazed window 1. Wooden entrance door Walls Door







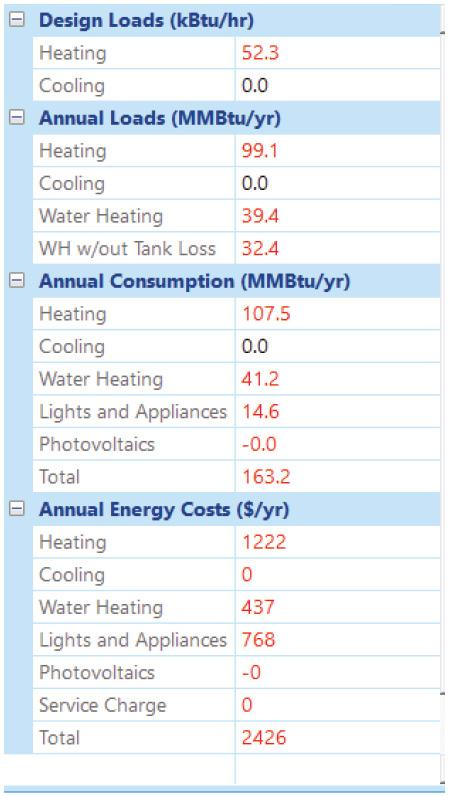
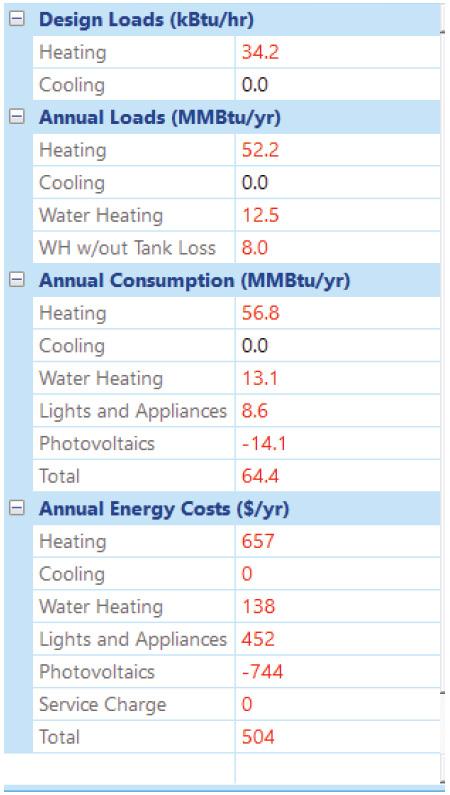
According to the energy efficiency requirements, the house does not qualify to be designated as an EPA ENERGY STAR Version 3.1 Certified Home.
According to the International Energy Conservation Code, 2015 for climate zone of 5A, this house does not meet the annual energy cost requirements of Section 405 of 2015 IECC.
According to the HERS PERFORMANCE Energy rating certificate, this house is 6% more efficient than a standard new home.
C. HEAT LOSS SOURCES -
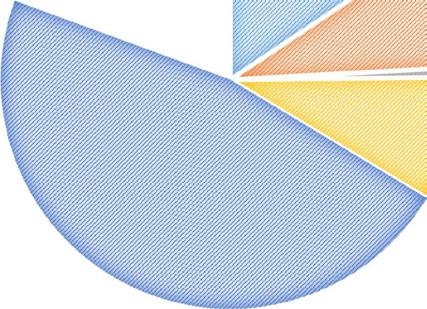
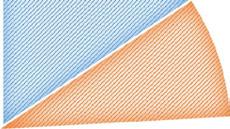
Percentage Loss 15.62% 8.52% 0.69% 8.82% 46.94% 19.41% Infiltration 324 Floors 783.62 Roof 147.2 Component UA Co-effiecient Walls 260.808 Windows 142.2 Doors 11.55 Walls 16% Windows 8% Doors 1% Roof 9% Floors 47% Infiltration 19% UA CO-EFFIECIENT Walls Windows Doors Roof Floors Infiltration
COMPARISON D. REM/rate MODEL AND SUMMARY SUBMISSION E. ENERGY PERFORMANCE MODEL - RETROFIT RECOMMENDATIONS
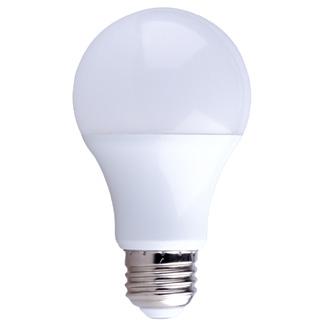
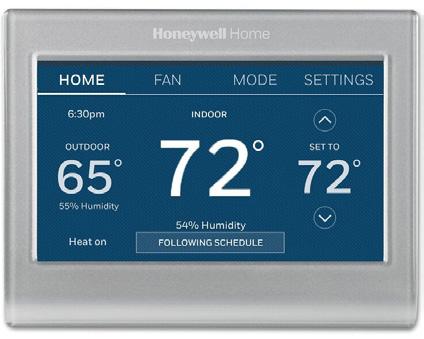
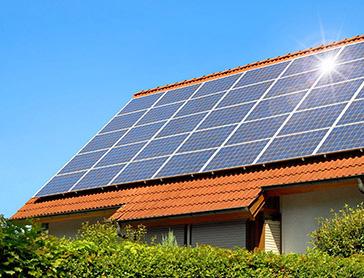
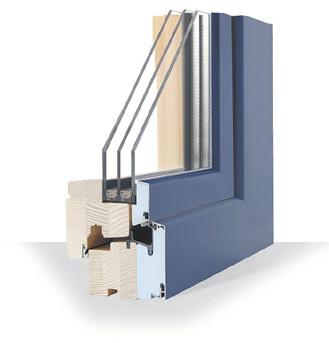
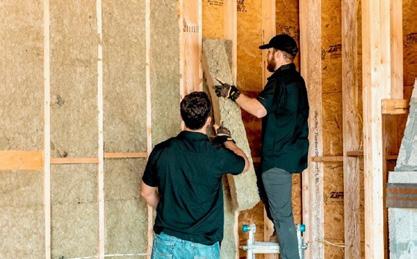
SL.NO RETROFIT COST PAYBACK TIME 01. SHOWER HEAD UPGRADE 2.5 gpm Shower heads to 1.5 gpm Shower heads (Sustainable shower heads) Units: 2 Cost/Unit : $ 75 Labor cost : $ 0 Total cost : $ 150 Benefits : Energy savings New annual energy cost : $ 2145 (Baseline: $ 2544/yr) $ saved : $ 399 Payback : 3.8 months 02. LIGHTING UPGRADE Replace traditional light bulbs with LED bulbs | 9.0W LEDs Units: 4 Cost/Unit : $ 7.99 Labor cost : $ 0 Total cost : $ 32 Benefits : Energy savings New annual energy cost : $ 2491 $ saved : $ 53 Payback : 6 03. CAULKING DAP 00816 side Exterior crystal clear, 10.1 OZ Units: 4 Cost/Unit : $ 7.99 Labor cost : $ 0 Total cost : $ 32 Benefits : Energy savings New annual energy cost : $ 2491 $ saved : $ 53 Payback : 6 months 04. SETBACK THERMOSTAT Honeywell Home Thermostat Units: 1 Cost/Unit : $ 100 Labor cost : $ 100 Total cost : $ 200 Benefits : Energy savings New annual energy cost : $ 2431 $ saved : $ 113 Payback : 1.8 years 05. ACTIVE SOLAR PHOTOVOLTAIC PANELS Units: 220 sqft Cost/Unit : $ 10 Labor cost : $ 200 Total cost : $ 2400 Benefits : Energy savings New annual energy cost : $ 1346 $ saved : $ 1198 Payback : 2 years 06. UPGRADE CLOTHES DRYER Whirlpool - 4.79 kWh/ use Units: 1 Cost/Unit : $ 900 Labor cost : $ 100 Total cost : $ 1000 Benefits : Energy savings New annual energy cost : $ 2093 $ saved : $ 451 Payback : 2.2 years 07. WINDOW UPGRADE Replace Single glazed windows with Triple glazed windows Units: 4 south facing windows Cost/Unit : $ 500 Labor cost : $ 200 Total cost : $ 2200 Benefits : Energy savings New annual energy cost : $ 2073 $ saved : $ 471 Payback : 4.67 year 08. ACTIVE SOLAR WATER HEATERS Units: 2 Cost/Unit : $ 800 Labor cost : $ 200 Total cost : $ 1800 Benefits : Energy savings New annual energy cost : $ 2162 $ saved : $ 382 Payback : 4.7 years 09. WALL INSULATION Replace R-9 Wall Component with R-15 Wall Component Units: 1200 sqft of insulation Cost/Unit : $ 1 Labor cost : $ 200 Total cost : $ 1400 Benefits : Energy savings New annual energy cost : $ 2262 $ saved : $ 282 Payback : 4.96 years 10. SUN TEMPERING Benefits : Energy savings Annual energy cost : $ 474 $ saved : $ 2070 Payback : 4.83 years REM/rate
REM/rate values after retrofit :
values before retrofit :
04
SYNERGY
Reviving the lost glory of Bengaluru’s waterways`
Spring, 2020
Mentor - Prof. Ar. Aruna Sujit
Softwares used: AutoCad, Revit, Photoshop
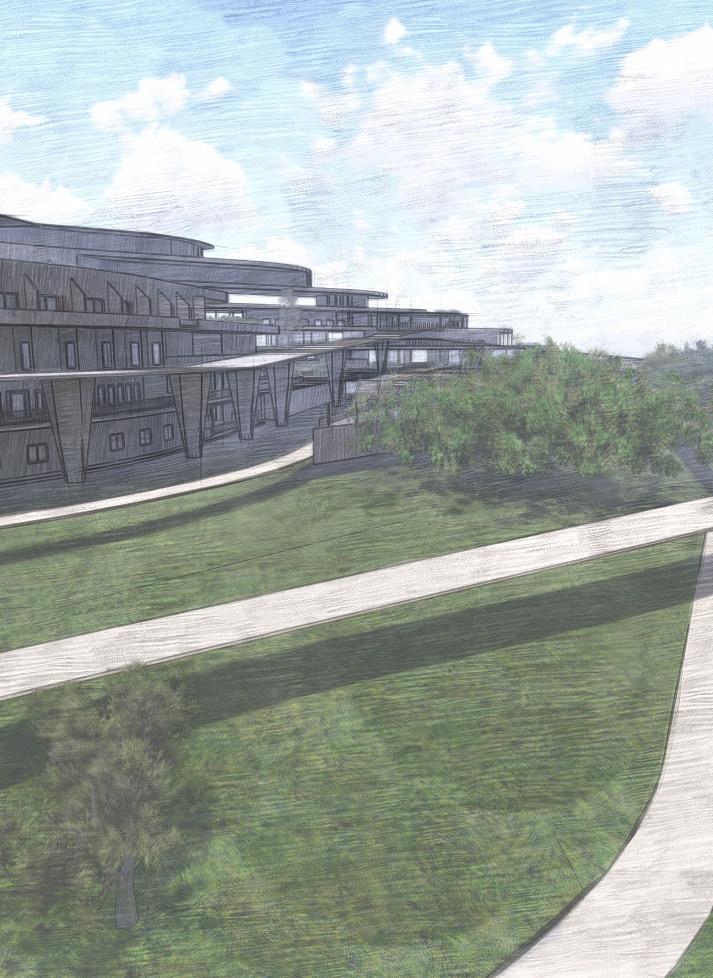
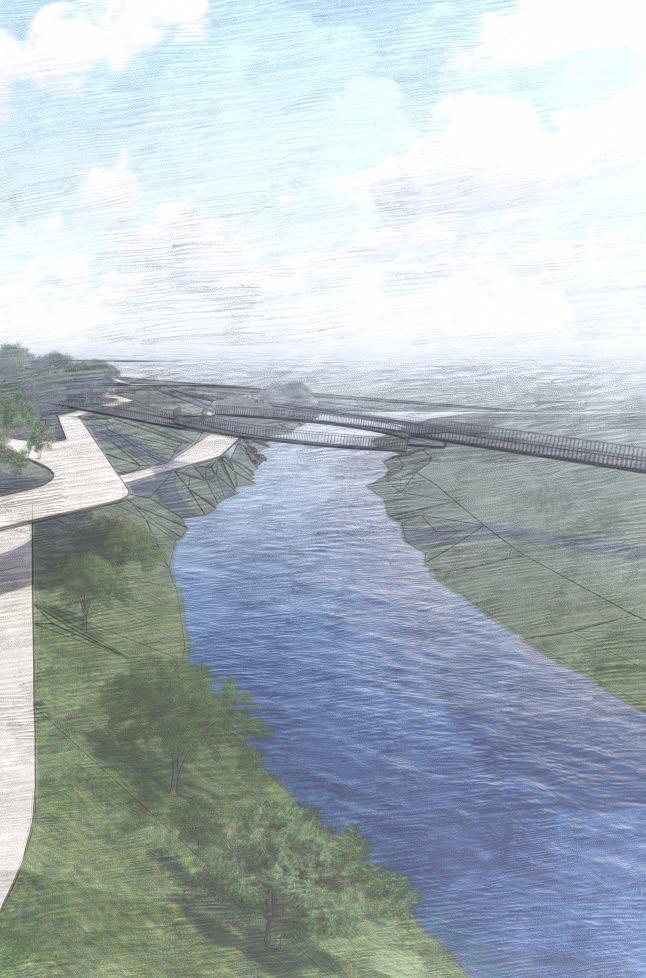
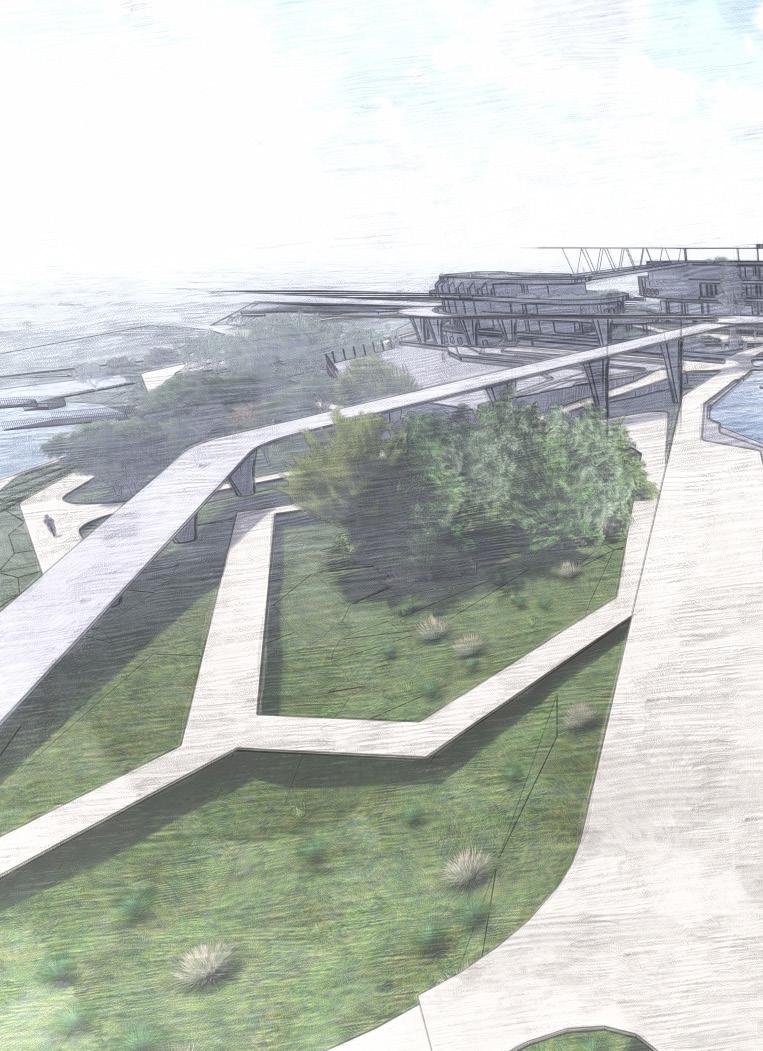
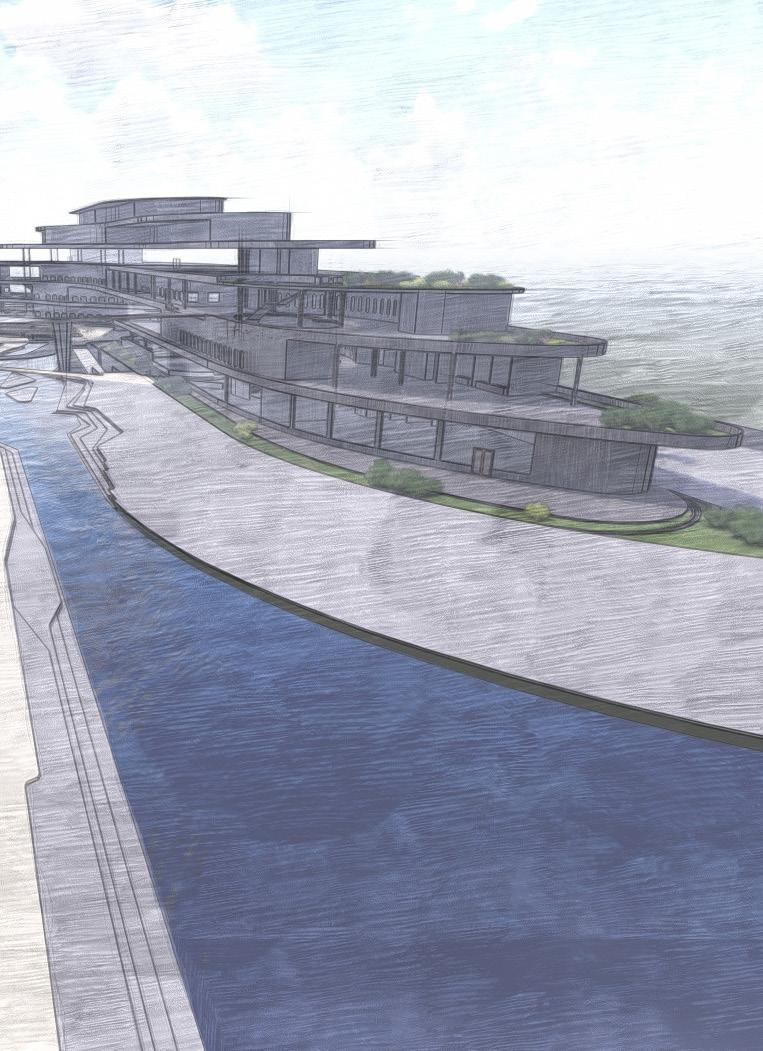
Water, the “elixir of life”, is fundamental for human sustenance. It has multifunctional roles: Aesthetical quality, functional aspects and ecological benefits of water.
Water bodies have been a catalyst to the growth and development of urban environment. Bengaluru was once celebrated as “The city of 1000 lakes”. The Vrishabhavati river, system of tanks and rajakaluves were the inland water resources of Bengaluru. Over the past decade, rapid urbanization, unplanned growth, intensive use of water resources and increased industrialization, in Bengaluru, have led to the deterioration of these water bodies. The tanks have narrowed down to 34 in number, most of the canals have been built upon, covered or clogged and the Vrishabhavati river have become a glorified sewer drain.
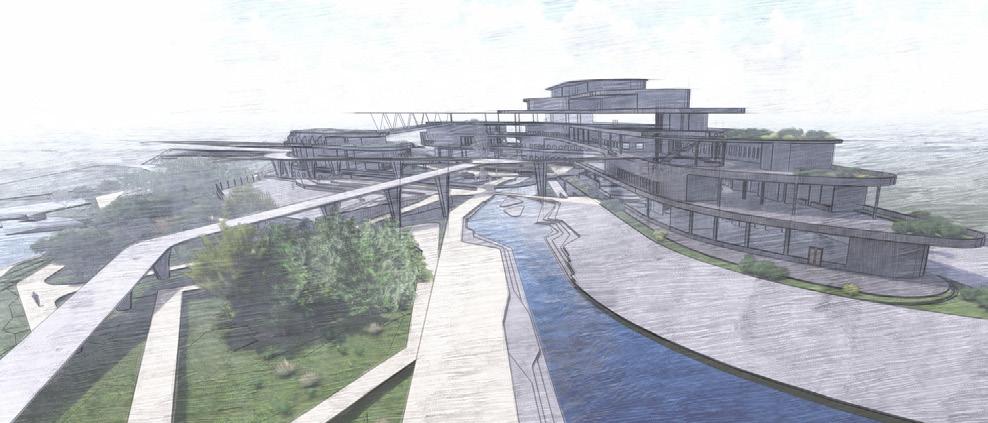
The proposed project is a mixed use development along the Vrishabhavati river that serves as an architectural prototype to address the problems of encroachment of the catchment area and the waterbodies themselves. It also aims to educate the public about the importance of Urban Waters and their conservation through a series of demonstration units.
The scope of the project is developing an environmental waterfront which consists of edge treatment and stabilisation, promenades and public spaces with an urban infill - “Mixed use development” along the Vrishabhavati river, where all groups of people can create a continuous hub of activities. The architectural development includes a mix of research , retail, housing, restaurants, auditorium and spaces that contain dynamic activities. It also includes a series of demonstational spaces that attempt to educate the public about the various water managemnet systems.
2019 Mentor - Prof. Ar. Ravindra Avinash K
Softwares used: AutoCad, Revit, Photoshop
05 FERRY TERMINAL Montreal, Canada
Spring
06
CIRCLE OF NATIONS
Cultural and Community Centre
Ottawa, Canada
Fall 2018
Mentor - Prof. Ar. Praveen Dongare
Softwares used: AutoCad, Revit, Photoshop
REBRICK LAY
Carnegie Mellon University, Fall 2022
Instructor: Jinmo Rhee
Softwares used: Rhinocerous, Grasshopper, Python
Team : Sayali Lamne and Sanjana Nagaraj
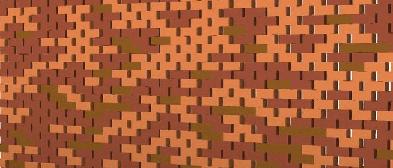
The project aims to create a Grasshopper Plugin, a tool that can simplify redundant and complex workflows intending to resolve the issues of varied parameters of reclaimed brick and bridging the lack of visualization tools for 3D modeling of structures that use reclaimed materials (exclusively Brick). The outcome is a grasshopper plugin- ‘Rebrick Lay’ a tool that can help a wide range of stekholders, from manufacturers to industry professionals, to visualize walls built out of reclaimed bricks. The tool considers the varied parameters of the bricks such as their dimensions, compressive strength and provide ‘n’ number of iterations. This tool can not only reduce waste but also help leverage the circular economy and encourage deconstruction instead of demolition and consideration of disassembly at the start of the project.
Rebrick Lay(Grasshopper plugin tool) Algorithm

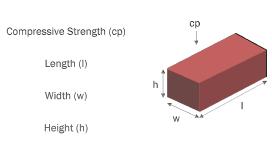
Parameters of each batch
Each batch can be identified by 4 parameters compressive strength (cp), length (l), width (w), height (h), and the number of bricks present in them (n).

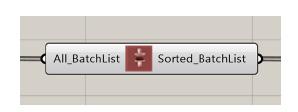
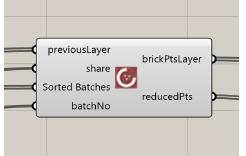
Since these are reclaimed bricks engineers or contractors will prioritize bricks with higher compressive strengths. Thus, to segregate them the ‘sort’ component will sort these batches in ascending order of their compressive strength.these batches strength.
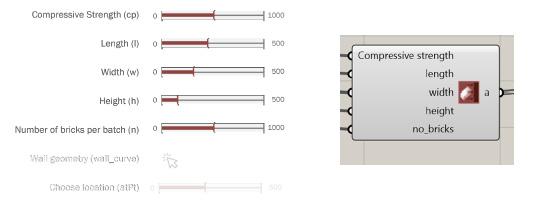
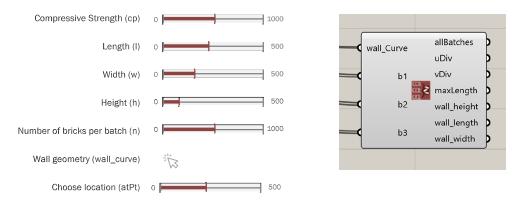

The u-v dimensions will be derived based on the maximum length and width as the maximum width of the bricks among all the selected batches.
07

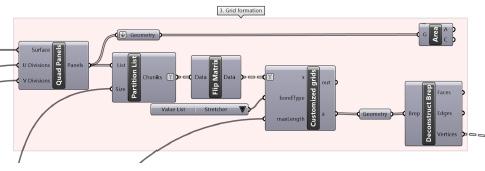
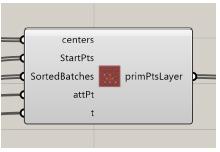
To construct a strong wall users might prioritize bricks with higher compressive strength. Primary distribution refers to the first distribution of bricks with higher cp. This component will take input from ‘sortedBatches’, centroids of each bricks panels, and attractor point, which will select a random number of starting points based on the user’s preference given through attractorPt. This attractor point can be selected in two ways- using a number slider or evaluate curve option. From the list of generated list of points, 50% (t) of the initial points will be selected. It will further check the available number of bricks in the batch.
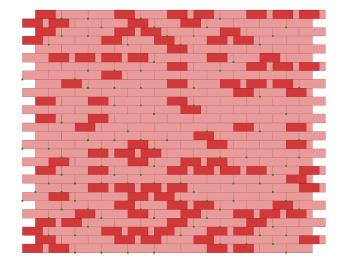
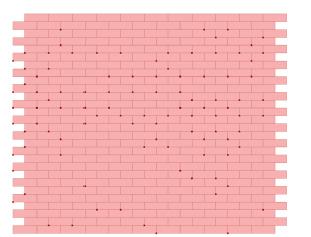
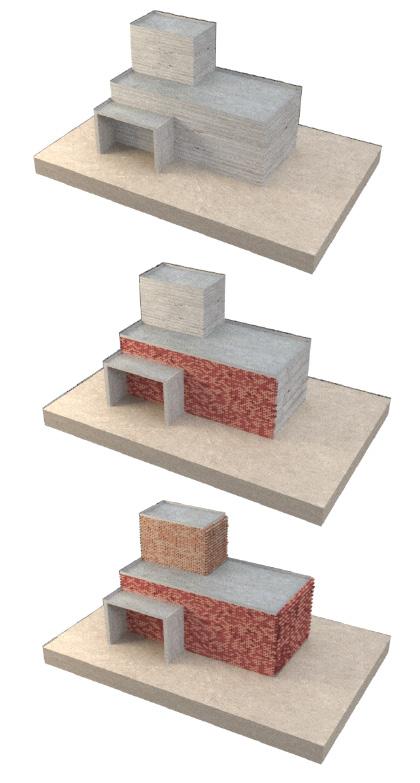

This tool can be extremely useful for architects, designers, engineers, contractors, and masonry workers to estimate the required quantity of the material, visualize final results in a space without redoing efforts, reduce waste and give cost savings. This tool will help in overcoming all the limitations and challenges associated with the use of reclaimed bricks and support a circular economy. As mentioned before it encourages deconstruction instead of demolition and consideration of disassembly at the start of the project.
Distribution Secondary Distribution
Primary
08
ART AND DESIGN INCUBATION CENTRE
Bengaluru, India
Spring 2018
Mentor - Prof. Ar. Gautham
Softwares used: AutoCAD, Revit, Sketchup, Photoshop
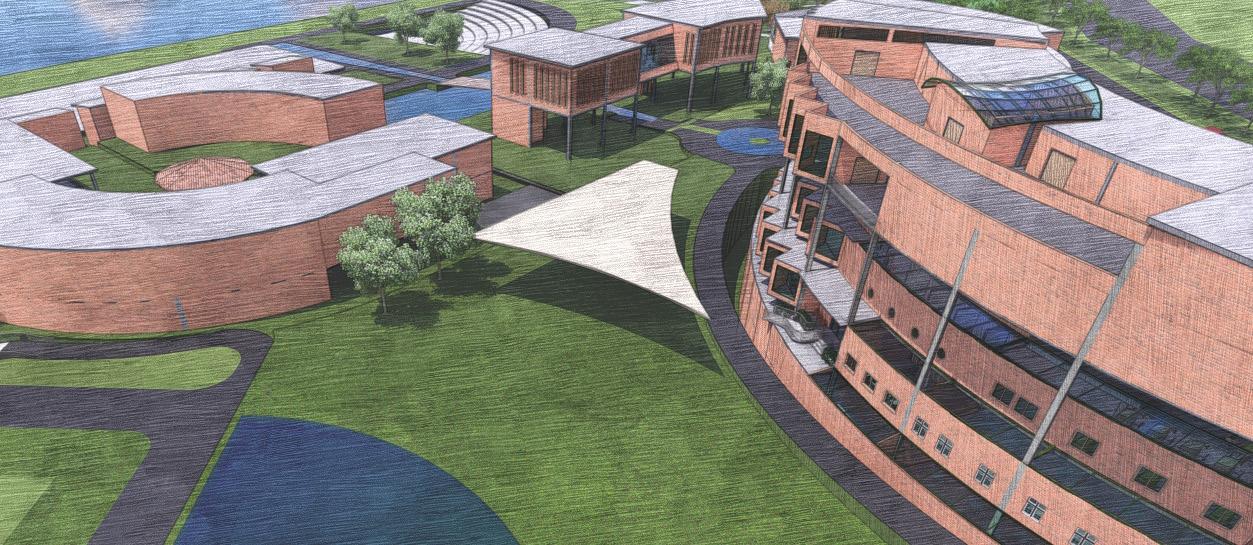
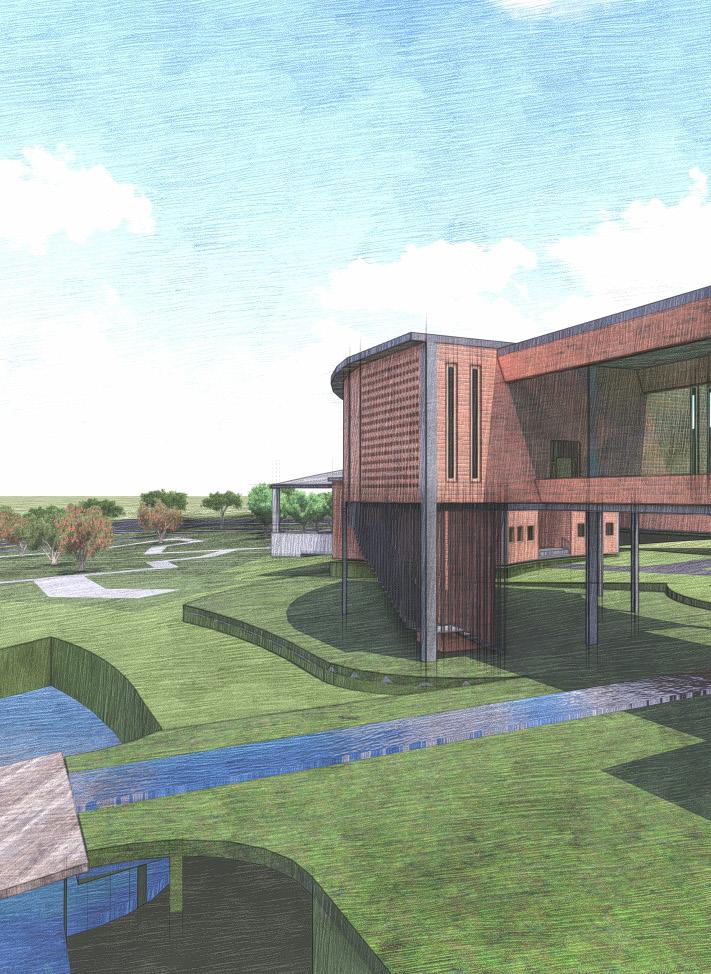
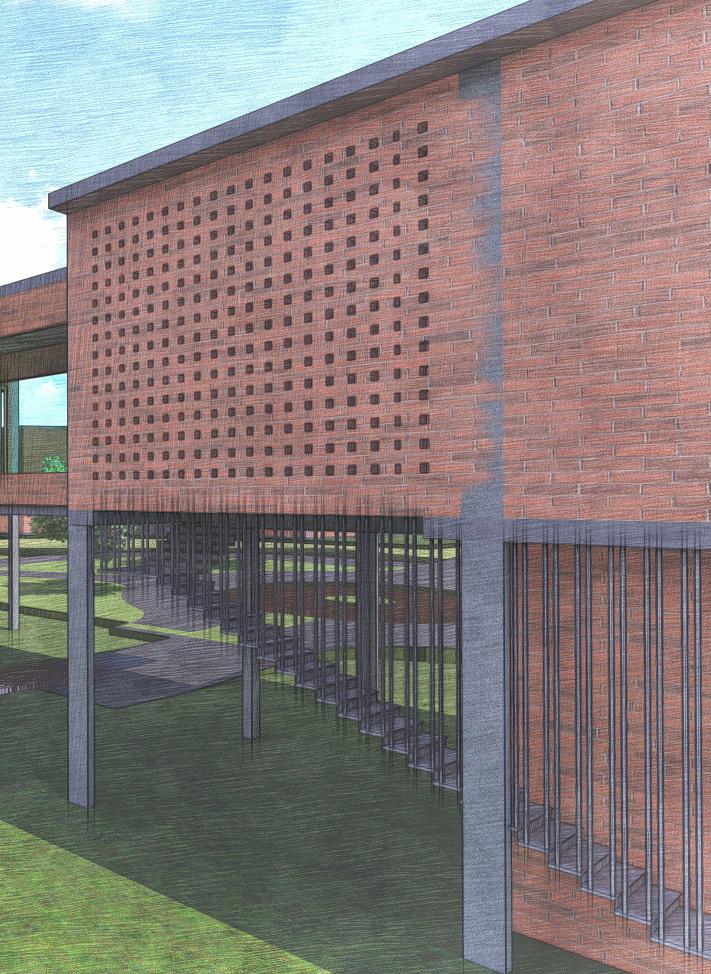
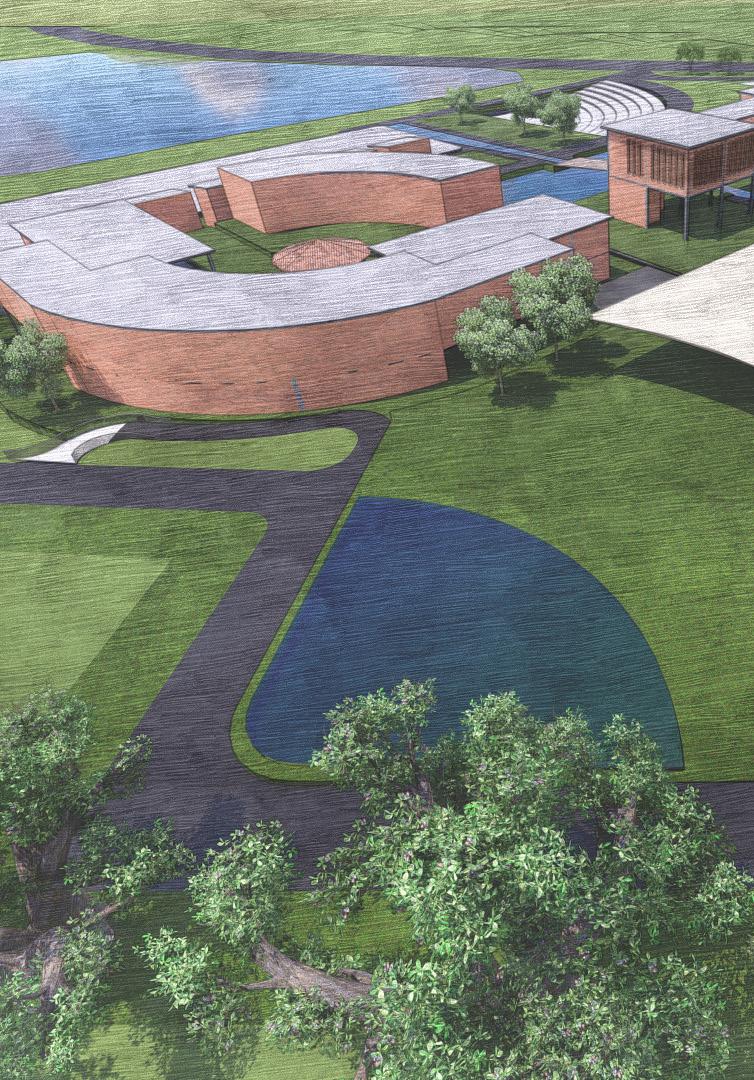
This project aims to create interactive and social spaces within the dense urban jungle. Bengaluru has been celebrated as the “Silicon Valley of India” and the “IT Hub” of the country. To encourage economic growth, the government created a favourable environment for the setup of many MNCs and firms leading to large scale urban migration of a young working class to the city.
Bengaluru is now home to 1000s of startup companies. This technology development within the city increased the demand for co-working spaces. As an attempt to create a social-common environment for academic and working professionals, the proposed project is an art and design incubation centre. It houses multi-purpose spaces such as auditorium, open air theatres, public park, workshop spaces. It also includes accomodation facilities for both international students and faculty. Multiple spaces such as cafes, pavilion, public park and the waterfront attract the general public.
The existing lake has a poor health and is deteriorating because of the dense development around it. This project remains highly sensitive to this ecology and maintains a the required buffer from the waterbody. It has also included other Low-Impact Development strategies to help rejuvenate the waterbody.
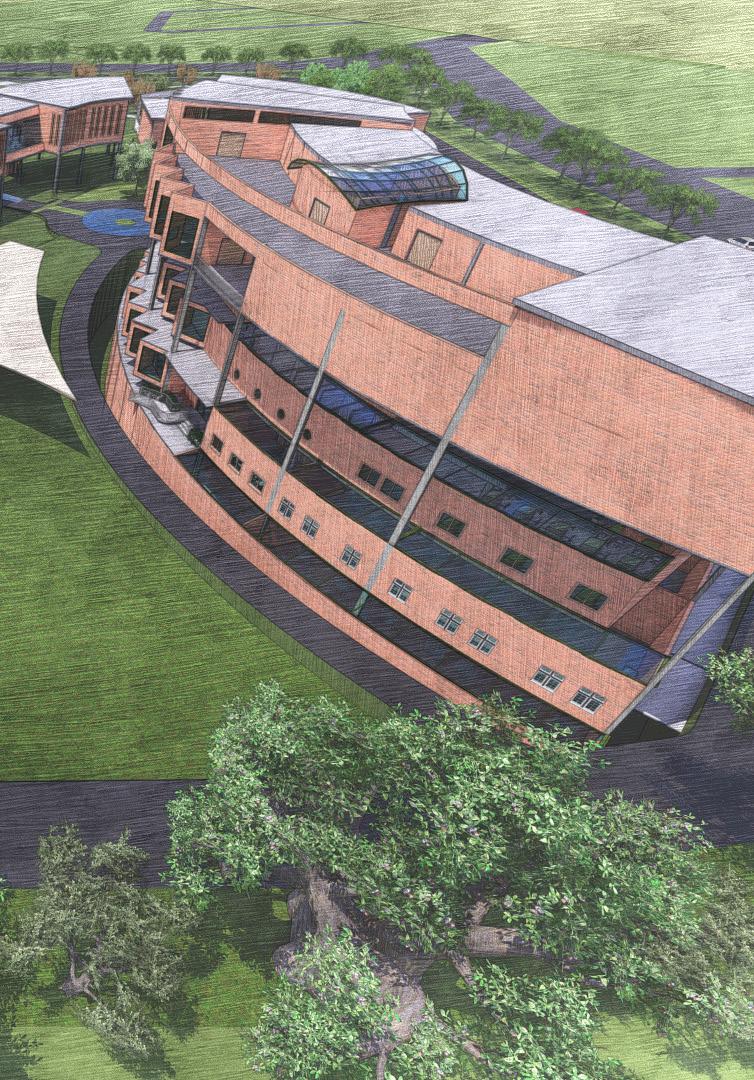
09
INTERNSHIP WORKS
Design Studio Architects, Bengaluru, India
Softwares used: AutoCAD, Revit, Sketchup, Photoshop, Lumion, Twinmotion

sanjananagaraj97@gmail.com


“Good architecture lets nature in.”
- Mario Pie
Sanjana Nagaraj


