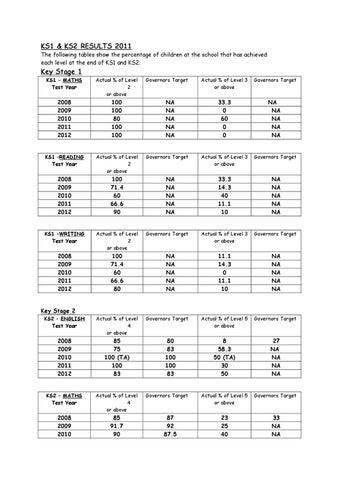
KS1 & KS2 RESULTS 2011
The following tables show the percentage of children at the school that has achieved each level at the end of KS1 and KS2.
Key Stage 1 KS1 – MATHS Test Year
Actual % of Level 2 or above
2008 2009 2010 2011 2012
100 100 80 100 100
KS1 –READING Test Year
Actual % of Level 2 or above
2008 2009 2010 2011 2012
100 71.4 60 66.6 90
KS1 –WRITING Test Year
Actual % of Level 2 or above
2008 2009 2010 2011 2012
100 71.4 60 66.6 80
Governors Target
NA NA NA NA NA Governors Target
NA NA NA NA NA Governors Target
NA NA NA NA NA
Actual % of Level 3 or above
Governors Target
33.3 0 60 0 0
NA NA NA NA NA
Actual % of Level 3 or above
Governors Target
33.3 14.3 40 11.1 10
NA NA NA NA NA
Actual % of Level 3 or above
Governors Target
11.1 14.3 0 11.1 10
NA NA NA NA NA
Actual % of Level 5 or above
Governors Target
8 58.3 50 (TA) 30 50
27 NA NA NA NA
Actual % of Level 5 or above
Governors Target
23 25 40
33 NA NA
Key Stage 2 KS2 – ENGLISH Test Year
Actual % of Level 4 or above
2008 2009 2010 2011 2012
85 75 100 (TA) 100 83
KS2 – MATHS Test Year
Actual % of Level 4 or above
2008 2009 2010
85 91.7 90
Governors Target
80 83 100 100 83 Governors Target
87 92 87.5