9 minute read
Why Connected Data is Crucial to Pharmaceutical Research
from IPI Spring 2020
by Senglobal
Classic analysis tools fall short of revealing the insights within life sciences data – so researchers need to look for new approaches, such as graph technology, says Neo4j’s Alicia Frame. Big data combined with advances in data science approaches have provided a valuable opportunity for the pharma industry to uncover previously unobtainable insight that has the potential to improve – and save – lives.
The technology that has traditionally been used to work with big data, RDBMS (relational database management systems), was never intended to be flexible or scalable and to detect connections and patterns within datasets.
This has resulted in re-visiting the tools historically utilised, including SQL and relational database technology. Desktop spreadsheets and relational databases that have been a mainstay over the past 30 years have reached their limits. They simply cannot cope with vast amounts of data nor the complexity of the multiple sources of data we want to explore, significantly hampering research efficacy.
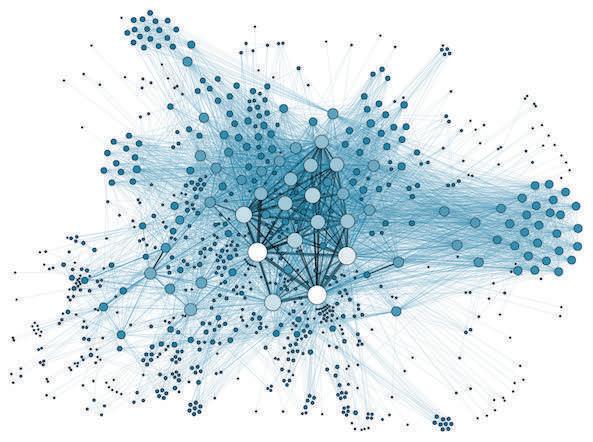
Medical data is after all highly heterogeneous and complex in nature. It can run from molecular interactions to population-wide epidemiological studies to macro-scale disease network tracking all within the same body of research. This presents a formidable challenge, especially since the reality is that relationships in data hold the key to actual breakthroughs. In parallel, researchers working toward promising new medical treatments are also looking at huge amounts of data, often running into thousands of terabytes. Working out how multiple researchers can access and collaborate within a dataset is also a challenge. With data that often comes in an unstructured format and needs to be turned into a valuable research ingredient as quickly as possible – not just simply initially analysed and stored – we clearly need a dynamic and scalable way to leverage its potential. Enter the Graph Database The good news is that graph databases are a viable and powerful alternative. Unlike the relational database, which stores data in rows and columns, graph databases connect data points in unstructured big data, essentially joining the dots to create a picture of the relationships between them. These data patterns are difficult to detect using SQL-based RDBMS or other approaches, such as NoSQL and Hadoop.
Graph technology was first used to improve the user experience by social web giants Google, LinkedIn and Facebook, to find relevant web pages, friends, or personal connections. Outside of big tech, graphs showed tremendous promise in investigative journalism and notably to expose complex financial structures in The Panama Papers. In the case of the Papers, a team of global researchers carried out their investigations with a gargantuan 2.6 terabyte data set that would have been an onerous task using traditional database technology.
Connecting the Dots Highly-linked datasets are too difficult for SQL to easily parse due to their inherent design. Relational database models employ sets of tables and columns, carrying out complex joins and self-joins to action queries when the data becomes increasingly inter-related. As human beings, we naturally perceive connections between data points visually, making graph representations much more in line with how our minds associate and organise information.
The ‘rows and columns’ approach does not match our mental visualisation of a problem, technically defined as ‘objectrelational impedance mismatch’ – and more to the point, rows and columns don't match the real world, systems biology data that confront life sciences researchers on a daily basis. Trying to take a data model based on relationships and pushing it into the tabular framework of a relational database, ultimately creates a disconnect that costs valuable time, and can lead to missing useful patterns and leads.
The deep data mining and pattern detection capabilities of graph technology provide a route to the insights sought in leading-edge pharmaceutical research. The unique selling point of graph database technology is its innate ability to discover relationships between data points and understanding, analysing and interpreting them at huge scale. Joining the dots represents an exciting advance
for medical researchers, enabling them to uncover hidden patterns in their own research and that which precedes their own, such as new molecule research and big clinical trial work.
Graph technology has the innate power to collaboratively filter data, making great use of the information gathered by multiple users. Collaborative filtering is a core technique used by recommendation engines, where information or patterns can be filtered via data sources, viewpoints, multiple agents and so forth. This approach allows research teams to work on lots of promising data in parallel, saving time and money. And they get to work on the right data, at the right level of granularity, without being disconnected from the global context.
Navigating an Information Triangle As interrogating data and knowledge in life sciences requires the modelling of an incomplete model of how our bodies work, it is essential we find a better way to model that complexity to speed up research. As our knowledge pool expands, so these models change, and one senior scientist, Stephan Reiling at Novartis Institute for Biomedical Research, has stated that graph technology can be a new tool to help these investigations.
Novartis has engineered a large graph database of diverse heterogeneous biological data, which his team is combining with medical information from NIH’s PubMed. PubMed contains about 25 million abstracts from some 5600 scientific journals. The team wanted to establish one central database to look at how it can use its vast scientific knowledge to develop the next generation of medicines. Novartis had also collected decades of data on how various compounds affect protein targets, such as enzymes, amounting to around one billion data points. That historical data is critical, but sparse compared with the amazing granularity of the data currently being amassed. The company faced the challenge of combining its historical data stores with this new data, while also needing a way to place this research within the larger context of ongoing medical research from around the world. For Novartis, ingesting and connecting data about diseases, genes and compounds, along with identifying the nature of the relationships between these elements, held the promise of accelerating drug discovery. The Novartis team wanted to link genes, diseases and compounds in a triangular pattern. “For successful drug discovery, you need to be able to navigate this triangle,” explains Reiling. The team decided to create a knowledge graph and devised a processing pipeline for ingesting the latest medical research.

Novartis Has an Ongoing Effort to Collect and Curate Text mining is used at the beginning of the pipeline to extract relevant concepts and facts from PubMed. That data is then fed into the graph database, along with Novartis’s own historical and image data. The data pipeline populates the 15 kinds of nodes that were devised to represent the data. The next phase fills in the relationship information that links the nodes together. The team identified more than 90 different types of relationships.
Novartis uses graph algorithms to traverse the graph and identify a desired triangular node pattern linking the three classes of data together. Graph analytics not only finds relevant nodes in the desired triangular relationship, but also uses calculations the team designed to gauge the associated strength between each node in each triangle. Using this capability, the team devised queries to find data linked by the desired node pattern, with a given association strength and arrange the triangles according to this metric.
When researchers query the knowledge graph, results show the strength of the correlation between elements. If a researcher already knows about a highly associated correlation, they might choose to investigate others which could take their work in new directions.
Currently there are half a billion relationships in the database, with the hope to triple this number. Graphs have allowed Novartis to flexibly navigate all of these data sources which is a huge boon to its research.
More than a Billion Articles Another example of graphs leading the way in life science research is Miroculus, which saw the promise of microRNAs for cancer detection. Their detection has traditionally required highly-skilled scientists, specialised machinery, and very complex protocols, and Miroculus saw the potential to alter the course of microRNA detection with graphs. Conducting a study to find a microRNA biomarker for stomach cancer meant keeping up with an explosion in related medical research. Typical research methods involved manually searching for articles, selecting a relevant article and attempting to retrieve and assimilate it. But with the increase in microRNA research, absorbing all the relevant information would take several lifetimes. Miroculus needed a way to accelerate that process and connect scientists directly to the most pertinent research, in order to isolate the microRNA biomarker for stomach cancer.
In order to isolate the microRNA biomarker for stomach cancer, life science researchers are required to keep up with the latest publications connecting genes, diseases and microRNAs. “In order to make sense of all the newly available microRNA information, we stored this high volume of data in a searchable graph database,” said Antonio Molins, VP of Data Science at Miroculus.
The Miroculus team gathered more than a billion articles in Hadoop. Next, they used natural language processing (NLP) to extract specific sentences with keywords for gene, disease and microRNA. Inferring the relationship between keywords required another step. The team developed an unsupervised machine learning model to classify relationships, which are then stored in the graph database. “We think it’s good to use the right tool for the right problem,” says Molins. “Graph databases are the right tool if you are focusing on relationships.”
The team created an interactive visualisation searchable by microRNA, gene and disease. The user’s search criteria becomes the central node of the visualisation, with surrounding nodes connecting specific microRNAs. Selecting a particular node extracts research papers that relate them, with the specific sentence cited and a link to the publication. With the latest medical research available, Miroculus designed a study following FDA guidelines. The study – conducted in collaboration with the NIH, the National Cancer Institute and experts in Chile – included 650 people eligible for an endoscopy to diagnose stomach cancer. technology is a highly effective way to do just that.

Summing up, Novartis and Miroculus are just some of the many use cases illustrating graph technology’s innate ability to discover data relationships, which promises to feature strongly in the future of medical research. Everything is connected, but sometimes the connections don’t emerge unless we coax them – and graph

Alicia Frame
Alicia Frame is the Senior Data Scientist at Neo4j, where she works as part of the product management team to set the roadmap for the Graph Data Science library, and with customers and the community to show the power of graphs for improving machine learning workflows. Prior to working at Neo4j, her focus was on computational chemistry and predictive models for genetic target identification, working at companies like BenevolentAI, Corteva Agriscience, and the US Environmental Protection Agency. She holds a PhD in computational biology from the University of North Carolina at Chapel Hill.


