SLOW STREETS EVALUATION 2023
Network
Program
Program-wide
Quick Facts
Map
Summary
Introduction Program
Executive
Goals & Criteria
Metrics
Evaluation
Results Vehicle Volumes & Speeds Collision Analysis
Steps Corridor-specific Results 12th Avenue 20th Street 23rd Avenue Arlington Street Cabrillo Street Clay Street Golden Gate Avenue Hearst Avenue Lake Street Lyon Street Minnesota Street Noe Street Page Street Sanchez Street Shotwell Street Somerset Street Conclusion 1 2 3 4-5 6-7 8-9 10-19 10-15 17-19 20-21 22-37 22 23 24 25 26 27 28 29 30 31 32 33 34 35 36 37 38
Next
Introduction
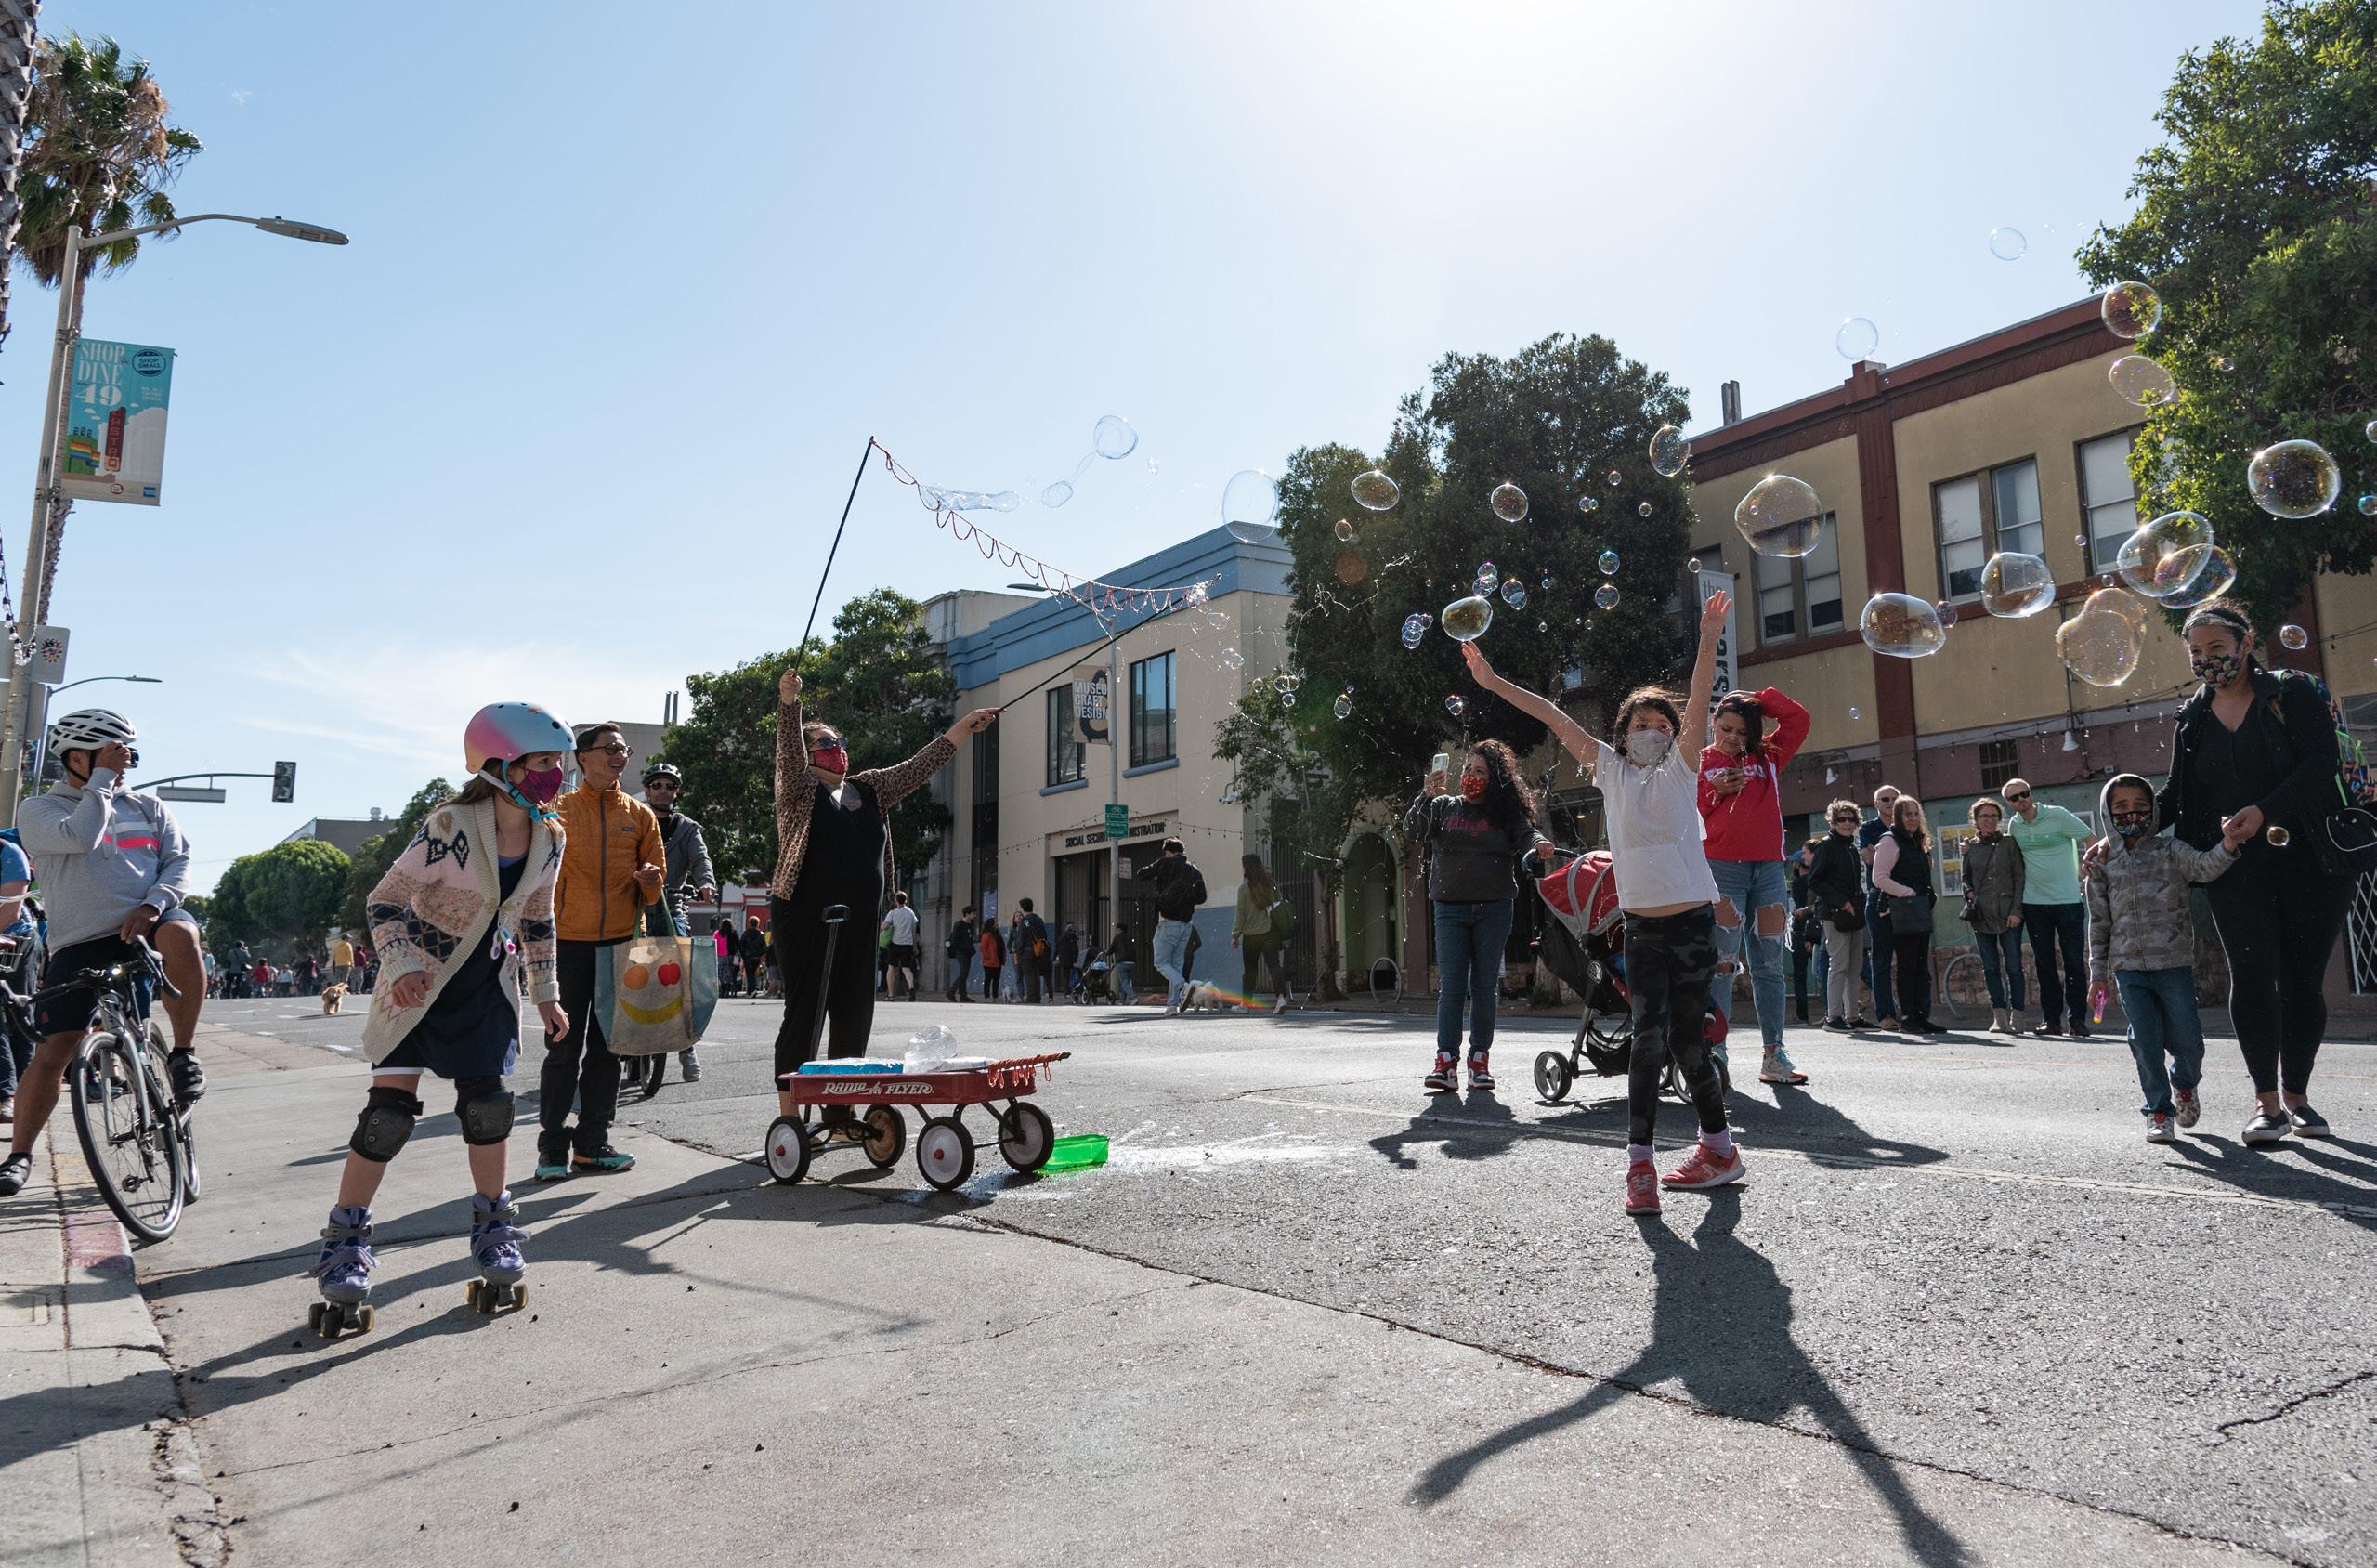
Over the past two years, Slow Streets have shown how simple designs that prioritize people can transform streets. Suddenly, streets across San Francisco filled with the sounds of kids playing and neighbors chatting. They filled with people on bicycles and people rolling in wheelchairs; with joggers and dog-walkers. The streets came to life.

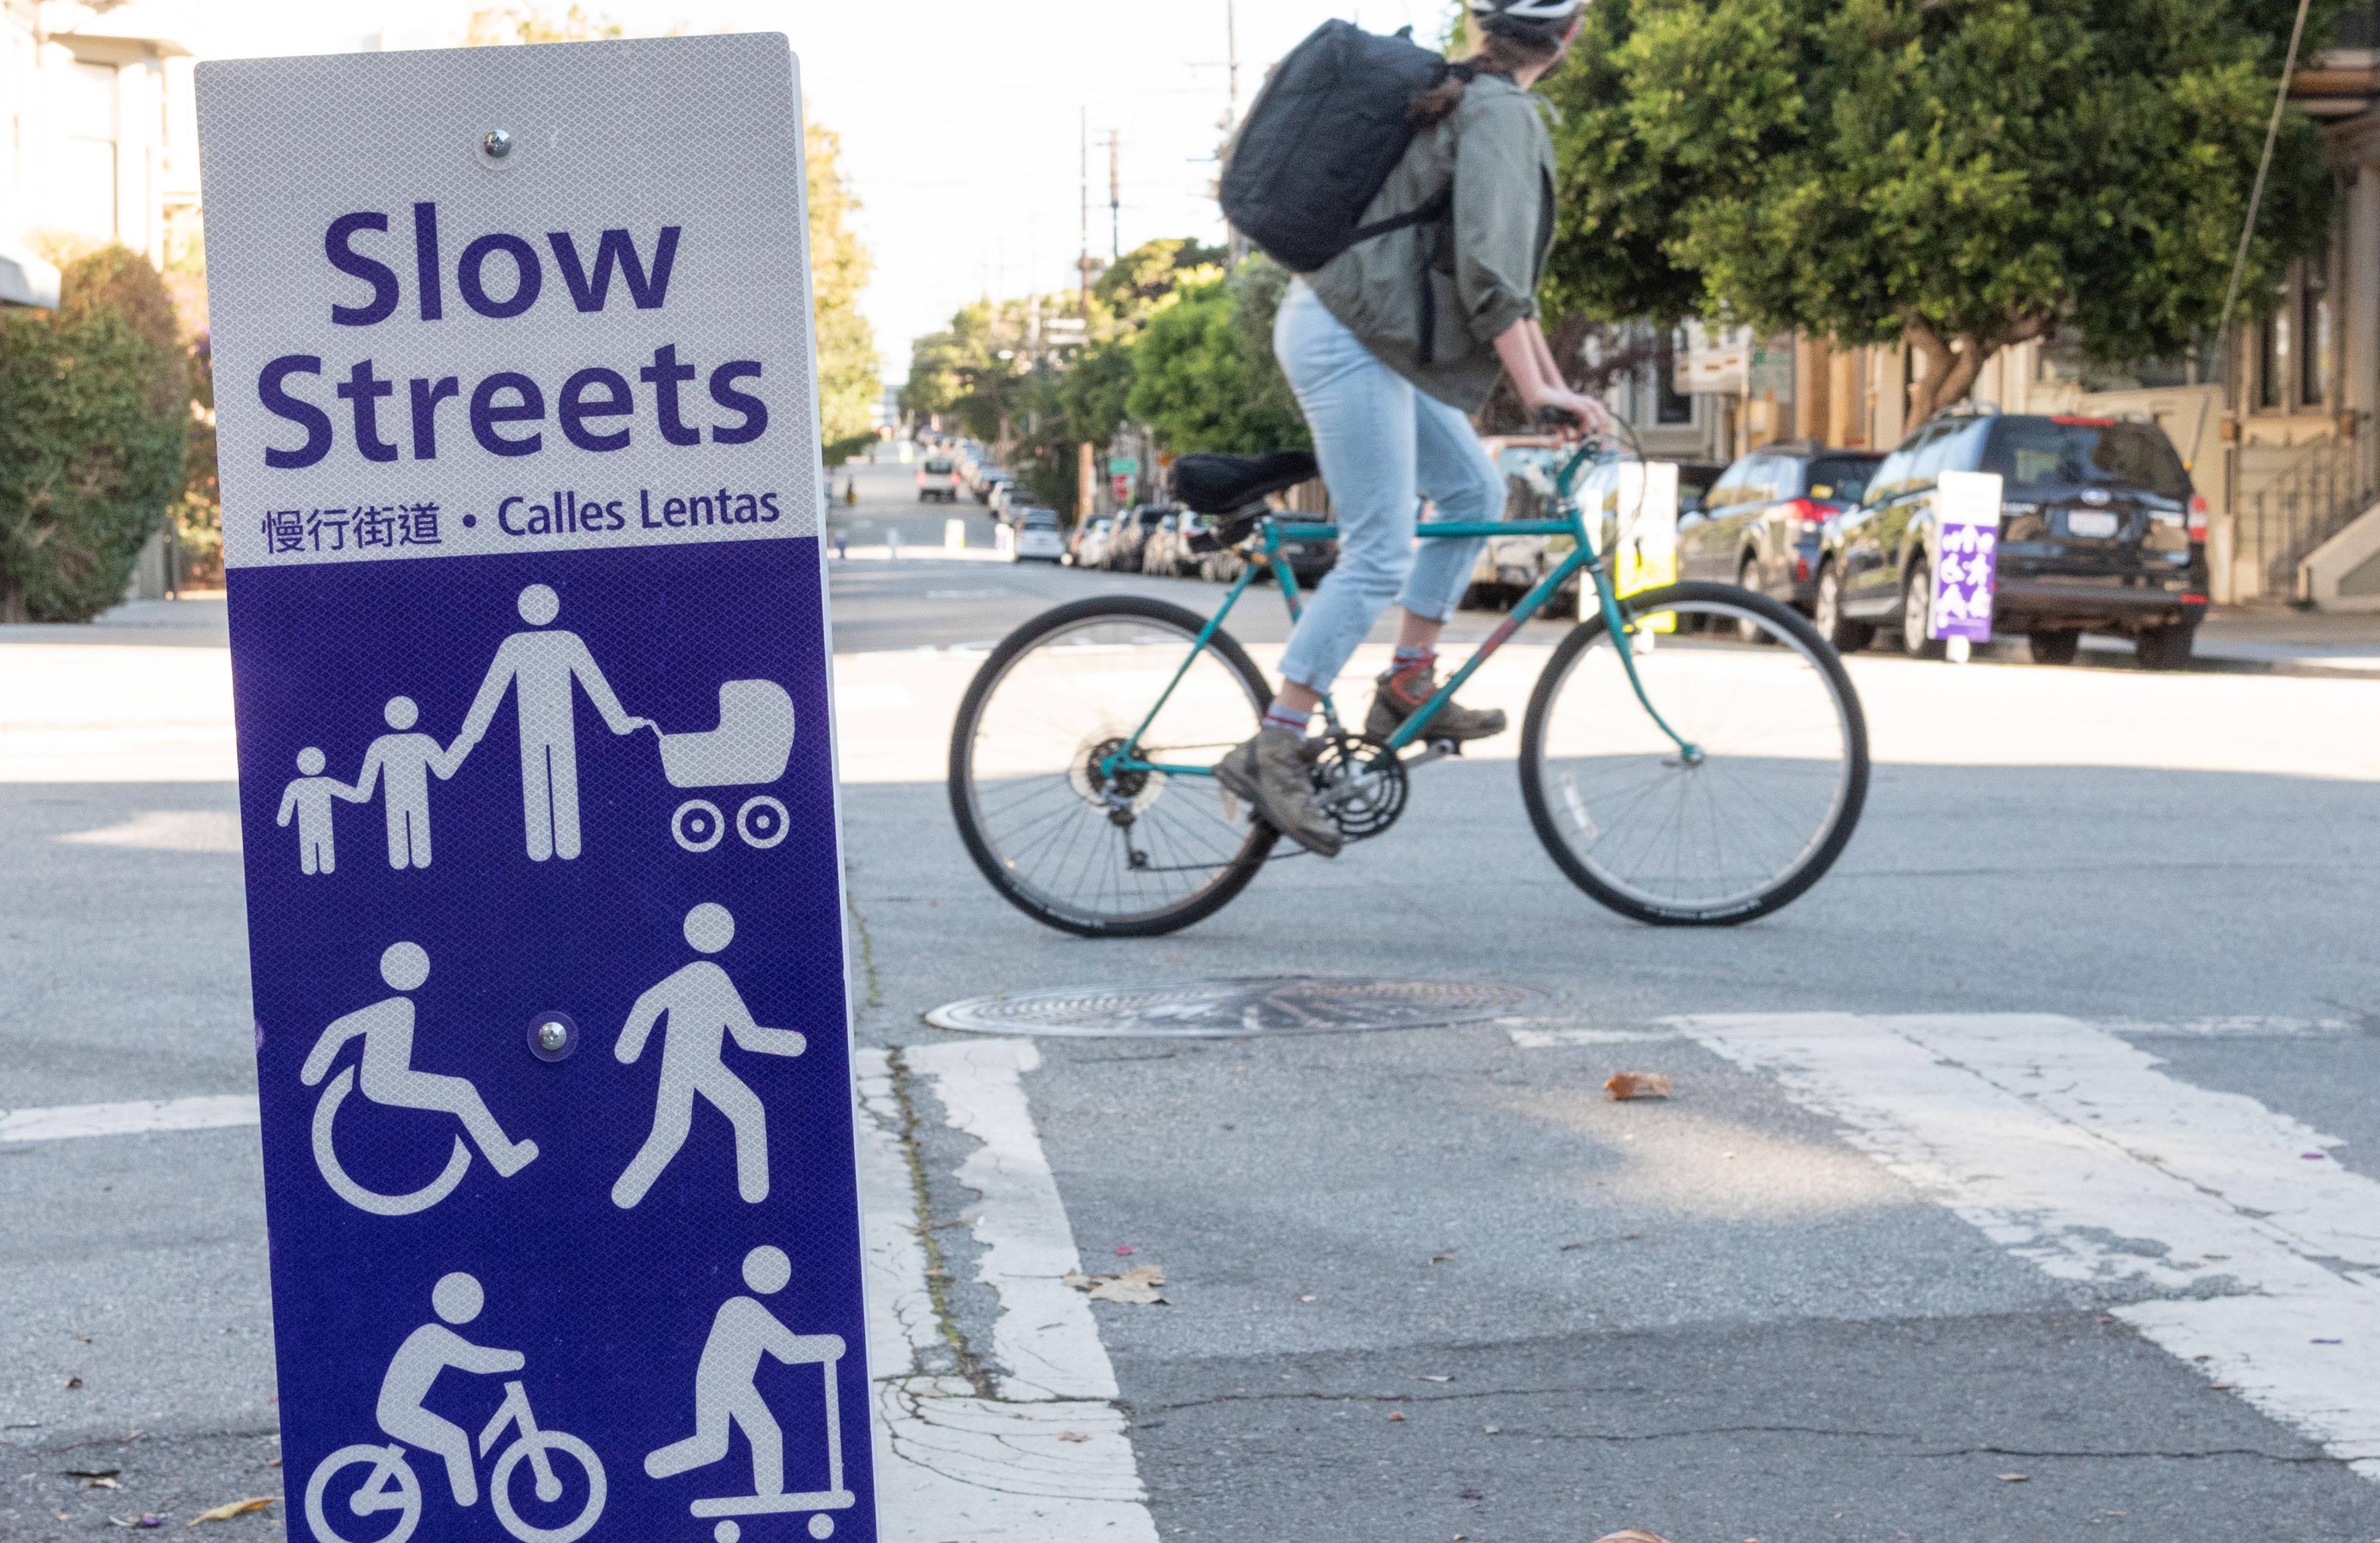
Initially, the San Francisco Municipal Transportation Agency (SFMTA) introduced Slow Streets as an emergency response to COVID-19. People needed space for recreating at a safe distance outdoors. With Muni service reduced or suspended at the time, people needed ways to travel to essential destinations on foot or bike. To quickly meet these early pandemic needs, we implemented Slow Streets with temporary signs and barricades.
Over time, it became clear that Slow Streets served an even larger purpose. They became places for communities to come together. Neighbors organized events like scavenger hunts and Trick-or-Treat parties around their local Slow Streets. They created art and hosted pop-up musical performances. Slow Streets encouraged many people to shift their lifestyles. Some families sold their cars and began to travel by cargo bike. Older San Franciscans rediscovered the joy of riding bicycles. Fleets of kids gathered to bike to school in organized “bike buses” across the city. Beyond the initial pandemic response, Slow Streets proved critical to meeting some of San Francisco’s most significant goals: Vision Zero and Climate Action.
Slow Streets have an enduring place in San Francisco. We need to continue to encourage active transportation to meet our 2021 Climate Action Plan goal of 80% low-carbon trips by 2030—and we need to make these trips safe and accessible for people of all ages and abilities. Low-stress streets like Slow Streets create transportation choices for a wide range of San Franciscans by making active transportation comfortable, safe and joyful.
On December 6, 2022, the SFMTA Board approved an ongoing Slow Streets Program. The Slow Streets Program will maintain the same core principles as the COVID-response Slow Streets, but with new Program targets for vehicle volumes and speeds, a more durable, diverse design toolkit that includes features like speed humps, traffic diversion, roadway narrowing and wayfinding signs, and an expanded network of streets.
The purpose of the 2023 Slow Streets Evaluation is to evaluate the current network of Slow Streets to assess how each corridor meets the targets established by the SFMTA Board for a successful Slow Street. This Evaluation will inform changes to these streets’ designs that are needed to meet the Program targets.
SFMTA | Slow Streets Evaluation 2023 | 1
Slow Streets Program Quick Facts
Slow Streets Network Map
SFMTA | Slow Streets Evaluation 2023 | 2 SFMTA | Slow Streets Evaluation 2023 | 3
20th St e M ced k M ced Go den Gate Presidio A m Squ Al Mos o ec. Ce yet o M o Marina G ee ncoln e n e h John Mc dl ti k oi rn Ha di ark Golf ou u V anh dle Je o Squa e G e Can n M vid n un San ci co Golf lub ympic ou try Club win eaks alboa Cris eld The Main Po Pa c o Marna Val o dway L a gu G o ugh Sut e P ne Harrion Fremot Spea Spear 7thSt to C m n Ba bo b ill Lake P a k e 2ndS Po 4thSt Mssion M Eddy F l on 1 1 th A v e 1 5 th A e 1 9th A e 2 7th A v e 28th Ave 3 0 th A e 3 7th A 4 1 s A 4 5 th A 3 d A v Lin n Ho w Do o 1 th A 1 5 th A 2 3 d A 2 7th A 3 1 s t A 3 5 th A 3 9 th A 4 3 r d A 47th Ave K Duboc 14th St 26th Italy Sa to Russa Circula Aalon Innes 6th d v B d e c e M e k a L OSh ugh y Kik o m Valencia Guerrero Doug s V e m o n Kansas C li n a Texas 24th S 26th 8thSt 10thSt 12thS 13th S C a yt C nt r a H ye Man e Juds n Mans Woolsey Ba o M nta G e Ocea uca yptu U Vicente Wa o Kirkham aw n M a Nor eg Ri Sa ag v g Ortega 16th 8th S Naples Rankin C ol a nassus I lli noi S hwerin Sunnydale Ingalls sc Banken ndu Richadson 1 6th A v e F m Rip y M D o w e C o Over Mart L h K ng hn Ken edy C sO e JohnMui r La Me d GreatHigh wa Alemany Howad 41st Ave Octavia Gough Scott Page John F. Kennedy Ellis Polk Quesada Fitch Jennings Holloway 17th St 22nd St Chattanooga 7th Ave Phelps Masonic Arguello Embarcadero V an N e s s Geary Californ a Fulton Middle Dr West Martin Luther King Jr Dr Overlook Dr Un on California Chestnut Geary Mission Church Ca C a s t r o Diamond S oa Lincoln Way Judah Tarava 20th Ave Sunset B l v d Great Highway Mission Cortland Silver Ocean Visitacion Mission SanJose Geneva Oakdale Evans B a yshore Silver 3rd St 3 r d S t F i ll mo r e Park Presidio Stanyan Market Shelley Twin Peaks L a g nu aHond a Portola A emany Bay s ho r e Wahngo Wash i n g not on Doyle Maina e d n Argu o T e r yAF ra c o Bayshore Ocean San Bruno 15th Ave Beverly Harold Leavenworth Market Brazil Excelsior London Prague 22nd St Jarboe Potrero Harrison Market Shotwell Cesar Chavez La Playa 34th Ave GoldenGate Webster Lyon Divisadero Broderick Burnside Lippard 24th St Sanchez 30th St Bocana Moultrie Fulton 23rd Ave Keith Lane Mendell Gilman Bowdoin Somerset Peralta Putnam Jones Stockton Powell Mason Grant Mariposa Bay Je erson 2nd Ave Hyde Columbus Union Steiner Gough Clay 19th St 20th St Sanchez Arlington Randall Roanoke 25th St Grand View Fell Baker Valencia Duncan HeightsDiamond Chestnut Kearny Anza Cabrillo 20th St San Bruno Missouri Arkansas Indiana MinnesotaTennessee 17th St 22nd St Sacramento Scott Pierce Laguna Lakeview Farallones Shields Holly Park Circle Tompkins Broderick Pierce Noe Cayuga Capitol 12th Ave Lyon Hearst Slow Streets Implemented Slow Street Planned Slow Street Map Legend N Map of Adopted Slow Streets as of May 2023
of Slow Streets implemented as of May 2023 on Slow Streets since the program began as part of the city’s permanent Slow Streets network 32 MILES 0 FATALITIES 18 STREETS APPROVED Golden Gate Presidio A amo Squa e Alta P aza Moscone Rec. Center Lafayet e Fort Mason Marina Green ncoln S ern G ove Buena Vis a Panhandle Je erson Squa e G en Can on Mt David on Twin Peaks Crissy F eld The Main Post Paci c Je erson Marina Vallejo Bro L a guna G o ugh Sutter P ne Fu ton C emen Ba boa Cab illo Lake P a r k e r Post Mason Eddy 1 1 th A v e 1 5 th A v e 1 9th A v e 2 7th A v e 28th Ave 3 0 th A v e 3 7th A v e 4 1 s t A v e 4 5 th A v e 3 r d A v e Lincoln Do l o r e s 1 1 th A v e 1 5 th A v e 2 3 r d A v e 2 7th A v e 3 1 s t A v e 3 5 th A v e 3 9 th A v e 4 3 r d A v e 47th Ave Kezar Duboce 14th St 26th St 16th O’Shaughnessy Valencia Guerrero Doug l a s s 12th 13th Cl a yt on C ent r al Hayes Mange Ocean Ulloa Vicente Wawona Kirkham Law on Moraga Nor ega Rive a Sant ago v ng Ortega C ol e Parnassus Crescen Richardson 1 6th A v e M c D o w e l l C os Over Martin LutherK ng JohnF Kennedy C r ossOve r GreatHigh wa y 41st Ave Octavia Gough Scott Page John F. Kennedy Ellis Polk 17th St 22nd St Chattanooga 7th Ave Masonic Arguello V an N e s s Geary California Fulton Middle Dr West Martin Luther King Jr Dr Overlook Dr Union California Chestnut Geary Mission Church Carl C a s t r o Diamond Sloat Lincoln Way Judah Taraval 20th Ave Sunset B l v d Great Highway Mission Cortland F i ll mo r e Park Presidio Stanyan Market Twin Peaks L a g nu aHond a Portola Alemany Washington Wash i n g not L ncoln Doyle Marina C arendon Arguel l o 15th Ave Market Shotwell La Playa 34th Ave GoldenGate Webster Lyon Divisadero Broderick Burnside Lippard 24th St Sanchez 30th St Bocana Fulton 23rd Ave Je 2nd Ave Hyde Columbus Steiner Gough Clay 19th St 20th St Sanchez Arlington Randall Roanoke 25th St Grand View Fell Baker Valencia Duncan HeightsDiamond Anza Cabrillo Sacramento Scott Pierce Laguna Holly Park Circle Broderick Pierce Noe 12th Ave Lyon Slow Streets Implemented Slow Street Planned Slow Street Map Legend
Executive Summary - Key Findings
Typical median speeds on each of the individual Slow Streets are below the posted speed limit of 25 MPH, and are at or under 20 MPH. However, only 25% (4 out of 16) of corridors meet the SFMTA Board-established average speed target of 15 MPH or less.
Program-wide, typical median vehicle speeds remained below 17 MPH between 2021 and 2023.
Of all vehicles traveling on Slow Streets, fewer than 1% were engaged in egregious speeding (traveling at over 30 MPH).
Collisions
Vehicle Volumes and Speeds
As was described in the 2021 Slow Streets Evaluation Report, decreases in both vehicle speeds and volumes occurred on Slow Streets post-implementation. 2023 data indicates that vehicle speeds and volumes have stayed low on Slow Streets.
Traffic volumes decreased on Slow Street corridors following their Slow Street designation. Despite an increase in volumes between 2021 and 2023, traffic volumes remained low on the 16 Slow Streets, and all but four are meeting the SFMTA-Board established volume target of 1,000 or fewer vehicles per day.
Among the 10 Slow Streets for which the SFMTA has pre-implementation data, a 61% decrease in vehicle volumes was observed following designation.
Vehicle volumes are are at or below the Program target on all but four, or 75% of Slow Streets. On two of these four streets, vehicle volumes are just over the volume target, within a range of 120 cars per day.
Program-wide, a 17% increase in vehicle volumes was observed between 2021 and 2023.
Vehicle speeds decreased following the Slow Streets designation, and continued to fall. However, only four of 16 Slow Streets are meeting the SFMTA Board-established median speed target of 15 miles per hour or less.
Among the 10 Slow Streets for which the SFMTA has pre-implementation data, an 18% reduction of typical median speeds on Slow Streets was observed following designation.
Streets became measurably safer and fewer collisions took place following implementation of the Slow Street designation.
Program-wide, a 48% decrease in collisions was observed on Slow Streets following designation.
Slow Streets saw a larger reduction in collisions than the average street in San Francisco over the same time period. Citywide, collisions went down by 14%, compared with a 48% reduction in collisions throughout the Slow Streets network.
Next Steps
Of the 16 permanent Slow Streets that are evaluated in this report, only three meet the Board-adopted volume and speed targets for Slow Streets.
Four of the Slow Streets evaluated (20th Street, Minnesota Street, Noe Street, and Page Street) will require volume management tools to reduce the number of vehicles on the street to below 1,000 vehicles per day. The Slow Streets team will develop proposed design changes for these four high-volume streets by Summer 2023.
Most Slow Streets (12 of 16) will require speed management tools to slow vehicles on the street to median speeds of 15 MPH. The Slow Streets team will develop traffic calming designs for all streets not meeting Program targets, starting with the three streets (Arlington and Cabrillo streets and Hearst Avenue) with the highest median speeds.

SFMTA | Slow Streets Evaluation 2023 | 4
SFMTA | Slow Streets Evaluation 2023 | 5
Program Goals and Criteria
Through the Slow Streets Program, the SFMTA aims to expand the city’s growing active transportation network and encourage more people of all ages and abilities to travel by low-carbon modes.


The Slow Streets Program's goal is to develop low-stress streets that are safe and comfortable for bicycling, walking, and rolling, provide active transportation connections within neighborhoods, and connect to and/or enhance the City’s recommended bikeway network with a focus on improving residential streets by calming vehicle traffic, making them easier to navigate and friendlier for walking and biking.
To make Slow Streets work, vehicle volumes and speeds need to stay low. The SFMTA is taking a data-driven approach to ensuring Slow Streets meet the following low-stress metrics, using guidance from National Association of City Transportation Officials (NACTO) standards and as directed by the SFMTA Board:
• Vehicle volumes of 1,000 per day or less
• Vehicle speeds of 15 mph or less
This evaluation includes findings on individual Slow Streets and how they are functioning, as well as a Program-wide analysis to provide a more holistic view of how Slow Streets are performing as a whole in serving as low-stress biking, walking and rolling connections.
The 2023 Slow Streets Evaluation Report builds off of the 2021 Slow Streets Evaluation Report, which highlighted some key initial findings about Slow Streets; namely, after implementation, Slow Streets generally saw lower collision rates, higher bicycle and pedestrian use, and they did not negatively impact vehicle traffic on adjacent streets.
This year’s evaluation focuses on the Program’s newly established low-stress targets for vehicle volumes and speeds, and will inform future adjustments to existing Slow Streets designs as needed to meet these targets.
The 2023 Slow Streets Evaluation looks at 16 of the 18 streets that are part of the Slow Streets Program: 12th Avenue, 20th Street, 23rd Avenue, Arlington Street, Cabrillo Street, Clay Street, Golden Gate Avenue, Hearst Avenue, Lake Street, Lyon Street, Minnesota Street, Noe Street, Page Street Sanchez Street, Shotwell Street, and Somerset Street. Cayuga Avenue and 22nd Street were not included in the analysis given that they have not yet been implemented. Data for Cayuga Avenue and 22nd Street will be collected, analyzed and published three to six months post-implementation.
Readers may note that the 2021 Slow Streets Evaluation Report analyzed the 25 COVIDResponse Slow Streets in operation at the time; this 2023 Report analyzes the smaller cohort of permanent Slow Streets approved in December 2022.
SFMTA | Slow Streets Evaluation 2023 | 6 SFMTA | Slow Streets Evaluation 2023 | 7
Evaluation Metrics
The following metrics were used to evaluate each Slow Street:
• Average Daily Traffic Volume
• Typical Median Daily Vehicle Speed
• Collision History
Characteristically, Slow Streets are similar to other residential street facilities like Bicycle Boulevards (streets with low vehicle traffic volumes and speeds, designated and designed to give bicycle travel priority). Per NACTO guidelines, these facilities typically have two major traffic operation conditions that need to be met in order to be considered low-stress:
• Typical Bicycle Boulevard: Vehicle volumes of 1,500 per day or less
• Typical Bicycle Boulevard: Vehicle speeds of 25 mph or less
A street meeting these baseline conditions constitutes a street that is lower-stress, calmer and appropriate to serve as a major pedestrian or bicycle route.
Low vehicle volumes mean the street does not have many vehicles driving through and is quieter. Put differently, this means that people who walk, roll or or bicycle in the street do not encounter or interact with as many moving vehicles.
It's also important for people to drive vehicles slowly; driving at lower speeds provides more time for vehicles to see or be seen by other road users and to stop or yield to those users. Speed is a key predictor of crash survival. When a person is hit by a vehicle traveling 20 MPH there is a 90% chance of survival; at 40 MPH the survival rate drops to 40%.
The SFMTA, with direction from the Board of Directors, has adopted more stringent targets for ensuring that Slow Streets function as true, low-stress streets:
• Slow Streets Program: Vehicle volumes of 1,000 per day or less
• Slow Streets Program: Vehicle speeds of 15 mph or less
These more stringent targets can be met with the addition of traffic calming and volume management treatments on Slow Streets.
Traffic volumes and speeds
Traffic volumes and speeds
Traffic volume and speed data was collected for 48-hour periods on weekdays between January and April 2023. Vehicle volumes are reported for each data collection location and also as corridor-length averages. Similarly, vehicle speeds are provided for each location along a corridor, and a typical median speed for the entire corridor is also shown.
The Program-wide findings aggregate the data collected on the individual Slow Streets to show overall trends in the performance of Slow Streets. Data collected in 2023 is compared to 2021 data to measure the change in traffic safety conditions two years into the Program. There is also data on 11 of the current Slow Streets from before they were implemented and incorporated into the Program, allowing for a high-level understanding of how the Slow Streets Program has broadly affected speed and volumes. Comparing 2021 data to 2023 data allows for a more detailed look into how individual streets and sections are performing, and helps to prioritize efforts to reduce speeds and volumes.
Collisions
Traffic collision data was analyzed to measure traffic safety on Slow Streets. The collision analysis examined reported collisions involving all modes (vehicle, bicycle, pedestrian, and other mobility device) that occurred on the corridor and within 20 feet of intersections on the corridor.
The Program-wide collision findings aggregate the collision data collected on the individual Slow Streets to show overall trends in the performance of Slow Streets. Consistent with the methods used in the 2021 Slow Streets Evaluation Report, a baseline pre-implementation collision rate was established by using collision data from 2017 up until the date of implementation for each Slow Street and compared to the post-implementation collision rates. In comparison to the 2021 Evaluation Report, which analyzed the frequency of collisions on each Slow Street corridor, this analysis normalized collision rates per corridor, accounting for the length of each Slow Street in relation to the frequency of collisions by reporting on a monthly collision rate per mile of Slow Street.
SFMTA | Slow Streets Evaluation 2023 | 8
SFMTA | Slow Streets Evaluation 2023 | 9
Program-wide Results
Vehicle Volumes and Speeds
The table below summarizes the January 2023 vehicle volume and speed data collected on each Slow Street.
On all but four, or 75% of Slow Streets, vehicle volumes are at or below the Program target for vehicle volumes (average daily vehicle volume less than 1,000).
On all 16 measured Slow Streets, typical median vehicle speeds are below the posted speed limit of 25 MPH, and are at or under 20 MPH. However, only 25% (4 out of 16) of corridors meet the SFMTA Board-established speed target of 15 MPH or less. Some level of egregious speeding (vehicles traveling at over 30 MPH) is occurring on all 16 Slow Streets.

SFMTA | Slow Streets Evaluation 2023 | 10
Slow Street Average Daily Traffic (ADT) Typical Median Vehicle Speeds % of Vehicles Traveling >30mph 12th Ave 700 17 MPH 3.0% 20th Street 2240 18 MPH 0.5% 23rd Ave 600 15 MPH 0.7% Arlington 900 19 MPH 0.5% Cabrillo 370 18 MPH 0.4% Clay 550 16 MPH 0.7% Golden Gate 790 17 MPH 2.9% Hearst 460 20 MPH 3.0% Lake 820 17 MPH 0.3% Lyon 480 16 MPH 0.3% Minnesota 1090 15 MPH 0.5% Noe 1690 16 MPH 0.1% Page 1120 16 MPH 0.8% Sanchez 320 13 MPH 0.0% Shotwell 600 14 MPH 0.5% Somerset 490 17 MPH 0.5%
The table below shows Average Daily Traffic (ADT) on Slow Streets before implementation and at two points during implementation (2021 and 2023).
The table below shows typical median speeds on Slow Streets before implementation and at two points during implementation.
Notes:
1 - Cells with a (-) denote instances in which data was not collected
2 - Cells with a (*) denote a street that has been newly added to the Slow Streets Program and has not yet been implemented.
Among the 10 Slow Streets Slow Streets for which the SFMTA has pre-implementation data, a 61% decrease in vehicle volumes was observed following designation.
Vehicle volumes Program-wide increased between 2021 and 2023. In 2021, the average vehicle volume on the 15 Slow Streets (data was not available for 12th Avenue) was 724 vehicles per day, and in 2023 the average volume on those same Slow Streets was 851 vehicles per day – an increase of 17%.
Notes:
1 - Cells with a (-) denote instances in which data was not collected
2 - Cells with a (*) denote a street that has been newly added to the Slow Streets Program and has not yet been implemented.
Among the 10 Slow Streets Slow Streets for which the SFMTA has pre-implementation data, an 18% reduction of typical median speeds on Slow Streets was observed following designation.
Program-wide, typical median vehicle speeds remained below 17 MPH between 2021 and 2023.
SFMTA | Slow Streets Evaluation 2023 | 12 SFMTA | Slow Streets Evaluation 2023 | 13
Slow Street Pre-Implementation 2021 2023 12th Ave 970 - 700 20th Street - 2270 2240 22nd Street* 1250 -23rd Ave 1150 490 600 Arlington - 720 900 Cabrillo 1730 420 370 Cayuga* 1260 -Clay - 550 550 Golden Gate 1770 380 790 Hearst 560 430 460 Lake 5310 610 820 Lyon 970 470 480 Minnesota 1600 980 1090 Noe 3370 1100 1690 Page 3360 670 1120 Sanchez 1750 320 320 Shotwell - 870 600 Somerset - 580 490 Slow Street Pre-Implementation 2021 2023 12th Ave 22 MPH - 17 MPH 20th Street - 17 MPH 17 MPH 22nd Street* 19 MPH -23rd Ave 24 MPH 18 MPH 15 MPH Arlington - 20 MPH 19 MPH Cabrillo 22 MPH 19 MPH 18 MPH Cayuga* 20 MPH -Clay - 16 MPH 16 MPH Golden Gate 23 MPH 12 MPH 17 MPH Hearst 21 MPH - 20 MPH Lake 26 MPH 13 MPH 17 MPH Lyon 18 MPH - 16 MPH Minnesota 21 MPH 19 MPH 15 MPH Noe 17 MPH 17 MPH 16 MPH Page 18 MPH 12 MPH 16 MPH Sanchez 11 MPH 15 MPH 13 MPH Shotwell - 12 MPH 14 MPH Somerset - 21 MPH 17 MPH
The figures below displays the Average Daily Traffic (ADT) and Typical Median Speeds of each Slow Street from before Slow Street designation, in 2021, and in 2023.
The figure below shows the distribution of vehicle speeds collected in January 2023 on each Slow Street.
The boxes displayed in the chart below represent half of, or the 50th percentile of vehicles observed on each Slow Street. Median speeds are represented by the horizontal lines within each box.

The remaining half of vehicles are spread equally above and below the boxes, shown here using vertical lines. Outliers are represented by points above and below the vertical lines.
1 - These figures display data for the 10 Slow Streets for which data is available for all three time periods.
Generally, there are few egregious speeding outliers on Slow Streets, as shown by the number of points above the vertical lines.
Vehicles engaged in egregious speeding (vehicles traveling at over 30 MPH) represented less than 1% of all vehicles observed on Slow Streets in 2023.
0 1000 2000 3000 4000 5000 Pre-Implementation 2021 2023 Vehicles Per Day 20 25 30 Median Vehicle Speeds 5 10 15 20 25 30 Pr… Minnesota Noe Page Sanchez Slow Street Target SFMTA | Slow Streets Evaluation 2023 | 14 SFMTA | Slow Streets Evaluation 2023 | 15
Notes:
5 10 15 20 25 Pr… Cabrillo Golden Gate Hearst Lake Lyon Minnesota Noe Page Sanchez Slow Street Target
Average Daily Traffic
Typical Median Speed Trends by Slow Street Vehicle Speed Distribution by Slow Street 5 10 15 20 25 Pre-Impementation 2021 2023 Median Vehicle Speeds 23rd Ave Cabrillo Golden Gate Hearst Lake Lyon Minnesota Noe Page Sanchez Slow Street Target 2023 5 10 15 20 25 30 Pre-Impementation 2021 2023 Median Vehicle Speeds 23rd Ave Cabrillo
(ADT) Trends by Slow Street
Collisions
The figures below illustrate reductions in collision rates before and after implementation of Slow Streets for the entire city and for the the Slow Streets Program. Collision rates are normalized per month and per mile, accounting for the different implementation dates of Slow Streets, and the length of streets in relation to the frequency of collisions.
Slow
Program-Wide
A greater reduction in collisions occurred on Slow Streets than on the average street in San Francisco over the same time period (48% con Slow Streets compared with 14% citywide).

SFMTA | Slow Streets Evaluation 2023 | 17
-80% -5% 175% -71% 0.00 0.10 0.20 12th Avenue 20th Street 23rd Avenue Arlington Street Cabrillo Street Clay Street Golden Gate Avenue Hearst Avenue Lake Street Lyon Street Before (2017 - 2020) After -48% 0.0 0.1 0.1 0.2 0.2 0.3 0.3 Before (2017-2020) After (2022) Monthly Collision Rate/Mile Slow Streets Network Monthly Collision Rates/Mile (2017-2022) 0.0 0.1 0.2 0.3 0.4 0.5 0.6 0.7 Monthly Collision Rate/Mile 175% -71% -100% -85% -7% -39% -80% -67% 100% Hearst Avenue Lake Street Lyon Street Minnesota Street Noe Street Page Street Sanchez Street Shotwell Street Somerset Street Monthly Collision Rate/Mile Before & After Slow Streets Implementation Before (2017 - 2020) After (2022) -14% 0.0 0.1 0.2 0.3 0.4 0.5 0.6 0.7 2017-2020 2022 Monthly Collision Rate/Mile Citywide Monthly Collision Rate/Mile (2017-2020 - 2022)
Monthly
Slow Streets Implementation) Citywide Monthly Collision Rate/Mile (2017-2020 - 2022) -100% 10% -80% -54% -100% -5% -56% 175% -71% -100% -85% -7% -39% -80% -67% 100% 0.00 0.10 0.20 0.30 0.40 0.50 0.60 0.70 0.80 0.90 12th Avenue 20th Street 23rd Avenue Arlington Street Cabrillo Street Clay Street Golden Gate Avenue Hearst Avenue Lake Street Lyon Street Minnesota Street Noe Street Page Street Sanchez Street Shotwell Street Somerset Street Monthly Collision Rate/Mile Before & After Slow Streets Implementation Before (2017 - 2020) After (2022) -48% 0.0 0.1 0.1 0.2 0.2 0.3 0.3 Before (2017-2020) After (2022) Monthly Collision Rate/Mile Slow Streets Network Monthly Collision Rates/Mile (2017-2022) -14% 0.0 0.1 0.2 0.3 0.4 0.5 0.6 0.7 2017-2020 2022 Monthly Collision Rate/Mile Citywide Monthly Collision Rate/Mile (2017-2020 - 2022) -80% -5% 175% -71% 0.00 0.10 0.20 12th Avenue 20th Street 23rd Avenue Arlington Street Cabrillo Street Clay Street Golden Gate Avenue Hearst Avenue Lake Street Lyon Street Before (2017 - 2020) After (2022) -48% 0.0 0.1 0.1 0.2 0.2 0.3 0.3 Before (2017-2020) After (2022) Monthly Collision Rate/Mile Slow Streets Network Monthly Collision Rates/Mile (2017-2022) 0.0 0.1 0.2 0.3 0.4 0.5 0.6 0.7 Monthly Collision Rate/Mile -80% -5% 175% -71% 0.00 0.10 0.20 12th Avenue 20th Street 23rd Avenue Arlington Street Cabrillo Street Clay Street Golden Gate Avenue Hearst Avenue Lake Street Lyon Street Minnesota Street Noe Street Before (2017 - 2020) After (2022) -48% 0.0 0.1 0.1 0.2 0.2 0.3 0.3 Before (2017-2020) After (2022) Monthly Collision Rate/Mile Slow Streets Network Monthly Collision Rates/Mile (2017-2022) -14% 0.0 0.1 0.2 0.3 0.4 0.5 0.6 0.7 2017-2020 Monthly Collision Rate/Mile Citywide Monthly (2017 -100% 10% -80% -54% -100% -5% -56% 175% -71% -100% -85% -7% -39% -80% -67% 100% 0.00 0.10 0.20 0.30 0.40 0.50 0.60 0.70 0.80 0.90 12th Avenue 20th Street 23rd Avenue Arlington Street Cabrillo Street Clay Street Golden Gate Avenue Hearst Avenue Lake Street Lyon Street Minnesota Street Noe Street Page Street Sanchez Street Shotwell Street Somerset Street Monthly Collision Rate/Mile Before & After Slow Streets Implementation Before (2017 - 2020) After (2022) -48% 0.0 0.1 0.1 0.2 0.2 0.3 0.3 Before (2017-2020) After (2022) Monthly Collision Rate/Mile Slow Streets Network Monthly Collision Rates/Mile (2017-2022) -14% 0.0 0.1 0.2 0.3 0.4 0.5 0.6 0.7 2017-2020 2022 Monthly Collision Rate/Mile Citywide Monthly Collision Rate/Mile (2017-2020 - 2022) -100% -56% 175% 100% 12th 20th Avenue Arlington Clay Lake Lyon Street Minnesota Noe Street Monthly Collision Before Implementation 2020) After Before (2017-2020) Slow 0.0 0.1 0.2 0.3 0.4 0.5 0.6 0.7 2017-2020 Collision (2017-2020 2022) -80% -5% 175% -71% 0.00 0.10 0.20 12th Avenue 20th Street 23rd Avenue Arlington Street Cabrillo Street Clay Street Golden Gate Avenue Hearst Avenue Lake Street Lyon Street Minnesota Street Noe Before (2017 - 2020) After (2022) -48% 0.0 0.1 0.1 0.2 0.2 0.3 0.3 Before (2017-2020) After (2022) Monthly Collision Rate/Mile Slow Streets Network Monthly Collision Rates/Mile (2017-2022) 0.0 0.1 0.2 0.3 0.4 0.5 0.6 0.7 2017-2020 Monthly Collision Rate/Mile Citywide -80% -5% 175% -71% 0.00 0.10 0.20 12th Avenue 20th Street 23rd Avenue Arlington Street Cabrillo Street Clay Street Golden Gate Avenue Hearst Avenue Lake Street Lyon Street Minnesota Street Before (2017 - 2020) After (2022) -48% 0.0 0.1 0.1 0.2 0.2 0.3 0.3 Before (2017-2020) After (2022) Monthly Collision Rate/Mile Slow Streets Network Monthly Collision Rates/Mile (2017-2022) 0.0 0.1 0.2 0.3 0.4 0.5 0.6 0.7 2017-2020 Monthly Collision Rate/Mile -100% 10% -80% -54% -100% -5% -56% 175% -71% -100% -85% -7% -39% -80% -67% 100% 0.00 0.10 0.20 0.30 0.40 0.50 0.60 0.70 0.80 0.90 12th Avenue 20th Street 23rd Avenue Arlington Street Cabrillo Street Clay Street Golden Gate Avenue Hearst Avenue Lake Street Lyon Street Minnesota Street Noe Street Page Street Sanchez Street Shotwell Street Somerset Street Monthly Collision Rate/Mile Before & After Slow Streets Implementation Before (2017 - 2020) After (2022) -48% 0.0 0.1 0.1 0.2 0.2 0.3 0.3 Before (2017-2020) After (2022) Monthly Collision Rate/Mile Slow Streets Network Monthly Collision Rates/Mile (2017-2022) -14% 0.0 0.1 0.2 0.3 0.4 0.5 0.6 0.7 2017-2020 2022 Monthly Collision Rate/Mile Citywide Monthly Collision Rate/Mile (2017-2020 - 2022) -100% 10% -80% -54% -100% -5% -56% 175% -71% -100% -85% -7% -39% -80% -67% 100% 0.00 0.10 0.20 0.30 0.40 0.50 0.60 0.70 0.80 0.90 12th Avenue 20th Street 23rd Avenue Arlington Street Cabrillo Street Clay Street Golden Gate Avenue Hearst Avenue Lake Street Lyon Street Minnesota Street Noe Street Page Street Sanchez Street Shotwell Street Somerset Street Monthly Collision Rate/Mile Before & After Slow Streets Implementation Before (2017 - 2020) After (2022) -48% 0.0 0.1 0.1 0.2 0.2 0.3 0.3 Before (2017-2020) After (2022) Monthly Collision Rate/Mile Slow Streets Network Monthly Collision Rates/Mile (2017-2022) -14% 0.0 0.1 0.2 0.3 0.4 0.5 0.6 0.7 2017-2020 2022 Monthly Collision Rate/Mile Citywide Monthly Collision Rate/Mile (2017-2020 - 2022) -80% -5% 175% -71% 0.00 0.10 0.20 12th Avenue 20th Street 23rd Avenue Arlington Street Cabrillo Street Clay Street Golden Gate Avenue Hearst Avenue Lake Street Before (2017 - 2020) -48% 0.0 0.1 0.1 0.2 0.2 0.3 0.3 Before (2017-2020) After (2022) Monthly Collision Rate/Mile Slow Streets Network Monthly Collision Rates/Mile (2017-2022) 0.0 0.1 0.2 0.3 0.4 0.5 0.6 0.7 Monthly Collision Rate/Mile -80% -5% 175% -71% 0.00 0.10 0.20 12th Avenue 20th Street 23rd Avenue Arlington Street Cabrillo Street Clay Street Golden Gate Avenue Hearst Avenue Lake Street Lyon Street Before (2017 - 2020) After (2022) -48% 0.0 0.1 0.1 0.2 0.2 0.3 0.3 Before (2017-2020) After (2022) Monthly Collision Rate/Mile Slow Streets Network Monthly Collision Rates/Mile (2017-2022) 0.0 0.1 0.2 0.3 0.4 0.5 0.6 0.7 Monthly Collision Rate/Mile 100% -80% -5% 175% -71% 0.00 0.10 0.20 12th Avenue 20th Street 23rd Avenue Arlington Street Cabrillo Street Clay Street Golden Gate Avenue Hearst Avenue Lake Street Before (2017 - 2020) -48% 0.0 0.1 0.1 0.2 0.2 0.3 0.3 Before (2017-2020) After (2022) Monthly Collision Rate/Mile Slow Streets Network Monthly Collision Rates/Mile (2017-2022) 0.0 0.1 0.2 0.3 0.4 0.5 0.6 0.7 Monthly Collision Rate/Mile
Streets
Collision Rate/Mile (Before/After
The figure below charts monthly collision rates per mile before and after Slow Streets implementation (2017-2022) on each Slow Street. Collisions decreased on all but three of the Slow Streets in the network. See the inidividual corridor pages for the total number of collisions per Slow Street, per year.
SFMTA | Slow Streets Evaluation 2023 | 18 SFMTA | Slow Streets Evaluation 2023 | 19
-100% 10% -80% -54% -100% -5% -56% 175% -71% -100% -85% -7% -39% -80% -67% 100% 0.00 0.10 0.20 0.30 0.40 0.50 0.60 0.70 0.80 0.90 12th Avenue 20th Street 23rd Avenue Arlington Street Cabrillo Street Clay Street Golden Gate Avenue Hearst Avenue Lake Street Lyon Street Minnesota Street Noe Street Page Street Sanchez Street Shotwell Street Somerset Street Monthly Collision Rate/Mile Before & After Slow Streets Implementation Before (2017 - 2020) After (2022) -48% 0.3 0.3 Slow Streets Network Monthly Collision Rates/Mile (2017-2022) -14% 0.6 0.7 Rate/Mile Citywide Monthly Collision Rate/Mile (2017-2020 - 2022) Slow Streets Network Monthly Collision Rate/Mile (Before & After Slow Streets Implementation)
Next Steps
Of the sixteen permanent Slow Streets that are evaluated in this report, only three (23rd Avenue, Sanchez Street, and Shotwell Street) meet the Board-adopted volume and speed targets for Slow Streets. The remaining 13 Slow Streets require volume management tools, speed management tools, or both to better meet the adopted targets for low-stress streets. Four of the Slow Streets measured (20th Street, Minnesota Street, Noe Street, and Page Street) will require volume management tools to reduce the number of vehicles on the street to below 1,000 vehicles per day. These tools, like traffic diverters, turn restrictions, and median diverters, make the street less accessible to cut-through traffic and thus reduce vehicle volumes. The Slow Streets team will develop proposed design changes for these four high-volume streets by Summer 2023.
Most Slow Streets (12 of 16, or 75%) will require speed management tools to slow down vehicles on the street to the Board-adopted target of 15 MPH median speeds. Traffic calming treatments like speed cushions, and roadway narrowing treatments like painted safety zones and neckdowns, can slow down vehicles on Slow Streets. The Slow Streets team will develop traffic calming designs for all streets not meeting Program targets, beginning with the three streets (Arlington Street, Cabrillo Street, and Hearst Avenue) that most exceed the 15 MPH typical median speeds.
Moving forward, the project team will also work to expand the Slow Streets Program to include additional streets in the network. New Slow Streets will be identified through a variety of community outreach efforts, including through the development of the Active Communities Plan (SFMTA.com/ActiveCommunities).
- onwards
Collect updated vehicle volume and speed data for each Slow Street corridor.


Develop revised designs for Slow Streets corridors; advance designs through Public Hearing process; implement.
Expand

SFMTA | Slow Streets Evaluation 2023 | 20
SFMTA | Slow Streets Evaluation 2023 | 21 Slow Street Meets Volume Target Meets Speed Target Planned Follow-up 12th Ave Yes No Speed Management (Priority 2) 20th Street No No Volume Management 23rd Ave Yes Yes Continue to Monitor Arlington Yes No Speed Management (Priority 1) Cabrillo Yes No Speed Management (Priority 1) Clay Yes No Speed Management (Priority 3) Golden Gate Yes No Speed Management (Priority 2) Hearst Yes No Speed Management (Priority 1) Lake Yes No Speed Management (Priority 2) Lyon Yes No Speed Management (Priority 3) Minnesota No Yes Volume Management Noe No No Volume Management Page No No Volume Management Sanchez Yes Yes Continue to Monitor Shotwell Yes Yes Continue to Monitor Somerset Yes No Speed Management (Priority 2)
Early 2023 Summer 2023 Late 2023
program: Identify new opportunities for Slow Streets via Active Communities Plan outreach.
12TH AVENUE between Lincoln Way and Lawton Street
District: 7
1.46 mi
Meets Vehicle Volume Target: Yes Meets Vehicle Speed Target: No
12th Avenue Slow Street provides a safe way for schoolchildren to get to school in the Inner Sunset. The Slow Street also creates an active transportation connection between this neighborhood and Golden Gate Park.


Traffic Safety
20TH STREET
between Shotwell Street and Potrero Avenue

No
Collision History
“20th Street traffic safety has greatly improved (speeds are WAY down). It used to be a scary street. Now I love seeing others biking, walking and jogging down the street... Perhaps the best change has been the ease for walking down 20th to Valencia for to go dinners and some shopping. I never went before due to the difficulty parking. Now it's no problem to walk down to pick up lunch!” - Community member
Traffic Safety
Collision History
3 3 2 5 3 6
05101520253035 Miles per Hour (mph) Target Daily Vehicle Speed (<15 mph Median Daily Vehicle Speed 17 050010001500200025003000 Target Daily Vehicle Volume <1,000 ADT) 2240
SFMTA | Slow Streets Evaluation 2023 | 22 SFMTA | Slow Streets Evaluation 2023 | 23 Average Daily Vehicle Volume (ADT)
Length: 1 mi
Vehicle Volume Target:
Meets Vehicle Speed Target:
0 500 1000 1500 2000 2500 3000 0 5 10 15 20 25 30 35
District: 9
Meets
No
05101520253035 Miles per Hour (mph) Target Daily Vehicle Speed (<15 mph) Median Daily Vehicle Speed 17 050010001500200025003000 Target Daily Vehicle Volume (<1,000 ADT 700
Average Daily Vehicle Volume (ADT)
Length:
0 500 1000 1500 2000 2500 3000 0 5 10 15 20 25 30 35
1 3 1 1 1 0 Implemented: 7/20/2021 0 collisions as a Slow Street Implemented: 6/2/2020 10 collisions as a Slow Street 20 MPH 15 MPH between Irving & Judah between Kirkham & Lawton 18 MPH 17 MPH between Folsom & Treat between Florida & Bryant 844 ADT 486 ADT between Irving & Judah between Kirkham & Lawton 2581 ADT 1903 ADT between Folsom & Treat between Florida & Bryant
23RD AVENUE
“The space is much more safe and valuable to the community as a Slow Street.”
ARLINGTON STREET
“Many neighbors and community garden members have said they feel safer from speeding cars when crossing Arlington Street.”
Traffic Safety
Traffic Safety
Collision History
Collision History
SFMTA | Slow Streets Evaluation 2023 | 25 05101520253035 Miles per Hour (mph) Target Daily Vehicle Speed (<15 mph) Median Daily Vehicle Speed 19 050010001500200025003000 Target Daily Vehicle Volume (<1,000 ADT 900
Roanoke Street and Randall Street Average Daily Vehicle Volume (ADT) District: 8 Length: 0.88 mi Meets Vehicle Volume Target: Yes Meets Vehicle Speed Target: No 0 500 1000 1500 2000 2500 3000 0 5 10 15 20 25 30 35
between
- Neighbor on Arlington Street 0 5 1 1 1 1 Implemented: 11/30/2020 2 collisions as a Slow Street 17 MPH 20 MPH between Randall & Fairmount between Mateo & Richland 851 ADT 950 ADT between Randall & Fairmount between Mateo & Richland 05101520253035 Miles per Hour (mph) Target Daily Vehicle Speed (<15 mph Median Daily Vehicle Speed 15 050010001500200025003000 Target Daily Vehicle Volume <1,000 ADT) 600
between Lake Street and Cabrillo Street SFMTA | Slow Streets Evaluation 2023 | 24 Average Daily Vehicle Volume (ADT) District: 2 Length: 1.56 mi Meets Vehicle Volume Target: Yes Meets Vehicle Speed Target: Yes 0 500 1000 1500 2000 2500 3000 0 5 10 15 20 25 30 35
- Community member 0 4 1 0 0 1 Implemented: 6/20/2020 1 collision as a Slow Street 15 MPH 19 MPH between California & Lake between Anza & Balboa 12 MPH between Geary & Clement 328 ADT 610 ADT between California & Lake between Anza & Balboa 862 ADT between Geary & Clement
CABRILLO STREET

between 45th Avenue and 25th Avenue
Distric: 2
Length: 2.58 mi
Meets Vehicle Volume Target: Yes
Meets Vehicle Speed Target: No
“It is much safer to walk and bike on, and cars on intersecting streets are much more aware of pedestrians and bikers. It is also a great venue for recreation, and I've seen so many families out for walks or using chalk to decorate the roads now that it has a slow street designation. I really hope we're able to keep that source of community-building, safe outdoor space moving forward.”
- Community member in the Richnmond neighborhood
Traffic Safety
Average Daily Vehicle Volume (ADT)
CLAY STREET
between Arguello Boulevard and Steiner Street


Meets
“Our street is so much safer and actually brings neighbors together in a safely distanced way. I’ve lived on Clay for over 8 years and rarely saw my neighbors until it became a Slow Street. We are a real community now!”

Traffic Safety
Collision History
Collision History
SFMTA | Slow Streets Evaluation 2023 | 27
05101520253035 Miles per Hour (mph) Target Daily Vehicle Speed (<15 mph) Median Daily Vehicle Speed 16 050010001500200025003000 Target Daily Vehicle Volume (<1,000 ADT 550
Average Daily Vehicle Volume (ADT)
2 Length:
mi
District:
2.6
Vehicle Volume Target: Yes
Vehicle Speed Target:
0 500 1000 1500 2000 2500 3000 0 5 10 15 20 25 30 35
Meets
No
- Neighbor on Clay Street 1 1 3 1 3 1 16 MPH 16 MPH between Arguello & Cherry between Laurel & Walnut 16 MPH between Spruce & Maple 17 MPH 17 MPH 16 MPH between Divisadero & Broderick between Scott & Pierce between Lyon & Presidio 461 ADT 512 ADT between Arguello & Cherry between Laurel & Walnut 631 ADT between Spruce & Maple 427 ADT 601 ADT 576 ADT between Divisadero & Broderick between Scott & Pierce between Lyon & Presidio Implemented: 10/6/2020 4 collisions as a Slow Street
05101520253035 Miles per Hour (mph) Target Daily Vehicle Speed (<15 mph Median Daily Vehicle Speed 18 050010001500200025003000 Target Daily Vehicle Volume <1,000 ADT)
370
SFMTA | Slow Streets Evaluation 2023 | 26
0 500 1000 1500 2000 2500 3000 0 5 10 15 20 25 30 35
5 3 6 2 0 0 Implemented: 10/21/2020 0 collisions as a Slow Street 16 MPH 19 MPH between 43rd & 44th between 35th and 36th 17 MPH between 38th & 39th 17 MPH 20 MPH 19 MPH between 27th & 28th between 25th & 26th between 30th and 31st 380 ADT 438 ADT between 43rd & 44th between 35th and 36th 207 ADT between 38th & 39th 182 ADT 745 ADT 405 ADT between 27th & 28th between 25th & 26th between 30th and 31st
GOLDEN GATE AVENUE
between Parker Street and Broderick Street
Districts: 1, 2, 5
Length: 0.72 mi
Meets Vehicle Volume Target: Yes
Meets Vehicle Speed Target: No
“Having Golden Gate Ave. designated as a Slow Street has been such a wonderful quality of life enhancement for the neighborhood. It's wonderful to see families playing outside, people walking their dogs, jogging, etc. The reduction in traffic noise has been so enjoyable as well. It's a treat to have periods of actual quiet in the midst of this big beautiful city.” - Community member
Traffic Safety
HEARST AVENUE
between Ridgewood Avenue and Baden Street
Collision History
Slow Hearst is an east-west corridor that provides a safe and slow bike-friendly roadway through the Sunnyside neighborhood. The Slow Street provides space for neighbors and school children to gather outdoors, on a street tucked away from the busier roadways around it.


Traffic Safety
Collision History
SFMTA | Slow Streets Evaluation 2023 | 29 05101520253035 Miles per Hour (mph) Target Daily Vehicle Speed (<15 mph) Median Daily Vehicle Speed 20 050010001500200025003000 Target Daily Vehicle Volume (<1,000 ADT 460
Average Daily Vehicle Volume (ADT) District: 7 Length: 1.5 mi
Vehicle Volume Target:
Vehicle Speed
No 0 500 1000 1500 2000 2500 3000 0 5 10 15 20 25 30 35
Meets
Yes Meets
Target:
0 0 0 0 1 1 18 MPH 20 MPH between Gennessee & Foerster between Baden & Congo 397 ADT 514 ADT between Gennessee & Foerster between Baden & Congo Implemented: 7/27/2021 1 collision as a Slow Street 05101520253035 Miles per Hour (mph) Target Daily Vehicle Speed (<15 mph Median Daily Vehicle Speed 17 050010001500200025003000 Target Daily Vehicle Volume <1,000 ADT) 790
SFMTA | Slow Streets Evaluation 2023 | 28
Average Daily Vehicle Volume (ADT)
0 500 1000 1500 2000 2500 3000 0 5 10 15 20 25 30 35
Implemented: 6/20/2020 2 collisions as a Slow Street 0 2 1 2 0 1 21 MPH 18 MPH between Roselyn & Kittredge between Broderick & Baker 13 MPH between Central & Lyon 1358 ADT 409 ADT between Roselyn & Kittredge between Broderick & Baker 531 ADT between Central & Lyon
LAKE STREET
between Arguello Boulevard and 28th Avenue


District: 1
Length: 3.04 mi
Meets Vehicle Volume Target: Yes
Meets Vehicle Speed Target: No
Just south of the Presidio, Slow Lake Street runs for 28 blocks through the Richmond. Once San Francisco's first bike lane, Lake Street quickly became one of San Francisco’s first Slow Streets in 2020. It connects two Slow Streets—Slow 23rd Avenue and Slow Clay Street—and is a critical link in the city’s active transportation network.
Traffic Safety
Collision History
LYON STREET between Turk Street and Haight Street
A north-south Slow Street that connects both sides of the Panhandle, the Lyon Slow Street connects the North of the Panhandle neighborhood with Haight-Ashbury. Slow Lyon Street also connects the Golden Gate Avenue bike lane (and Slow Street) with the Fell Street protected bike lane.

Collision History

SFMTA | Slow Streets Evaluation 2023 | 31 05101520253035 Miles per Hour (mph) Target Daily Vehicle Speed (<15 mph) Median Daily Vehicle Speed 16 050010001500200025003000 Target Daily Vehicle Volume (<1,000 ADT 480
Average Daily Vehicle Volume (ADT) Districts: 5, 2 Length: 1.04 mi
Vehicle Volume Target:
Vehicle Speed Target:
0 500 1000 1500 2000 2500 3000 0 5 10 15 20 25 30 35
Meets
Yes Meets
No
1 2 4 3 1 0 Implemented: 7/7/2021 0 collisions as a Slow Street 16 MPH 16 MPH between McAllister & Fulton between Oak & Page 17 MPH between Grove & Hayes 392 ADT 336 ADT between McAllister & Fulton between Oak & Page 638 ADT between Grove & Hayes 05101520253035 Miles per Hour (mph) Target Daily Vehicle Speed (<15 mph Median Daily Vehicle Speed 17 050010001500200025003000 Target Daily Vehicle Volume <1,000 ADT) 820
SFMTA | Slow Streets Evaluation 2023 | 30
Vehicle Volume (ADT)
Average Daily
0 500 1000 1500 2000 2500 3000 0 5 10 15 20 25 30 35
2 5 5 3 1 1 Implemented: 5/1/2020 4 collisions as a Slow Street 18 MPH 19 MPH between 26th & 27th between 21st & 22nd 17 MPH between 23rd & 24th 16 MPH 18 MPH 19 MPH between 10th & 11th between 5th & 6th between 15th & 16th 17 MPH between 2nd & 3rd 363 ADT 377 ADT between 26th & 27th between 21st & 22nd 495 ADT between 23rd & 24th 566 ADT 935 ADT 785 ADT between 10th & 11th between 5th & 6th between 15th & 16th 1394 ADT between 2nd & 3rd
Traffic Safety
MINNESOTA STREET
between Mariposa Street and 22nd Street
10
NOE STREET
0.88 mi
Meets
Meets
Volume Target: No
Speed Target: Yes
“The slow open street on Minnesota Street brings a sense of community to the neighborhood and calms traffic. It is pleasant and decreases traffic and improves walkability. Also because there are a lack of bike lanes in the Dogpatch it improves bike riding safety for cyclists of all ages (particularly young cyclists and even skateboarders).”

- Community member in the Dogpatch neighborhood
Traffic Safety
Collision History
“I love the Slow Street! It makes the neighborhood feel like an oasis from the city. It's a lovely place to walk and I often find myself going out of my way to walk home on Noe Street because it is a Slow Street.”


Traffic Safety
Collision History
SFMTA | Slow Streets Evaluation 2023 | 33 05101520253035 Miles per Hour (mph) Target Daily Vehicle Speed (<15 mph) Median Daily Vehicle Speed 16 050010001500200025003000 Target Daily Vehicle Volume (<1,000 ADT 1690
Average Daily Vehicle Volume (ADT) District: 8 Length: 0.8 mi Meets Vehicle Volume Target: No Meets Vehicle Speed Target: No 0 500 1000 1500 2000 2500 3000 0 5 10 15 20 25 30 35
between Duboce Avenue and Beaver Street
- Community Member 0 2 2 1 1 0 Implemented: 9/30/2020 2 collisions as a Slow Street 16 MPH 16 MPH between 14th & Duboce between 15th & Henry 1928 ADT 1459 ADT between 14th & Duboce between 15th & Henry 05101520253035 Miles per Hour (mph) Target Daily Vehicle Speed (<15 mph Median Daily Vehicle Speed 15 050010001500200025003000 Target Daily Vehicle Volume <1,000 ADT) 1090
SFMTA | Slow Streets Evaluation 2023 | 32 Average Daily Vehicle Volume (ADT)
District:
Length:
Vehicle
0 500 1000 1500 2000 2500 3000 0 5 10 15 20 25 30 35
Vehicle
4 3 1 1 1 0 Implemented: 10/6/2020 1 collision as a Slow Street 19 MPH 12 MPH between 18th & 19th between 20th & 22nd 1578 ADT 609 ADT between 18th & 19th between 20th & 22nd
PAGE STREET
between Stanyan Street and Octavia Street


SANCHEZ STREET
between 23rd Street and 30th Street
District: 8
Length: 1.54 mi
Meets Vehicle Volume Target: Yes
Meets Vehicle Speed Target: Yes
The Page Slow Street Project extends on Page Street between Stanyan Street to Octavia Boulevard. Page Street is an important corridor for the HaightAshbury, Lower Haight, Hayes Valley, and surrounding neighborhoods. It is is one of the City's most important and popular east-west active-transportation corridors.

Traffic Safety
Noe Valley’s Sanchez Street is one of the city’s most used Slow Streets, with more than 1,000 pedestrians walking on it on a typical weekend day. Slow Sanchez hosts community gatherings and arts events throughout the year, and the sound of children’s laughter can often be heard on the street on evenings after school.

Traffic Safety
Collision History
Collision History
9 8 14 4 7 7
05101520253035 Miles per Hour (mph) Target Daily Vehicle Speed (<15 mph Median Daily Vehicle Speed 13 050010001500200025003000 Target Daily Vehicle Volume <1,000 ADT) 320
SFMTA | Slow Streets Evaluation 2023 | 35 Average Daily Vehicle Volume (ADT)
0 500 1000 1500 2000 2500 3000 0 5 10 15 20 25 30 35
Implemented: 5/20/2020 collision as a Slow Street 14 MPH 12 MPH between 24th & Elizabeth between 28th & Duncan 12 MPH between 26th & Clipper 13 MPH between Day & 29th 565 ADT 174 ADT between 24th & Elizabeth between 28th & Duncan 227 ADT between 26th & Clipper 289 ADT between Day & 29th 1 2 2 1 0 0 SFMTA | Slow Streets Evaluation 2023 | 34
05101520253035 Miles per Hour (mph) Target Daily Vehicle Speed (<15 mph) Median Daily Vehicle Speed 16 050010001500200025003000 Target Daily Vehicle Volume (<1,000 ADT 1120
Average Daily Vehicle Volume (ADT)
District: 5 Length:
Meets Vehicle Volume Target: No Meets Vehicle Speed Target: No 0 500 1000 1500 2000 2500 3000 0 5 10 15 20 25 30 35
3.26 mi
Implemented: 5/1/2020 16 collisions as a Slow Street 16 MPH 14 MPH 18 MPH 17 MPH 1015 ADT 1275 ADT between Clayton & Ashbury between Pierce & Steiner 1396 ADT between Broderick & Divisadero 783 ADT between Webster & Buchanan
between Clayton & Ashbury between Pierce & Steiner between Broderick & Divisadero between Webster & Buchanan
SHOTWELL STREET
between 14th Street and Cesar Chavez Street
District: 9 Length: 2.8 mi
Meets Vehicle Volume Target: Yes
Meets Vehicle Speed Target: Yes
Slow Shotwell, a north-south Slow Street connecting the Mission neighborhood, is a milelong stretch of roadway prioritized for people who are walking, biking and rolling. The Slow Street has slowed down vehicle traffic and reduced cutthrough traffic on this small residential street.
SOMERSET STREET
between Silver Avenue and Woolsey Street
"I love the idea of Somerset becoming a permanent slow street, because it is in front of a park and school. People speed in this neighborhood because of its proximity to a freeway exit."


-Community member in the Portola neighborhood
Collision History
Collision History
05101520253035 Miles per Hour (mph) Target Daily Vehicle Speed (<15 mph Median Daily Vehicle Speed 17 050010001500200025003000 Target Daily Vehicle Volume <1,000 ADT) 490
Traffic Safety
SFMTA | Slow Streets Evaluation 2023 | 37 Average Daily Vehicle Volume (ADT)
District: 9 Length: 1.02 mi
Vehicle Volume Target:
Vehicle Speed Target: No 0 500 1000 1500 2000 2500 3000 0 5 10 15 20 25 30 35
Meets
Yes Meets
Implemented: 6/2/2020 collisions as a Slow Street 19 MPH 16 MPH between Silliman & Silver between Bacon & Wayland 457 ADT 526 ADT between Silliman & Silver between Bacon & Wayland 0 0 0 1 0 2
05101520253035 Miles per Hour (mph) Target Daily Vehicle Speed (<15 mph Median Daily Vehicle Speed 14 050010001500200025003000 Target Daily Vehicle Volume <1,000 ADT) 600
Traffic Safety
SFMTA | Slow Streets Evaluation 2023 | 36
Daily Vehicle Volume (ADT)
Average
0 500 1000 1500 2000 2500 3000 0 5 10 15 20 25 30 35
Implemented: 5/20/2020 3 collisions as a Slow Street 13 MPH 15 MPH between 17th & 18th between 23rd & 24th 14 MPH between 20th & 21st 15 MPH between 14th & 15th 15 MPH between 25th & 26th 834 ADT 673 ADT between 17th & 18th between 23rd & 24th 515 ADT between 20th & 21st 526 ADT between 14th & 15th 445 ADT between 25th & 26th 1 2 4 2 1 2
Conclusion
The Slow Streets Program evolved from a critical component of San Francisco’s pandemic response and recovery to a new avenue for furthering the city’s goals for climate action and active transportation. The positive impact from the initial pandemic-response phase of Slow Streets will continue as what started out as temporary changes becomes a lasting part of the city’s network for active transportation. As of May 2023, 18 Slow Streets make up the permanent Slow Streets network, and other corridors will follow to build out a network that complements protected bikeways citywide.
When the SFMTA Board approved a permanent Slow Streets Program in December 2022, it was established that every Slow Street must meet certain data-driven targets to keep these roadways safe and comfortable for everyone: median vehicle speeds of less than 15 miles per hour (MPH), and average daily vehicle volumes lower than 1,000. The Slow Streets toolkit (SFMTA.com/SlowStreetsToolkit) will be applied to streets not meeting the targets to better control vehicle speeds and volumes. Regular evaluation will continue on Slow Streets to measure progress towards these targets.
The good news is that all but four of the existing Slow Streets corridors are meeting or exceeding the goal of fewer than 1,000 vehicles per day. This indicates that the Slow Streets Program is mostly working well to discourage cut-through traffic on these streets. 20th Street, Minnesota Street, Noe Street, and Page Street will require volume management tools to reduce the number of vehicles on the street to below 1,000 vehicles per day. The Slow Streets team will develop proposed design changes for these four streets by Summer 2023.
On 12 of 16, or 75% of Slow Streets, typical median vehicle speeds are still higher than 15 MPH. This data indicates that it will be essential to focus on traffic calming elements like speed cushions and roadway narrowing to bring speeds down to the established target levels on Slow Streets. The Slow Streets team will develop traffic calming designs for all streets not meeting Program targets, beginning with the three streets (Arlington Street, Cabrillo Street, and Hearst Avenue) that most exceed the 15 MPH typical median speeds.
Moving forward, the project team will work to expand the Slow Streets Program to include additional streets in the network. New Slow Streets will be identified through a variety of community outreach efforts, including through the development of the Active Communities Plan (SFMTA.com/ActiveCommunities).
For more information about the Slow Streets Program, please visit:
SFMTA.com/SlowStreets
Slow Streets Evaluation Report Team:
Shannon Hake, Slow Streets Program Manager, San Francisco Municipal Transportation Agency
Eillie Anzilotti, Public Information Officer, San Francisco Municipal Transportation Agency
Julia Malmo, Transportation Planner
San Francisco Transportation Agency
Jordan Hoy, Transportation Planner
San Francisco Municipal Transportation Agency
Alejo Alvarado, Transportation Planner
San Francisco Municipal Transportation Agency
SFMTA | Slow Streets Evaluation 2022 | 38

