RIVERINE CITY FLOOD VULNERABILITY INDEX
SHIVANI AGARWAL I HUIWON HONG I DEVAKI HANDARCFVI
- Douglas Adams
Geographic Information Systems RCFVI “THE SINGLE RAINDROP NEVER FEELS RESPONSIBLE FOR THE FLOOD”

Worldwide, there is a need to enhance our understanding of vulnerability and to develop methodologies and tools to assess vulnerability. One of the most important goals of assessing coastal flood vulnerability, in particular, is to create a readily understandable link between the theoretical concepts of flood vulnerability and the day-to-day decision-making process and to encapsulate this link in an easily accessible tool.
The Coastal City Flood Vulnerability Index is applied to nine cities around the world, each with a different kind of exposure and with regard to the following system’s components, that is, hydro-geological, socio-economic and politicoadministrative. The index gives a number from 0 to 1, indicating comparatively low or high coastal flood vulnerability, which shows which cities are most in need of further, more detailed investigation for decision-makers.
However, since average global temperatures are already rising and the effects of climate change are becoming palpable around the world, cities also need to focus on adaptation measures in order to strengthen their resiliency and better protect billions of global urbanites due to river flooding. Currently, approximately 21 million people worldwide could be affected by river floods on average each year, and that number could increase to 54 million in 2030 due to climate change and widespread urban development.
Given that cities are the primary drivers of economic growth and are home to over half the world’s population, it’s critical that city leaders are informed about the threats that river flooding poses to their citizens’ health, security, and economic well-being. There is therefore a need for a readily calculated and easily understood method to calculate flood vulnerability in such areas.
The systems approach aims to identify the interactions of different actors or components within certain defined boundaries. The three interdependent subsystems in the coastal vulnerability system are:
• The natural river subsystem (NS), in which the physical, chemical and biological processes take place.
• The socio-economic subsystem (SES), which includes the societal (human) activities related to the use of the natural river system; socio-economic systems are made up of rules and institutions that mediate human use of resources as well as systems of knowledge and ethics that interpret natural systems from a human perspective.
• The administrative and institutional subsystem that includes administration, legislation and regulation, where the decision, planning and management processes take place.
Each of the three subsystems is characterised by its own elements, and it is surrounded within its own environment.
The hydro-geological component does not consider
for
NATURAL SYSTEM
Hydro-geological
(Exposure
Component The hydro-geological component does not consider susceptibility indicators for this method.
SOCIO-ECONOMIC SYSTEM
(+) (-)
Socio-economic Component (Exposure, Susceptibility, Resilience)
INSTITUTIONAL SYSTEM
Politico-administrative Component (Exposure, Susceptibility, Resilience)
Exposure and Susceptibility
Resilience, Adaptation & Coping Capacity
How does one measure vulnerability due to riverine floods?
We are creating a scale to assess flood vulnerability and risk of flooding for riverine cities of India, starting with Pune in the state of Maharashtra. This scale would take into account the vulnerability of the place based on the various natural and hydro-geological factors. Additionally, the efficiency of the scale would be enhanced because of the various social, economic and institutional factors particular to the city. Specifically, we would use population density, income level, awareness and preparedness data, literacy and illiteracy and many other social factors that affect the vulnerability. Most specifically for Pune, we are making sure to give the highest weightage to areas that include informal settlements.
The city of Pune is prone to urban flooding as Mumbai, India. In May 2015, pre-monsoon downpour of 102.6 mm – an 87-year-old all-time record for maximum rainfall in a day in the month threw rail and road traffic out of gear besides causing heavy waterlogging. “Above-normal” rainfall has been flooding the city roads and basements of apartments for the past two years.

Chandra Bhushan, the deputy director of New Delhi’s Centre for Science and Environment (CSE), observed that bad urban planning, encroachment of water bodies, increase in extreme weather events and lack of preparedness resulting in urban flooding was relevant to Pune. “Increased rainfall intensity and urban flooding would become a norm rather than exception unless corrective measures are taken immediately. We will have to protect our water bodies and also be prepared for these events,” he stated.
The direct impact of urban flooding can be easily understood in the city.
Fig.2 Mutha canal wall breaches: Flood situation: Dandekar, Pune, India Pune City Maharashtra Mula Mutha River Pune District
• Pune is one of India’s fastest-growing metropolises, the second largest in the state of Maharashtra and the eighth largest urban agglomeration in India.

• Over the last three decades it has emerged as a thriving hub for the automotive, information technology and education sectors.
• The city attracts a large number of migrants from various parts of the country and from all economic classes, many of whom live in poorly constructed informal settlements or bastis.
• There are 564 slums in the PMC, with a total population of approximately 11.89 lakh. Approximately 40% of the city’s total population resides in these slums.

• The city of Pune is the also the 8th most populous city in India among metropolitan areas. It is also the administrative headquarters of both the Pune division and Pune district.
• Pune has experienced the highest record of growth within a span of 20 years and is known for its traffic density in India.
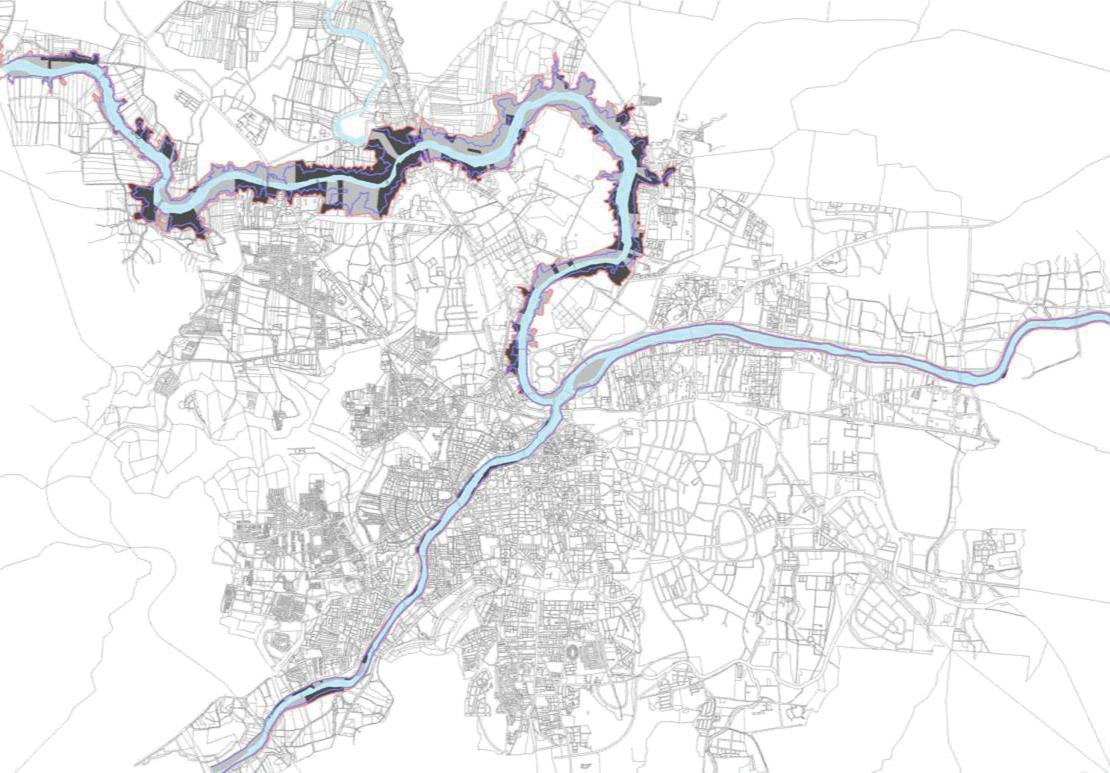
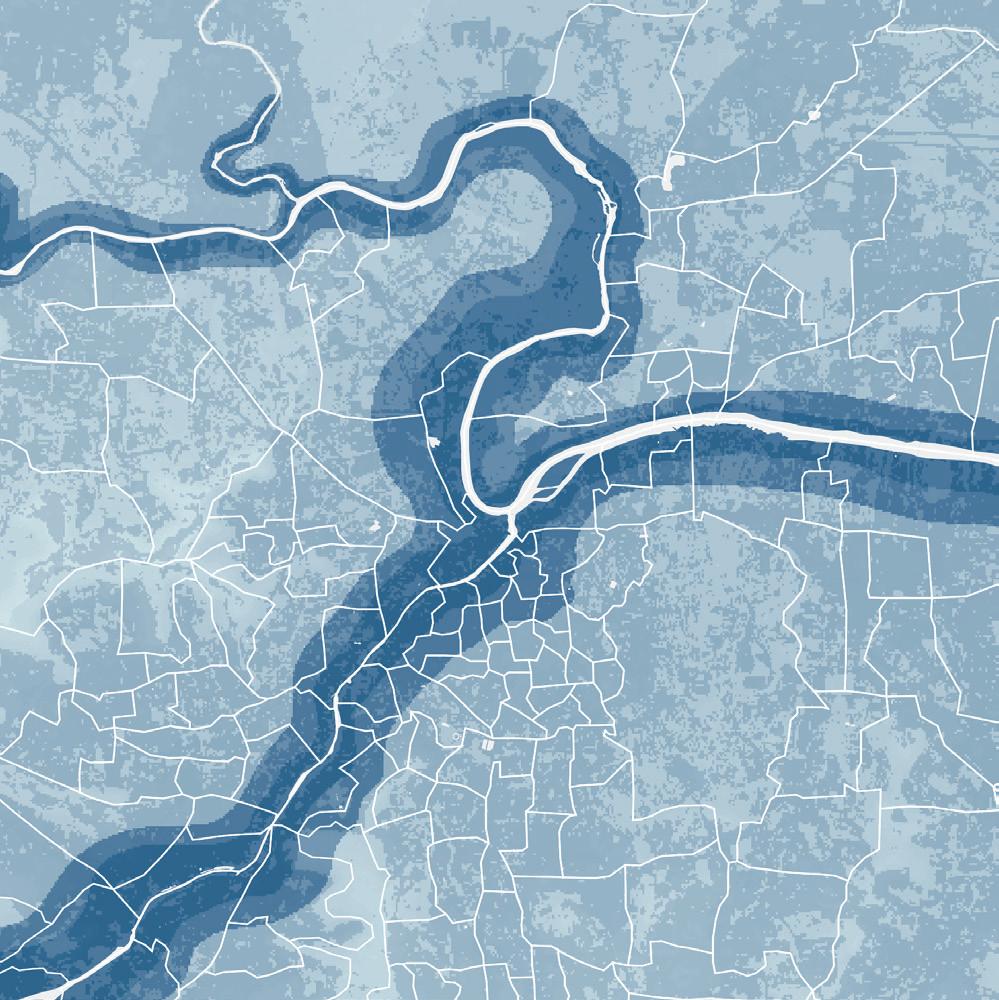
Fig.3 Average Rainfall, Pune, India MitKat. “Pune Flood Risk Information.” MitKat, June 2016, www. mitkatadvisory.com/InsightPdf/Pune-Flood-Information-Jun-2016.pdf. Fig.5 Rivers and Streams, Pune, India Mishra, SSP. “Ground Water Information, Pune District, Maharashtra.” CENTRAL GROUND WATER BOARD, 2009, cgwb.gov.in/District_Profile/ Maharashtra/Pune.pdf. Fig.4 Mutha canal wall breaches: Flood situation: Dandekar, Pune, IndiaThe different data that we have used for the natural factor vulnerability scale are:
• MITKAT Flood Map

• Red and Blue Line Flood Map (just for reference)
The natural factors that have to be included in the vulnerability scale for the hydro-geological or natural physical factors first have to be gathered from the online portals. These pdfs have to be selected based on trusted sources so that the end result do not turn out to be incorrect. Hence, a lot of the data chosen by us has been taken from official website for Pune Government.
• USGS Landsat 2018
• Aster Digital Elevation Model (DEM)
Map showing high risk flood prone areas in Pune based on last few years of flood history. https://www.mitkatadvisory.com/InsightPdf/Pune Flood Information Jun 2016.pdf

(Based on flood history of Pune)
MitKat. “Pune Flood Risk Information.” MitKat, June 2016, www. mitkatadvisory.com/InsightPdf/Pune-Flood-Information-Jun-2016. pdf.
PMC. “Pune Riverfront.” Pune Riverfront, 2016, puneriverfront.com/
Map showing the developed and vacant plots within the Red Line http://puneriverfront.com/
USGS. “Landsat 8 OLI/TIRS C1 Level-1.” Earth Explorer, 2018, earthexplorer.usgs.gov/.
USGS. “Aster Global DEM.” Earth Explorer, 2011, earthexplorer.usgs. gov/.

This map makes use of the previous flood history in Pune to determine high risk flood zone areas.
MitKat. “Pune Flood Risk Information.” MitKat, June 2016, www.mitkatadvisory.com/InsightPdf/Pune-FloodInformation-Jun-2016.pdf.
Make a polygon feature as a rectangle shape to give the extra areas a value of 0.
Erase flooding area polygon feature from the rectangle created with value 0.
This map would be used by us for determining the vulnerability of floods within the hydrogeological factors.
Merge dark blue line, light blue line and the subtracted rectangle to give final values.
1 - reclassified as 0
2 - reclassified as 7
3 - reclassified as 10

USGS. “Landsat 8 OLI/TIRS C1 Level-1.” Earth Explorer, 2018, earthexplorer.usgs.gov/.
R : 3 G : 2 B : 1
USGS. “Landsat 8 OLI/TIRS C1 Level-1.” Earth Explorer, 2018, earthexplorer.usgs.gov/.
False color urban R : 7 G : 6 B : 4

Permeable Area (0) Impermeable Area (3)
Water Wetlands
Farmlands Urban Areas
USGS. “Landsat 8 OLI/TIRS C1 Level-1.” Earth Explorer, 2018, earthexplorer.usgs.gov/.


Elevation

Basin map created from DEM.
Revalued based on the proximity to the river. Weights (2 or 1)


The natural factors that have to be included in the vulnerability scale for the hydro-geological or natural physical factors first have to be gathered from the online portals. These pdfs have to be selected based on trusted sources so that the end result do not turn out to be incorrect. Hence, a lot of the data chosen by us has been taken from official website for Pune Government.
The different data that we have used for the natural factor vulnerability scale are:
• Pune Ward Map
• Pune Land Use Map


• Pune Informal Settlements Map
Mundhe, Nitin, et al. “Assessment of Municipal Solid Waste Management of Pune City Using Geospatial Tools.” International Journal of Computer Applications, vol. 100, no. 10, 2014, pp. 24–32., doi:10.5120/17562-8184.

Digitized map of the Pune ward map using Arc Map and this has been used as an important base map for all the functions carried out further.
PMC. “Land Use Map of PMC.” Revised City Development Plan for Pune - 2041, 2012, pmc.gov.in/sites/default/files/project-glimpses/Draft_City_Development_ Plan_for_Pune_City_2041_Vol-1.pdf.
Digitized map of the Pune ward map using Arc Map and this has been used as an important base map for all the functions carried out further.


The informal settlements map is very important to be considered as a factor to calculate the social vulnerability scale since the poor and low income people who live here in squatters are the most vulnerable since they are unprepared and illiterate. Also, they are the unmapped people on the landuse maps of Indian cities.

Digitized Landuse map of Pune.

But, Informal Settlements which is an effective factor to calculate vulnerability is missing.
Hence, digitize the informal settlements map from an available PDF.
Convert each polygon feature of the Informal Settlements to point features.
Spatially join the points to the Landuse ap that has been digitized.

Therefore, the result is that a lot of the informal settlements are within different land uses that were not marked initially.
Use the Informal Settlements to inform the social factor vulnerability scale.
Lundberg, Mattias K. A., et al. “Location and Welfare in Cities: Impacts of Policy Interventions on the Urban Poor.” Policy Research Working Papers, 2004, doi:10.1596/1813-9450-3318.

10,000 - 15,000 15,000 - 20,000 20,000 - 25,000 25,000 - 30,000 30,000 - 35,000 35,000 - 40,000 40,000 - 45,000 45,000 - 50,000
0 1 2 3 40.5
Miles
But, population within a certain area is a more effective factor to calculate vulnerability.
Hence, add a new field called Ward Area.
Use field calculator to find density which is: Population per Ward / Ward Area.
Finally, Population Density per Ward. Denser along the river edge.
0.00 - 0.005 0.005 - 0.01 0.01 - 0.02 0.02 - 0.03 0.03 - 0.04 0.04 - 0.05 0.05 - 0.07 0.07 - 0.10
0 1 2 3 40.5
Miles
RECLASSIFIED WEIGHTAGE : 0 TO 10
POPULATION DENSITY PER WARD (WITHIN RESIDENTIAL LANDUSE)
0.003 - 0.014 0.014 - 0.025 0.025 - 0.04 0.04 - 0.06 0.06 - 0.084 0.084 - 0.120 0.120 - 0.25 0.25 - 0.5
RESIDENTIAL AREAS PER WARD
RECLASSIFIED WEIGHTAGE : 0 TO 5
UNAWARE POPULATION DENSITY PER WARD (WITHIN RESIDENTIAL LANDUSE)
0.001 - 0.01 0.01 - 0.02 0.02 - 0.1
0.5
1
The cantonment areas shown in the landuse map are the least vulnerable as they these areas are under army control and have high preparedness against any risk, social or physical.

The industrial areas shown in the landuse vulnerable when compared to residential chances of people evacuating with much of less population density.


landuse map are considered to be less residential areas because they have higher much ease and which is also because

The public amenity areas in the landuse map are more vulnerable when compared to cantonments but less compared to industrial and residential zones in the landuse map. This is because it might contain facilities like hospitals, schools and commercial shopping centers.


1. This study is not taking into consideration the effects that other natural disasters have on flood vulnerability of a region. For example, the 1987 flood in Bihar occurred due to a landslide blockage in the region.
2. The analysis did not take into account the man-made structures like dams, bridges and paved areas along the riverfront that exacerbate the problem.
3. The maps that were used for digitizing had projections that were unable to be identified.
4. The area of study was constrained because of the extents of the available flood data.
5. The datasets used in the study are not consistent in terms of the particular time periods they represent.
6. The Modifiable Area Problem will be a limitation while determining the population density to census tract.
7. The study also assumes that climate and pollution would have an impact on the flood vulnerability whether or not it is considered as part of the scale.
8. The Illiteracy rate has been used as a proxy data for awareness/income data.
The social vulnerability scale created can be combined to calculate the vulnerability due to any other natural disaster like Hurricanes or Earthquakes.
In this particular project we assessed vulnerability by combining the social and physical flood vulnerability scales, to get the Riverine City Flood Vulnerability Index that ranges from 0-400. Furthermore, to test our scale we implemented it on the city of Pune, an area prone to urban flooding due to rivers.
Anything above 350 would require immediate attention/ funds from the government.
1. Lundberg, Mattias K. A., et al. “Location and Welfare in Cities: Impacts of Policy Interventions on the Urban Poor.” Policy Research Working Papers, 2004, doi:10.1596/1813-9450-3318.
2. PMC. “Land Use Map of PMC.” Revised City Development Plan for Pune - 2041, 2012, pmc.gov.in/sites/default/ files/project-glimpses/Draft_City_Development_Plan_ for_Pune_City_2041_Vol-1.pdf.
3. Mundhe, Nitin, et al. “Assessment of Municipal Solid Waste Management of Pune City Using Geospatial Tools.” International Journal of Computer Applications, vol. 100, no. 10, 2014, pp. 24–32., doi:10.5120/175628184.
4. USGS. “Aster Global DEM.” Earth Explorer, 2011, earthexplorer.usgs.gov/.
5. USGS. “Landsat 8 OLI/TIRS C1 Level-1.” Earth Explorer, 2018, earthexplorer.usgs.gov/.
6. PMC. “Red and Blue Line Map.” Pune Riverfront, 2016, puneriverfront.com/.
7. Mishra, SSP. “Ground Water Information, Pune District, Maharashtra.” CENTRAL GROUND WATER BOARD, 2009, cgwb.gov.in/District_Profile/Maharashtra/Pune.pdf.
1. MitKat. “Pune Flood Risk Information.” MitKat, June 2016, www.mitkatadvisory.com/InsightPdf/Pune-FloodInformation-Jun-2016.pdf.
2. Mishra, SSP. “Ground Water Information, Pune District, Maharashtra.” CENTRAL GROUND WATER BOARD, 2009, cgwb.gov.in/District_Profile/Maharashtra/Pune.pdf.
3. Rogala, Alexander, et al. “Why Cities Need to Address River Flooding Now.” World Resources Institute, 12 Mar. 2015, www.wri.org/blog/2015/03/why-cities-needaddress-river-flooding-now.
4. Kudale, Devendra. “Mutha Canal Wall Breaches - Flood Situation : Dandekar Bridge, Pune.” YouTube, YouTube, 27 Sept. 2018, www.youtube.com/watch?v=0XvycLI3pWA.
5. TNN. “Experts Reiterate Pune Prone to Urban Flooding - Times of India.” The Times of India, 31 Aug. 2017, timesofindia.indiatimes.com/city/pune/ experts-reiterate-pune-prone-to-urban-flooding/ articleshow/60299029.cms.
6. Center for Communication and Development Studies. “Where Do We Stand - Urban Poverty and Slums in Pune.” Digital Equality, 2017, digitalequality.in/reports/ profile-of-surveyed-settlements/.
7. Balica, S. F., et al. “A Flood Vulnerability Index for Coastal Cities and Its Use in Assessing Climate Change Impacts.” SpringerLink, Springer, 16 June 2012, link.springer.com/ article/10.1007/s11069-012-0234-1#citeas.
“REMEMBER : WHEN DISASTER STRIKES THE TIME TO PREPARE HAS PASSED”
Professor Leah Meisterlin
Professor Grga Basic Fall 2018
Columbia University in the City of New York
GSAPP, MS. Architecture and Urban Design
Shivani Agarwal saa2226@columbia.edu
Huiwon Hong hh2749@columbia.edu
Devaki Handa dh2915@columbia.edu