Condo Report South Beach & Yerba Buena 2022 Q3 Paul Hwang | Ranked #1 in South Beach 415.216.8746 | paul@skyboxrealty.com


Dear Neighbors,
South Beach condo sales declined 43% Q3 to Q2 and 56% YOY 2022 to 2021. Average days on the market nearly doubled to 82 days.. Inventory has swelled to 112 MLS listed units as sales were unable to maintain earlier 2022 momentum. Yerba Buena exhibited similar patterns.
Open House traffic is very slow. It is a buyer’s market once again as we head into the winter months. The crypto crash, equities decline and increasing interest rates have priced the first time buyers out. Interestingly, these buyers have been forced to rent, and rents have increased significantly. The buyer / renter demographic is primarily current South Beach residents.
Primary buildings / units are performing better than secondary and tertiary units. Even so, only well priced units are getting into contract. I expect continued downward pressure on condominium sales for the next two quarters. Something material in the labor and equities market needs to pivot for demand to increase in condominium sales. Of course, this offers a buying opportunity for investors. Owners of tangible assets, such as real estate, will benefit from a rising interest rate environment (eg inflation).
Winter is coming, and now more than ever it is paramount to consider the details of the data when choosing a personalized marketing plan for your individual residence. The Skybox Realty team is on the streets, working everyday in South Beach and can give you real time feedback. I am very proud of the intelligence, diligence and fiduciary nature of our team, who is Ranked #1 in Sales and Leasing once again in 2022. We look forward to being of service to you.
Best Regards, Paul Hwang, Ranked #1 in South Beach | 415.216.8746
This document has been prepared by Skybox Realty for advertising and general informa tion only. Skybox Realty makes no guarantees, representations or warranties of any kind, expressed or implied, regarding the information including, but not limited to, warranties of content, accuracy and reliability. Any interested party should undertake their own inquiries as to the accuracy of the information. Skybox Realty excludes unequivocally all inferred or implied terms, conditions and warranties arising out of this document and excludes all li ability for loss and damages arising there from.
3
Table of Contents
South Beach & Yerba Buena Market Snapshot
The Infinity
Lumina Resales
The Harrison Resales
One Rincon Hill
The Metropolitan Watermark
One Hawthorne
The Brannan
Millennium Tower
72 Townsend Portside
6 - 7 8 - 11 12 - 15 16 - 19 20 - 23 24 - 27 28 - 31 32 - 35 36 - 39 40 - 43 44 - 47 48 - 51
Skybox Realty 2022 Q3 Report All Data From SFARMLS
Paul Hwang | 415.216.8746 | paul@skyboxrealty.com
Bridgeview
Baycrest
The Towers
200 Brannan
2022 Q3 Sales
181 Fremont Mira
The Avery
Four Seasons Residences
One Steuart Lane
Who You Work With Matters
© Skybox Realty Inc, 2022 5 52 - 55 56 - 59 60 - 63 64 - 67 68 - 71 72 - 73 74 - 75 76 - 77 78 - 79 80 - 81 82 - 83
Skybox Realty 2022 Q3 Report All Data From SFARMLS South Beach 2022 Q3 # of Transactions 46 Average Price per Square Foot $1,216 Average Sales Price $1,508,533 Average Days on the Market 82 56% YOY / 43% QOQ 15% YOY / 11% QOQ 1.6% YOY / 1.2% QOQ 71% YOY / 86% QOQ * Does not include new construction. * Median Price $1,302,500
5.9% YOY /
YOY /
$870,000
YOY /
/
© Skybox Realty Inc, 2022 7 Paul Hwang | 415.216.8746 | paul@skyboxrealty.com Yerba Buena 2022 Q3 # of Transactions 16 Average Price per Square Foot $1,039 Average Sales Price $1,259,214 Average Days on the Market 86
30% QOQ 37%
9.3% QOQ 5.9% YOY
6.1% QOQ 13%
95% QOQ * Median Price
All Data From SFARMLS D21C | $1,525,000 (1BR) $1892/sf A8A | $2,199,000 (3BR) $1375/sf D11F | $1,469,000 (2BR) $1115/sf D12H | $1,412,500 (2BR) $1068/sf A4F | $849,000 (1BR) $1025/sf The Infinity D35C | $3,510,000 (3BR) $2027/sf D6A | $1,200,000 (2BR) $1028/sf D18B | $2,395,000 (2BR) $1810/sf D40E | $2,150,000 (2BR) $1359/sf * * * * Listed by Paul
MARKET
SOLD ACTIVE IN CONTRACT
B32G | $2,450,000 (3BR) $1522/sf
B31F | $1,799,000 (2BR) $1360/sf
B30A | $2,200,000 (2BR) $1735/sf
B29F | $1,999,000 (2BR) $1518/sf
B28E | $2,850,000 (3BR) $1697/sf
B24B | $2,150,000 (2BR) $1633/sf
B21A | $1,525,000 (2BR) $1311/sf
B15CD | $4,000,000 (2BR) $1840/sf
B11C | $1,089,000 (1BR) $1346/sf
C6G | $875,000 (1BR)
© Skybox Realty Inc, 2022 9
OFF
C6H | $780,000 (1BR) $1373/sf
B15B | $1,799,000 (2BR) $1366/sf
$1058/sf C4C | $899,000 (1BR) $1103/sf
* * * * * * * * *
All Data From SFARMLS The Infinity # of Transactions 6 ---- YOY / 40% QOQ Average Sales Price $2,236,917 106% YOY / 26% QOQ * Median Price $1,913,250 Q3 Q2 Q1 Q4 Price Per SF MEDIAN $/SF $1500$1400$1300$1200 AVG $/SF $1,294/SF $1,495/SF $1,329/SF $1,432/SF
© Skybox Realty Inc, 2022 11 301 / 333 Main, 318 / 338 Spear Buyer Demographic CASH LOAN UNKNOWN 2022 Q1 2022 Q2 Average $/SF $1,432 Average Days on Market 75 24% YOY / 7.8% QOQ 226% YOY / 108% QOQ 2022 Q3
D35E
D34C
(2BR) $1908/sf
D30A
D26B
D18C
D8H
All Data From SFARMLS Lumina
| $1,025,000 (1BR) $1200/sf
| $2,425,000 (2BR) $1728/sf
| $3,000,000 (2BR) $1908/sf
| $3,500,000 (3BR) $1954/sf C7F | $895,000 (1BR) $973/sf D10E | $1,550,000 (2BR) $1122/sf C8F | $1,000,000 (1BR) $1087/sf D21E | $1,900,000 (2BR) $1375/sf D5B | $1,449,000 (2BR) $1230/sf
| $2,850,000 (2BR) $1911/sf D34A | $3,000,000
| $6,950,000 (4BR) $2584/sf
SOLD ACTIVE IN CONTRACTOFF MARKET
A8C | $1,299,000 (1BR) $1471/sf
A7A | $859,000 (1BR) $1292/sf
A4C | $1,274,000 (1BR) $1220/sf
A4B | $1,795,000 (2BR) $1284/sf
A4I | $1,165,000 (1BR) $1165/sf
B42AB | $5,950,000 (2BR) $2403/sf
B40E | $3,685,000 (3BR) $2066/sf
B32E | $3,575,000 (3BR) $2004/sf
B30E | $3,498,000 (3BR) $1961/sf
B18H | $1,098,000 (1BR) $1290/sf
B11D | $1,099,000 (1BR) $1254/sf
B7E | $1,500,000 (2BR) $1098/sf
B5A | $1,758,000 (2BR) $1285/sf
B4A | $1,868,000 (2BR) $1366/sf
B3B | $1,315,000 (2BR) $1106/sf
© Skybox Realty Inc, 2022 13
All Data From SFARMLS Lumina Q3 Q2 Q1 Q4 Price Per SF # of Transactions 4 56% YOY / 33% QOQ Average Sales Price $1,482,500 32% YOY / 7.4% QOQ * Median Price $1,432,500 MEDIAN $/SF $1500$1400$1300$1200 AVG $/SF $1,419/SF $1,492/SF $1,340/SF $1,192/SF
© Skybox Realty Inc, 2022 15 318 / 338 Main, 333 Beale, 201 Folsom Buyer Demographic Average $/SF $1,192 Average Days on Market 65 12% YOY / 11% QOQ 9.8% YOY / 97% QOQ CASH LOAN UNKNOWN 2022 Q1 2022 Q2 2022 Q3
The Harrison
Indicates Remaining Developer Inventory
46A | $2,750,000 (2BR) $1669/sf
32G | $1,156,000 (1BR) $1525/sf *
All Data From SFARMLS
*
*
SOLD ACTIVE IN CONTRACTOFF MARKET
46C | $2,825,000 (2BR) $1778/sf *
42D | $3,250,000 (3BR) $1667/sf *
40D | $2,750,000 (2BR) $2196/sf *
39E | $2,645,000 (2BR) $2039/sf *
32F | $1,360,000 (1BR) $1639/sf *
16A | $1,050,000 (1BR) $1250/sf
12C | $1,699,000 (2BR) $1321/sf
© Skybox Realty Inc, 2022 17
All Data From SFARMLS The Harrison Resales # of Transactions 0 100% YOY / 100% QOQ Average Sales Price $---100% YOY / 100% QOQ * Median Price $---Q3 Q2 Q1 Q4 Price Per SF MEDIAN $/SF $1450$1350$1250$1150 AVG $/SF $1,319/SF $1,218/SF $1,437/SF
© Skybox Realty Inc, 2022 19 401 Harrison Average $/SF $---Average Days on Market ---Buyer Demographic 100% YOY / 100% QOQ 100% YOY / 100% QOQ CASH LOAN UNKNOWN 2022 Q1 2022 Q2 2022 Q3 No Sales in 2022 Q3
All Data From SFARMLS One Rincon Hill 301 | $1,600,000 (3BR) $1031/sf 1002 | $1,555,000 (2BR) $1188/sf
OFF MARKET
SOLD ACTIVE IN CONTRACT

5202 | $2,900,000 (3BR) $1471/sf
5103 | $2,295,000 (2BR) $1728/sf
4706 | $2,195,000 (2BR) $1773/sf
4205 | $845,000 (1BR) $1190/sf
3908 | $1,298,000 (1BR) $1719/sf
3702 | $2,269,000 (2BR) $1733/sf
3206 | $1,795,000 (2BR) $1450/sf
2903 | $3,095,000 (3BR) $1605/sf
2806 | $2,095,000 (2BR) $1652/sf
2501 | $1,200,000 (1BR) $1434/sf
2005 | $929,000 (1BR) $1308/sf
1008 | $925,000 (1BR) $1225/sf
© Skybox Realty Inc, 2022 21
All Data From SFARMLS One Rincon Hill # of Transactions 2 60% YOY / 60% QOQ Average Sales Price $2,050,000 75% YOY / 56% QOQ * Median Price $2,050,000 Q3 Q2 Q1 Q4 Price Per SF MEDIAN $/SF $1900$1600$1300$1000 AVG $/SF $1,854/SF $1,504/SF $1,251/SF $1,453/SF
© Skybox Realty Inc, 2022 23 425 1st, 489 Harrison Average $/SF $1,453 Average Days on Market 96 Buyer Demographic 12% YOY / 16% QOQ 13% YOY / 92% QOQ CASH LOAN UNKNOWN 2022 Q1 2022 Q2 2022 Q3
All Data From SFARMLS The Metropolitan N1404 | $1,310,000 (2BR) $----/sf N706 | $629,000 (0BR) $1243/sf S404 | $1,175,000 N1102 | $370,742 (1BR) bmr N1906 | $649,000 (0BR) $1283/sf N1503 | $895,000 (1BR) $1255/sf N1201| $1,250,000 (2BR) $1305/sf
© Skybox Realty Inc, 2022 25 SOLD ACTIVE IN CONTRACTOFF MARKET S907 | $1,198,000 (2BR) $1159/sf S1401 | $835,000 (1BR) $1237/sf $1,175,000 (2BR) $1136/sf S1107 | $1,198,000 (2BR) $1159/sf S408 | $700,000 (1BR) $1243/sf
All Data From SFARMLS The Metropolitan # of Transactions 2 75% YOY / 50% QOQ Average Sales Price $1,072,500 4.7% YOY / 33% QOQ * Median Price $1,072,500 Q3 Q2 Q1 Q4 Price Per SF MEDIAN $/SF $1350$1300$1250$1200 AVG $/SF $1,267/SF $1,298/SF $1,340/SF $1,237/SF
© Skybox Realty Inc, 2022 27 333 / 355 1st Average $/SF $1,237 Average Days on Market 58 Buyer Demographic 4.2% YOY / 7.7% QOQ 45% YOY / 222% QOQ CASH LOAN UNKNOWN 2022 Q1 2022 Q2 2022 Q3
Watermark
All Data From SFARMLS
© Skybox Realty Inc, 2022 29 SOLD ACTIVE IN CONTRACTOFF MARKET 18D | $1,895,000 (2BR) $1505/sf 10E | $875,000 (1BR) $1153/sf 21D | $1,899,000 (2BR) $1508/sf 4H | $1,450,000 (2BR) $1249/sf 9A | $1,650,000 (2BR) $1422/sf 17D | $1,750,000 (2BR) $1390/sf
All Data From SFARMLS Watermark # of Transactions 0 ----% YOY / 100% QOQ Average Sales Price $-------% YOY / 100% QOQ * Median Price $1,500,000 Q3 Q2 Q1 Q4 Price Per SF MEDIAN $/SF $1400$1300$1200$1100 AVG $/SF $1,191/SF $1,207/SF
© Skybox Realty Inc, 2022 31 501 Beale Average $/SF $---Average Days on Market ---Buyer Demographic ----% YOY / 100% QOQ ----% YOY / 100% QOQ CASH LOAN UNKNOWN 2022 Q1 2022 Q2 2022 Q3 No Sales in 2022 Q3
All Data From SFARMLS One Hawthorne 4F | $589,000 (1BR) $1205/sf 11D | $875,000 (1BR) $1036/sf
© Skybox Realty Inc, 2022 33 SOLD ACTIVE IN CONTRACTOFF MARKET 19E | $1,350,000 (2BR) $1086/sf 7D | $949,000 (1BR) $1116/sf 17F | $1,598,000 (2BR) $1157/sf 20E | $1,300,000 (2BR) $1046/sf 11G | $1,095,000 (1BR) $1197/sf 15B | $679,000 (1BR) $1217/sf 2J | $619,000 (1BR) $770/sf
All Data From SFARMLS One Hawthorne # of Transactions 2 ---- YOY / 100% QOQ Average Sales Price $959,500 24% YOY / 100% QOQ * Median Price $959,500 Q3 Q2 Q1 Q4 Price Per SF MEDIAN $/SF $1300$1200$1100$1000 AVG $/SF $908/SF $1,211/SF $1,200/SF
© Skybox Realty Inc, 2022 35 1 Hawthorne Average $/SF $908 Average Days on Market 147 Buyer Demographic 17% YOY / 100% QOQ 11% YOY / 100% QOQ CASH LOAN UNKNOWN 2022 Q1 2022 Q2 2022 Q3 No Sales in 2022 Q2
All Data From SFARMLS The Brannan 11A | $940,000 (1BR) $1163/sf 1D | $895,000 (1BR) $1060/sf 2J | $1,550,000 (3BR) $1004/sf 7D | $1,850,000 (2BR) $1560/sf 18J | $1,199,000 (2BR) $1416/sf
© Skybox Realty Inc, 2022 37 SOLD ACTIVE IN CONTRACTOFF MARKET 8C | $1,700,000 (2BR) $1287/sf 18G | $2,250,000 (2BR) $1484/sf 2D | $900,000 (2BR) $767/sf 12D | $1,425,000 (2BR) $1215/sf 3G | $1,040,000 (1BR) $1143/sf 5J | $1,898,000 (2BR) $1241/sf
All Data From SFARMLS The Brannan # of Transactions 3 40% YOY / 25% QOQ Average Sales Price $2,033,000 2.7% YOY / 22% QOQ * Median Price $1,999,000 Q3 Q2 Q1 Q4 Price Per SF MEDIAN $/SF $1500$1400$1300$1200 AVG $/SF $1,332/SF $1,328/SF $1,334/SF $1,253/SF $1,487/SF
© Skybox Realty Inc, 2022 39 219 / 229 / 239 Brannan Average $/SF $1,487 Average Days on Market 91 Buyer Demographic 7.8% YOY / 19% QOQ 21% YOY / 296% QOQ CASH LOAN UNKNOWN 2022 Q1 2022 Q2 2022 Q3
38C | $2,795,000 (2BR) $1288/sf
406 | $1,600,000 (1BR) $980/sf

All Data From SFARMLS Millennium Tower
OFF MARKET
SOLD ACTIVE IN CONTRACT
PH1 | $1,700,000 (2BR) $984/sf
54A | $2,725,000 (2BR) $1007/sf
52B | $6,880,000 (3BR) $2075/sf
47F | $2,198,888 (3BR) $1373/sf
43A | $1,295,000 (2BR) $854/sf
42D | $3,000,000 (3BR) $1537/sf
40A | $1,250,000 (2BR) $824/sf
39B | $1,495,000 (2BR) $905/sf
38D | $1,910,000 (2BR) $978/sf
35A | $1,795,000 (2BR) $1183/sf
28A | $1,255,000 (2BR) $827/sf
21F | $1,990,000 (3BR) $1055/sf
7G | $1,099,000 (2BR) $867/sf
5A | $1,300,000 (2BR) $879/sf
© Skybox Realty Inc, 2022 41

All Data From SFARMLS Millennium Tower # of Transactions 2 ---- YOY / 50% QOQ Average Sales Price $2,317,500 82% YOY / 103% QOQ * Median Price $2,317,500 Q3 Q2 Q1 Q4 Price Per SF MEDIAN $/SF $1100$1000$900$800 AVG $/SF $993/SF $933/SF $804/SF
© Skybox Realty Inc, 2022 43 301 Mission Average $/SF $993 Average Days on Market 57 Buyer Demographic 4.1% YOY / 24% QOQ 61% YOY / 418% QOQ CASH LOAN UNKNOWN 2022 Q1 2022 Q2 2022 Q3 No Sales in 2022 Q1
902 | $2,825,000 (2BR) $1641/sf
807 | $1,749,000 (2BR) $1231/sf
408 | $1,150,000 (1BR) $1144/sf
308 | $988,800 (1BR) $1041/sf
All Data From SFARMLS 72 Townsend
© Skybox Realty Inc, 2022 45 SOLD ACTIVE IN CONTRACTOFF MARKET 504 | $1,350,000 (2BR) $1071/sf
All Data From SFARMLS 72 Townsend # of Transactions 1 Average Sales Price $2,825,000 * Median Price $2,825,000 Q3 Q2 Q1 Q4 Price Per SF MEDIAN $/SF $1700$1500$1300$1100 AVG $/SF 100% YOY / 100% QOQ 179% YOY / 100% QOQ $1,030/SF $1,384/SF $1,641/SF
© Skybox Realty Inc, 2022 47 72 Townsend Average $/SF $1,641 Average Days on Market 105 Buyer Demographic CASH LOAN UNKNOWN 2022 Q1 2022 Q2 2022 Q3 No Sales in 2022 Q2 34% YOY / 100% QOQ 288% YOY / 100% QOQ
All Data From SFARMLS Portside 520 | $1,248,000 (2BR) $1135/sf 620 | $1,195,000 (2BR) $1103/sf
© Skybox Realty Inc, 2022 49 SOLD ACTIVE IN CONTRACTOFF MARKET 519 | $915,000 (1BR) $1059/sf 604 | $549,000 (1BR) $1137/sf 906 | $700,000 (1BR) $1203/sf 720 | $1,348,888 (2BR) $1246/sf 604 | $1,199,000 (2BR) $1117/sf 303 | $825,000 (1BR) $1134/sf
All Data From SFARMLS Portside # of Transactions 2 66% YOY / 100% QOQ Average Sales Price $807,500 5.5% YOY / 4.9% QOQ * Median Price $807,500 Q3 Q2 Q1 Q4 Price Per SF MEDIAN $/SF $1200$1100$1000$900 AVG $/SF $1,098/SF $1,034/SF $1,126/SF $1,098/SF $946/SF $1,098/SF $1,131/SF
© Skybox Realty Inc, 2022 51 403 Main, 38 Bryant Average $/SF $1,131 Average Days on Market 98 Buyer Demographic 1.2% YOY / 20% QOQ 81% YOY / 7.7% QOQ CASH LOAN UNKNOWN 2022 Q1 2022 Q2 2022 Q3
All Data From SFARMLS Bridgeview 607 | $949,000 (2BR) $861/sf 313 | $715,000 (1BR) $806/sf 1408 | $775,000 (1BR) $1117/sf 2106 | $1,214,000 (2BR) $999/sf
© Skybox Realty Inc, 2022 53 SOLD ACTIVE IN CONTRACTOFF MARKET 1401 | $1,100,000 (2BR) $899/sf 702 | $387,450 (1BR) bmr 1214 | $1,475,000 (3BR) $1029/sf 506 | $999,000 (2BR) $963/sf801 | $1,099,998 (2BR) $899/sf 2201 | $1,330,000 (2BR) $1087/sf 2103 | $1,695,000 (2BR) $1578/sf 2004 | $838,000 (1BR) $1007/sf 310 | $719,000 (1BR) $946/sf
All Data From SFARMLS Bridgeview # of Transactions 5 400% YOY / 25% QOQ Average Sales Price $1,039,400 1.1% YOY / 31% QOQ * Median Price $1,100,000 Q3 Q2 Q1 Q4 Price Per SF MEDIAN $/SF $1100$1000$900$800 AVG $/SF $1,094/SF $1,105/SF $916/SF $960/SF
© Skybox Realty Inc, 2022 55 400 Beale Average $/SF $960 Average Days on Market 75 Buyer Demographic 9.6% YOY / 4.8% QOQ 369% YOY / 134% QOQ CASH LOAN UNKNOWN 2022 Q1 2022 Q2 2022 Q3
All Data From SFARMLS Baycrest 720 | $875,000 (1BR) $1098/sf 122 | $367,000 (0BR) $1058/sf 818 | $435,000 (1BR) $1019/sf 125 | $720,000 (1BR) $1452/sf
© Skybox Realty Inc, 2022 57 SOLD ACTIVE IN CONTRACTOFF MARKET 500 | $495,000 (0BR) $1146/sf 113 | $639,000(1BR) $971/sf 110 | $749,000 (2BR) $955/sf
All Data From SFARMLS Baycrest # of Transactions 3 25% YOY / 57% QOQ Average Sales Price $432,333 46% YOY / 36% QOQ * Median Price $435,000 Q3 Q2 Q1 Q4 Price Per SF MEDIAN $/SF $1300$1200$1100$1000 AVG $/SF $1,188/SF $1,044/SF $1,074/SF
© Skybox Realty Inc, 2022 59 201 Harrison Average $/SF $1,074 Average Days on Market 40 Buyer Demographic 9.6% YOY / 2.9% QOQ 44% YOY / 42% QOQ CASH LOAN UNKNOWN 2022 Q1 2022 Q2 2022 Q3
All Data From SFARMLS The Towers 124 | $1,350,000 (2BR) $991/sf 1122 | $1,999,000 (3BR) $1416/sf 713 | $1,475,000 (2BR) $1133/sf
© Skybox Realty Inc, 2022 61 SOLD ACTIVE IN CONTRACTOFF MARKET 1117 | $1,535,000 (3BR) $1087/sf 523 | $1,495,000 (2BR) $1273/sf 716 | $1,500,000 (2BR) $1222/sf
All Data From SFARMLS The Towers # of Transactions 3 40% YOY / ---- QOQ Average Sales Price $1,678,000 11% YOY / 14% QOQ * Median Price $1,535,000 Q2 Q1 Q4 Q3 Price Per SF MEDIAN $/SF $1300$1200$1100$1000 AVG $/SF $1,263/SF $1,200/SF $1,245/SF $1,242/SF
© Skybox Realty Inc, 2022 63 88 King Average $/SF $1,242 Average Days on Market 40 Buyer Demographic .57% YOY / .3% QOQ 90% YOY / 150% QOQ CASH LOAN UNKNOWN 2022 Q1 2022 Q2 2022 Q3
All Data From SFARMLS 200 Brannan 424 | $2,500,000 (2BR) $1289/sf 112 | $1,725,000 (2BR) $1067/sf
© Skybox Realty Inc, 2022 65 SOLD ACTIVE IN CONTRACTOFF MARKET 101 | $999,000 (1BR) $943/sf 425 | $997,000 (1BR) $1021/sf 225 | $820,000 (1BR) $----/sf
All Data From SFARMLS 200 Brannan # of Transactions 2 50% YOY / 33% QOQ Average Sales Price $1,660,000 5.5% YOY / .6% QOQ * Median Price $1,660,000 Q3 Q2 Q1 Q4 Price Per SF MEDIAN $/SF $1150$1050$950$850 AVG $/SF $1,028/SF $1,038/SF $1,094/SF $1,169/SF
© Skybox Realty Inc, 2022 67 200 Brannan Average $/SF $1,169 Average Days on Market 47 Buyer Demographic 3.4% YOY / 6.9% QOQ 4.4% YOY / 38% QOQ CASH LOAN UNKNOWN 2022 Q1 2022 Q2 2022 Q3
2022 Q3 Sales
Address
1 Hawthorne 2J
355 1st 1401
318 Spear 4F
318 Main 4I
425 1st 2501
338 Spear 6A
1 Hawthorne 20E
333 1st 1404
201 Folsom 3B
401 Harrison 32F
338 Spear 12H
338 Main 10E
338 Main 21E
229 Brannan 18J
239 Brannan 18G
301 Main 32G
401 Harrison PH46A
425 1st 5202
401 Harrison 42D
338 Spear 35C
301 Main 15CD
804 675 828 1,000 837 1,167 1,243 1,189 830 1,323 1,382 1,382 1,412 1,516 1,610 1,648 1,971 1,949 1,732 2,174
Skybox Realty 2022 Q3 Report All Data From SFARMLS
BR / BA 1 / 1 1 / 1 1 / 1 1 / 1.5 1 / 1 2 / 2 2 / 2 2 / 2 2 / 2 1 / 1 2 / 2 2 / 2 2 / 2 2 / 2 2 / 2 3 / 2 2 / 2 3 / 3 3 / 3 3 / 3 2 / 2.5 SQFT
* Only showing sold homes in buildings featured in this book. Does not include new construction.
Sale Price
$619,000 $835,000 $849,000 $1,165,000 $1,200,000 $1,200,000 $1,300,000 $1,310,000 $1,315,000 $1,360,000 $1,412,500 $1,550,000 $1,900,000 $1,999,000 $2,250,000 $2,450,000 $2,750,000 $2,900,000 $3,250,000 $3,510,000 $4,000,000
$/SF $769.90 $1,237.04 $1,025.36 $1,165.00 $1,433.69 $1,028.28 $1,045.86 $---$1,105.97 $1,638.55 $1,067.65 $1,121.56 $1,374.82 $1,415.72 $1,484.17 $1,521.74 $1,668.69 $1,471.33 $1,667.52 $2,026.56 $1,839.93
% Sale/List 77.47 98.35 100.00 97.16 96.00 97.64 96.30 97.04 100.00 97.14 96.15 97.18 88.89 100.00 98.04 98.20 92.44 93.70 90.40 95.12 96.97
© Skybox Realty Inc, 2022 69 Paul Hwang | 415.216.8746 | paul@skyboxrealty.com
2022 Q3 Sales cont...
Address
201 Harrison 122
201 Harrison 818
201 Harrison 500
38 Bryant 906
400 Beale 313
200 Brannan 225
400 Beale 2004
403 Main 519N
400 Beale 1401
400 Beale 2106
400 Beale 2201
88 King 716
88 King 1117
301 Mission 38D
88 King 1122
200 Brannan 424
301 Mission 54A
72 Townsend 902
347 427 432 582 887 782 832 864 1,223 1,215 1,223 1,227 1,412 1,952 1,412 1,939 2,706 1,722
Skybox Realty 2022 Q3 Report All Data From SFARMLS
BR / BA 0 / 1 0 / 1 0 / 1 1 / 1 1 / 1 1 / 1 1 / 1 1 / 1 2 / 2 2 / 1.5 2 / 2 2 / 2 2 / 2 2 / 3 3 / 2 2 / 2 2 / 3 2 / 2 SQFT
* Only showing sold homes in buildings featured in this book. Does not include new construction.
Sale Price
$367,000 $435,000 $495,000 $700,000 $715,000 $820,000 $838,000 $915,000 $1,100,000 $1,214,000 $1,330,000 $1,500,000 $1,535,000 $1,910,000 $1,999,000 $2,500,000 $2,725,000 $2,825,000
$/SF
$1,057.64 $1,018.74 $1,145.83 $1,202.75 $806.09 $1,048.59 $1,007.21 $1,059.03 $899.43 $999.18 $1,087.49 $1,222.49 $1,087.11 $978.48 $1,415.72 $1,289.32 $1,007.02 $1,640.53
% Sale/List
94.34 96.88 100.00 96.55 95.46 94.80 98.82 98.92 88.07 97.12 96.73 100.07 99.10 100.58 105.21 92.76 92.37 86.95
© Skybox Realty Inc, 2022 71 Paul Hwang | 415.216.8746 | paul@skyboxrealty.com
All Data From SFARMLS 181 Fremont Architect Heller Manus # in Contract / Sold 48+ # of Units 67 Monthly Absorption 1 Unit
67B
67C
$7,950,000 (3BR) $3225/sf
$5,400,000 (2BR) $3089/sf
63A
62D
$3,438,000 (2BR) $2188/sf
$5,660,000 (3BR) $3007/sf 60A
62A
$4,000,000 (3BR)
58A
$4,900,000 (2BR) $2544/sf
54E
$1,700,000 (1BR) $2179/sf
© Skybox Realty Inc, 2022 73 $4,200,000 (3BR) $2194/sf
|
|
|
|
|
$2028/sf SOLD ACTIVE IN CONTRACT
|
|
|
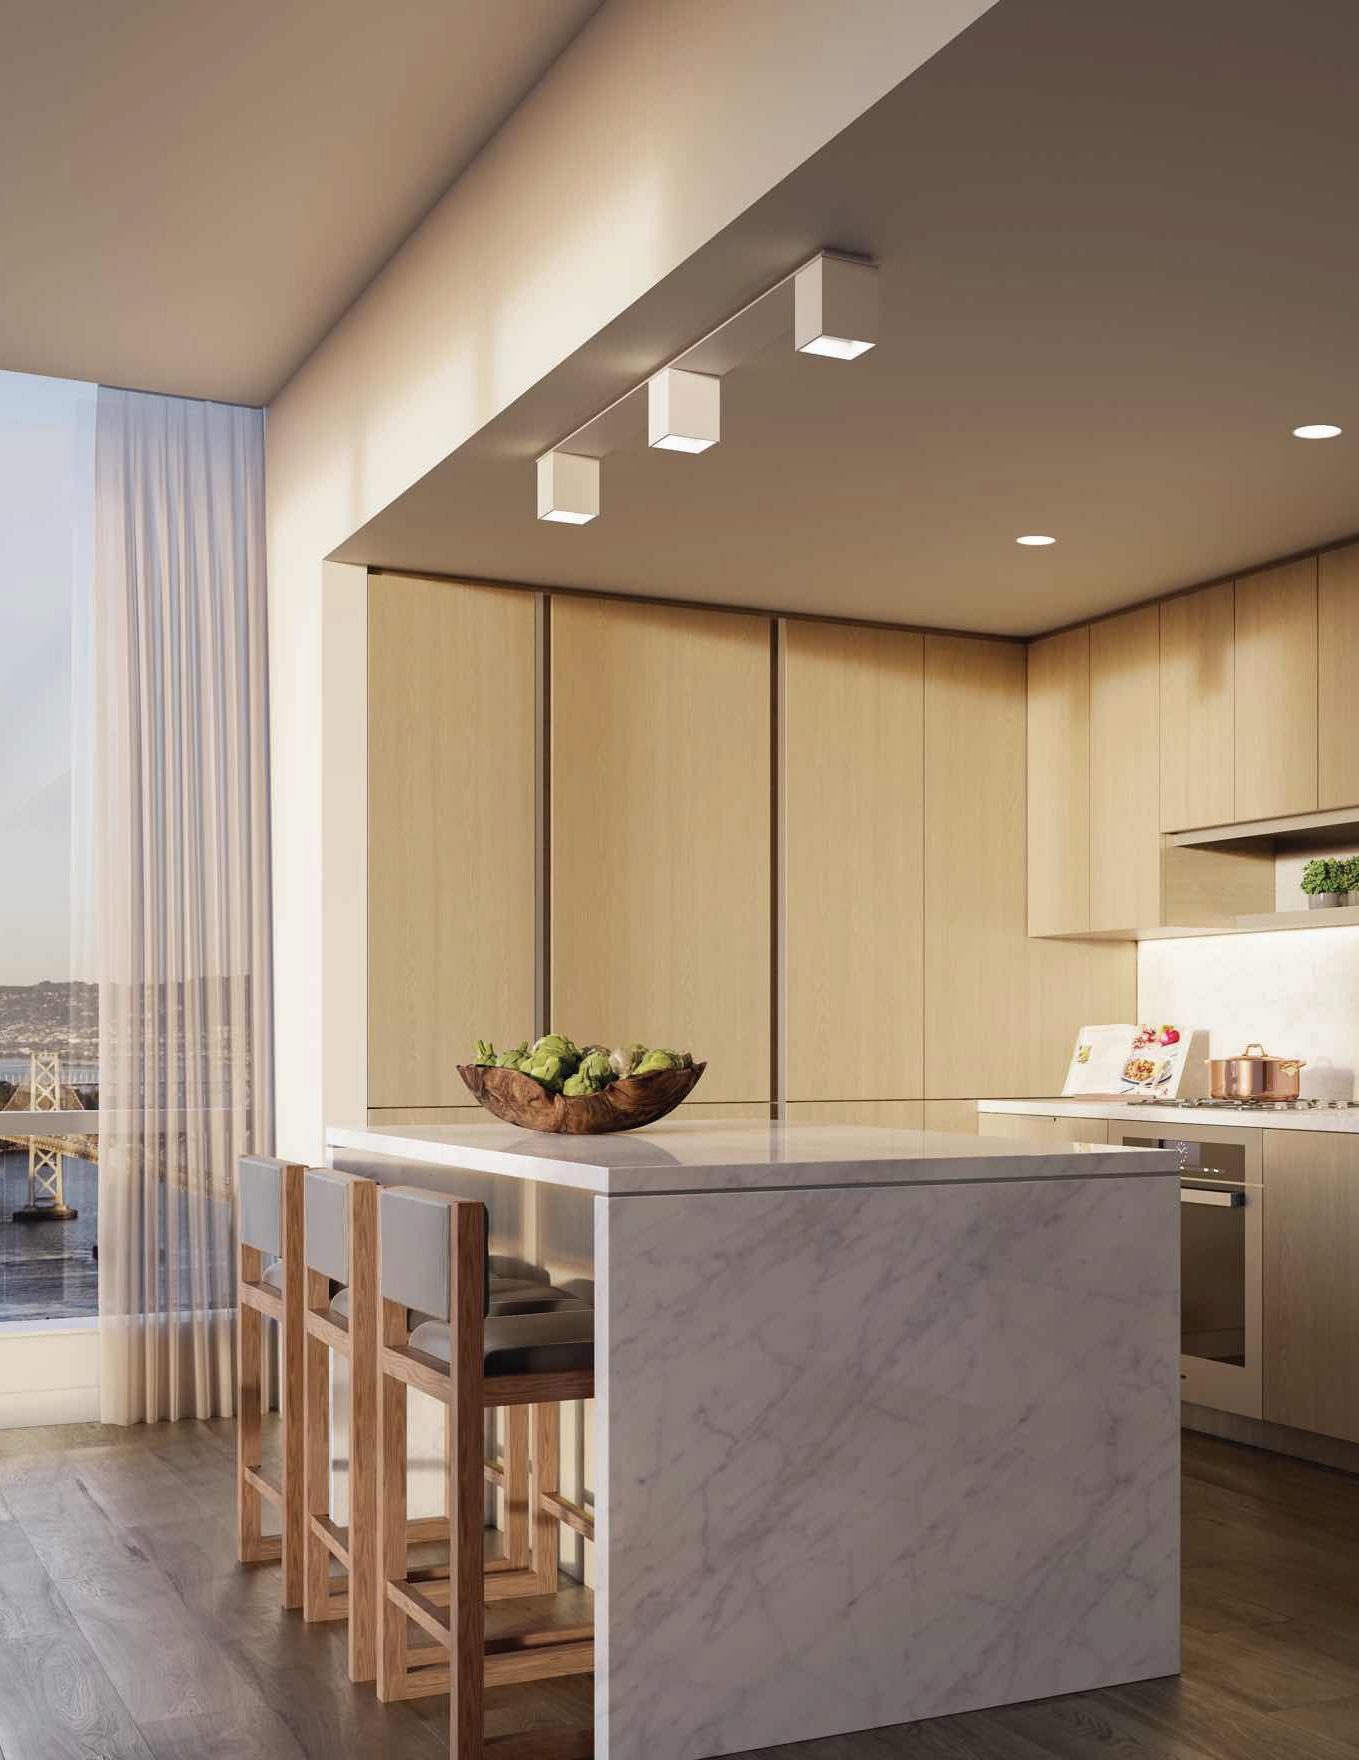
Skybox Realty 2022 Q3 Report All Data From SFARMLS Mira Architect Studio Gang # in Contract / Sold 328+ # of Units 392 Monthly Absorption 6.8 Units
© Skybox Realty Inc, 2022 75 Paul Hwang | 415.216.8746 | paul@skyboxrealty.com
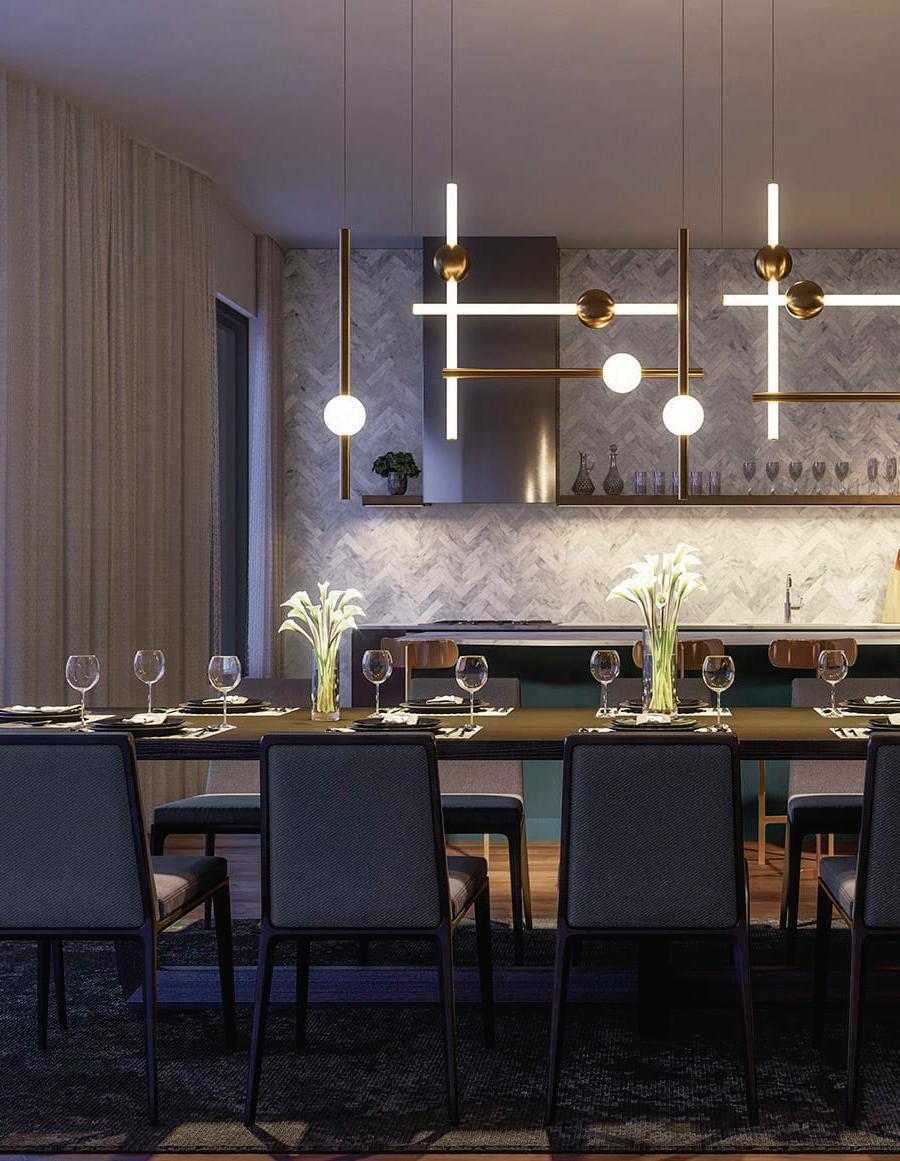
Skybox Realty 2022 Q3 Report All Data From SFARMLS The Avery Architect OMA # in Contract / Sold 59+ # of Units 118 Monthly Absorption 1.2 Units
© Skybox Realty Inc, 2022 77 Paul Hwang | 415.216.8746 | paul@skyboxrealty.com
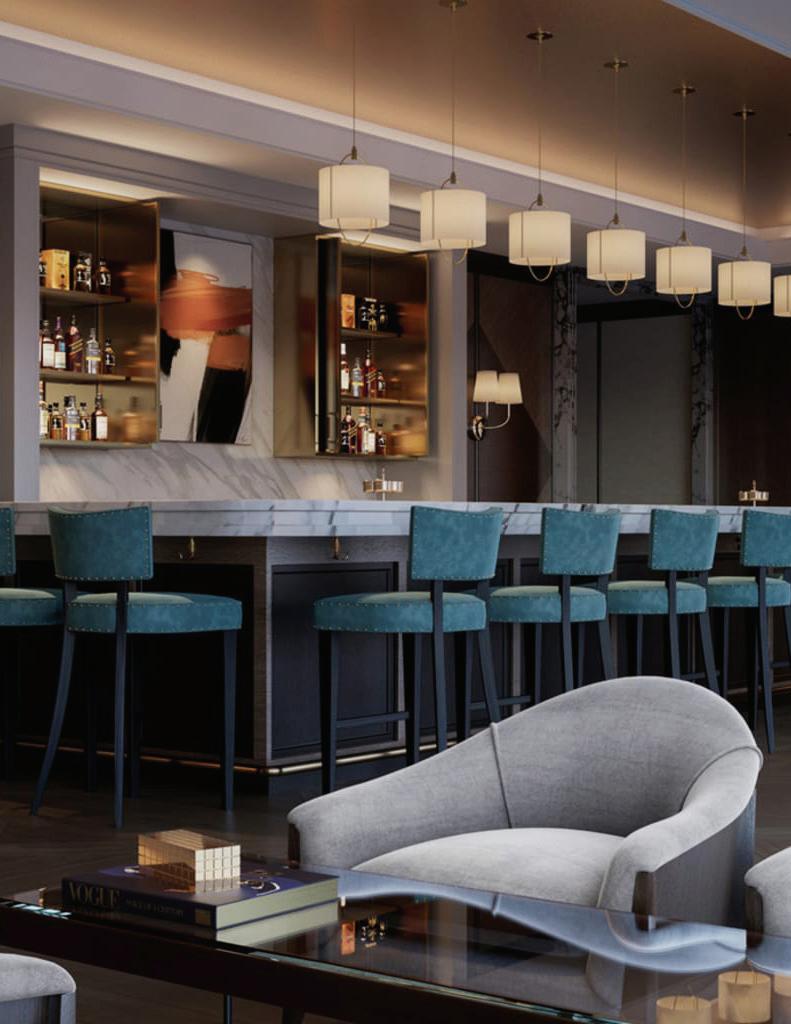
Skybox Realty 2022 Q3 Report All Data From SFARMLS Four Seasons Residences Architect Handel # in Contract / Sold 42+ # of Units 146 Monthly Absorption 2.2 Units
© Skybox Realty Inc, 2022 79 Paul Hwang | 415.216.8746 | paul@skyboxrealty.com
Lane
Skybox Realty 2022 Q3 Report All Data From SFARMLS One Steuart
Architect SOM # of Stories 20 # of Units 120 # Sold 39+
© Skybox Realty Inc, 2022 81 Paul Hwang | 415.216.8746 | paul@skyboxrealty.com
Skybox Realty 2022 Q3 Report All Data From SFARMLS Paul Hwang # of Transactions 52+ Sold Volume $105,136,650 Paul Hwang Activity (2021)
© Skybox Realty Inc, 2022 83 Paul Hwang | 415.216.8746 | paul@skyboxrealty.com Call me to find out how we can feature your off market listing to all of our prospective buyers in our Quarterly Reports! * # of Sold Transactions 34+ Sold Sales Volume $51,677,750+ Paul Hwang Activity (2022 to Date)

Paul Hwang Ranked #1 in South Beach 415.216.8746 | dre 01371169 paul@skyboxrealty.com 流利國語 Click here to subscribe to our digital monthly market updates and quarterly reports.
