
Condo Report South Beach & Yerba Buena 2023 Q1 Paul Hwang | Ranked #1 in South Beach 415.216.8746 | paul@skyboxrealty.com


Dear Neighbors,
2022 ended as an illiquid market for condominium sales in South Beach due to rising interest rates, tech industry layoffs, and an exodus from San Francisco. Traffic in the first quarter picked up as home ownership became slightly more affordable with a decline in interest rates. The number of transactions increased from near zero, but were still at a 63% decline year over year, a 20% decline in average price and a 17% decline in average price per square foot.
Indeed, it seemed like only good deals were selling. The wake of the banking crisis and technology layoffs have put continued pressure on an increasing inventory. Buying conditions for home hunters continue to improve into the Spring selling season. Debt-to-Income ratios for buyers are still considered to be unaffordable.
The bottom line is that income (eg jobs) for the immediate demographic needs to catch up with inflationary pressures of the extremely rapid rise of interest rates. That may take some time.
On the surface the data shows that Yerba Bunea is doing well. On closer examination, the data is skewed by a few outlier sales.
Rents remain strong and steady. It is a highly complicated market and requires a case by case analysis that a macro view point will not provide. Please contact me for your personal real estate needs or questions.
This document has been prepared by Skybox Realty for advertising and general information only. Skybox Realty makes no guarantees, representations or warranties of any kind, expressed or implied, regarding the information including, but not limited to, warranties of content, accuracy and reliability. Any interested party should undertake their own inquiries as to the accuracy of the information. Skybox Realty excludes unequivocally all inferred or implied terms, conditions and warranties arising out of this document and excludes all liability for loss and damages arising there from.
3
Best Regards, Paul Hwang, Ranked #1 in South Beach | 415.216.8746
South Beach & Yerba Buena Market Snapshot
Skybox Realty 2023 Q1 Report All Data From SFARMLS
Table of Contents
Historical Data The Infinity Lumina Resales The Harrison Resales One Rincon Hill The Metropolitan Watermark One Hawthorne The Brannan Millennium Tower 72 Townsend 6 - 7 8 - 9 10 - 13 14 - 17 18 - 21 22 - 25 26 - 29 30 - 33 34 - 37 38 - 41 42 - 45 46 - 49
© Skybox Realty Inc, 2023 5
Hwang | 415.216.8746 | paul@skyboxrealty.com Portside Bridgeview Baycrest The Towers 200 Brannan 2023 Q1 Sales 181 Fremont Mira The Avery Four Seasons Residences One Steuart Lane Who You Work With Matters 50 - 53 54 - 57 58 - 61 62 - 65 66 - 69 70 - 71 72 - 73 74 - 75 76 - 77 78 - 79 80 - 81 82 - 83
Paul
South Beach 2023 Q1
* Does not include new construction.
# of Transactions
29 Average Price per Square Foot
Average Sales Price $1,105,448 Average Days on the Market
* Median Price $1,100,000
$1,035
Skybox Realty 2023 Q1 Report All Data From SFARMLS
YOY
9.6% QOQ
66 63% YOY / ---- QOQ 20% YOY / 19% QOQ 17% YOY / 2.2% QOQ 50%
/
Yerba Buena 2023 Q1
© Skybox Realty Inc, 2023 7 Paul Hwang | 415.216.8746 | paul@skyboxrealty.com
# of Transactions 15 Average Price per Square Foot $1,333 Average Sales Price $2,036,600 Average Days on the Market 174 25% YOY / 25% QOQ 59% YOY / 54% QOQ 11% YOY / 31% QOQ 118% YOY / 164% QOQ * Median Price $1,395,000
Historical Data
* Includes new construction marketed on MLS.
Skybox Realty 2023 Q1 Report All Data From SFARMLS
# of Transactions SOUTH BEACH YERBA BUENA 25 50 75 100 2013 2015 2017 2019 125 150 2021 2023
SOUTH BEACH YERBA BUENA $1M $1.4M $1.8M $2.2M 2013 2015 2017 2019 $2.6M $3M 2021 2023
Average Sales Price
© Skybox Realty Inc, 2023 9 Paul Hwang | 415.216.8746 | paul@skyboxrealty.com Average $/SF SOUTH BEACH YERBA BUENA $1K $1.1K $1.2K $1.3K 2013 2015 2017 2019 $1.4K $1.5K 2021 2023 Average DOM SOUTH BEACH YERBA BUENA 20 40 60 80 2013 2015 2017 2019 100 120 2021 2023
The Infinity
* Listed/Sold by Skybox
D39E | $2,625,000 (2BR) $1659/sf
D18B | $2,085,000 (2BR) $1576/sf
D11F | $1,230,000 (2BR) $933/sf
D3B | $1,150,000 (2BR) $861/sf
A3B | $1,195,000 (2BR) $863/sf
All Data From SFARMLS
*
B29B | $3,250,000 (2BR) $1994/sf
B29F | $1,999,000 (2BR) $1518/sf
B28E | $2,595,000 (3BR) $1470/sf
B15B | $1,699,000 (2BR) $1290/sf
C6H | $780,000 (1BR) $1373/sf
C4C | $899,000 (1BR) $1103/sf
B26C | $1,100,000 (1BR) $1360/sf *
B24B | $1,999,000 (2BR) $1518/sf
* * *
B15E | $1,265,000 (2BR) $1072/sf
B10C | $888,000 (1BR) $1098/sf
C6E | $1,498,888 (2BR) $1097/sf
© Skybox Realty Inc, 2023 11 SOLD ACTIVE IN CONTRACT OFF MARKET
*
*
The Infinity
All Data From SFARMLS
# of Transactions 4 43% YOY / 300% QOQ Average Sales Price $1,100,750 43% YOY / 47% QOQ * Median Price $1,125,000 Q1 Q4 Q3 Q2 Price Per SF MEDIAN $/SF $1500 $1300 $1100 $900 AVG $/SF $1,329/SF $1,432/SF $1,312/SF $1,098
© Skybox Realty Inc, 2023 13 301 / 333 Main, 318 / 338 Spear Buyer Demographic CASH LOAN UNKNOWN 2022 Q3 2022 Q4 Average $/SF $1,098 Average Days on Market 43 27% YOY / 16% QOQ 153% YOY / 59% QOQ 2023 Q1
D34C | $2,600,000 (2BR) $1744/sf
D34A | $2,660,000 (2BR) $1692/sf
D30A | $2,850,000 (2BR) $1813/sf
D30B | $5,680,000 (4BR) $2115/sf
D30E | $2,850,000 (3BR) $1591/sf
D18C | $2,225,000 (2BR) $1586/sf
C7C | $899,000 (1BR) $981/sf
C8F | $990,000 (1BR) $1076/sf
C7F | $895,000 (1BR) $973/sf
All Data From SFARMLS
Lumina
© Skybox Realty Inc, 2023 15 SOLD ACTIVE IN CONTRACT OFF MARKET
B5A | $1,450,000 (2BR) $1060/sf
B40E | $3,250,000 (3BR) $1822/sf
B42AB | $4,995,000 (2BR) $2017/sf
A8C | $1,299,000 (1BR) $1471/sf
B11D | $1,099,000 (1BR) $1254/sf
B2A | $888,000 (0BR) $----/sf
B12F | $1,350,000 (2BR) $1134/sf
B24G | $2,195,000 (2BR) $1567/sf
All Data From SFARMLS Lumina Q1 Q4 Q3 Q2 Price Per SF # of Transactions 1 86% YOY / 67% QOQ Average Sales Price $1,450,000 20% YOY / 15% QOQ * Median Price $1,450,000 MEDIAN $/SF $1350 $1250 $1150 $1050 AVG $/SF $1,340/SF $1,192/SF $1,171/SF $1,060/SF
© Skybox Realty Inc, 2023 17 318 / 338 Main, 333 Beale, 201 Folsom Buyer Demographic Average $/SF $1,060 Average Days on Market 90 29% YOY / 9.5% QOQ 88% YOY / 52% QOQ CASH LOAN UNKNOWN 2022 Q3 2022 Q4 2023 Q1
The Harrison
* Indicates Remaining Developer Inventory
All Data From SFARMLS
46B | $7,799,000 (2BR) $2426/sf 32G | $1,000,000 (1BR) $1319/sf *
46C | $2,695,000 (2BR) $1696/sf *
40D | $2,595,000 (2BR) $2073/sf *
39E | $2,403,300 (2BR) $1853/sf *
32C | $1,960,000 (2BR) $1469/sf *
27A | $1,000,000 (2BR) $1190/sf
25B | $1,795,000 (2BR) $1369/sf
20C | $1,780,000 (2BR) $1334/sf
12C | $1,649,000 (2BR) $1282/sf
4E | $800,000 (1BR) $1132/sf
© Skybox Realty Inc, 2023 19 SOLD ACTIVE IN CONTRACT OFF MARKET
The Harrison Resales
All Data From SFARMLS
# of Transactions 1 75% YOY / ---- QOQ Average Sales Price $1,000,000 21% YOY / 2% QOQ * Median Price $1,00,000 Q1 Q4 Q3 Q2 Price Per SF MEDIAN $/SF $1450 $1350 $1250 $1150 AVG $/SF $1,437/SF $1,167/SF $1,190/SF
© Skybox Realty Inc, 2023 21 401 Harrison Average $/SF $1,190 Average Days on Market 67 Buyer Demographic 2.3% YOY / 2% QOQ 4.3% YOY / 9.5% QOQ CASH LOAN UNKNOWN 2022 Q3 2022 Q4 2023 Q1 No Sales in 2022 Q3
One Rincon Hill
All Data From SFARMLS
4706 | $1,998,000 (2BR) $1614/sf
3403 | $1,945,000 (2BR) $1522/sf
3304 | $825,000 (1BR) $1364/sf
2903 | $2,274,000 (3BR) $1179/sf
2806 | $2,045,000 (2BR) $1613/sf
1008 | $899,000 (1BR) $1192/sf
802 | $1,288,000 (2BR) $984/sf
© Skybox Realty Inc, 2023 23 SOLD ACTIVE IN CONTRACT OFF
MARKET
One Rincon Hill
All Data From SFARMLS
# of Transactions 0 100% YOY / 100% QOQ Average Sales Price $---100% YOY / 100% QOQ * Median Price $2,050,000 Q1 Q4 Q3 Q2 Price Per SF MEDIAN $/SF $1500 $1400 $1300 $1200 AVG $/SF $1,453/SF $1,251/SF $1,333/SF
© Skybox Realty Inc, 2023 25 425 1st, 489 Harrison Average $/SF $---Average Days on Market ---Buyer Demographic 100% YOY / 100% QOQ 100% YOY / 100% QOQ CASH LOAN UNKNOWN 2022 Q3 2022 Q4 2023 Q1 No Sales in 2023 Q1
The Metropolitan
All Data From SFARMLS
N1503 | $825,000 (1BR) $1157/sf N1201| $1,160,000 (2BR) $1211/sf N1507 | $1,375,000 (2BR)
© Skybox Realty Inc, 2023 27 SOLD ACTIVE IN CONTRACT OFF MARKET
S2204 | $949,000 (1BR) $13194/sf
S907 | $1,188,000 (2BR) $1149/sf
S205 | $635,000 (1BR) $944/sf
(2BR) $1447/sf
S806 | $699,000 (1BR) $1012/sf
The Metropolitan
All Data From SFARMLS
# of Transactions 1 50% YOY / 50% QOQ Average Sales Price $635,000 57% YOY / 46% QOQ * Median Price $635,000 Q1 Q4 Q3 Q2 Price Per SF MEDIAN $/SF $1400 $1250 $1100 $950 AVG $/SF $1,237/SF $1,340/SF $1,132/SF $944/SF
© Skybox Realty Inc, 2023 29 333 / 355 1st Average $/SF $944 Average Days on Market 26 Buyer Demographic 25% YOY / 17% QOQ 88% YOY / 41% QOQ CASH LOAN UNKNOWN 2022 Q3 2022 Q4 2023 Q1
All Data From SFARMLS Watermark
© Skybox Realty Inc, 2023 31 SOLD ACTIVE IN CONTRACT OFF MARKET
| $875,000 (1BR)
| $1,799,000 (2BR) $1429/sf
|
(2BR)
| $1,595,000 (2BR) $1267/sf
10E
$1153/sf 21D
9A
$1,599,999
$1422/sf 17D
All Data From SFARMLS Watermark # of Transactions 0 100% YOY / 100% QOQ Average Sales Price $---100% YOY / 100% QOQ * Median Price $---Q1 Q4 Q3 Q2 Price Per SF MEDIAN $/SF $1400 $1300 $1200 $1100 AVG $/SF $1,430/SF $1,191/SF
© Skybox Realty Inc, 2023 33 501 Beale Average $/SF $---Average Days on Market ---Buyer Demographic 100% YOY / 100% QOQ 100% YOY / 100% QOQ CASH LOAN UNKNOWN 2022 Q3 2022 Q4 2023 Q1 No Sales in 2022 Q3 No Sales in 2023 Q1
One Hawthorne
4F | $575,000 (1BR) $1176/sf
All Data From SFARMLS
© Skybox Realty Inc, 2023 35 SOLD ACTIVE IN CONTRACT OFF MARKET
7D | $825,000 (1BR) $971/sf
15B | $615,000 (1BR) $1102/sf
22F | $1,600,000 (2BR) $1155/sf
One Hawthorne
All Data From SFARMLS
# of Transactions 2 100% YOY / 100% QOQ Average Sales Price $1,087,500 32% YOY / 28% QOQ * Median Price $1,087,500 Q1 Q4 Q3 Q2 Price Per SF MEDIAN $/SF $1200 $1100 $1000 $900 AVG $/SF $1,166/SF $908/SF $1,097/SF
© Skybox Realty Inc, 2023 37 1 Hawthorne Average $/SF $1,166 Average Days on Market 104 Buyer Demographic 3.8% YOY / 6.3% QOQ 271% YOY / 82% QOQ CASH LOAN UNKNOWN 2022 Q3 2022 Q4 2023 Q1
The Brannan
18D | $3,495,000 (3BR) $1743/sf
5D | $1,235,000 (2BR) $1058/sf
4J | $1,149,000 (2BR) $1007/sf
2F | $1,749,000 (2BR) $1343/sf
1D | $799,000 (1BR) $947/sf
5E | $1,225,000 (2BR) $1152/sf
All Data From SFARMLS
© Skybox Realty Inc, 2023 39 SOLD ACTIVE IN CONTRACT OFF MARKET
8C | $1,650,000 (2BR) $1249/sf
3G | $920,000 (1BR) $1011/sf
15G | $1,990,000 (2BR) $1285/sf
The Brannan
All Data From SFARMLS
# of Transactions 3 25% YOY / ---- QOQ Average Sales Price $1,411,667 18% YOY / 39% QOQ * Median Price $1,235,000 Q1 Q4 Q3 Q2 Price Per SF MEDIAN $/SF $1500 $1300 $1100 $900 AVG $/SF $1,332/SF $1,487/SF $1,253/SF $941/SF $1,184/SF
© Skybox Realty Inc, 2023 41 219 / 229 / 239 Brannan Average $/SF $1,184 Average Days on Market 30 Buyer Demographic 11% YOY / 26% QOQ 20% YOY / 50% QOQ CASH LOAN UNKNOWN 2022 Q3 2022 Q4 2023 Q1
All Data From SFARMLS
406
23C | $799,000
9D | $578,000
Millennium Tower
| $1,350,000 (1BR) $827/sf
(1BR) $959/sf
(1BR) $851/sf
© Skybox Realty Inc, 2023 43 SOLD ACTIVE IN CONTRACT OFF MARKET 33E | $2,495,000 (2BR) $1456/sf 28A | $1,279,000 (2BR) $843/sf 42D | $2,400,000 (3BR) $1230/sf 14B | $599,000 (1BR) $897/sf 21F | $1,990,000 (3BR) $1055/sf 43A | $1,050,000 (2BR) $692/sf 38C | $2,200,000 (2BR) $1014/sf 39B | $1,395,000 (2BR) $844/sf 54B | $7,750,000 (2BR) $2338/sf 52B | $6,800,000 (3BR) $2051/sf 47F | $1,748,888 (3BR) $1092/sf 20H | $658,000 (1BR) $988/sf 23E | $1,395,000 (2BR) $1228/sf 37C | $2,195,000 (2BR) $1012/sf 4C | $699,000 (1BR) $839/sf 30E | $2,295,000 (2BR) $1339/sf 45C | $2,495,000 (2BR) $1557/sf 50B | $7,250,000 (2BR) $2187/sf

All Data From SFARMLS Millennium Tower # of Transactions 4 100% YOY / 50% QOQ Average Sales Price $3,098,750 100% YOY / 38% QOQ * Median Price $1,797,500 Q1 Q4 Q3 Q2 Price Per SF MEDIAN $/SF $1300 $1100 $900 $700 AVG $/SF $1,222/SF $804/SF $879/SF $993/SF
© Skybox Realty Inc, 2023 45 301 Mission Average $/SF $1,222 Average Days on Market 150 Buyer Demographic 100% YOY / 39% QOQ 100% YOY / 127% QOQ CASH LOAN UNKNOWN 2022 Q3 2022 Q4 2023 Q1
All Data From SFARMLS
807
$1,549,000 (2BR)
408 | $1,049,000 (1BR) $1044/sf
72 Townsend
|
$1090/sf
© Skybox Realty Inc, 2023 47 SOLD ACTIVE IN CONTRACT OFF MARKET
612 | $950,000 (1BR) $1056/sf
All Data From SFARMLS
# of Transactions 0 Average Sales Price $---* Median Price $---Q1 Q4 Q3 Q2 Price Per SF MEDIAN $/SF $1700 $1500 $1300 $1100 AVG $/SF 100% YOY / 100% QOQ 100% YOY / 100% QOQ $1,641/SF $1,026/SF
72 Townsend
© Skybox Realty Inc, 2023 49 72 Townsend Average $/SF $---Average Days on Market ---Buyer Demographic CASH LOAN UNKNOWN 2022 Q3 2022 Q4 2023 Q1 No Sales in 2023 Q1 100% YOY / 100% QOQ 100% YOY / 100% QOQ
All Data From SFARMLS Portside
520 | $1,175,000 (2BR) $1085/sf
© Skybox Realty Inc, 2023 51 SOLD ACTIVE IN CONTRACT OFF MARKET 208 | $515,000 (1BR) $955/sf 619 | $685,000 (1BR) $1169/sf 803 | $1,275,000 (3BR) $938/sf 303 | $660,000 (1BR) $908/sf
All Data From SFARMLS Portside # of Transactions 3 50% YOY / 200% QOQ Average Sales Price $816,667 .02% YOY / 60% QOQ * Median Price $660,000 Q1 Q4 Q3 Q2 Price Per SF MEDIAN $/SF $1200 $1100 $1000 $900 AVG $/SF $1,098/SF $1,131/SF $946/SF $1,098/SF $1,056/SF $1,098/SF $934/SF
© Skybox Realty Inc, 2023 53 403 Main, 38 Bryant Average $/SF $934 Average Days on Market 104 Buyer Demographic 10% YOY / 11% QOQ 42% YOY / 27% QOQ CASH LOAN UNKNOWN 2022 Q3 2022 Q4 2023 Q1
All Data From SFARMLS Bridgeview
2104 | $795,000 (2BR) $956/sf
© Skybox Realty Inc, 2023 55 SOLD ACTIVE IN CONTRACT OFF MARKET 702 | $368,80 (1BR) bmr 2103 | $1,495,000 (2BR) $1392/sf
All Data From SFARMLS Bridgeview # of Transactions 0 100% YOY / 100% QOQ Average Sales Price $---100% YOY / 100% QOQ * Median Price $1,100,000 Q1 Q4 Q3 Q2 Price Per SF MEDIAN $/SF $1100 $1000 $900 $800 AVG $/SF $960/SF $916/SF $852/SF
© Skybox Realty Inc, 2023 57 400 Beale Average $/SF $---Average Days on Market ---Buyer Demographic 100% YOY / 100% QOQ 100% YOY / 100% QOQ CASH LOAN UNKNOWN 2022 Q3 2022 Q4 2023 Q1 No Sales in 2023 Q1
All Data From SFARMLS
Baycrest
912 | $448,000 (0BR) $1049/sf
© Skybox Realty Inc, 2023 59 SOLD ACTIVE IN CONTRACT OFF MARKET 425 | $535,000 (1BR) $935/sf 201 | $439,000 (0BR) $1016/sf
All Data From SFARMLS Baycrest # of Transactions 1 83% YOY / 100% QOQ Average Sales Price $535,000 6.6% YOY / 100% QOQ * Median Price $535,000 Q1 Q4 Q3 Q2 Price Per SF MEDIAN $/SF $1100 $1000 $900 $800 AVG $/SF $1,044/SF $1,074/SF $935/SF
© Skybox Realty Inc, 2023 61 201 Harrison Average $/SF $935 Average Days on Market 0 Buyer Demographic 13% YOY / 100% QOQ 100% YOY / 100% QOQ CASH LOAN UNKNOWN 2022 Q3 2022 Q4 2023 Q1 No Sales in 2022 Q4
The Towers
All Data From SFARMLS
124 | $1,299,000 (2BR) $954/sf
919 | $1,345,000 (2BR) $1091/sf 615 | $1,098,000 (2BR) $974/sf
© Skybox Realty Inc, 2023 63 SOLD ACTIVE IN CONTRACT OFF MARKET
|
1119 | $1,275,000 (2BR) $1144/sf 125
$1,350,000 (2BR) $1076/sf
The Towers
All Data From SFARMLS
# of Transactions 0 100% YOY / 100% QOQ Average Sales Price $---100% YOY / 100% QOQ * Median Price $---Q1 Q4 Q3 Q2 Price Per SF MEDIAN $/SF $1300 $1200 $1100 $1000 AVG $/SF $1,242/SF $1,245/SF $1,072/SF
© Skybox Realty Inc, 2023 65 88 King Average $/SF $---Average Days on Market ---Buyer Demographic 100% YOY / 100% QOQ 100% YOY / 100% QOQ CASH LOAN UNKNOWN 2022 Q3 2022 Q4 2023 Q1 No Sales in 2023 Q1
200 Brannan
All Data From SFARMLS
421 | $1,795,000 (2BR) $964/sf
© Skybox Realty Inc, 2023 67 SOLD ACTIVE IN CONTRACT OFF MARKET 101 | $999,000 (1BR) $849sf 336 | $1,999,000 (2BR) $1000/sf 201 | $1,127,000 (1BR) $979/sf
200 Brannan
All Data From SFARMLS
# of Transactions 1 50% YOY / 33% QOQ Average Sales Price $899,000 5.5% YOY / .6% QOQ * Median Price $899,000 Q1 Q4 Q3 Q2 Price Per SF MEDIAN $/SF $1150 $1050 $950 $850 AVG $/SF $1,120/SF $1,094/SF $849/SF
© Skybox Realty Inc, 2023 69 200 Brannan Average $/SF $849 Average Days on Market 182 Buyer Demographic 3.4% YOY / 6.9% QOQ 4.4% YOY / 38% QOQ CASH LOAN UNKNOWN 2022 Q3 2022 Q4 2023 Q1 No Sales in 2022 Q4
2023 Q1 Sales
Skybox Realty 2023 Q1 Report All Data From SFARMLS
Address 1 Hawthorne 4F 355 1st S205 301 Main 10C 401 Harrison 27A 301 Main 26C 338 Spear 3B 229 Brannan 5E 219 Brannan 5D 301 Main 15E 201 Folsom 5A 1 Hawthorne 22F 219 Brannan 2F 403 Main 208N 201 Harrison 425 38 Bryant 303 200 Brannan 101 301 Mission 43A 403 Main 803N 301 Mission 39B 301 Mission 38C 301 Mission 54B
1 / 1 1 / 1 1 / 1 1 / 1 1 / 1 2 / 2 2 / 2 2 / 2 2 / 2 2 / 2 2 / 2 2 / 2 1 / 1 1 / 1 1 / 1 1 / 2 2 / 2 3 / 2 2 / 2.5 2 / 2.5 2 / 3.5 SQFT 489 673 809 840 809 1,335 1,063 1,167 1,180 1,368 1,385 1,322 539 572 727 1,059 1,517 1,360 1,652 2,170 3,315
BR / BA
* Only showing sold homes in buildings featured in this book. D oes not include new construction.
© Skybox Realty Inc, 2023 71 Paul Hwang | 415.216.8746 | paul@skyboxrealty.com
Sale Price $575,000 $635,000 $888,000 $1,000,000 $1,100,000 $1,150,000 $1,225,000 $1,235,000 $1,265,000 $1,450,000 $1,600,000 $1,775,000 $515,000 $535,000 $660,000 $899,000 $1,050,000 $1,275,000 $1,395,000 $2,200,000 $7,750,000 $/SF $1,175.87 $943.54 $1,097.65 $1,190.48 $1,359.70 $861.42 $1,152.40 $1,058.27 $1,072.03 $1,059.94 $1,153.23 $1,342.66 $955.47 $935.31 $907.84 $848.91 $692.16 $937.50 $844.43 $1,013.82 $2,337.86 % Sale/List 97.62 94.07 92.69 91.07 91.74 105.02 98.08 95.15 105.42 90.74 100.00 101.49 97.35 107.21 88.00 94.73 95.89 94.51 93.31 78.71 90.33
Architect Heller Manus
# of Units 67 Monthly Absorption .9 Unit
# in Contract / Sold 48+
All Data From SFARMLS 181 Fremont
© Skybox Realty Inc, 2023 73
54E | $1,400,000 (1BR) $1795/sf
63C | $2,550,000 (2BR) $2021/sf
SOLD ACTIVE IN CONTRACT
63A | $5,660,000 (3BR) $3007/sf
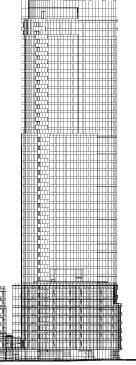
67C | $5,400,000 (2BR) $3089/sf
Studio Gang
Skybox Realty 2023 Q1 Report All Data From SFARMLS Mira Architect
# in Contract / Sold 336+ # of Units 392 Monthly
Absorption 6.5 Units
© Skybox Realty Inc, 2023 75 Paul Hwang | 415.216.8746 | paul@skyboxrealty.com
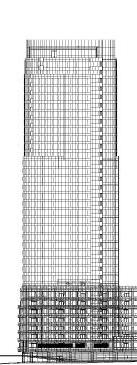
The Avery
Skybox Realty 2023 Q1 Report All Data From SFARMLS
Architect OMA # in Contract / Sold 64+ # of Units 118 Monthly Absorption
1.1 Units
© Skybox Realty Inc, 2023 77 Paul Hwang | 415.216.8746 | paul@skyboxrealty.com
Skybox Realty 2023 Q1 Report All Data From SFARMLS
Architect Handel # in Contract / Sold 42+ # of Units 146 Monthly Absorption 1.1 Units
Four Seasons Residences
© Skybox Realty Inc, 2023 79 Paul Hwang | 415.216.8746 | paul@skyboxrealty.com
One Steuart Lane Architect SOM
# of Units 120
# of Stories
20
# Sold 40+
Skybox Realty 2023 Q1 Report All Data From SFARMLS
© Skybox Realty Inc, 2023 81 Paul Hwang | 415.216.8746 | paul@skyboxrealty.com
Skybox Realty 2023 Q1 Report All Data From SFARMLS
# of Transactions 88+ Sold Volume $161,954,400 Paul Hwang Activity (2021-2023 to Date Sales)
Paul Hwang
© Skybox Realty Inc, 2023 83 Paul Hwang | 415.216.8746 | paul@skyboxrealty.com Call me to find out how we can feature your off market listing to all of our prospective buyers in our Quarterly Reports! * Paul Hwang Leasing Activity 2022 # Leased 40+ 2023 # Leased to Date 17+


Paul Hwang Ranked #1 in South Beach 415.216.8746 | dre 01371169 paul@skyboxrealty.com 流利國語 Click here to subscribe to our digital monthly market updates and quarterly reports.
