


The number of transactions increased by 30% from Q1 to Q2 in South Beach. The average and median prices remained constant year over year, while the average price per square foot increased by 6.9%. Demand for two bedroom units outperformed one bedroom units.
In Yerba Buena, Millennium Tower had 1 transaction in Q2 (zero in Q1) at $663 / sf. The remaining transactions were spread over multiple buildings (Museum Parc, Dow Place, etc.).
Buyer demographics are made up of largely renters and owners already within South Beach & Yerba Buena. Investors are trickling in with a very aggressive pricing mindset. Currently it is a buyer’s market in South Beach & Yerba Buena. Surprisingly rents continue to hold up well.
The Presidential elections are upon us and I anticipate lower interest rates and higher equities that will benefit the housing markets. Typically the election year outperforms the year after elections. If you are thinking of selling in the next 1-2 years, I advise you to complete the transaction in 2024. As a reminder, the formal property tax appeal period begins July 1, 2024. This is your chance to reduce your property taxes if the value of your property has declined.
Best Regards,
Paul Hwang
, Ranked #1 in South Beach | 415.216.8746
This document has been prepared by Skybox Realty for advertising and general information only. Skybox Realty makes no guarantees, representations or warranties of any kind, expressed or implied, regarding the information including, but not limited to, warranties of content, accuracy and reliability. Any interested party should undertake their own inquiries as to the accuracy of the information. Skybox Realty excludes unequivocally all inferred or implied terms, conditions and warranties arising out of this document and excludes all liability for loss and damages arising there from.
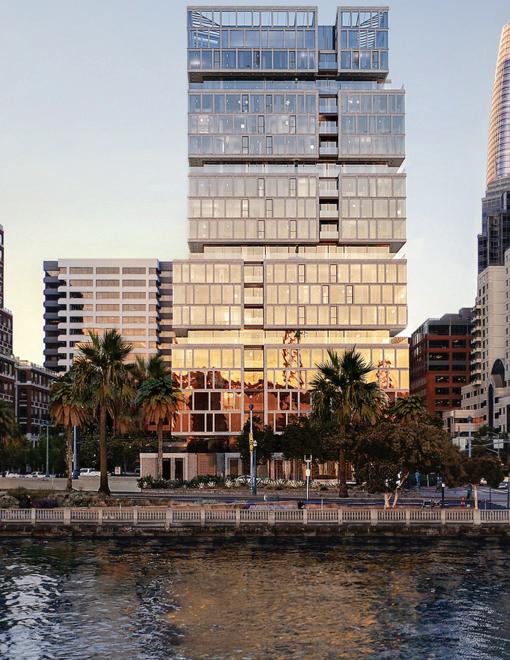
South Beach & Yerba Buena Q2 Snapshot
* Does not include new construction.
# of Transactions
48
7.7% YOY / 30% QOQ
Average Sales Price
$1,488,361
* Median Price $1,295,000
Average Price per Square Foot
$1,186
1.8% YOY / 13% QOQ 6.9% YOY / 7.5% QOQ
Average Days on the Market
61
# of Transactions 17
Average Sales Price
$866,500
Average Price per Square Foot
$839
Average Days on the Market
* Includes new construction marketed on MLS.
| $2,550,000 (3BR) $1731/sf
| $2,995,000 (3BR) $1666/sf
| $3,999,000 (3BR) $2309/sf
| $1,225,000 (2BR) $1050/sf
| $1,179,000 (2BR) $1028/sf
| $865,000 (1BR) $1021/sf
# of Transactions
301 / 333 Main, 318 / 338 Spear
Average Days on Market
Buyer Demographic
D30A | $2,425,000 (2BR) $1543/sf
| $2,500,000 (2BR) $1671/sf
| $1,250,000 (1BR) $1464/sf
| $4,850,000 (3BR) $1808/sf
| $3,095,000 (3BR) $1735/sf
| $2,100,000 (2BR) $1405/sf
| $2,100,000 (2BR) $1535/sf
| $1,525,000 (2BR) $1280/sf
318 / 338 Main, 333 Beale, 201 Folsom
Average $/SF $1,510
Buyer Demographic
Average Days on Market 80
47C | $2,415,000 (2BR) $1520/sf
44A | $3,400,000 (2BR) $2063/sf
43E | $2,485,000 (2BR) $1957/sf
40E | $2,395,000 (2BR) $1888/sf
31C | $2,399,000 (2BR) $1798/sf
6F | $1,498,888 (2BR) $1209/sf
5F | $1,275,000 (2BR) $1027/sf
# of Transactions
50% YOY / 33% QOQ
$1,970,000 22% YOY / 142% QOQ * Median Price $1,970,000

Average $/SF $1,353
Buyer Demographic
Average Days on Market 64
3401 | $1,150,000 (1BR) $1374/sf
1506 | $1,445,000 (2BR) $1167/sf

# of Transactions
200% YOY / 25% QOQ Average Sales Price
$1,536,667 29% YOY / 6% QOQ * Median Price $1,650,000
425 1st, 489 Harrison
Average $/SF
$1,227
Buyer Demographic
Average Days on Market
102
| $775,000 (1BR) $1087/sf
Average $/SF
$1,087
Buyer Demographic
Average Days on Market 18

Average $/SF
$1,019
Buyer Demographic
Average Days on Market 12
Buyer Demographic
| $1,900,000 (2BR) $1671/sf
10D | $1,399,000 (2BR) $1193/sf 9D | $1,368,000 (2BR) $1166/sf
8G | $1,800,000 (2BR) $1187/sf
5D | $1,298,000 (2BR) $1107/sf
| $1,798,000 (2BR) $1186/sf 5A | $1,500,000 (2BR) $1173/sf
# of Transactions
25% YOY / 67% QOQ
Sales Price $1,633,600 21% YOY / 5.3% QOQ * Median Price $1,800,000
219 / 229 / 239 Brannan
Average $/SF $1,335
Buyer Demographic
Average Days on Market 20

GPA | $14,000,000 (2BR) $2795/sf
PHD | $4,495,000 (2BR) $2016/sf
52B | $6,500,000 (3BR) $1961/sf
49B | $7,000,000 (2BR) $2112/sf
46F | $1,000,000 (2BR) $663/sf
41B | $1,750,000 (2BR) $1059/sf
40E | $1,690,000 (2BR) $986/sf
34F | $1,495,000 (2BR) $923/sf
28A | $1,099,000 (2BR) $724/sf
18E | $950,000 (2BR) $865/sf
10C | $1,525,000 (2BR) $963/sf
8J | $800,000 (2BR) $663/sf
3F | $1,298,000 (1BR) $704/sf


Buyer Demographic
807 | $1,380,000 (2BR) $1131/sf
| $898,000 (1BR) $1055/sf
| $1,295,000 (2BR) $1005/sf
601 | $862,000 (1BR) $1094/sf
401 | $799,000 (1BR) $1014/sf

# of Transactions
Average Sales Price $1,121,000 * Median Price $1,121,000 Q2 Q1 Q4 Q3
Average $/SF $1,113 Average Days on Market
Buyer Demographic
of Transactions
403 Main, 38 Bryant
Average $/SF $933
Buyer Demographic
Average Days on Market 136
Transactions
Average $/SF
Buyer Demographic
Average Days on Market
813 | $699,000 (2BR) $950/sf
710 | $748,000 (2BR) $939/sf
312 | $450,000 (0BR) $1054/sf
Transactions
Buyer Demographic
904 | $1,395,000 (2BR) $1195/sf
# of Transactions
Average $/SF $1,463
Buyer Demographic
Average Days on Market 31
# of Transactions
67% YOY / 100% QOQ Average Sales Price
$2,920,000 87% YOY / 100% QOQ * Median Price $2,920,000
200 Brannan
Average $/SF
$1,164
Average Days on Market 25
501 Beale 16E
1 Hawthorne 6G
333 1st N1503
333 Main 7C
229 Brannan 2G
501 Beale 10G
301 Main 21A
425 1st 906
301 Main 22E
239 Brannan 9D
301 Main 3B
401 Harrison 9C
301 Main 15B
201 Folsom 22F
425 1st 2703
425 1st 4306
318 Main 7K
239 Brannan 8G
239 Brannan 18E
201 Folsom 29C
219 Brannan 8D
401 Harrison 47C
338 Main 30A
SQFT 759 852 713 815 885 1,037 1,163 1,238 1,180 1,173 1,822 1,286 1,317 1,191 1,278 1,238 1,520 1,516 1,137 1,495 1,347 1,589 1,572
* Only showing sold homes in buildings featured in this book. Does not include new construction or bmrs.
$720,000
$775,000
$775,000
$778,300
$900,000
$1,130,000
$1,290,000
$1,300,000
$1,325,000
$1,368,000
$1,507,500
$1,525,000
$1,570,000
$1,600,000
$1,650,000
$1,660,000
$1,705,000
$1,800,000
$1,900,000
$2,100,000
$2,200,000
$2,415,000
$2,425,000 $/SF $948.62 $909.62
$1,086.96 $954.97
$1,016.95
$1,089.68
$1,109.20
$1,050.08
$1,122.88
$1,166.24
$827.39
$1,185.85
$1,192.10
$1,343.41
$1,291.08
$1,340.87
$1,121.71
$1,187.34
$1,671.06
$1,404.68
$1,633.26 $1,519.82 $1,542.62
Address
338 Spear 39E
201 Folsom 29A
201 Folsom 37E
301 Main 26AB
201 Folsom 33B
400 Beale 609
201 Harrison 720
301 Mission 8J
72 Townsend 601
403 Main 111N
400 Beale 1806
72 Townsend 807
88 King 1409
200 Brannan 232
SQFT 1,582 1,568 1,784 2,480 2,683 725 797 1,207 788 1,196 1,215 1,220 1,090 2,508
* Only showing sold homes in buildings featured in this book. Does not include new construction or bmrs. Sale Price
$2,550,000
$2,550,000
$3,070,000
$3,325,000
$4,850,000
$675,000
$706,000
$800,000
$862,000
$950,000
$1,100,000
$1,380,000
$1,595,000
$2,920,000
$1,611.88 $1,626.28
$1,720.85 $1,340.73
$1,807.68
$931.03
$885.62
$662.80
$1,093.91
$794.31
$905.35
$1,131.15
$1,463.30
$1,164.27
68B | $12,995,000 (2BR) $3991/sf
65D | $2,900,000 (2BR) $1865/sf
60C | $1,995,000 (2BR) $1581/sf
60D | $2,995,000 (2BR) $1806/sf
59A | $3,995,000 (2BR) $2109/sf
54H | $899,000 (1BR) $1443/sf
54L | $1,045,000 (1BR) $1802/sf
# in Contract / Sold
378+
# of Units 392 Monthly Absorption
6.8 Units
# of Units 118 Monthly Absorption
# in Contract / Sold 68+
.9 Units
# of Units
# in Contract / Sold
42+
146 Monthly Absorption
1.1 Units
# of Units
# of Stories
# Sold
45+
Paul Hwang Activity (2021-2024 Sales)
# of Transactions
112+
Sold Volume
$201,706,900
Paul Hwang | 415.216.8746 | paul@skyboxrealty.com
Call me to find out how we can feature your off market listing to all of our prospective buyers in our Quarterly Reports!
Paul Hwang Leasing Activity