THE SLIFER REPORT


2 0 2 3 MIDYEA R FRO N T RA N GE REA L ESTATE MA RK ET
SOURCE Soldresidential andlandpropertieswithinrespectivemarkets January1,2023- July1,2023 Sourceof areamarket datainthis report isREColorado.Informationdeemedreliablebut not guaranteed Consult your Slifer Smith&FramptonBroker for moreinformation.
6 | 8 | 10 | 12 | 14 | 16 | 18 | 20 | 22 | 24 | 26 | COLORADO MARKET OVERVIEW 20 23 ECONOMIC REVIEW BOULDER VALLEY NORTH METRO & BROOMFIELD DENVER SOUTHEAST DENVER & AURORA W EST METRO & FOOTHILLS NORTHERN COLORADO NORTHEAST DENVER SOUTH METRO 20 22-23 NOTABLE SALES CONTENTS
| 2
Slifer Smith & Frampton Real Estate
A LETTER FROM OUR PRESIDENT
MIDYEAR REFLECTION
Assummer finally arrives on the Front Rage, we're excited to share our mid-year reflection on the real estate trends in our beloved region As predicted in early 2023, the market experienced a notable shift, with a 25%decline from its peak, but now, the summer marks a turning point with impressive showing traffic from May to July The Front Range stands out as an ideal market for real estate investment, surpassing many comparable markets in our recovery, creating a more balanced, healthy, and sustainable environment, making it highly sought-after for bothbuyersandsellers

Driving this resilience is our region's robust and diverse employment base, keeping our communities vibrant and flourishing Beyond just work opportunities, it's the unbeatable quality of life? encompassing safety, top-notch education, and abundant outdoor activities? that makestheFront Rangeanirresistibleplaceto call home.
As we celebrate the anniversary of Colorado Landmark joining Slifer Smith & Frampton, we take pride in solidifying our position as the #1 Independent Real Estate Brokerage in Colorado. With five offices strategically positioned acrossthe Front Range and supported by more than 30 offices in our Mountain Markets and a dedicated team of community-minded brokers, we're not only fully equipped to serve our clients with unmatched expertise and care, but also as trusted guides andprofessional advisorsthroughthisever-evolvingeconomy.
Even amid challenging economic times, Slifer Smith & Frampton continues to outperform prior year We remain committed to guiding our clients with confidence and assurance, embracing the spirit of resilience that defines our beloved Front Range community Our focus goes beyond just transactions; we are dedicated to building lasting relationships and ensuring that our clients make well-informed decisionsto securetheir financial futures
Front Range Market President

ORLY
RIPMASTER
WE ARE SLIFER SMITH & FRAMPTON
COLORADO'S REAL ESTAT
270+ world-class agents across Colorado 120+ dedicated & local support staff $10B+ sales volume since 2020 100% Colorado owned & operated #1 Colorado's leading, independent real estate company


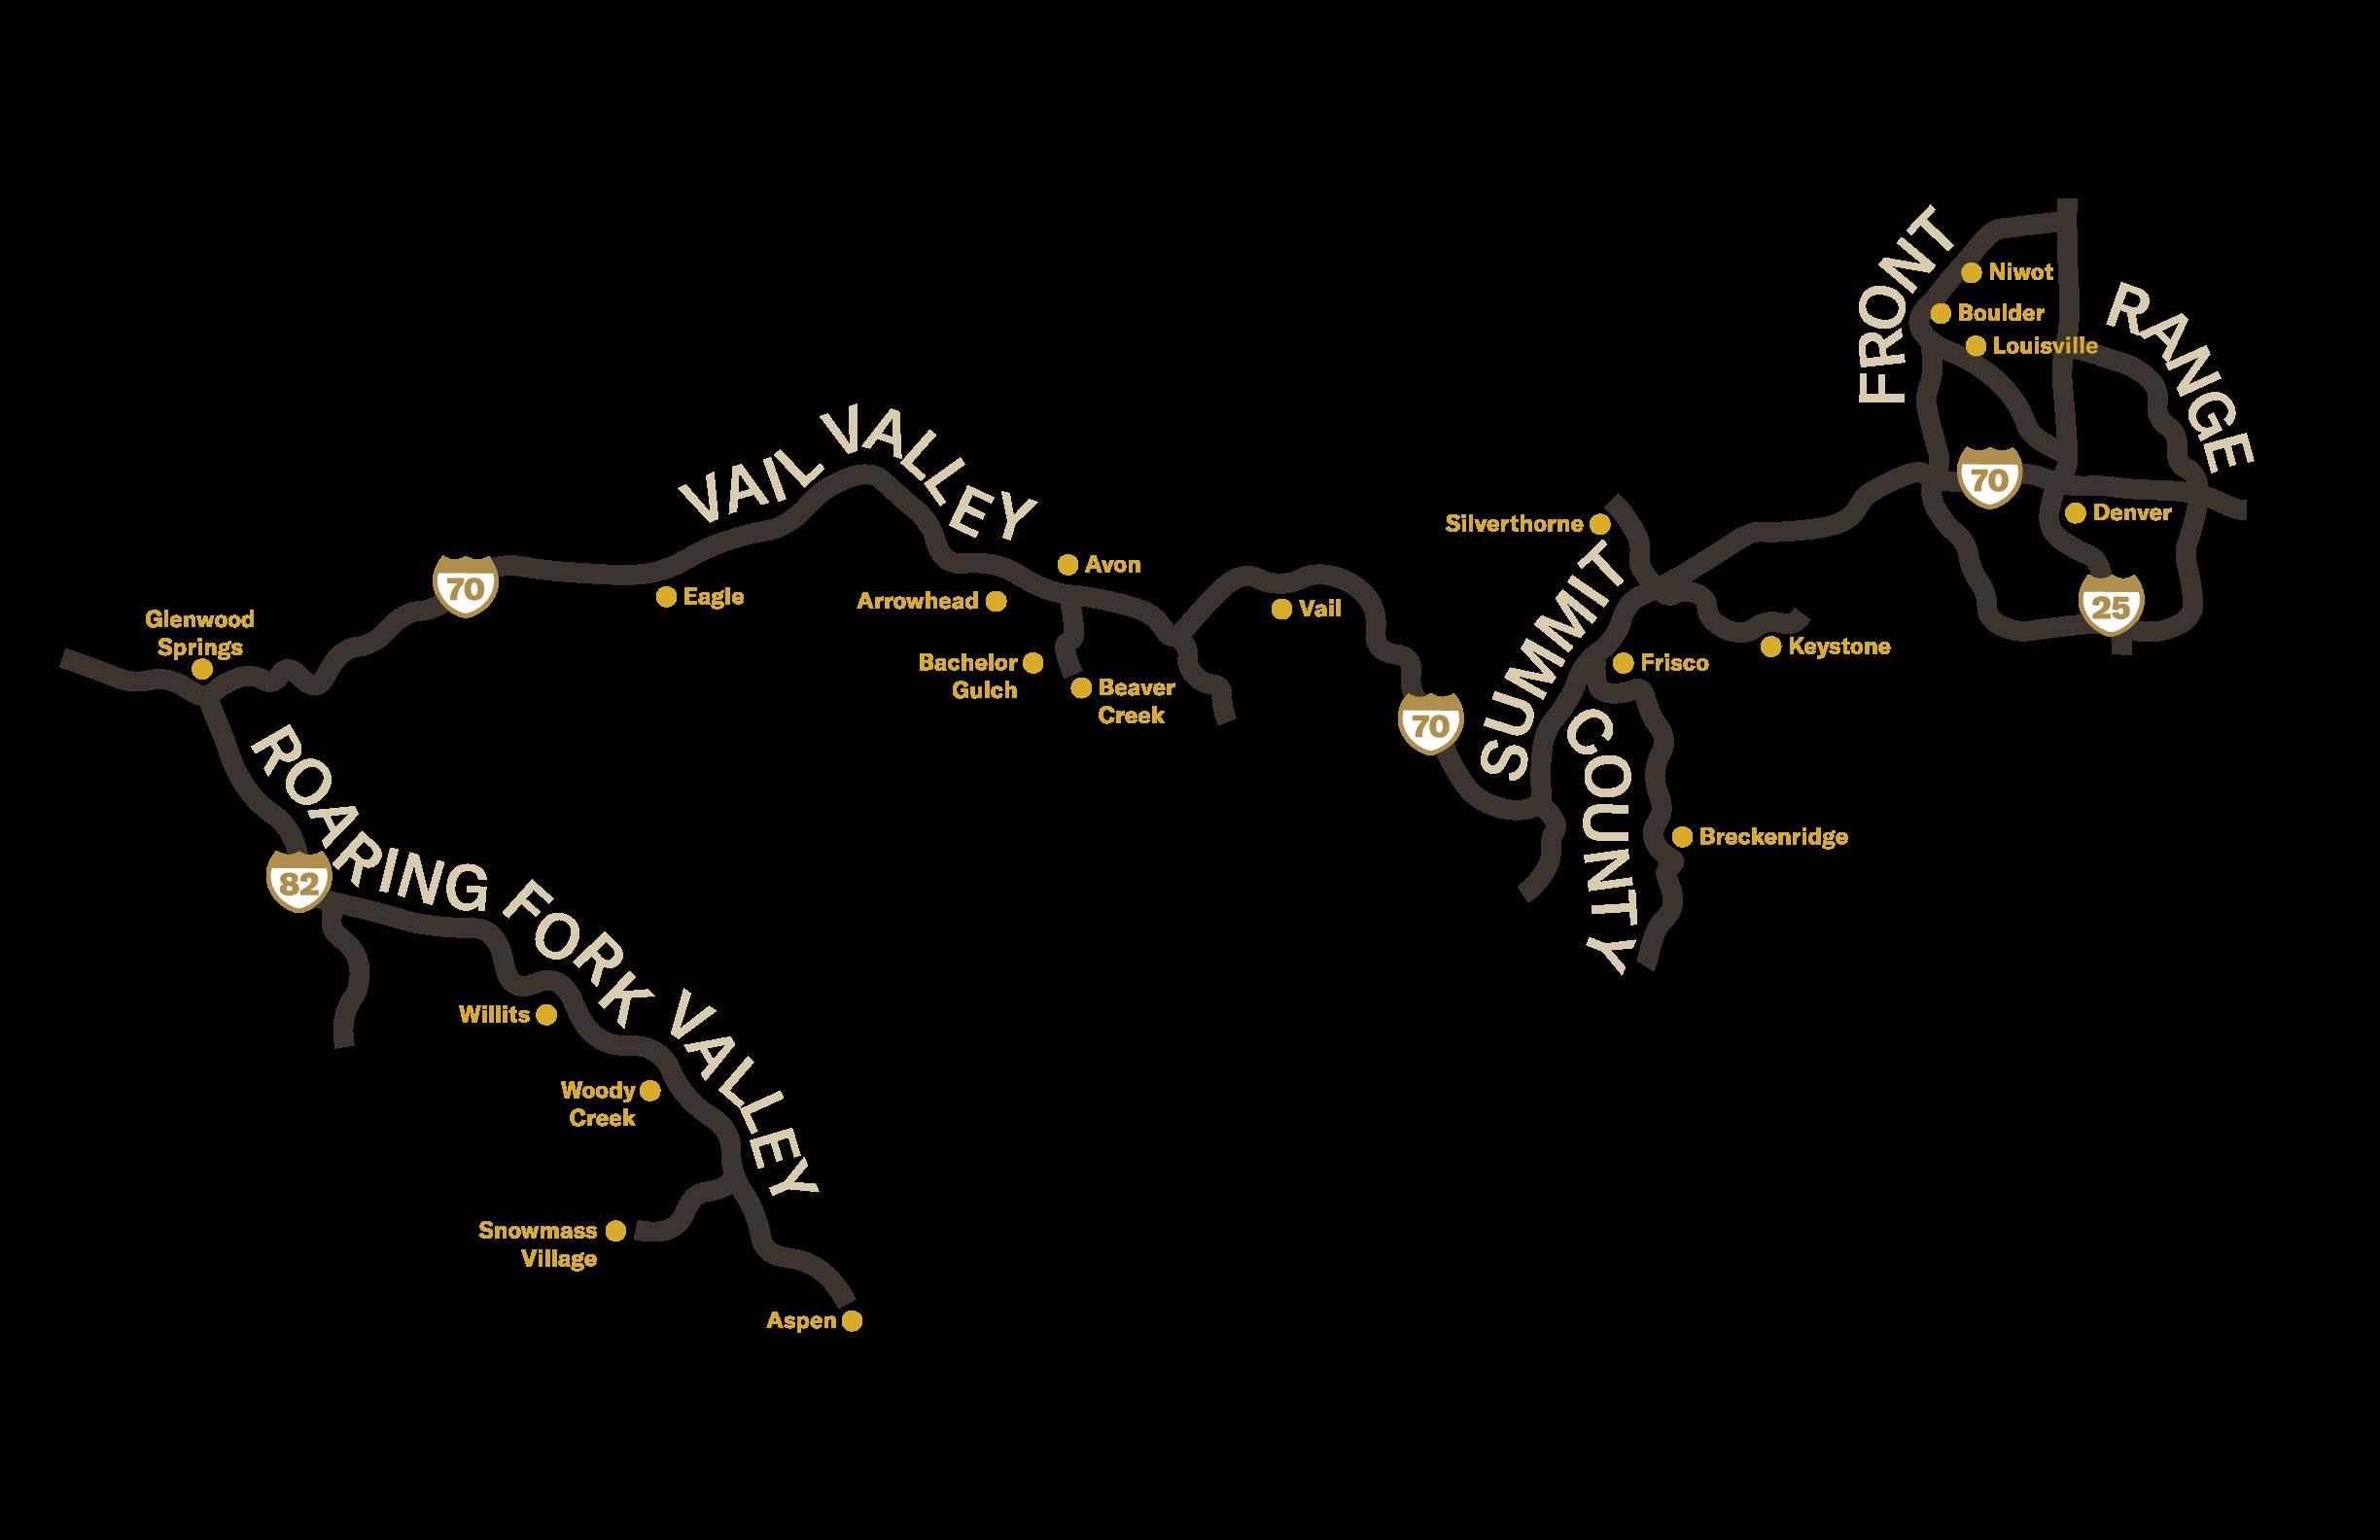
Roaring Fork Valley 6 LOCATIONS Vail Valley 12 LOCATIONS Summit County 5 LOCATIONS Front Range 5 LOCATIONS
TE COMPANY
Cherry Creek
COLORADO MARKET OVERVIEW
Aswereachthemidwaypoint of 2023,wearepleasedto report that Colorado'sreal estatemarket continuesto demonstratestabilityand consistent appreciation This positivetrend canbeattributedto several keyfactors:

- Strong Job Market:Colorado'sdiverseand robust economyhasmaintainedalow unemployment rate,providingsolidsupport to thehousingmarket.
- Population Growth:Thestate'ssignificant populationincreasehasdrivenasurge indemand for housing,leadingto stablehomeprices
- Limited Supply: Colorado'scontrolledland development haseffectivelybalanced thereal estatemarket bylimitingthenumber of newhomesbuilt.
- Desirable Location:Withitsreputationasasought-after tourist destinationand highqualityof life,Colorado remainsanattractiveplaceto liveand invest.
- Strong Economy:Theoverall strengthof thestate'seconomy,characterized by steadyjobgrowthand athrivingbusinessclimate,continuesto reinforcethe stabilityof thereal estatemarket
Incontrast to thehousingcrashof 2008/2009,it isimportant to highlight that thecurrent real estatelandscapeisnot aleadingfactor inanimpendingrecession Notably,three variableshavesignificantlyimproved:
- Weanticipatea25-30%declinefrompeak-to-trough,markingasubstantial 1,500 bpsimprovement compared to theGFC's45%decline.
- Encouragingly,manymarketsmayhavealreadyreached thetrough,anotable improvement fromtheGFC'suncertainties
- Stronghousehold liquidityempowersbuyersand alignsseller expectations, fosteringahealthier market environment.
TheUS (and Front Range) employment market remainsrobust,signifyingeconomic healthand maintainingthepotential for astrongbuyer pool. Asweprogressinto the second half of 2023,wemaintainacautiousyet optimistic outlook for Colorado'sreal estatemarket.Thecombinationof asolideconomy,increasingdemand,and balanced market dynamicsbodeswell for bothbuyersand sellersintheFront Range
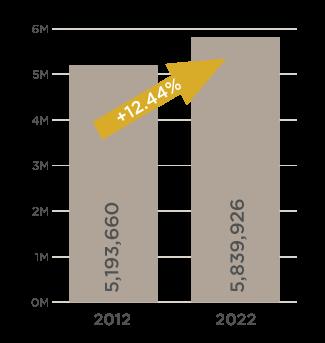
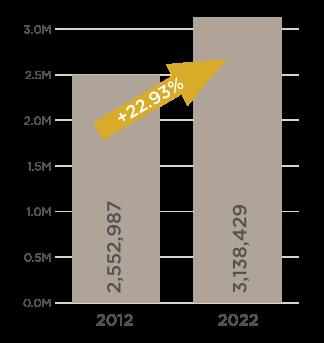
COLORADO POPULATION
JOBS
Pictured | Mountain Goat on Mt Blue Sky
COLORADO
SOURCE | US CensusBureau&Colorado Department of Labor andUnemployment
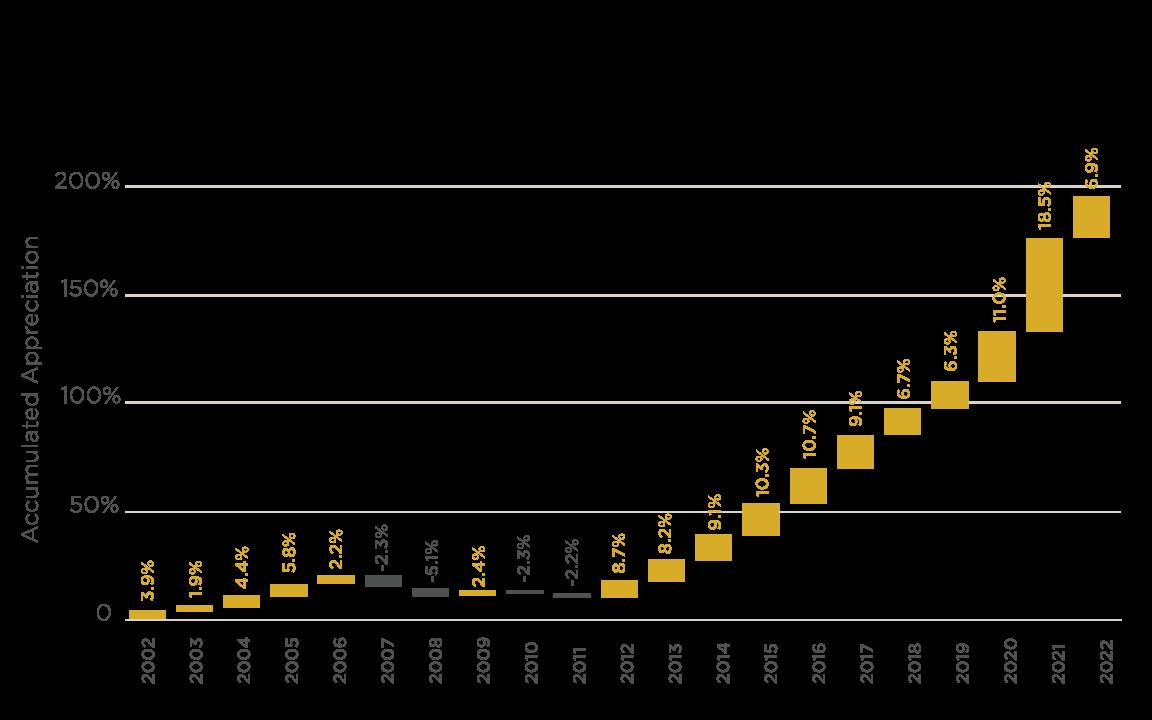
COLORADO ACCUMULATED REAL ESTATE APPRECIATION
+195.5%
Since 2002
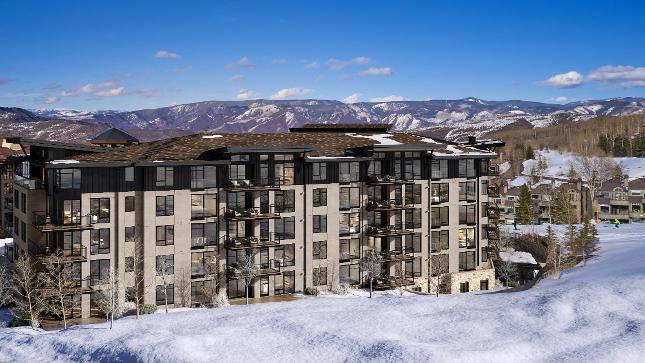
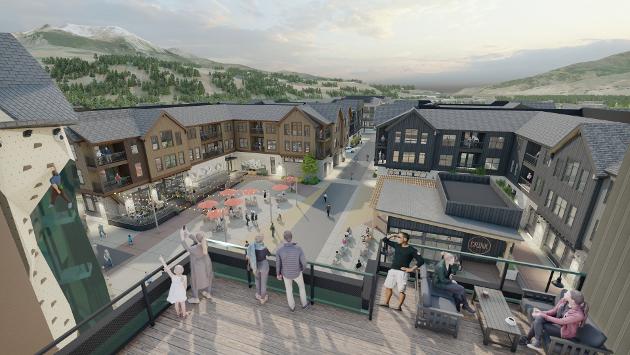
NEW DEVELOPMENT ACROSS COLORADO
SOURCE| FHFAHouse Price Index and FOCUS1ST
ARBORY
City Park West | Denver ArboryDenver com
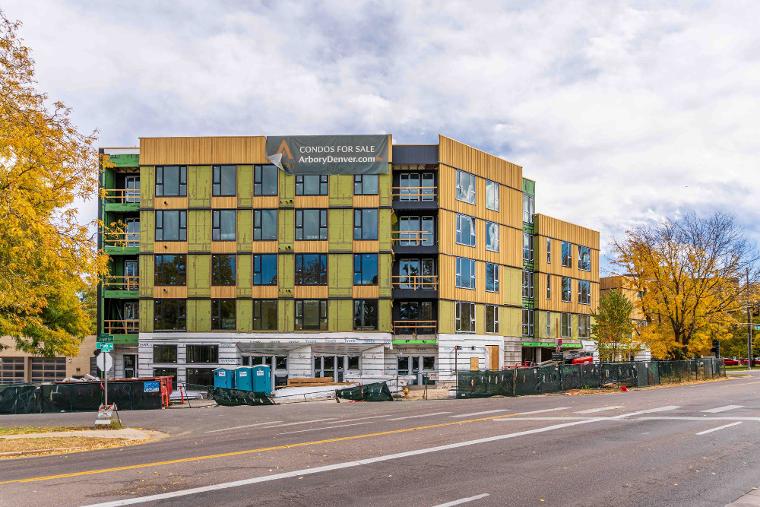
9 Projects launched in 20 22
IN
Downtown | Silverthorne LiveAtInhabitance com
$1B+
Division historic closed + pending sales
20 0 + New homes delivered
Withstrongeconomic activityacrossthestatenewdevelopment wasakeydriver of growthin2022,andwebelievethe creationof newhigh-qualityhomeswill continueto becritical asColorado settlesinto aneweconomic equilibrium Slifer Smith&Framptonisproudto betheonlybrokerageinColorado withafull divisiondedicatedto bringingnewdevelopmentsto market Our end-to-endservicecontinued to deliver in2022,creatingmorenewhomesinour communitiesthanever before Thisyear thedivisioncelebrated over $1billioninclosed&pendingsalessinceit started in2020
The Slifer Report 2023 | 7
HABITANCE
CIRQUE X VICEROY Snowmass Base Village CirqueViceroy com
To learnmore,visit SliferDevelopmentSales com >>>
2023 ECONOMIC FORECAST STILL THE YEAR OF TRUTH
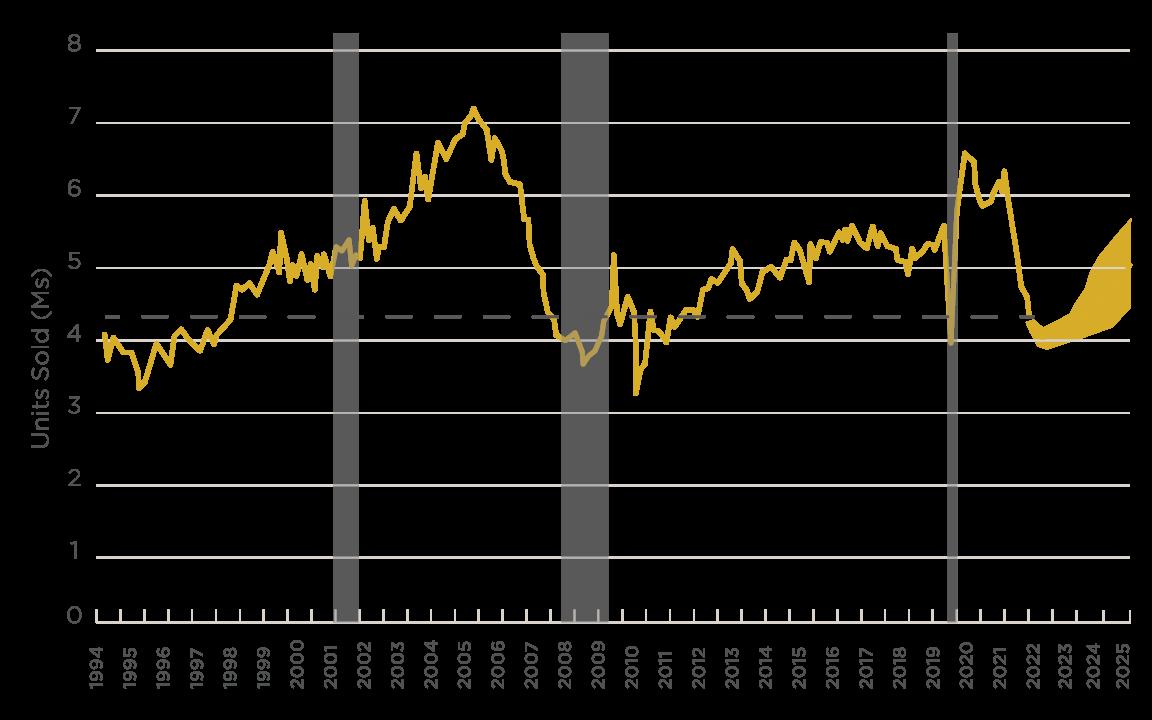
As we assess the economic landscape of 2023, the real estate market's trajectory presents a compelling story, both on a national scale and within Colorado's Front Range. In 2021, the industry achieved an impressive milestone with over 6 million existing home sales across the U S, representing a near 20-year high However, as projected, 2022 experienced a market normalization with approximately 4 million sales, marking a significant 30% decline and returning to the long-term historical average dating back to 1968.
This normalization was influenced by a combination of factors which still remain largely unresolved half way through the year, including uncertainties stemming from aggressive monetary policies, geopolitical tensions, pending elections and regional natural disasters. Additionally, soaring home prices throughout the prio cycle, coupled with more recent interest rate increases, created notable affordability challenges, particularly for first-time homebuyers.
Despite these challenges, our outlook remains cautiously optimistic for the remainder of 2023 and beyond The real estate market is poised for a steady and progressive recovery, aligning with long-term historical trends and reflecting its resilience. On the Front Range, we anticipate measured yet robust growth, driven by solid economic fundamentals and prudent market dynamics
At Slifer Smith & Frampton, we take pride in our extensive experience since 1962, successfully navigating numerous market cycles. As we move forward into the second half of 2023, we are committed to serving your housing needs with expertise and innovation.
Fundamentally, the significance of partnering with a qualified professional cannot be understated Now more than ever, over 90% of homebuyers and sellers choose to leverage the expertise of agents, recognizing the substantial value they bring in navigating complex market conditions Emerging research suggests that even millennials view working with agents as a smart and strategic choice, further reinforcing the strength of the real estate industry.
In this ever-evolving economic landscape, we are well-positioned to capitalize on opportunities As we chart the course for the rest of 2023, Colorado's Front Range promises to be on the forefront of economic prowess and a favored destination for real estate investors and homeowners alike.
May 2023 serve your housing wants and needs in Colorado?s Front Range well

Pictured | Speer Boulevard
U S EXISTING HOME SALES (SAAR) LONG TERM TRENDS
The Slifer Report 2023 | 9
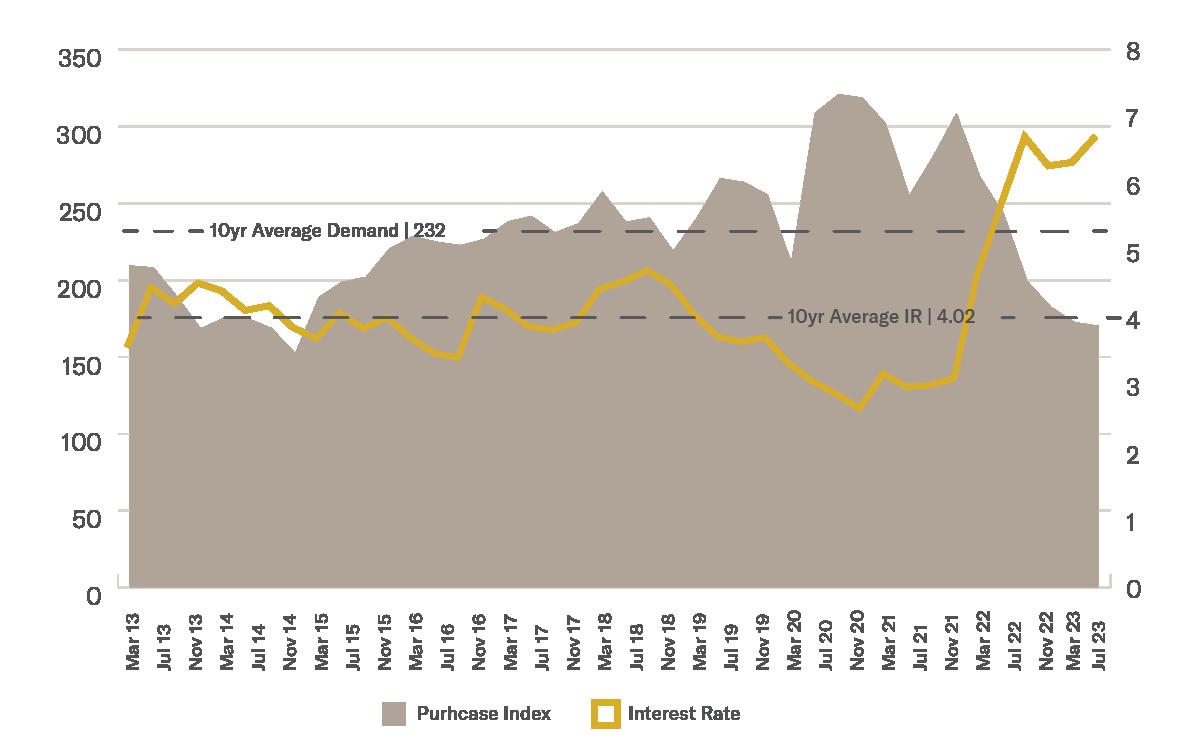
TERM QUARTERLY 30
FIXED RATE
PURCHASE INDEX
LONG
YEAR
VS.
-------- SSF FORECA ST SOURCE| National Association of Realtors
POPULATION | 329,543
POPULATION GROWTH | +1187% SINCE 2010
MEDIAN AGE | 36 9
*UNEMPLOYMENT RATE | 2 6%
MEDIAN HOUSEHOLD INCOME | $87,476
AVERAGE COMMUTE TIME | 23.5 MINUTES
HOME OWNERSHIP RATE | 63 6%
*MEDIAN PROPERTY SALE PRICE | $842,250
IN THE KNOW...
5TIDBITSFROM THELOCALS
1. BRUNCH at Lucile's Creole Cafe
2. BROWSE vintage posters and historic maps at Art Source international
3 STROLL through the Boulder Farmers Market

4. LEAF PEEP on the Peak to Peak Highway
5. CHEER on the CU Buffs at Folsom Field
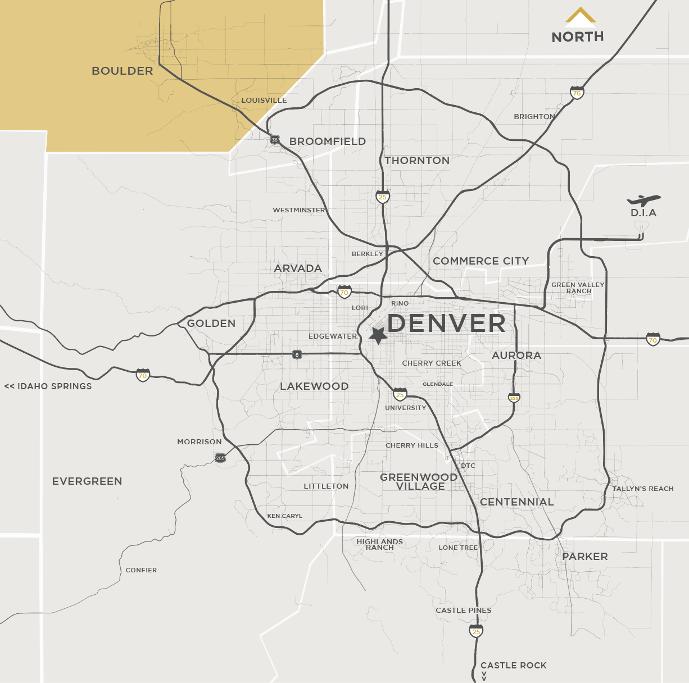
BOULDER VALLEY Pictured | Pearl Street Boulder
2020 datafromDataUSA&US Bureauof Labor Statistics *MedianSalefor SingleFamily&Duplex for 2022 *Unemployment Rate:Q4 2022
SOURCE|
The Slifer Report 2023 | 11
FAMILY & DUPLEX SALES VOLUME NO OF SALES AVG DAYS ON MARKET AVG SALE MEDIAN SALE 2019 $813,064,281 1,141 34 $712,589 $594,900 2020 $808,161,817 1,127 40 $717,091 $595,000 2021 $2,269,836,356 2,239 24 $1,013,772 $800,000 2022 $2,086,384,554 1,851 14 $1,127,166 $886,799 2023 $1,622,682,001 1,444 38 $1,123,741 $850,000 CONDOMINIUM & TOW NHOME SALES VOLUME NO. OF SALES AVG. DAYS ON MARKET AVG. SALE MEDIAN SALE 2019 $175,064,440 406 42 $431,193 $370,000 2020 $162,190,723 366 39 $443,144 $384,000 2021 $536,922,461 1,025 32 $523,827 $438,000 2022 $484,983,523 787 17 $616,243 $516,000 2023 $371,718,701 644 36 $577,203 $491,725 $376 Avg.PricePer SquareFoot (SF) AREA highlights AVERAGE PRICE PER SQUARE FOOT SALE VS. LIST PRICE COMPARISON 2019 2020 2021 2022 2023 Single Family & Duplex $256 $255 $330 $384 $376 Condominium & Townhome $283 $302 $377 $429 $403 AVERAGE SALE / LAST LISTED PRICE Single Family & Duplex 100 00% Condominium & Townhome 100 00% TOP 5 PLACES TO LIVE IN THE U S
Median Sale (SF+Duplex)
Boulder County Data
SINGLE
-4%
-22% No of Sales
SALES VOLUME COMPARISON
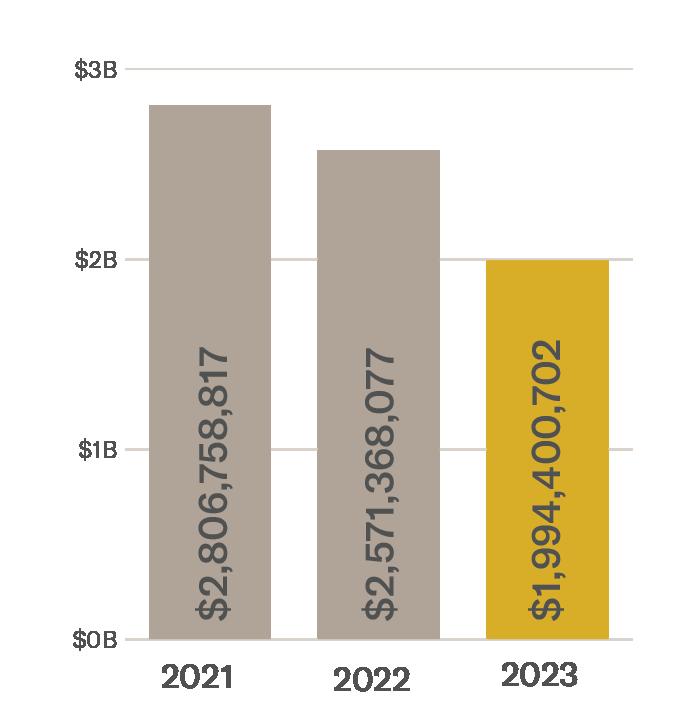
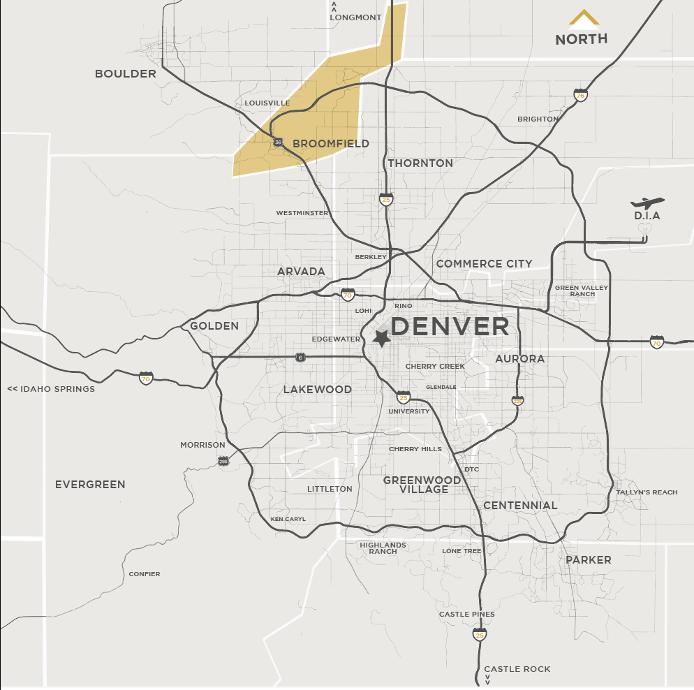
NORTH METRO | BROOMFIELD

POPULATION | 75,325
POPULATION GROWTH | +34 7% SINCE 2010
MEDIAN AGE | 38 4
*UNEMPLOYMENT RATE | 2 8%
MEDIAN HOUSEHOLD INCOME | $101,206
AVERAGE COMMUTE TIME | 26.8 MINUTES
HOME OWNERSHIP RATE | 66 3%
*MEDIAN PROPERTY SALE PRICE | $688,000
IN THE KNOW...
5TIDBITSFROM THELOCALS
1. SIP at 4 Noses Brewing Company
2. VISIT Broomfield Days
3 ENJOY over 280 miles of walking and biking trails
4 EAT at Mama Lolita's Mexican
5. PADDLE board on Standley Lake
Pictured | Stearns Lake
SOURCE| 2020 datafromDataUSA&US Bureauof Labor Statistics *MedianSalefor SingleFamily&Duplex for 2022
2022
*Unemployment Rate:Q4
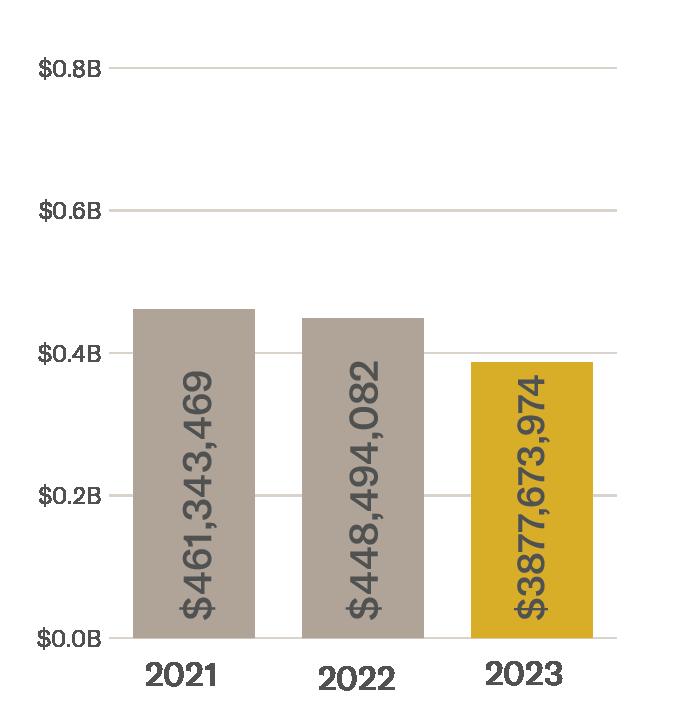
The Slifer Report 2023 | 13 SINGLE FAMILY & DUPLEX SALES VOLUME NO. OF SALES AVG. DAYS ON MARKET AVG. SALE MEDIAN SALE 2019 $291,871,719 529 31 $551,742 $504,000 2020 $249,478,376 430 32 $580,182 $527,227 2021 $397,702,525 571 15 $696,502 $639,888 2022 $365,434,987 463 9 $789,276 $695,000 2023 $322,155,055 403 30 $799,392 $695,000 CONDOMINIUM & TOW NHOME SALES VOLUME NO. OF SALES AVG. DAYS ON MARKET AVG. SALE MEDIAN SALE 2019 $30,349,255 83 21 $365,654 $349,835 2020 $32,041,800 80 32 $376,962 $367,250 2021 $63,640,944 146 16 $435,897 $440,500 2022 $83,059,095 162 14 $512,710 $524,207 2023 $65,518,919 126 42 $519,991 $547,495 $305 AveragePriceper squarefoot AREA highlights AVERAGE PRICE PER SQUARE FOOT SALE VS LIST PRICE COMPARISON 2019 2020 2021 2022 2023 Single Family & Duplex $219 $225 $258 $317 $305 Condominium & Townhome $262 $272 $292 $329 $324 AVERAGE SALE / LAST LISTED PRICE Single Family & Duplex 100 00% Condominium & Townhome 99 30% 21,0 0 0 ACRES 5TH SMALLEST COUNTY IN THE U S 0% MedianSale -13% no of sales Broomfield County Data SALES VOLUME COMPARISON
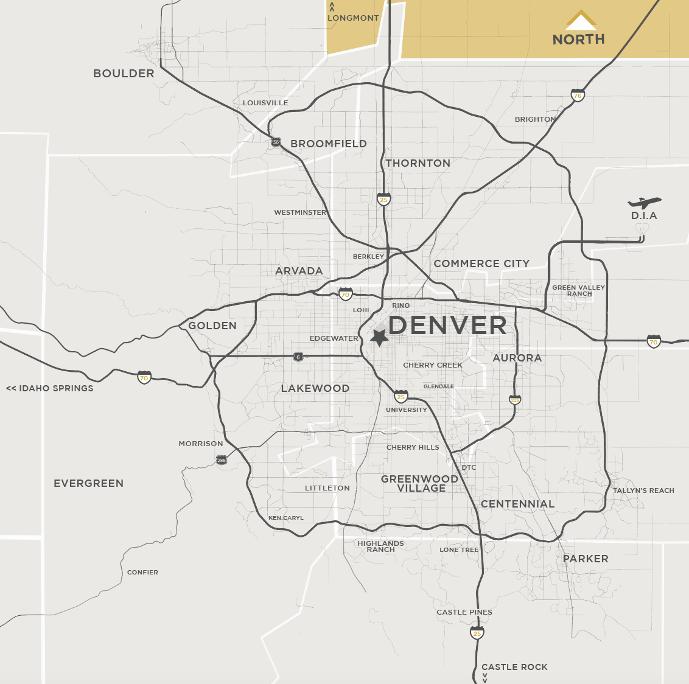
POPULATION | 711,463
POPULATION GROWTH | +18 54% SINCE 2010
MEDIAN AGE | 34 6
*UNEMPLOYMENT RATE | 3 4%
MEDIAN HOUSEHOLD INCOME | $72,661
AVERAGE COMMUTE TIME | 25,7 MINUTES
HOME OWNERSHIP RATE | 50 4%
*MEDIAN PROPERTY SALE PRICE | $675,000
IN THE KNOW...
5TIDBITSFROM THELOCALS
1. CELEBRATE the arts at the new week long Art RINO Festival

2. UNWIND at Cretan's Wine Bar & Restaurant
3 SHOP at Berkeley Supply co
4 JOIN a volleyball league at wash park
5 DIVE into local & sustainable cuisine at Koko Ni
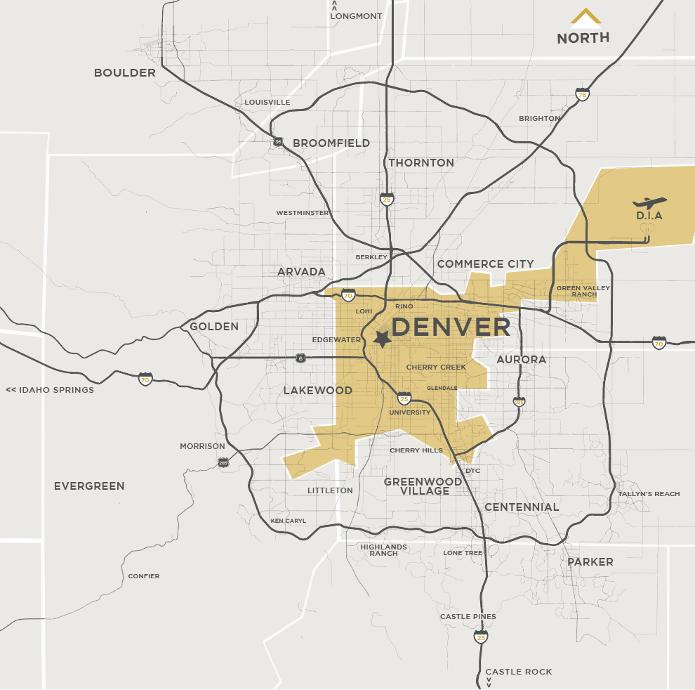
DENVER
SOURCE| 2020 datafromDataUSA&US Bureauof Labor Statistics *MedianSalefor SingleFamily&Duplex for 2022 *Unemployment Rate:Q4 2022
Pictured | City Park
$386 AveragePricePer SquareFoot
SALES VOLUME COMPARISON
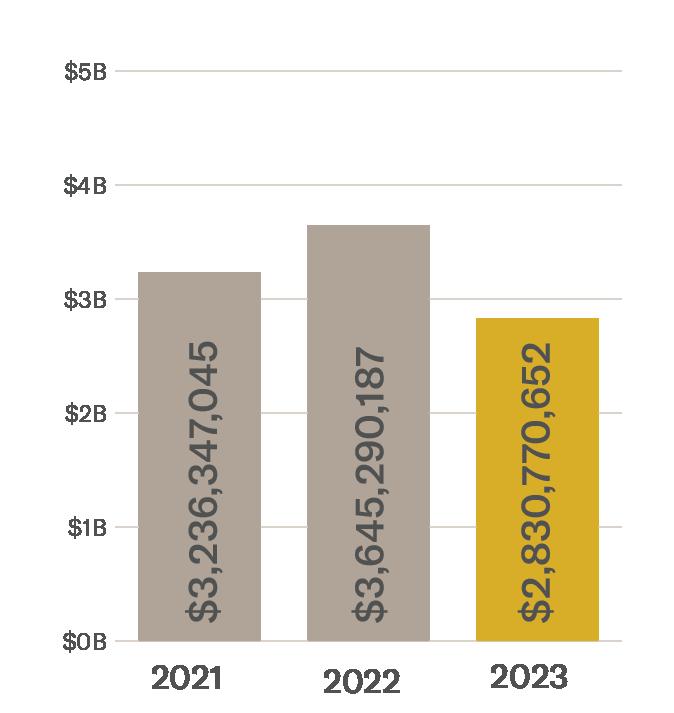
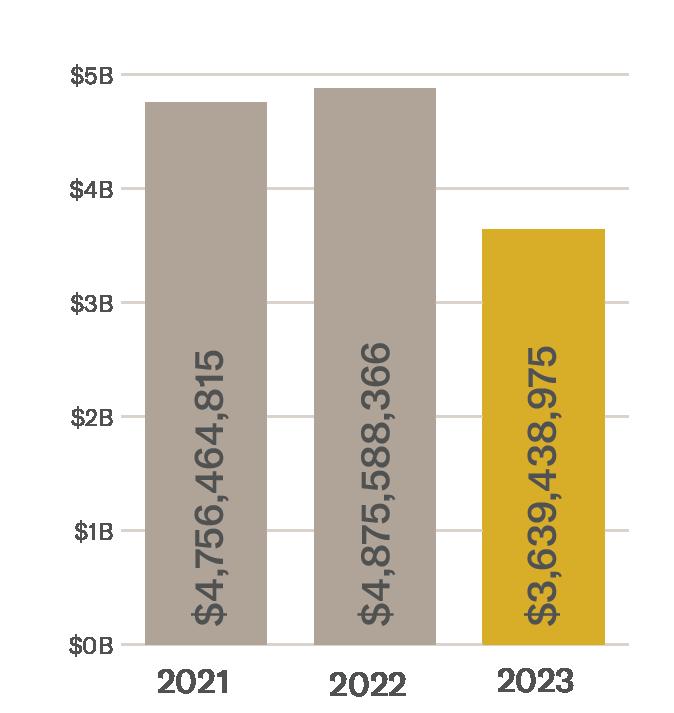
The Slifer Report 2023 | 15 SINGLE FAMILY & DUPLEX SALES VOLUME NO OF SALES AVG DAYS ON MARKET AVG SALE MEDIAN SALE 2019 $2,228,632,473 3,697 25 $602,822 $489,700 2020 $1,962,399,308 3,233 24 $606,990 $505,000 2021 $3,268,246,919 4,175 13 $782,814 $630,000 2022 $3,413,179,078 3,786 9 $901,526 $707,250 2023 $2,477,762,451 2,840 27 $872,452 $666,250 CONDOMINIUM & TOW NHOME SALES VOLUME NO OF SALES AVG DAYS ON MARKET AVG SALE MEDIAN SALE 2019 $1,324,852,234 2,901 36 $456,688 $372,000 2020 $1,212,461,725 2,635 39 $460,137 $409,000 2021 $2,026,923,821 3,908 33 $518,660 $435,000 2022 $1,890,109,048 3,298 16 $573,108 $466,500 2023 $1,222,586,134 2,188 31 $558,769 $444,000
AREA highlights AVERAGE PRICE PER SQUARE FOOT SALE VS. LIST PRICE COMPARISON 2019 2020 2021 2022 2023 Single Family & Duplex $282 $299 $356 $416 $386 Condominium & Townhome $325 $341 $385 $435 $398 AVERAGE SALE / LAST LISTED PRICE Single Family & Duplex 100.00% Condominium & Townhome 99.80%
ELEVATION
Sales
Denver County Data
DAYS OF SUNSHINE
5,280 '
-6% Median
-25% no.of Sales
30 0
POPULATION | 654,900
POPULATION GROWTH | +14 49% SINCE 2010
MEDIAN AGE | 36 8
*UNEMPLOYMENT RATE | 3 4%
MEDIAN HOUSEHOLD INCOME | $80,291
AVERAGE COMMUTE TIME | 28.2 MINUTES
HOME OWNERSHIP RATE | 64 2%
*MEDIAN PROPERTY SALE PRICE | $597,144
IN THE KNOW...
5TIDBITSFROM THELOCALS
1. TRAIN at Snöbahn Indoor Ski Facility
2. ENJOY a show at Gothic Theater
3 INDULGE in all the outdoor activities at Cherry Creek State Park and Reservoir

4 PERUSE through Stanley Marketplace
5. DINE at Enso Sushi and Grill
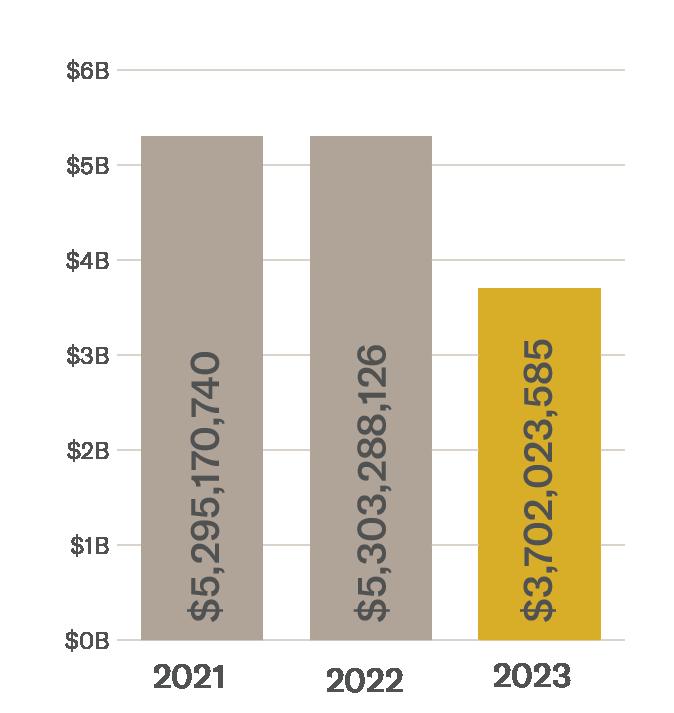
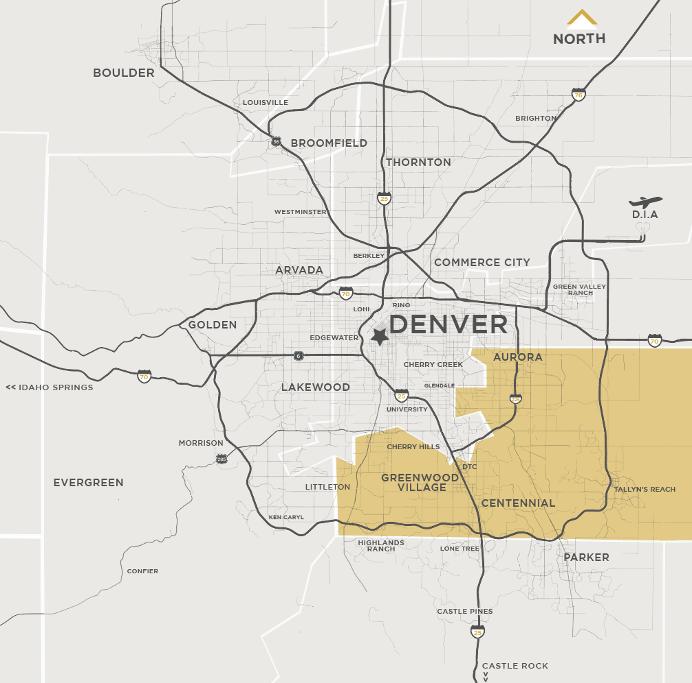
SOUTHEAST DENVER |
AURORA
SOURCE| 2020 datafromDataUSA&US Bureauof Labor Statistics *MedianSalefor SingleFamily&Duplex for 2022 *Unemployment Rate:Q4 2022
Pictured | Cherry Creek State Park
The Slifer Report 2023 | 17 SINGLE FAMILY & DUPLEX SALES VOLUME NO. OF SALES AVG. DAYS ON MARKET AVG. SALE MEDIAN SALE 2019 $1,993,586,016 3,949 26 $504,833 $419,900 2020 $1,792,389,377 3,511 24 $510,507 $439,405 2021 $2,691,138,134 4,127 10 $652,081 $525,000 2022 $2,854,241,375 3,934 9 $725,532 $603,000 2023 $2,244,539,816 3,023 32 $742,488 $580,000 CONDOMINIUM & TOW NHOME SALES VOLUME NO OF SALES AVG DAYS ON MARKET AVG SALE MEDIAN SALE 2019 $568,285,123 1,959 26 $290,089 $270,000 2020 $517,874,899 1,753 28 $295,422 $275,000 2021 $747,323,993 2,240 16 $333,627 $312,500 2022 $826,576,763 2,137 8 $386,793 $370,000 2023 $625,706,815 1,602 24 $390,579 $365,000 $275 AveragePricePer SquareFoot AREA highlights AVERAGE PRICE PER SQUARE FOOT SALE VS LIST PRICE COMPARISON 2019 2020 2021 2022 2023 Single Family & Duplex $202 $208 $246 $291 $275 Condominium & Townhome $213 $221 $248 $297 $292 AVERAGE SALE / LAST LISTED PRICE Single Family & Duplex 100 00% Condominium & Townhome 100 00% 8,0 0 0 ACRES OF OPEN SPACE
SalesPrice
Arapahoe County Data
-4% Median
-23% no.of Sales
SALES VOLUME COMPARISON
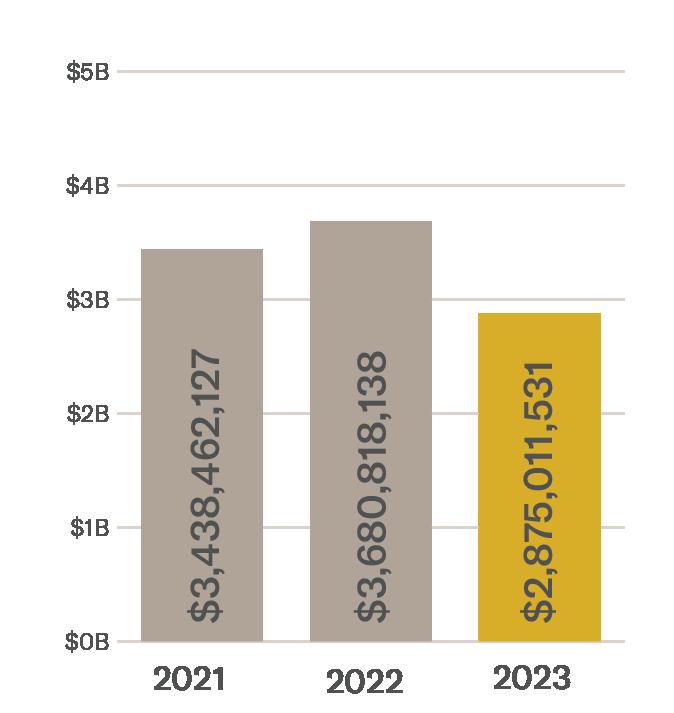
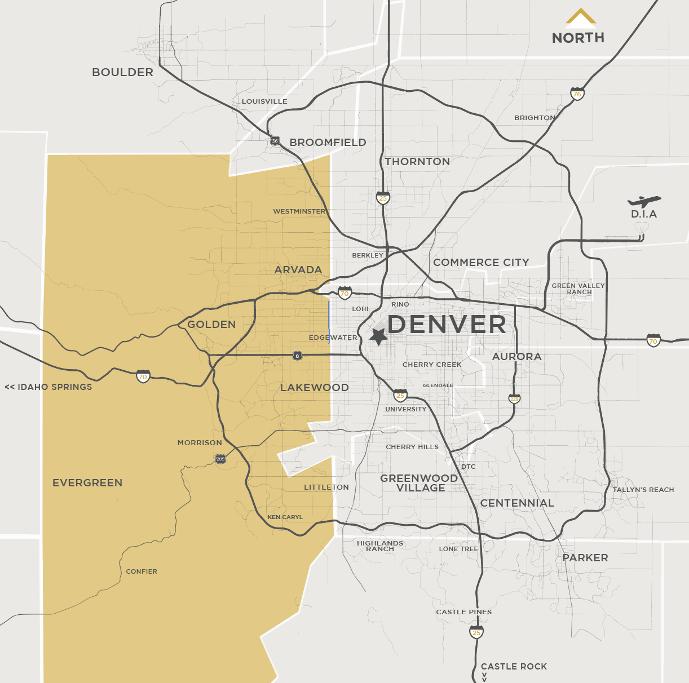
WEST METRO | FOOTHILLS
POPULATION | 579,581
POPULATION GROWTH | +8 42% SINCE 2010
MEDIAN AGE | 40 2
*UNEMPLOYMENT RATE | 3.0%
MEDIAN HOUSEHOLD INCOME | $87,793
AVERAGE COMMUTE TIME | 27 8 MINUTES
HOME OWNERSHIP RATE | 717%
*MEDIAN PROPERTY SALE PRICE | $680,500
IN THE KNOW...
5TIDBITSFROM THELOCALS
1. DINE at Sherpa House
2. VISIT Staunton State Park for ample hiking trails

3 FIND vintage goods at the Pine Emporium
4 FLOW at Yoga on the Rocks
5. TUBE down Clear Creek in Golden
SOURCE| 2020 datafromDataUSA&US Bureauof Labor Statistics *MedianSalefor SingleFamily&Duplex for 2022 *Unemployment Rate:Q4 2022
Pictured | Red Rocks Park & Amphitheater
The Slifer Report 2023 | 19 SINGLE FAMILY & DUPLEX SALES VOLUME NO. OF SALES AVG. DAYS ON MARKET AVG. SALE MEDIAN SALE 2019 $1,892,365,847 3,525 26 $536,841 $470,000 2020 $1,807,033,519 3,220 25 $561,191 $500,000 2021 $2,698,246,280 3,865 11 $698,123 $607,000 2022 $2,989,110,248 3,647 11 $819,608 $700,000 2023 $2,306,988,660 2,965 27 $778,074 $673,500 CONDOMINIUM & TOW NHOME SALES VOLUME NO OF SALES AVG DAYS ON MARKET AVG SALE MEDIAN SALE 2019 $424,367,023 1,332 20 $318,594 $294,250 2020 $406,946,335 1,242 23 $327,654 $300,000 2021 $538,100,765 1,457 13 $369,321 $345,000 2022 $656,179,939 1,435 8 $457,268 $428,000 2023 $523,196,992 1,157 27 $452,201 $413,500 $318 AveragePricePer SquareFoot AREA highlights AVERAGE PRICE PER SQUARE FOOT SALE VS LIST PRICE COMPARISON 2019 2020 2021 2022 2023 Single Family & Duplex $218 $230 $277 $332 $318 Condominium & Townhome $243 $251 $291 $342 $333 AVERAGE SALE / LAST LISTED PRICE Single Family & Duplex 100 00% Condominium & Townhome 100 00% 72% HOME OW NERSHIP -4% Median SalesPrice -19% no.of Sales Jefferson County Data SALES VOLUME COMPARISON
POPULATION | 702,569
POPULATION GROWTH | +27 17% SINCE 2010
MEDIAN AGE | 35 4
*UNEMPLOYMENT RATE | 3 1%
MEDIAN HOUSEHOLD INCOME | $75,349
AVERAGE COMMUTE TIME | 25 7 MINUTES
HOME OWNERSHIP RATE | 70 4%
*MEDIAN PROPERTY SALE PRICE | $
IN THE KNOW...
TOP5TIDBITSFROM THELOCALS
1 BOOK a tee time at TPC Colorado Golf Club
2 FLOAT down the beautiful Cache La Poudre River
3. LOUNGE at Social Speakeasy
4. JAM out at the Mishawaka Amphitheatre
5. CAMP at Big Thompson Campground on Carter Lake Reservoir

2020 datafromDataUSA&US Bureauof Labor Statistics *MedianSalefor SingleFamily&Duplex for 2022
Rate:Q4 2022
NORTHERN COLORADO SOURCE|
*Unemployment
Pictured | Horsetooth Reservoir
The Slifer Report 2023 | 21 SINGLE FAMILY & DUPLEX SALES VOLUME NO OF SALES AVG DAYS ON MARKET AVG SALE MEDIAN SALE 2019 $1,137,262,682 2,599 39 5 $444,297 $395,000 2020 $1,179,504,291 2,619 45 5 $460,253 $405,900 2021 $4,168,733,695 8,060 24 5 $520,278 $455,000 2022 $4,331,478,984 7,106 17 $616,303 $537,500 2023 $3,208,986,456 5,299 415 $611,406 $530,000 CONDOMINIUM & TOW NHOME SALES VOLUME NO. OF SALES AVG. DAYS ON MARKET AVG. SALE MEDIAN SALE 2019 $117,779,530 306 28 $298,328 $286,500 2020 $140,804,464 336 47 $315,139 $300,000 2021 $683,037,848 1,593 29 5 $350,832 $340,000 2022 $708,828,913 1,336 19 5 $393,155 $384,809 2023 $576,874,272 1,020 39 5 $410,360 $395,750 $262 PricePer Square Foot AREA highlights AVERAGE PRICE PER SQUARE FOOT SALE VS LIST PRICE COMPARISON 2019 2020 2021 2022 2023 Single Family & Duplex $193 $198 $226 $270 $262 Condominium & Townhome $217 $216 $249 $287 $294 AVERAGE SALE / LAST LISTED PRICE Single Family & Duplex 100.00% Condominium & Townhome 100.00% #1 FASTEST GROW ING REGION IN COLORADO -1% MedianSalesPrice -25% no.of Sales Larimer & Weld County Data
COMPARISON
SALES VOLUME
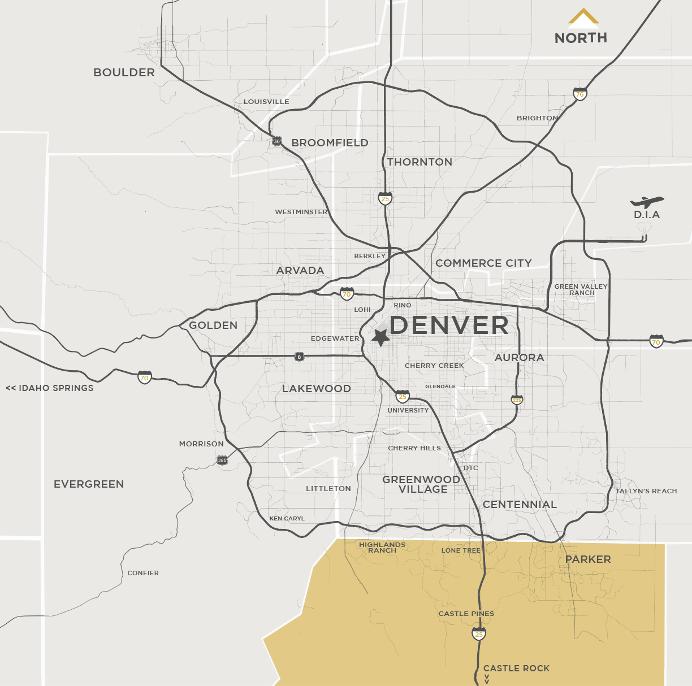
NORTHEAST DENVER | ADAMS COUNTY
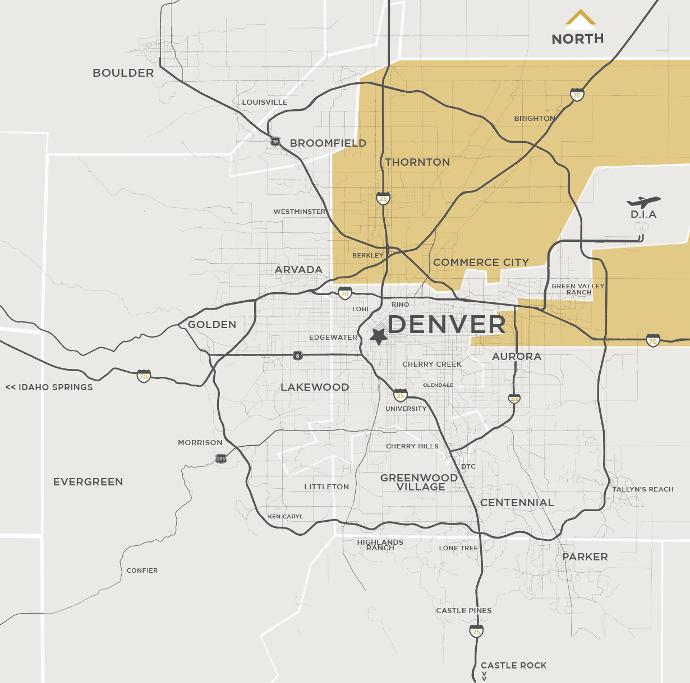
POPULATION | 522,140
POPULATION GROWTH | +18 2% SINCE 2010
MEDIAN AGE | 34
*UNEMPLOYMENT RATE | 3.8%
MEDIAN HOUSEHOLD INCOME | $73,817
AVERAGE COMMUTE TIME | 29 8 MINUTES
HOME OWNERSHIP RATE | 67%
*MEDIAN PROPERTY SALE PRICE | $550,000
IN THE KNOW...
5TIDBITSFROM THELOCALS
1 DISCOVER Rocky Mountain Arsenal National Wildlife Refuge

2. SHOP at the Orchard Town Center
3. EASE into your day at Sweet Bloom Coffee
4. EXPLORE Adams County Fair
5 LEARN how to line dance at the Grizzly Rose
SOURCE| 2020 datafromDataUSA&US Bureauof Labor Statistics *MedianSalefor SingleFamily&Duplex for 2022 *Unemployment Rate:Q4 2022
Pictured | Rocky Mountain Arsenal Wildlife Refuge
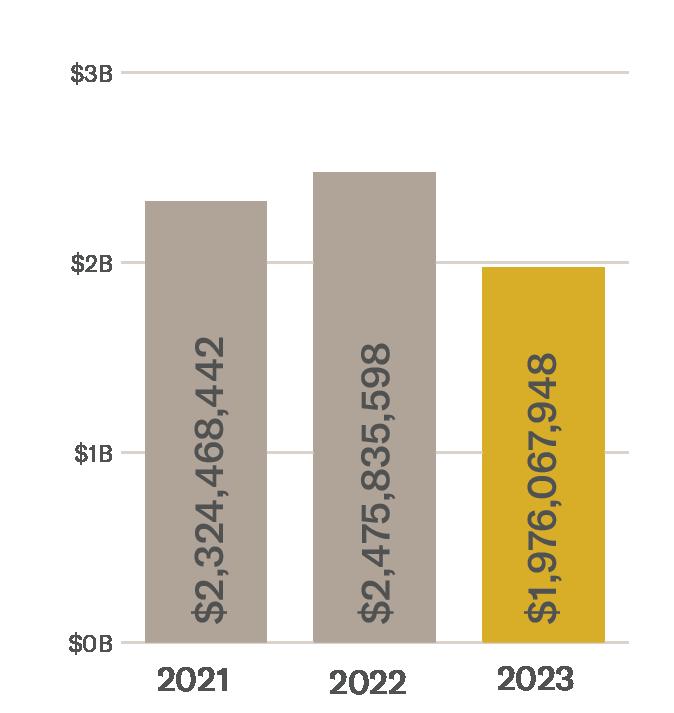
The Slifer Report 2023 | 23 SINGLE FAMILY & DUPLEX SALES VOLUME NO. OF SALES AVG. DAYS ON MARKET AVG. SALE MEDIAN SALE 2019 $1,369,588,983 3,397 31 $403,176 $380,000 2020 $1,330,857,550 3,126 25 $425,738 $400,000 2021 $1,932,150,303 3,872 12 $499,006 $466,000 2022 $2,061,853,689 3,502 12 $588,765 $560,000 2023 $1,663,321,909 2,961 36 $561,743 $530,000 CONDOMINIUM & TOW NHOME SALES VOLUME NO OF SALES AVG DAYS ON MARKET AVG SALE MEDIAN SALE 2019 $249,517,169 893 24 $279,415 $275,000 2020 $246,401,501 832 28 $296,156 $293,250 2021 $392,318,139 1156 14 $339,376 $335,000 2022 $413,981,909 1010 11 $409,883 $405,500 2023 $311,283,041 788 30 $395,029 $400,000 $270 AveragePricePer SquareFoot AREA highlights AVERAGE PRICE PER SQUARE FOOT SALE VS LIST PRICE COMPARISON 2019 2020 2021 2022 2023 Single Family & Duplex $197 $203 $239 $285 $270 Condominium & Townhome $211 $216 $245 $297 $285 AVERAGE SALE / LAST LISTED PRICE Single Family & Duplex 100 00% Condominium & Townhome 100 00% 15,988 ACRE W ILDLIFE REFUGE -5% Median SalesPrice -15% no.of Sales Adams County Data
COMPARISON
SALES VOLUME
POPULATION | 368,990
POPULATION GROWTH | +29 25% SINCE 2010
MEDIAN AGE | 39
*UNEMPLOYMENT RATE | 2 7%
MEDIAN HOUSEHOLD INCOME | $121,393
AVERAGE COMMUTE TIME | 27 7 MINUTES
HOME OWNERSHIP RATE | 79 2%
*MEDIAN PROPERTY SALE PRICE | $725,300
IN THE KNOW...
5TIDBITSFROM THELOCALS
1 RELAX for afternoon tea at the Cherokee Ranch & Castle
2 EXPLORE over 1,200 acres at Hidden Mesa Open Space Trail
3. FIND unique furniture at Rare Finds Warehouse
4. CATCH world class trout in Cheesman Canyon
5. DINE at Blue Island Oyster Bar

Estate | 24 SOUTH
Slifer Smith & Frampton
Real
METRO
SOURCE| 2020 datafromDataUSA&US Bureauof Labor Statistics *MedianSalefor SingleFamily&Duplex for 2022
Rate:Q4 2022
*Unemployment
Pictured | Waterton Canyon
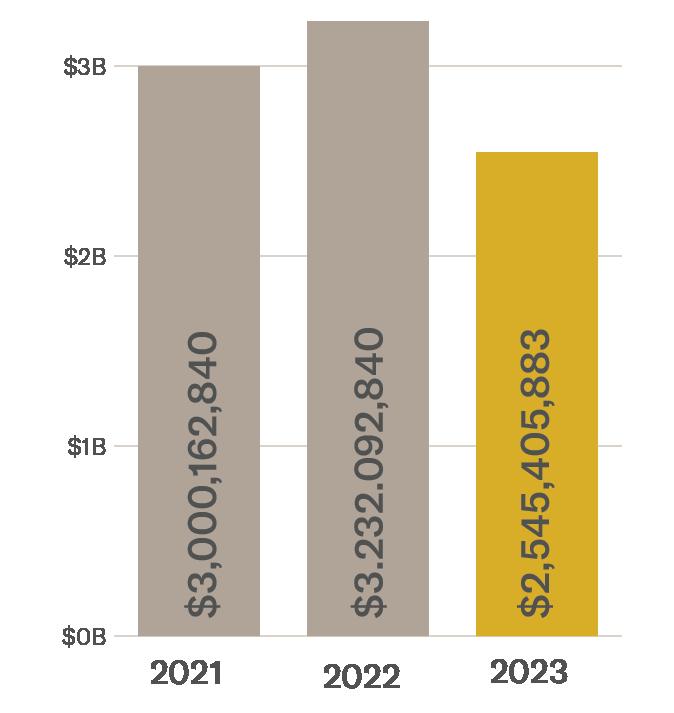
The Slifer Report 2023 | 25 SINGLE FAMILY & DUPLEX SALES VOLUME NO OF SALES AVG DAYS ON MARKET AVG SALE MEDIAN SALE 2019 $1,890,716,469 3,193 36 $592,144 $510,000 2020 $1,861,324,785 3,087 36 $602,956 $530,000 2021 $2,716,739,406 3,573 14 $760,352 $640,000 2022 $2,935,916,362 3,379 15 $868,871 $735,000 2023 $2,262,287,709 2,692 38 $840,374 $710,300 CONDOMINIUM & TOW NHOME SALES VOLUME NO. OF SALES AVG. DAYS ON MARKET AVG. SALE MEDIAN SALE 2019 $202,331,905 574 32 $352,495 $335,000 2020 $203,555,280 569 36 $357,742 $342,000 2021 $283,423,434 672 18 $421,761 $408,294 2022 $296,176,478 581 10 $509,770 $495,000 2023 $283,135,174 557 42 $508,322 $497,887 $277 AveragePricePer SquareFoot AREA highlights AVERAGE PRICE PER SQUARE FOOT SALE VS. LIST PRICE COMPARISON 2019 2020 2021 2022 2023 Single Family & Duplex $200 $205 $241 $288 $277 Condominium & Townhome $232 $238 $268 $322 $325 AVERAGE SALE / LAST LISTED PRICE Single Family & Duplex 100 00% Condominium & Townhome 100 00% 1861 FOUNDED AN ORIGINAL OF COLORADO'S FIRST 17 COUNTIES -3% MedianSalesPrice -20% No of Sales Douglas County Data SALES VOLUME COMPARISON
2022-23 NOTABLE SALES
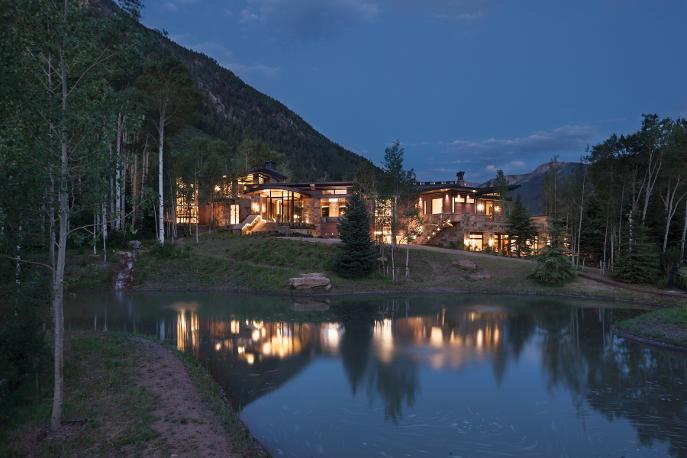
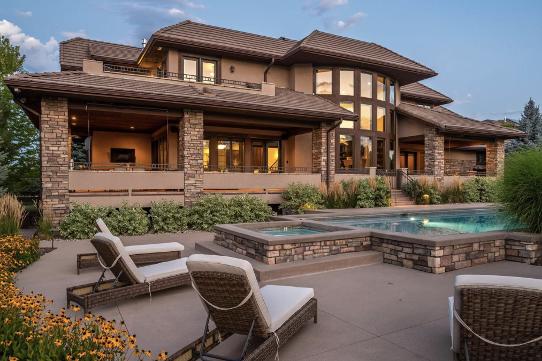
As a founding member Slifer Smith & Frampton is proud to fly the Forbes Global Properties flag from Aspen to the Front Range This powerful, global, network of top-tier independent brokerages gives our agents, and our clients, exclusive access to an invaluable network of the world's finest homes and the agents representing them.

In 20 22 our membership with Forbes Global Properties brought some incredible Front Range homes to a global audience. Here are some of our most notable residences of the year
NIWOT | $3,000,000 6745 NIWOT HILLS DRIVE
NIWOT | $3,350,000 6721NIWOT HILLS DRIVE
ASPEN | $51,000,000 45081& 45101CO-82
Real Estate | 26
Slifer Smith & Frampton
BOULDER | $4,250,000 255 BROOKSIDE COURT
BOULDER | $3,920,000 1507 PINE STREET
BOULDER | $4,900,00 6077 JAY ROAD
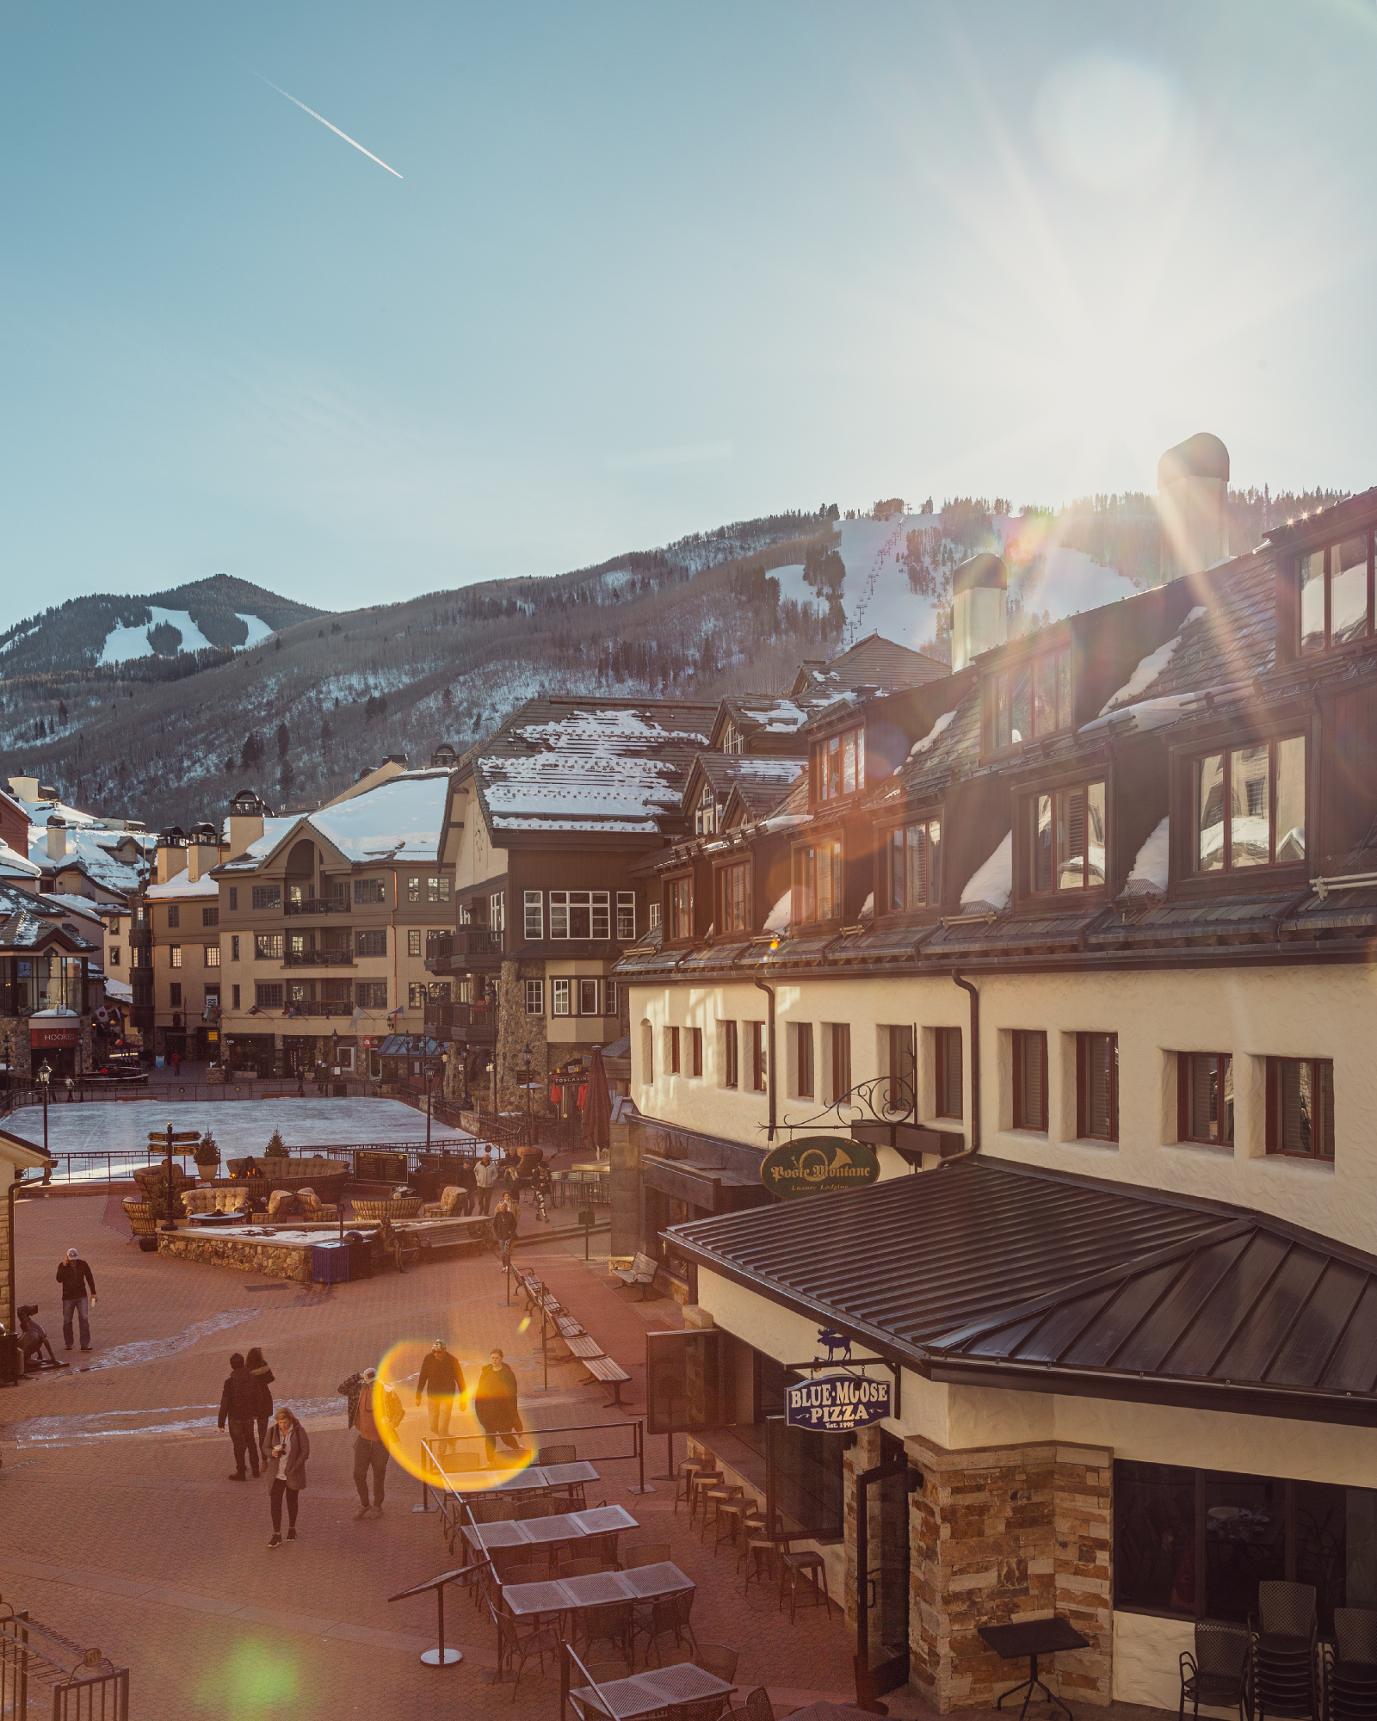
Pictured | Beaver Creek Village
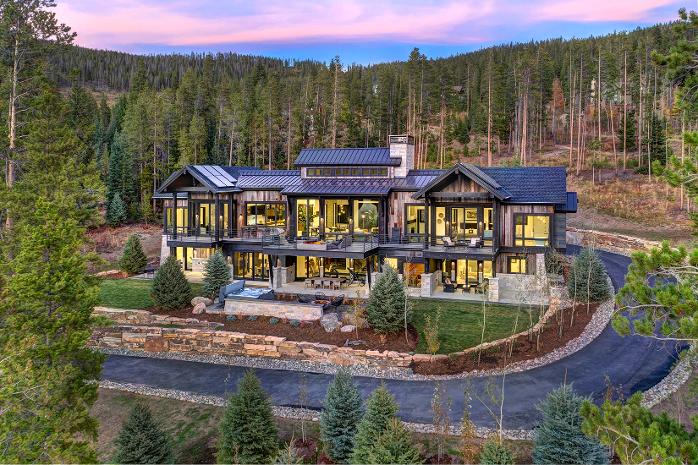
The Slifer Report 2023 | 27 DENVER | $9,500,000 9 CHERRY HILLS FARM COURT BRECKENRIDGE| $8,200,000 36 ROUNDS ROAD VAIL | $20,250,000 255 WILD ROSE BOULDER | $5,000,000 1145 TIMBER LANE BOULDER | $4,950,000 617 MAPLETON AVENUE BOULDER | $13,000,000 1489 SUNSET BOULEVARD View incredible properties from around the world anytime at: ForbesGlobalProperties com
S TA Y U P T O D A T E ALL YEAR & V I E W O U R P R O P E R T I E S ANYTIME S L I F E R F R O N T R A N G E . C O M


