THE SLIFER REPORT


20 23 MID YEA R ROA RING FORK VA LLEY REA L ESTATE MA RKET
STAY UP TO DATE ALL YEAR LONG
Our teamof market expertsupdatesThe Slifer Report throughout theyear.To see thelatest numbersanddiveevendeeper into thereport scanthecodeor visit: AspenRealEstate com/ Resources/The-Slifer-Report
SOURCE Soldresidential andlandpropertieswithinthe RoaringForkValley,countingbothlistingand buysidesfromJanuary1,2023- June30,2023 Sourceof all datainthisreport isthe AspenandGlenwoodSpringsMultipleListing Services Informationisdeemedreliablebut not guaranteed Consult your Slifer Smith&Frampton broker for moreinformation.

6 | 7 | 7 | 8 | 9 | 10 | 11 | 12 | 13 | 14 | 15 | 16 | 17 | 18 | 19 | 20 | 21 | MARKET OVERVIEW COMMERCIAL OVERVIEW LAND OVERVIEW ASPEN WOODY CREEK SNOWMASS VILLAGE OLD SNOWMASS BASALT MISSOURI HEIGHTS CARBONDALE REDSTONE MARBLE GLENWOOD SPRINGS NEW CASTLE SILT RIFLE NEW DEVELOPMENTS
Real Estate | 2 CONTENTS
Slifer Smith & Frampton
A LETTER FROM OUR PRESIDENT
We are off to an exciting start for 2023 in the Roaring Fork Valley and strong demand continues to strengthen our real estate market despite shifting national fundamentals For Slifer Smith & Frampton thishasbeen awelcomere-balancing of our market asweareworkingour waytowardsanewandhealthier normal

The key to this re-balancing has been a marginal rise in inventory, up only 6% from thistime last year, and this small gain hasbeen awelcome sight for buyers looking to find their homesherein theRoaring Fork Valley Whileaslight change, it is encouraging to see inventory headed in a positive direction as our communities continue to seek growth We are proud to be helping on that front with our development division working on several new projects around the Roaring Fork Valley bringing new homes to market including River Grand Residences in Glenwood Springs, Cirque x Viceroy in Snowmass Village and Eagle?sRidgeRanchinNewCastle
On the flip side, prices remain undoubtedly strong across the region Despite someominouspreviouspredictionsfrom experts,asof June,year-to-dateprices are only down 9%from the roaring highs of 2022. In addition, our sale-to-list price ratio has been normalizing from 99% this time last year to the still incredibly strong 97% we are seeing today These are still very favorable conditions for those thinking of selling their home in our communities Meanwhile, pending sales continue to rise across the Roaring Fork Valley demonstrating buyers are still motivated to capture their piece of the Aspen Valleylifewithpricesremaininghighandsale-to-list ratiosstill at nearly100%
For the second half of 2023I expect, along with numerous market experts, that wewill continueto seepricesstabilizehereand acrossthenation Trendsexpect that we may see a slight fall in average sales prices into early 2024 before they likely grow each year through 2027 Limited inventory, and tremendous demand for the lifestyle in our mountain communities will keep our markets robust despiteprevailingnational headwinds.
As for Slifer Smith & Frampton, we are proud to continue to lead the way in Roaring Fork Valley real estate as the number one independent brokerage in the area You may have heard we have grown recently, with a large expansion last year into theFront Rangemarket connecting our cityand mountain communities like never before The strength of our network across Colorado, and our commitment to locally owned and focused real estate have helped us hold our coveted positionasthe#1independent real estatecompanyinColorado
Please enjoy looking through this midyear edition of The Slifer Report to dive deep into the details of your specific market area If you have any questions about the data, you see here or how it may impact your real estate goals, please don? t hesitateto reachout to your Slifer Smith&Framptonbroker.
KRISTA KLEES
 Market President Roaring Fork Valley
WE ARE SLIFER SMITH & FRAMPTON
COLORADO'S REAL ESTATE
270+ world-class agents across Colorado

120+ dedicated & local support staff
$10B+ sales volume since 2020
#1
Colorado's leading, independent real estate company
100% Colorado owned & operated
TE COMPANY

Roaring Fork Valley 6 LOCATIONS Vail Valley 12 LOCATIONS Summit County 5 LOCATIONS Front Range 5 LOCATIONS
MARKET OVERVIEW
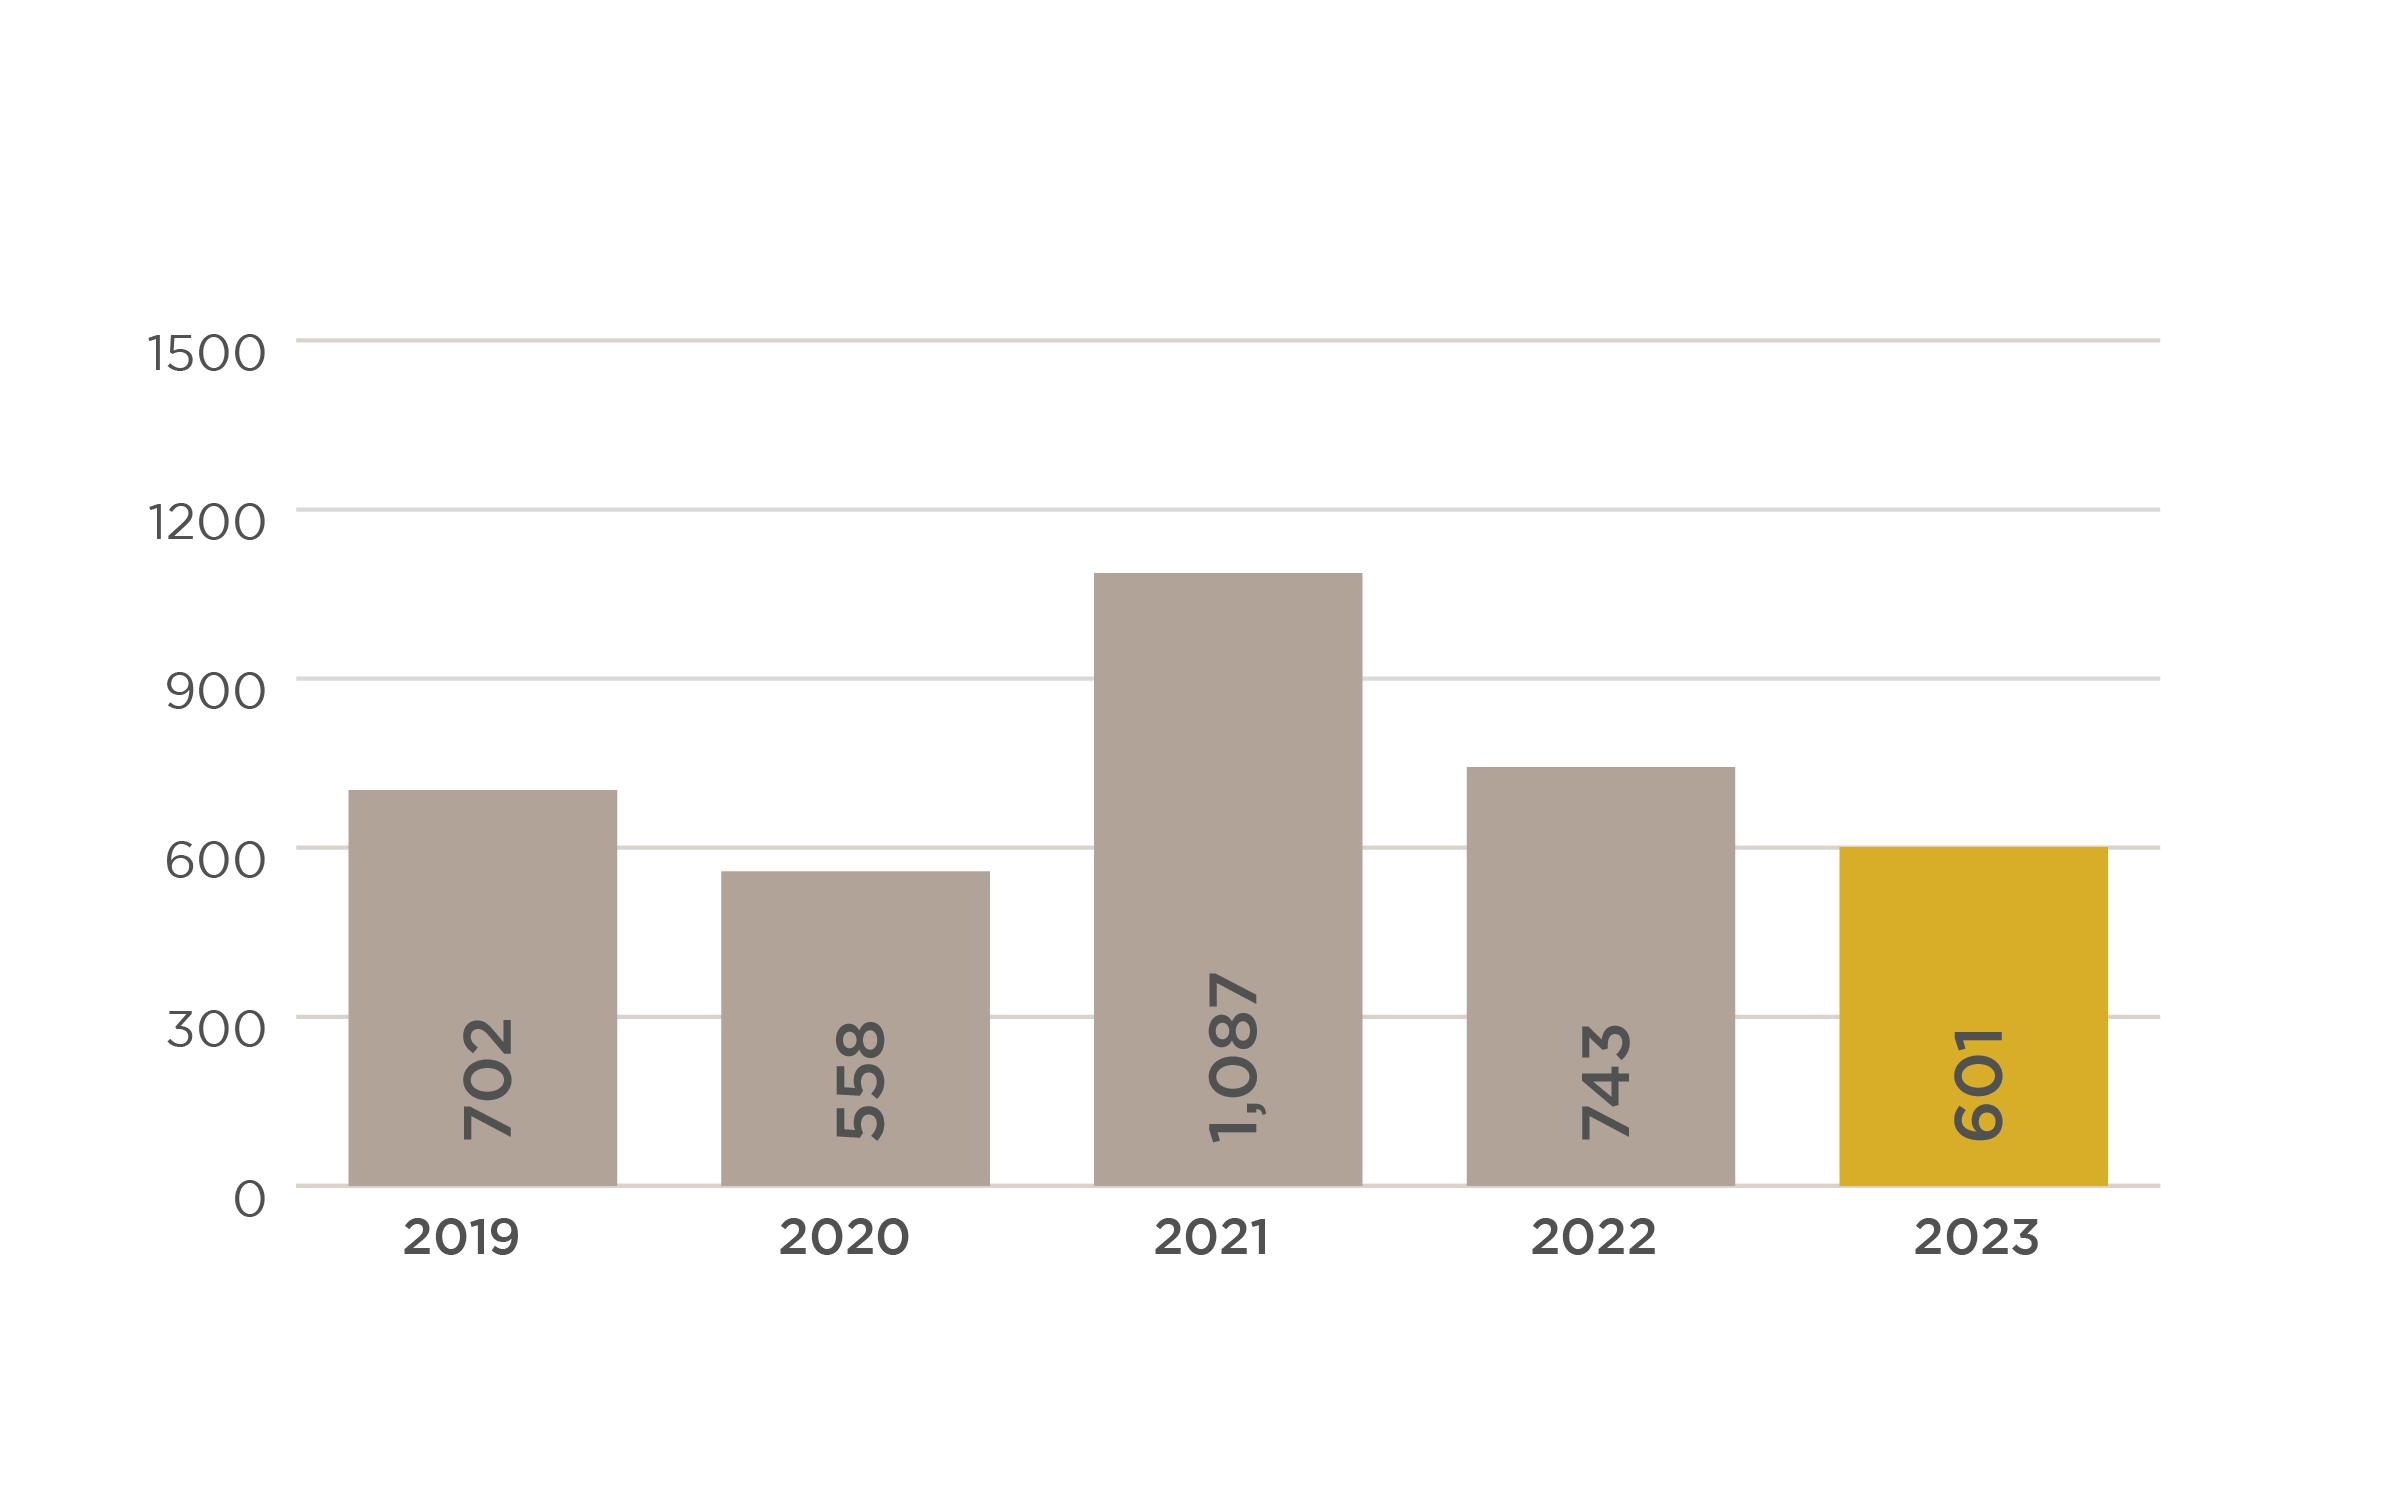
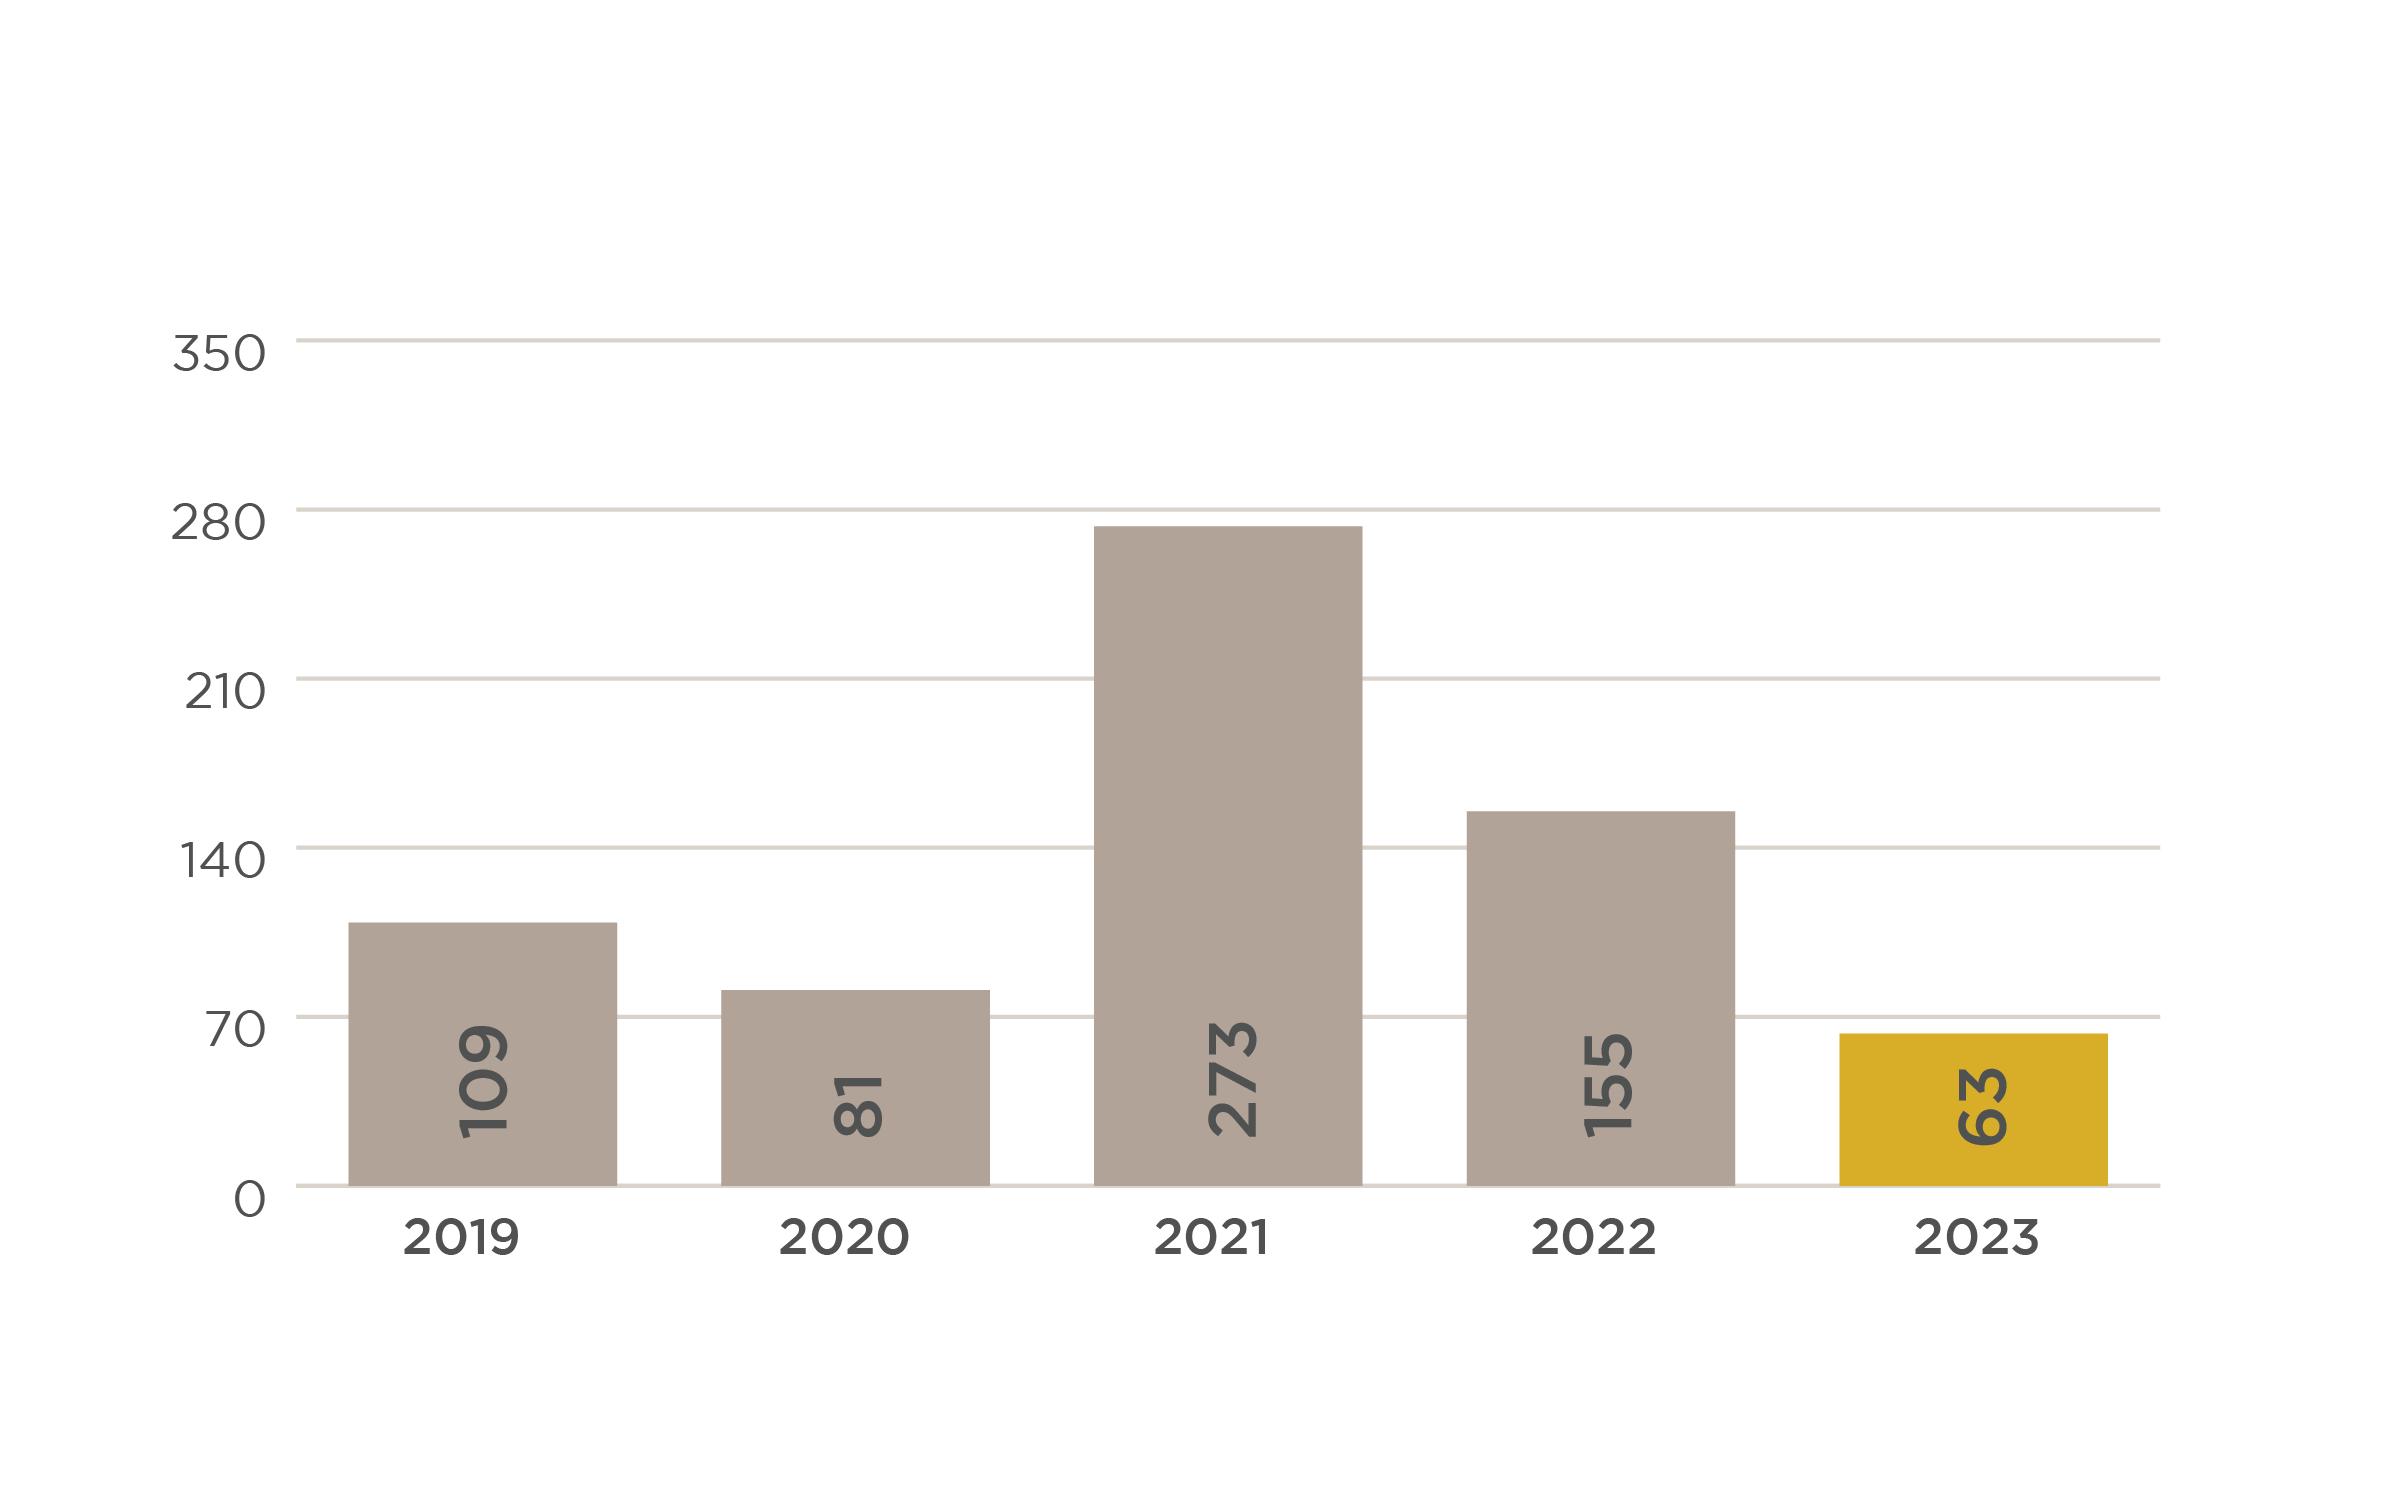
TRANSACTION VOLUME COMPARISON
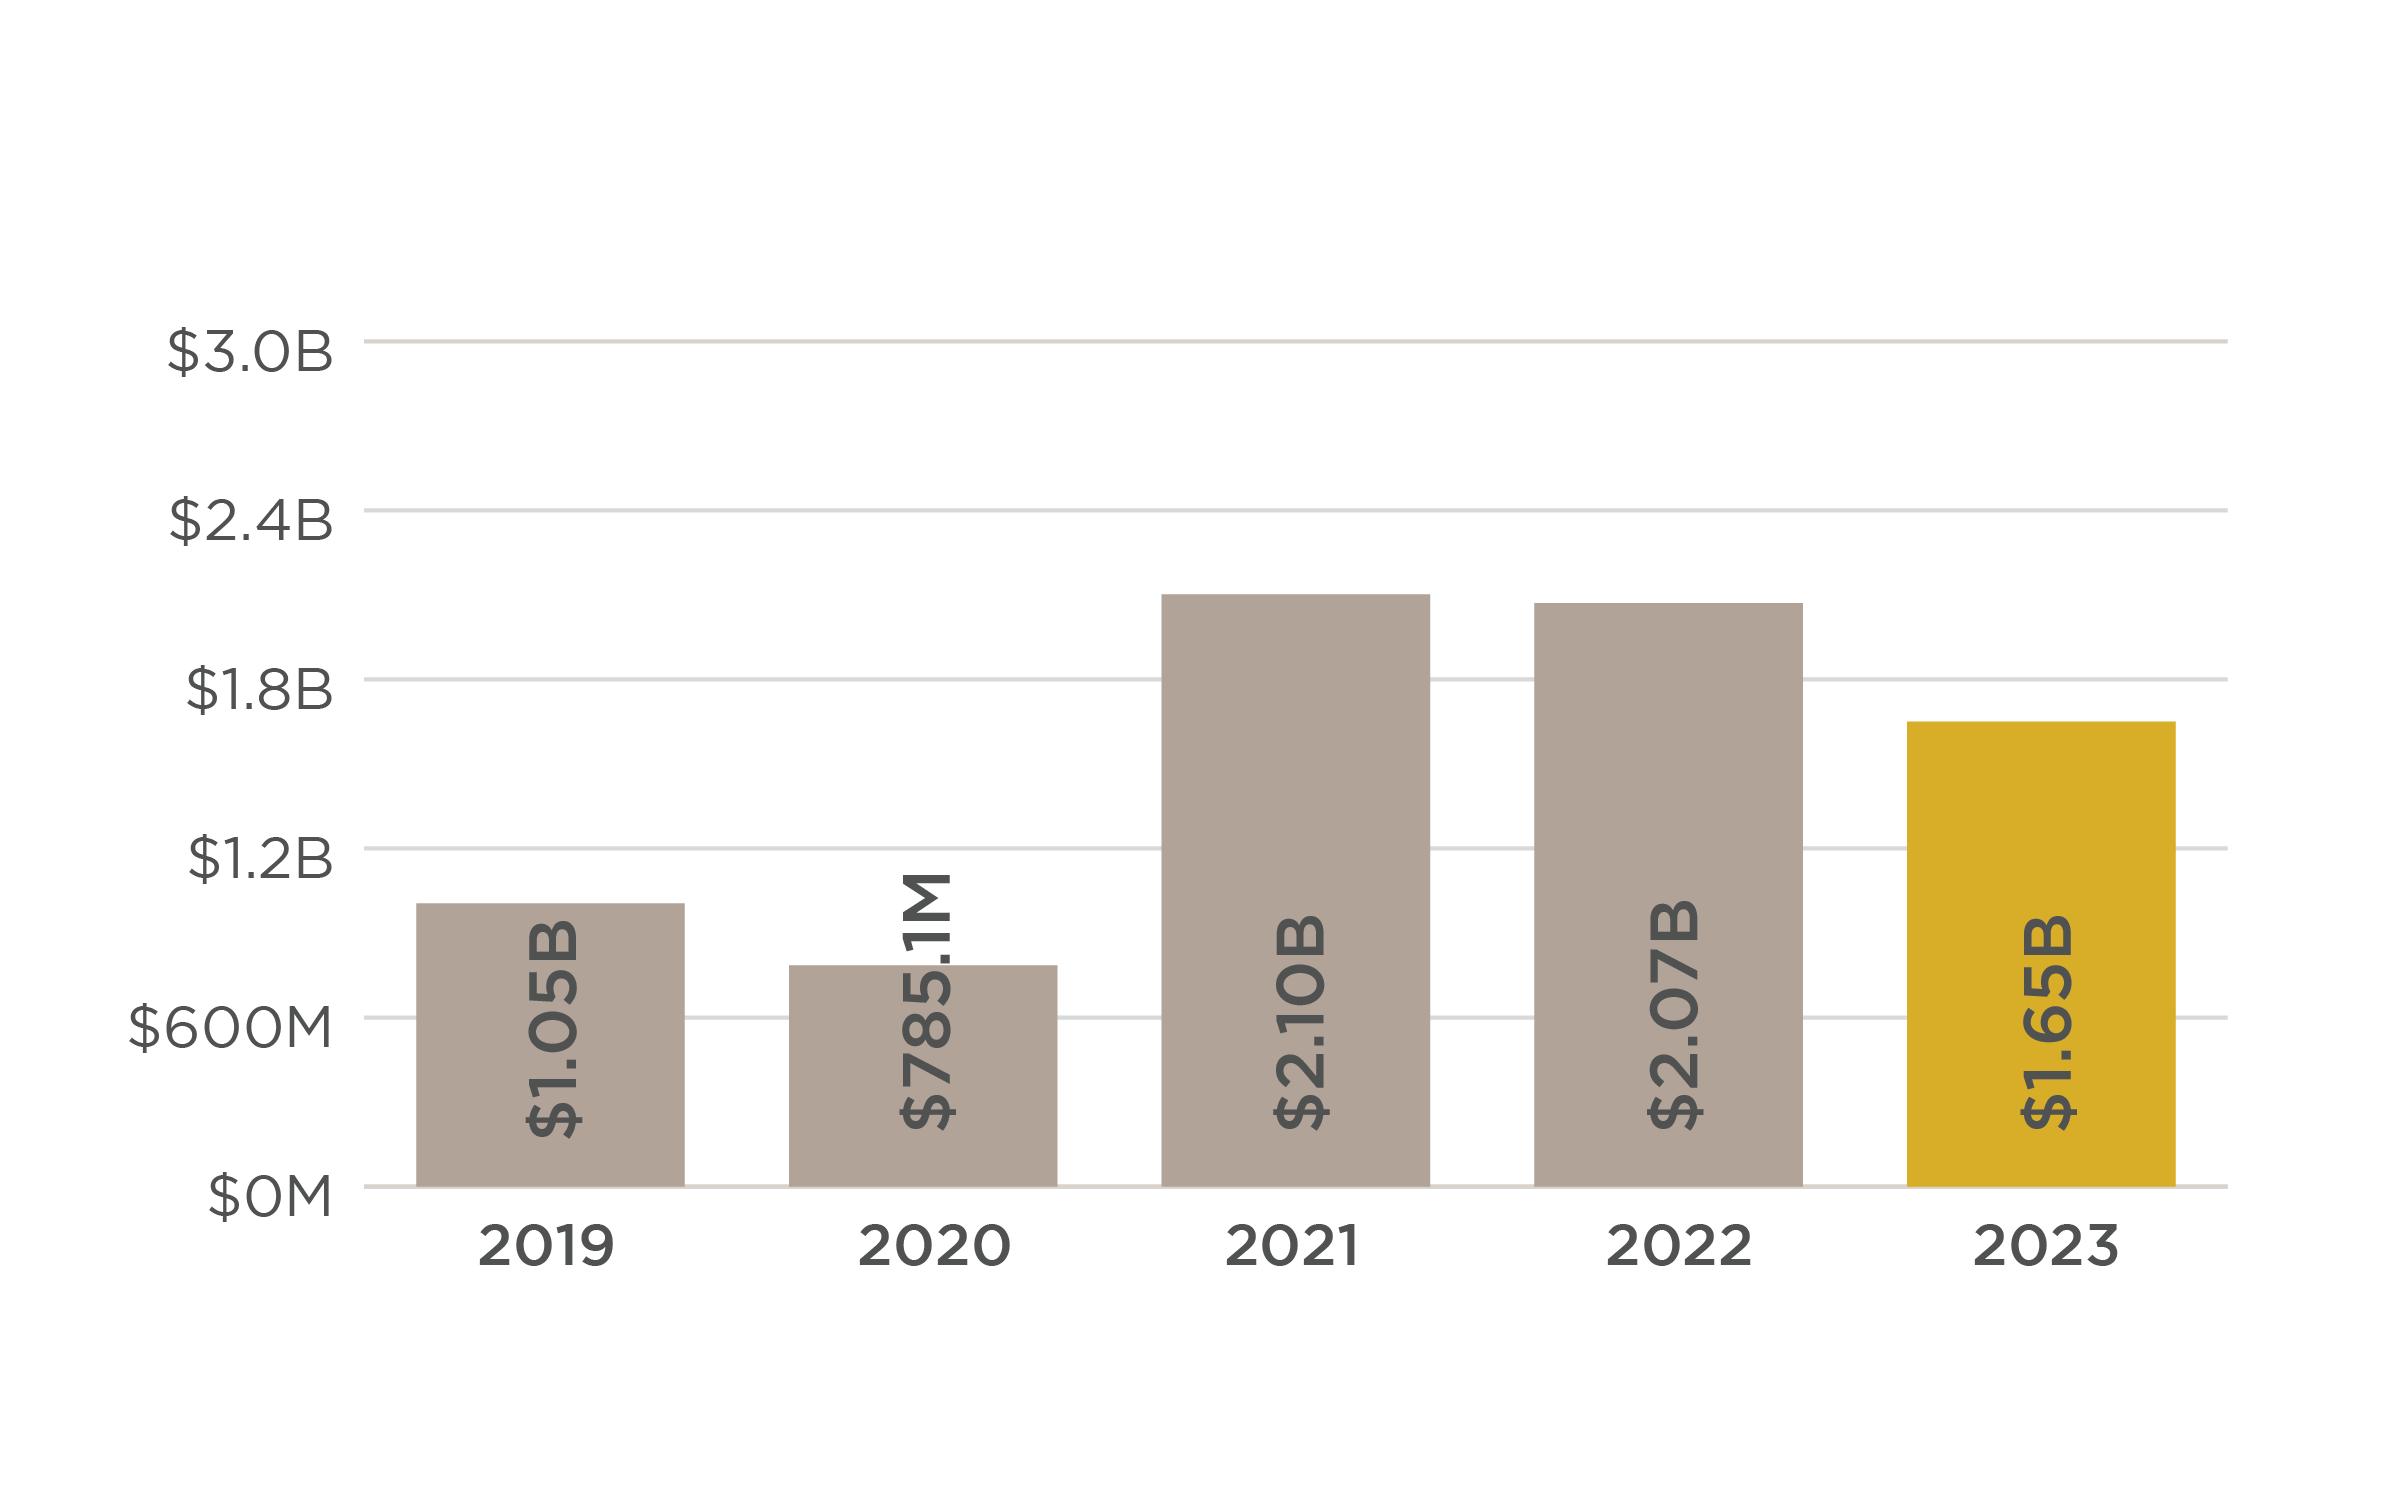
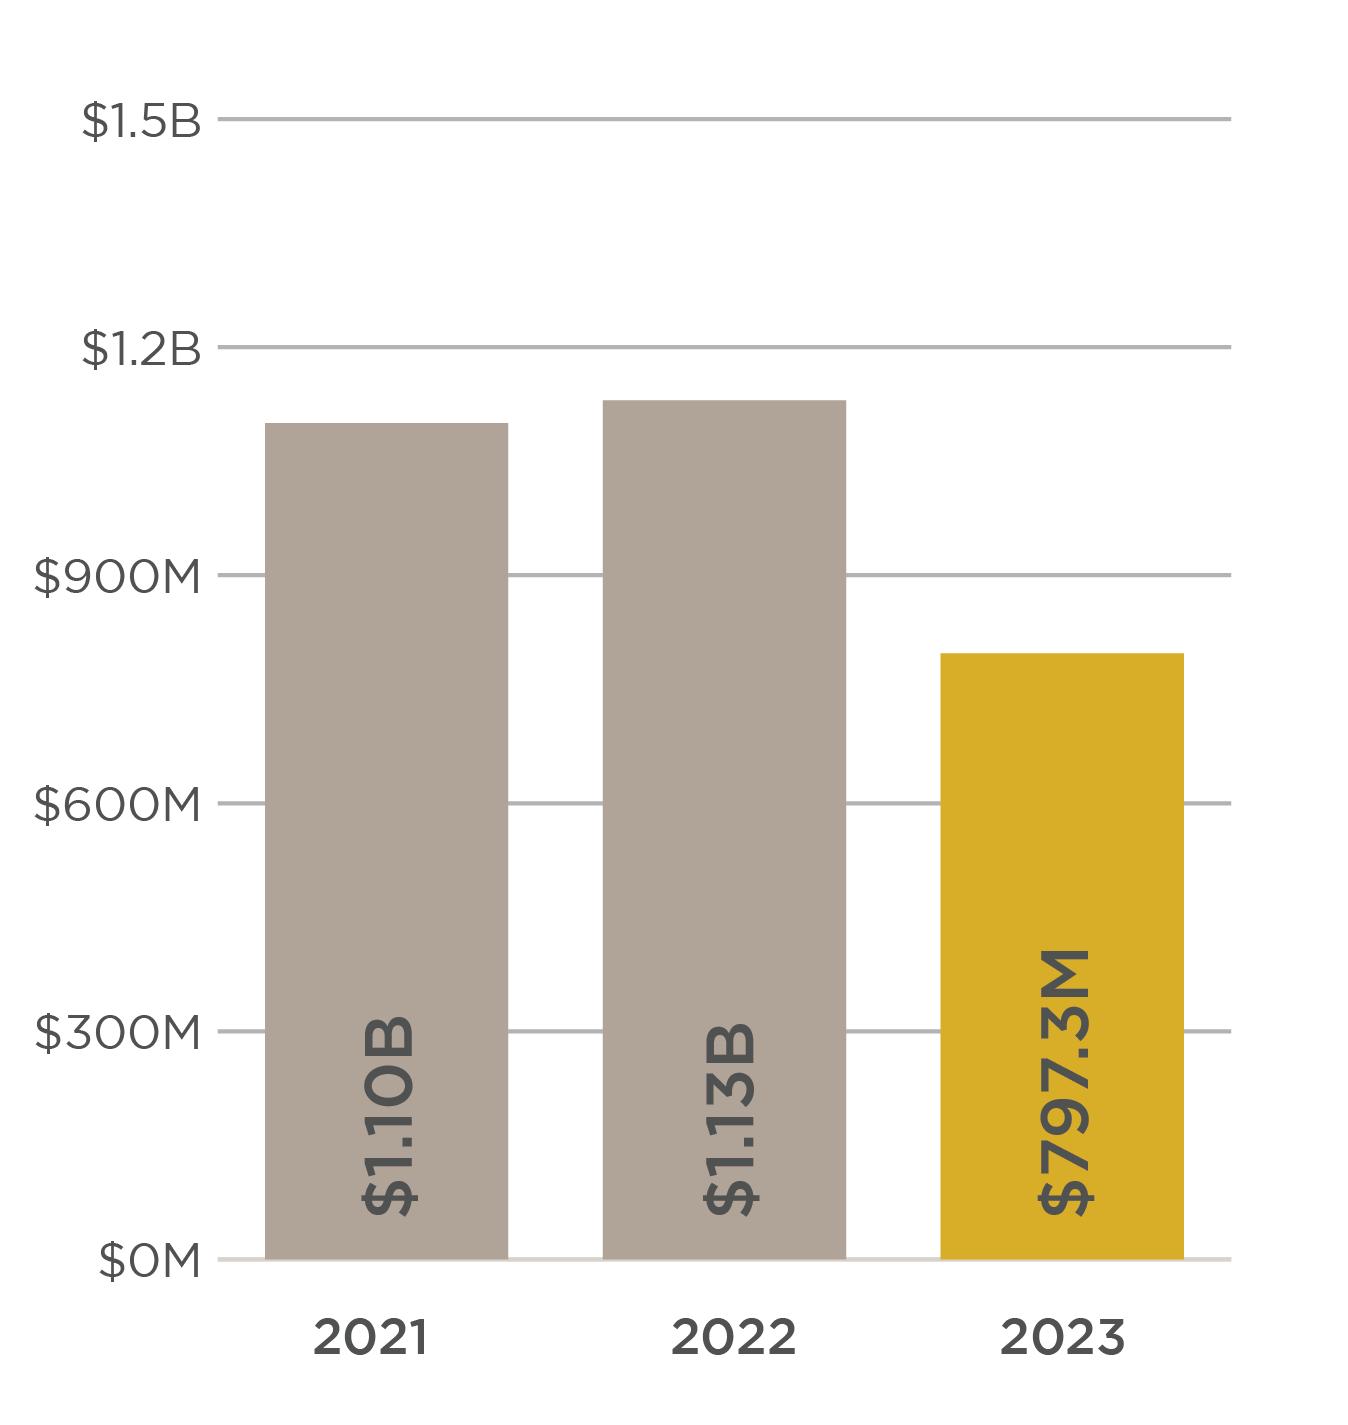
SALES VOLUME COMPARISON
Real Estate | 6
Slifer Smith & Frampton
COMMERCIAL & LAND OVERVIEW
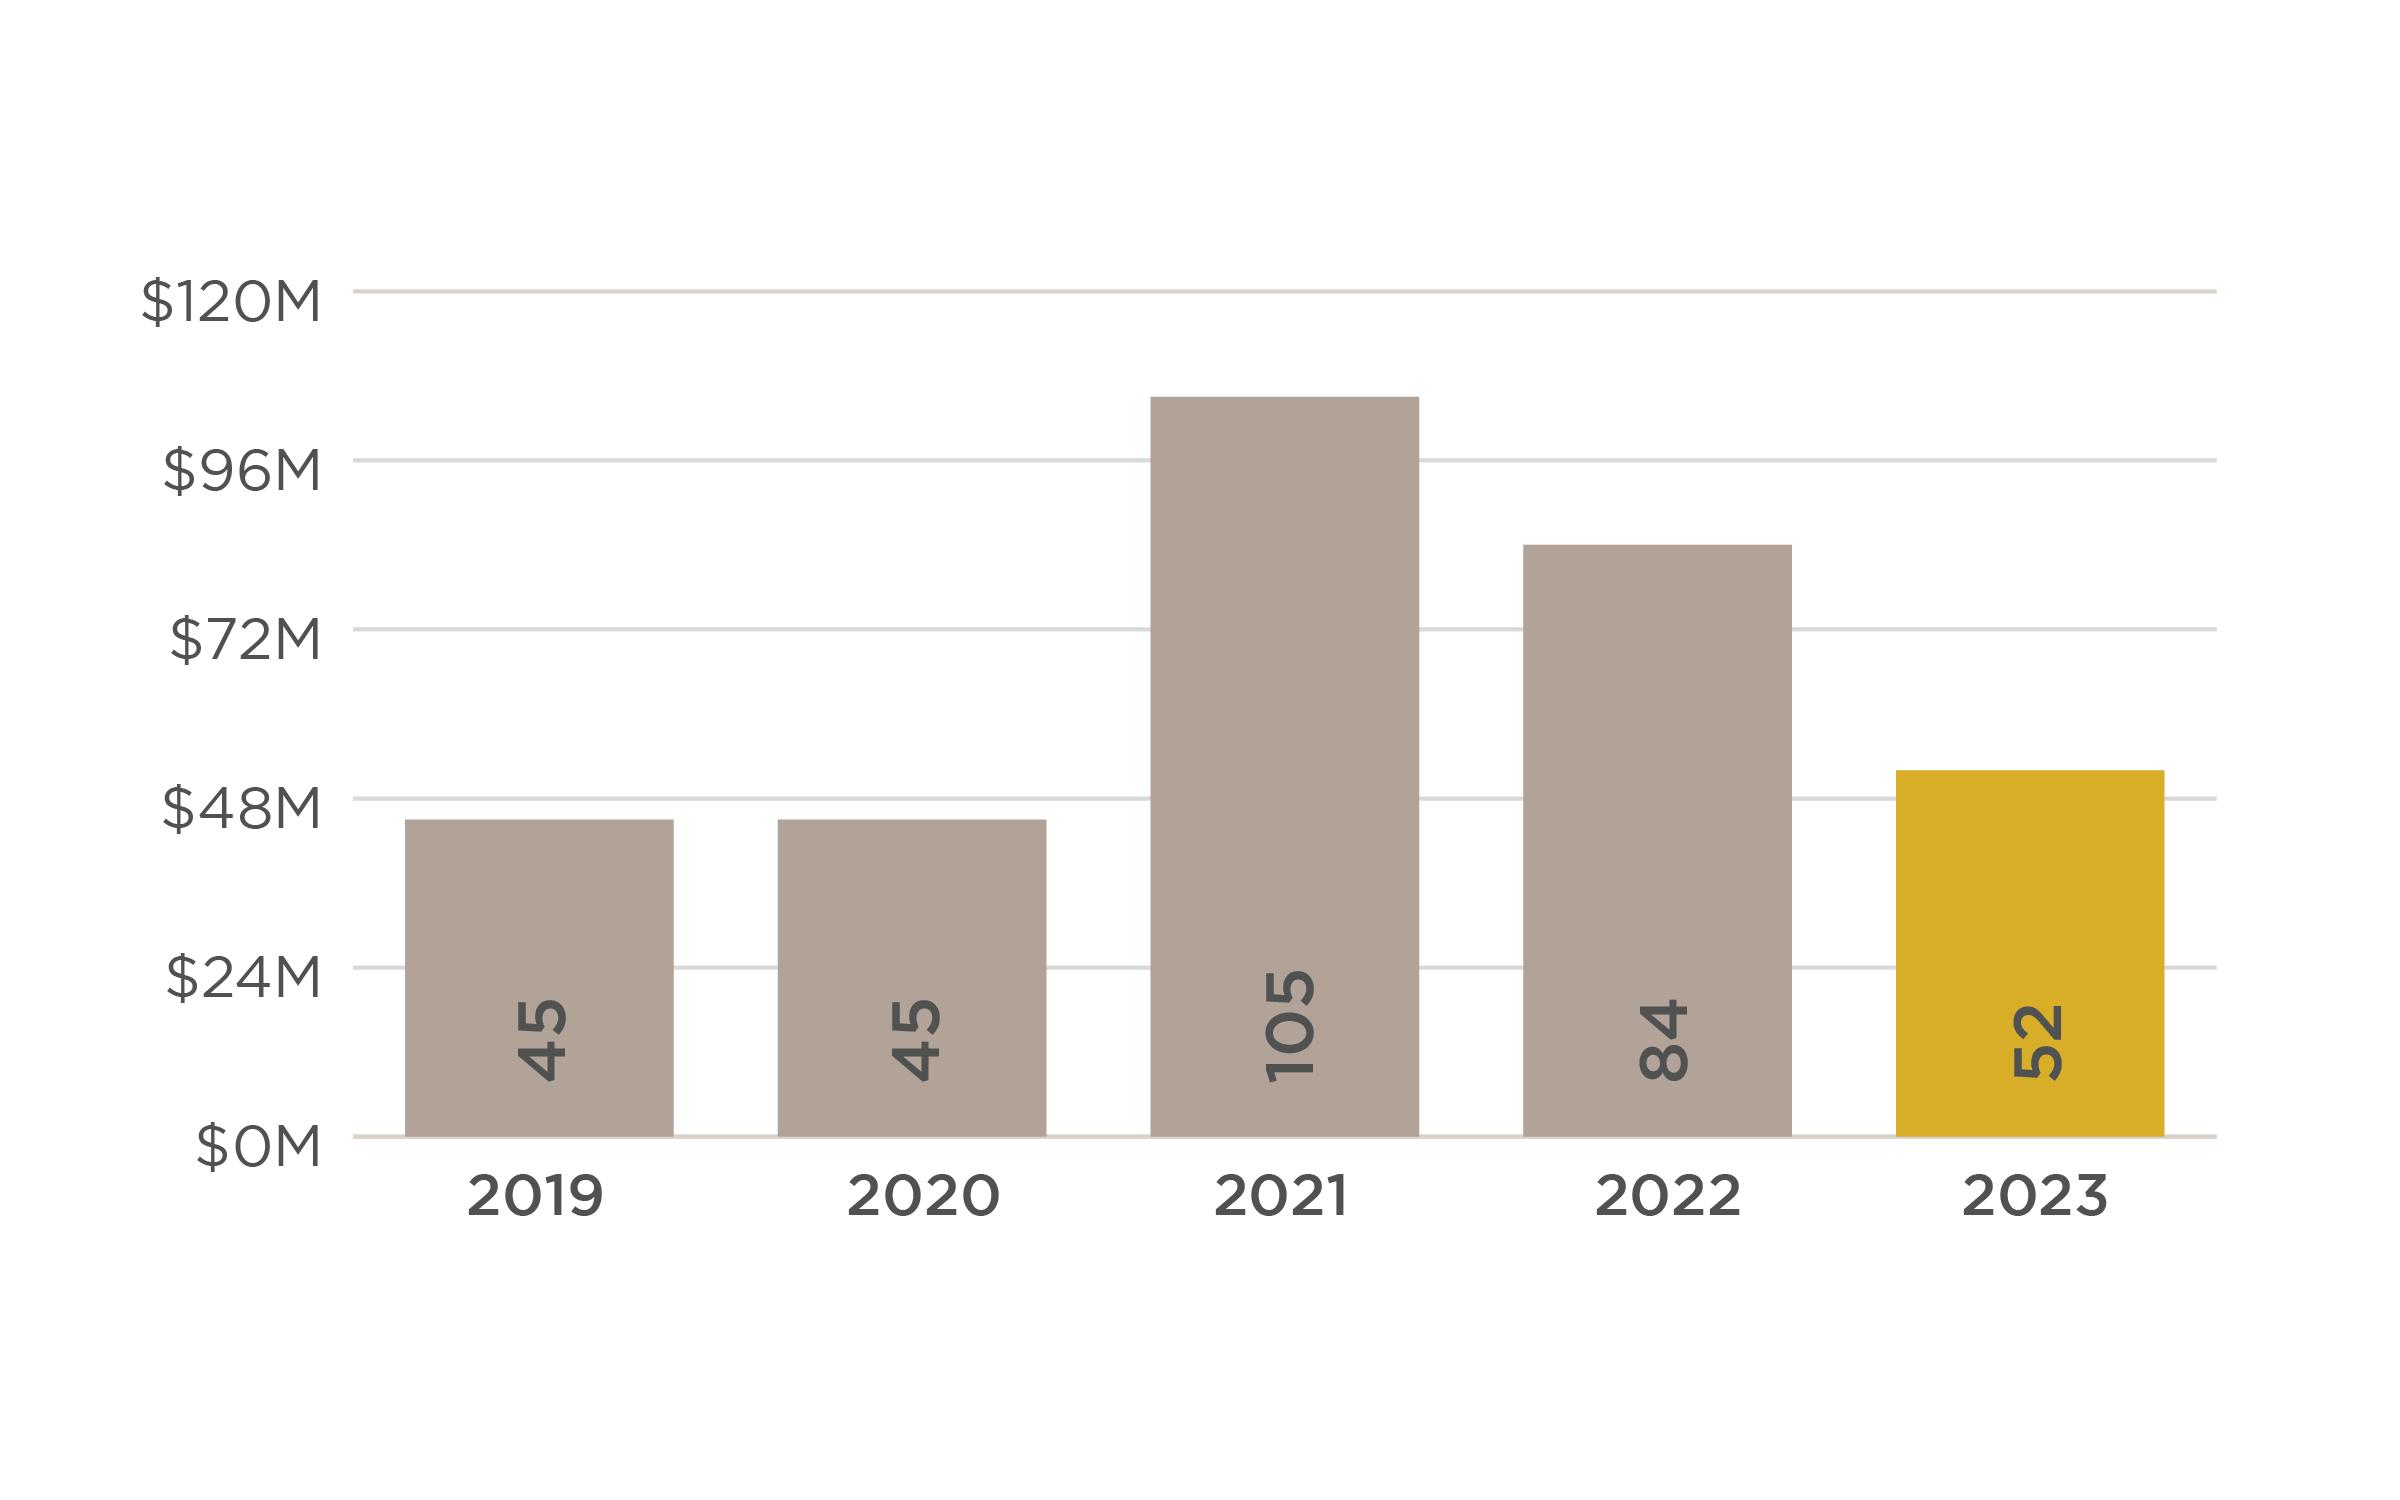
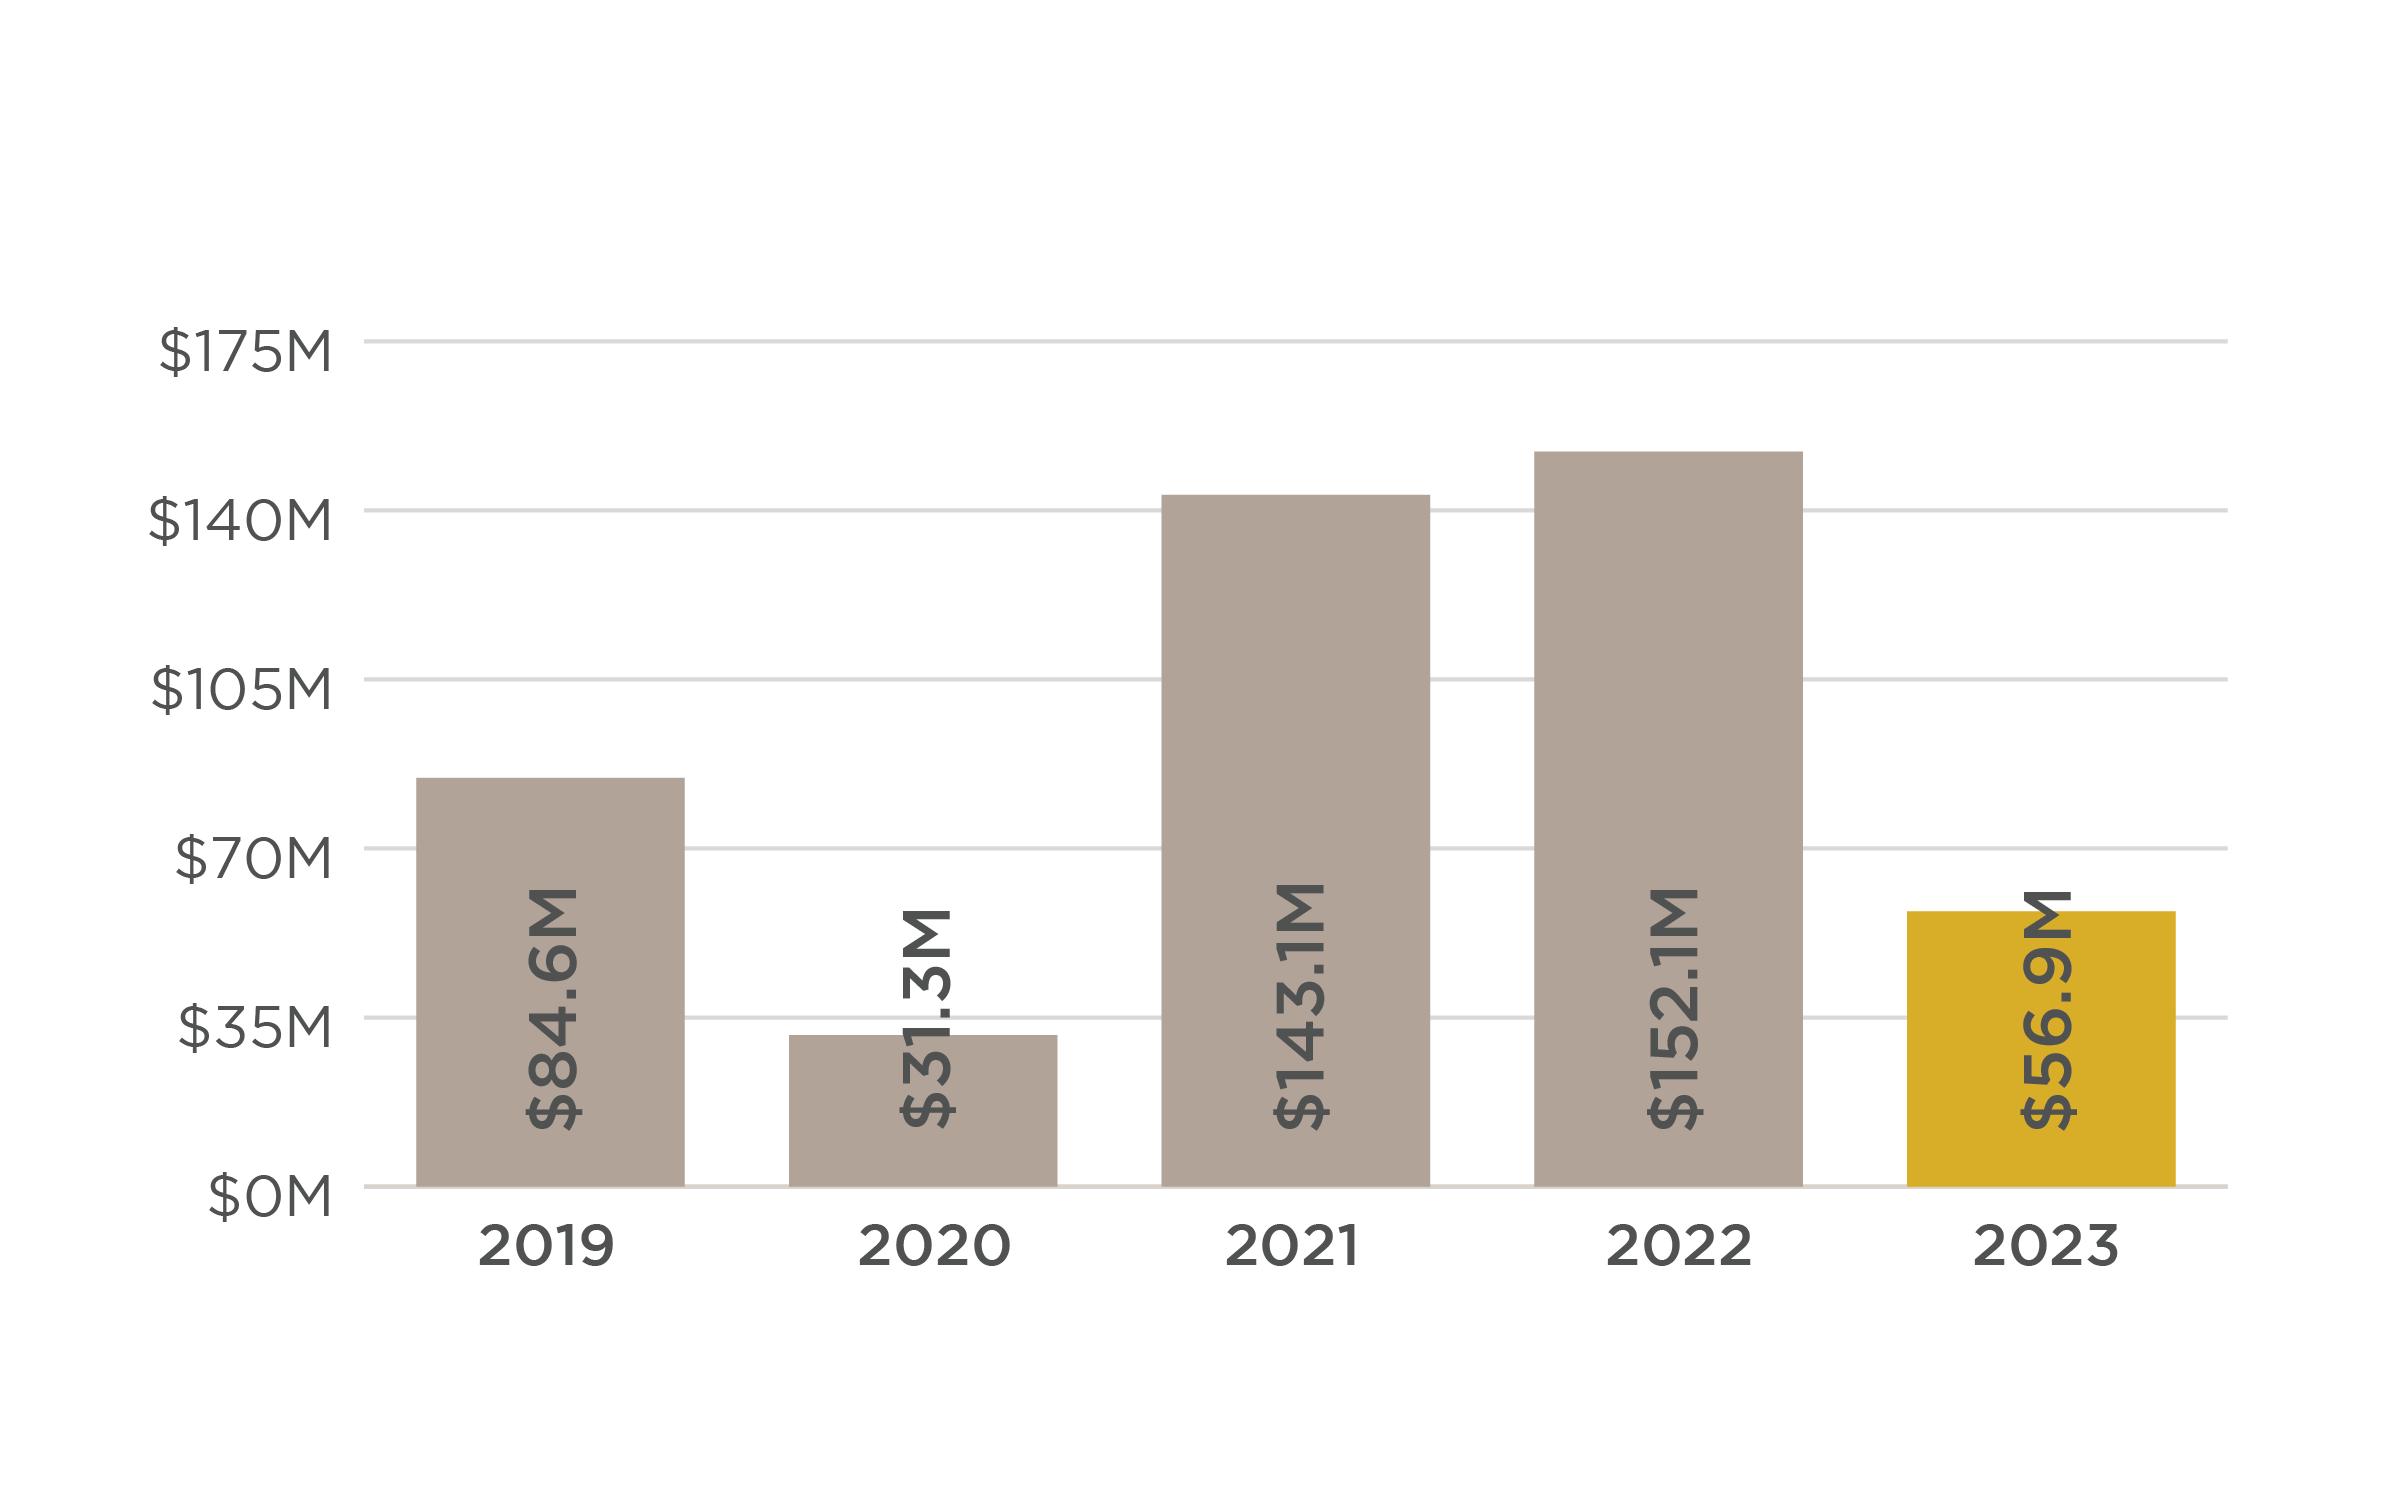
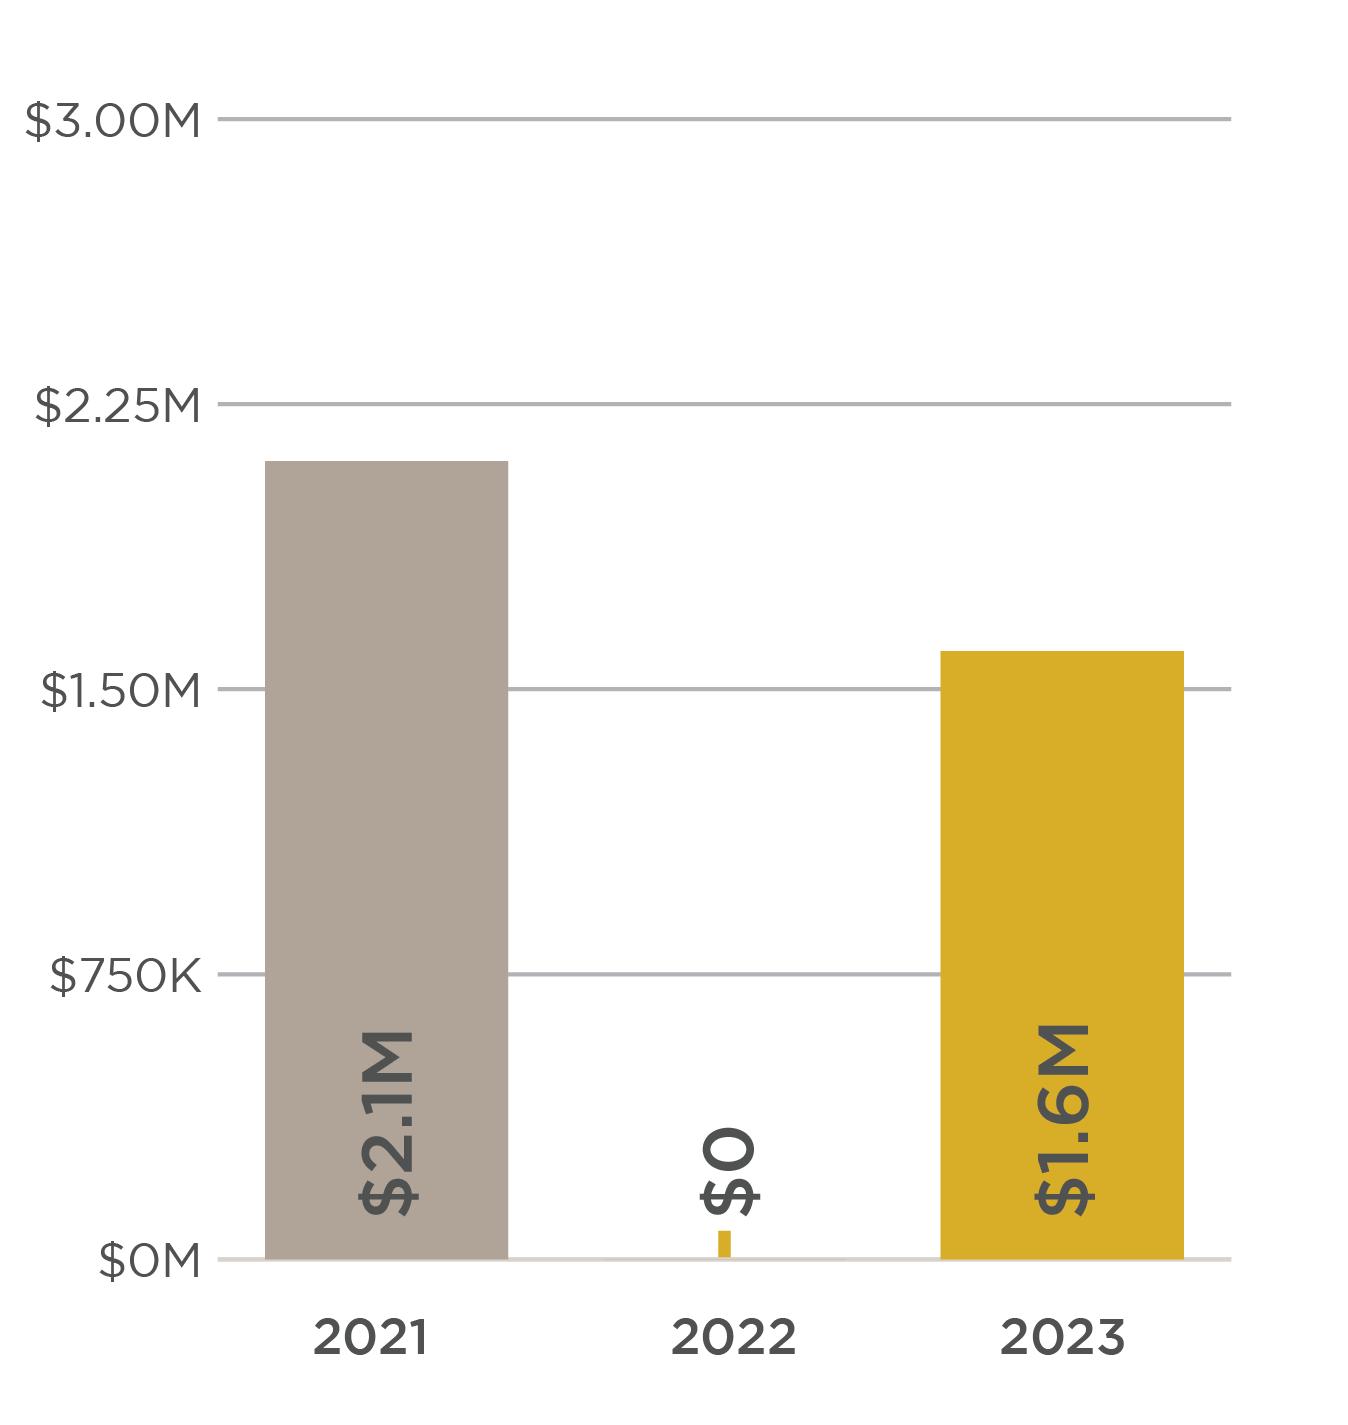
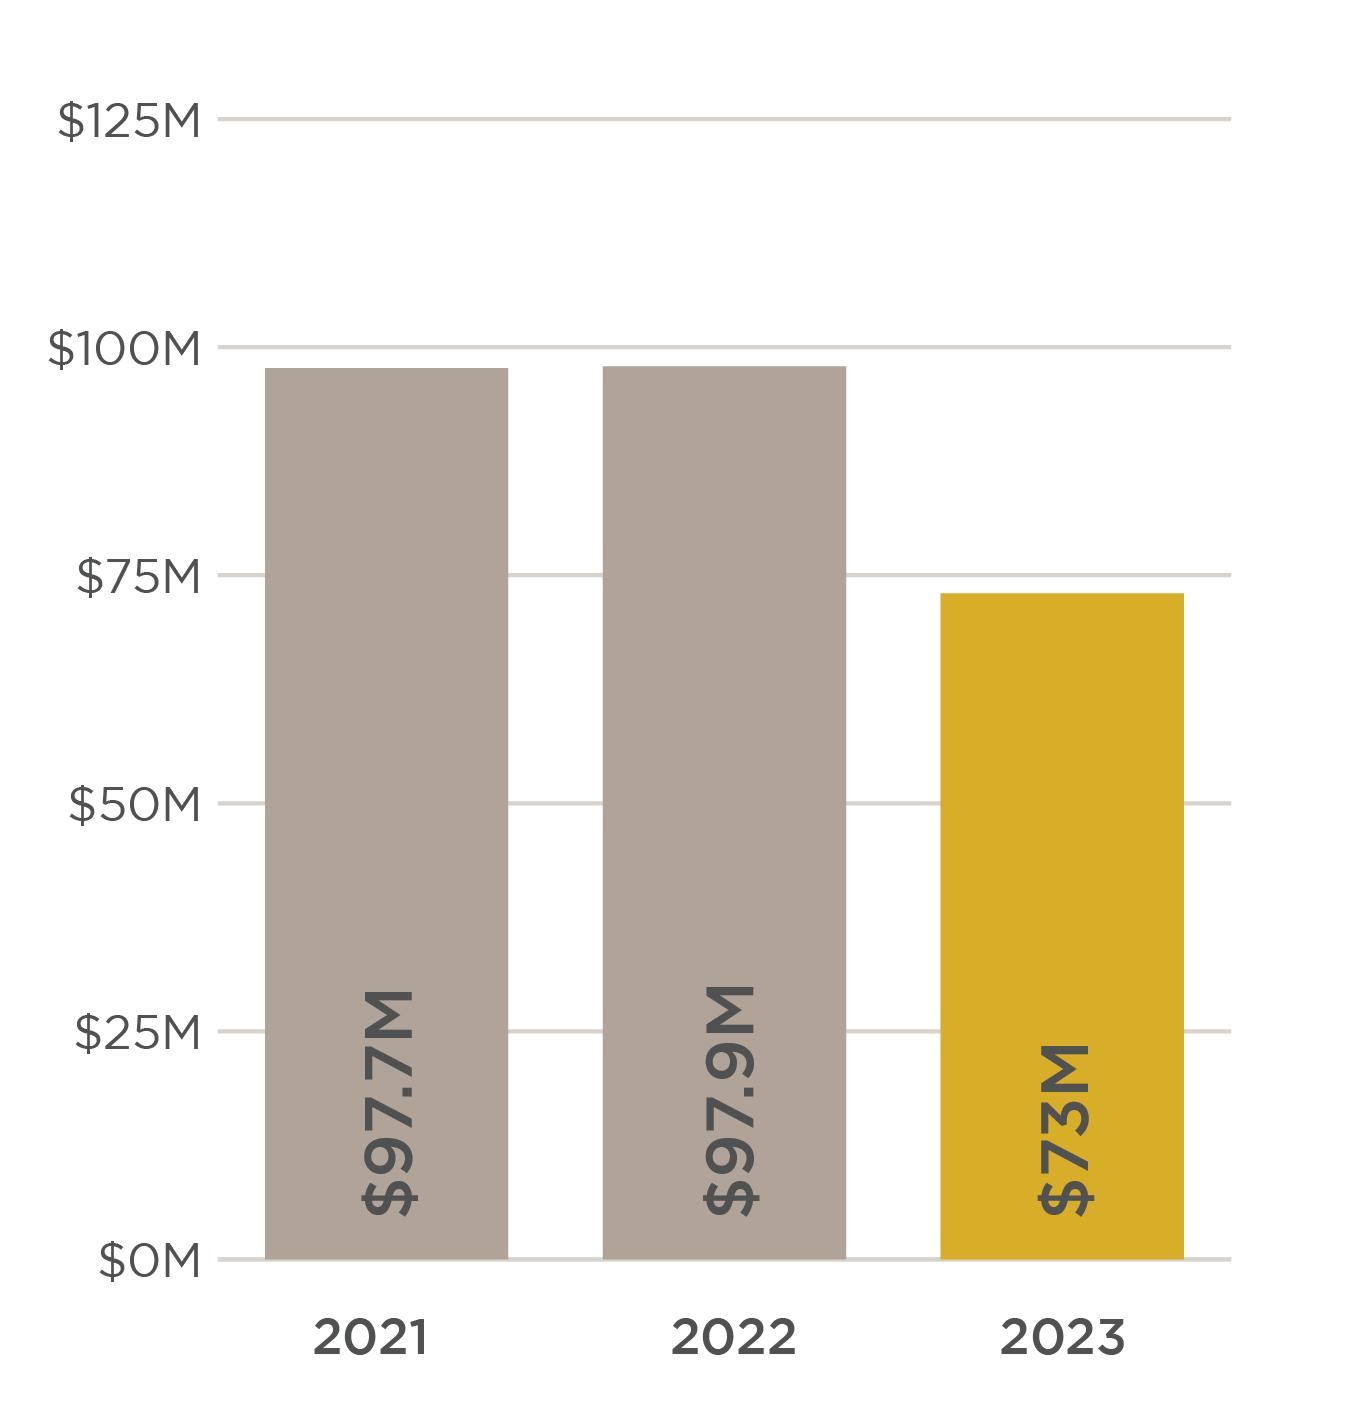
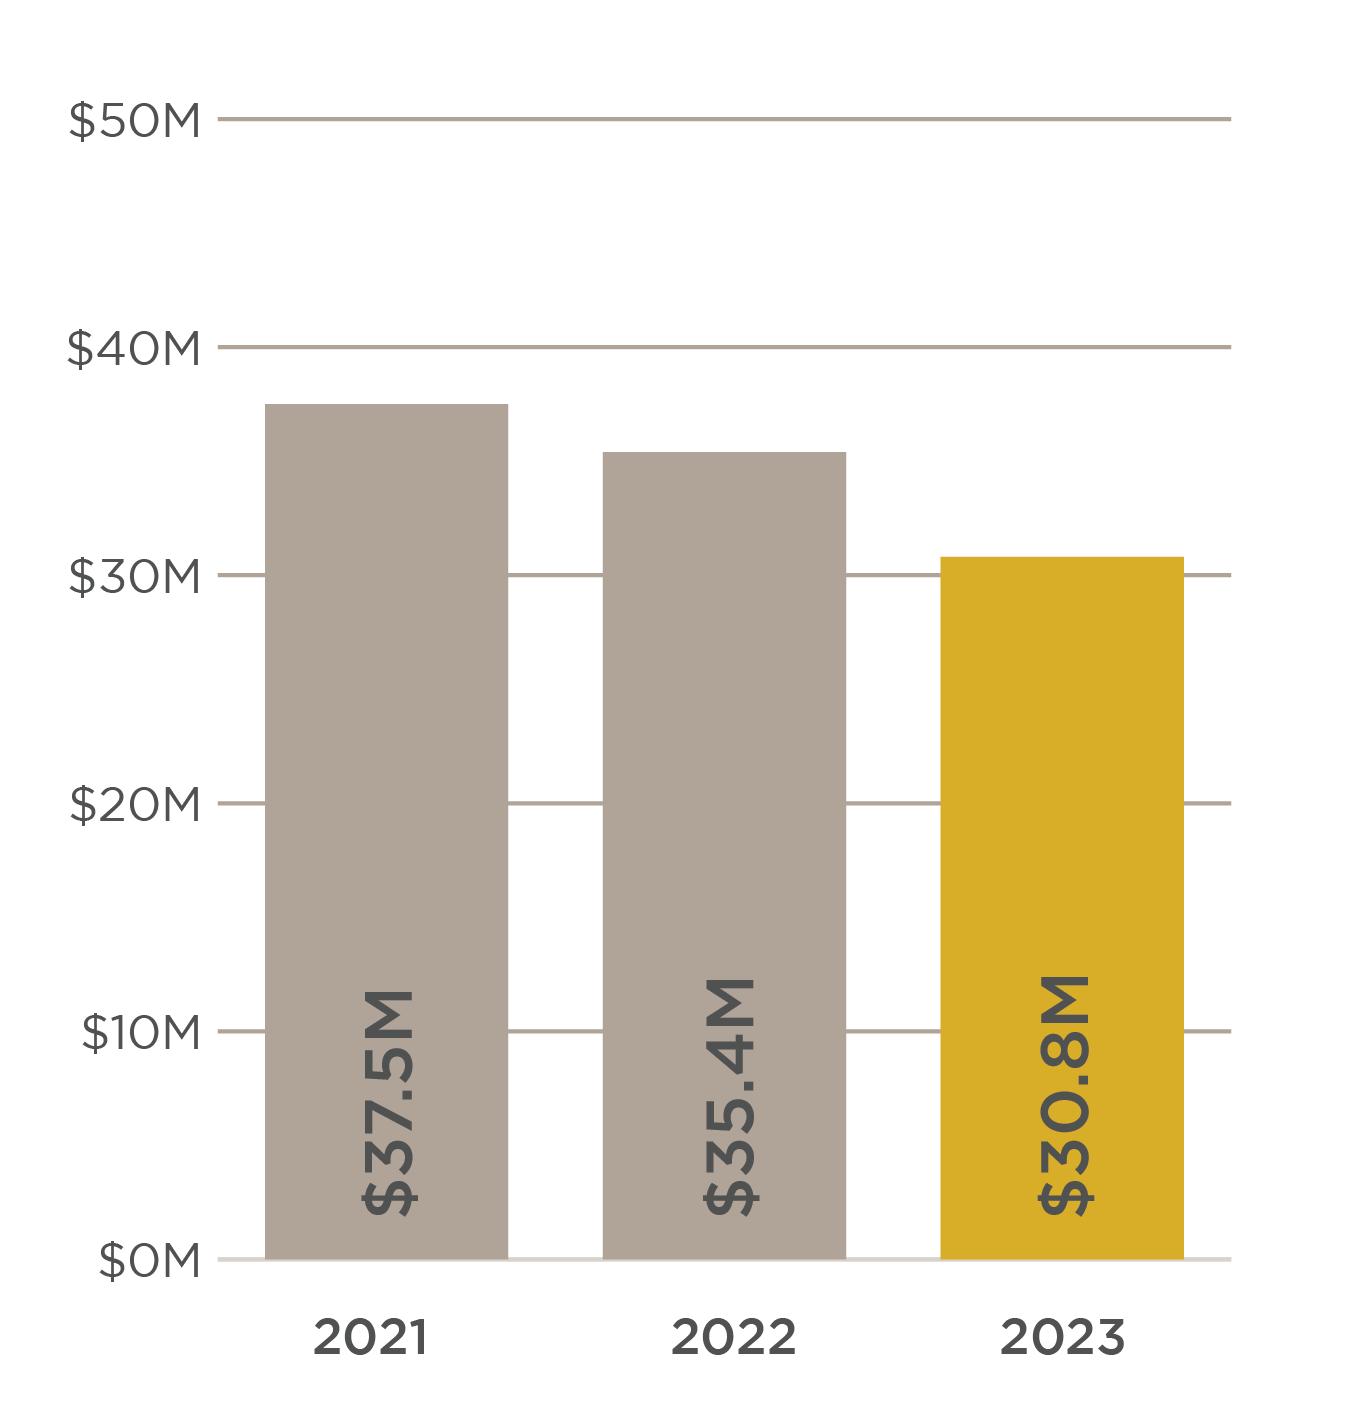
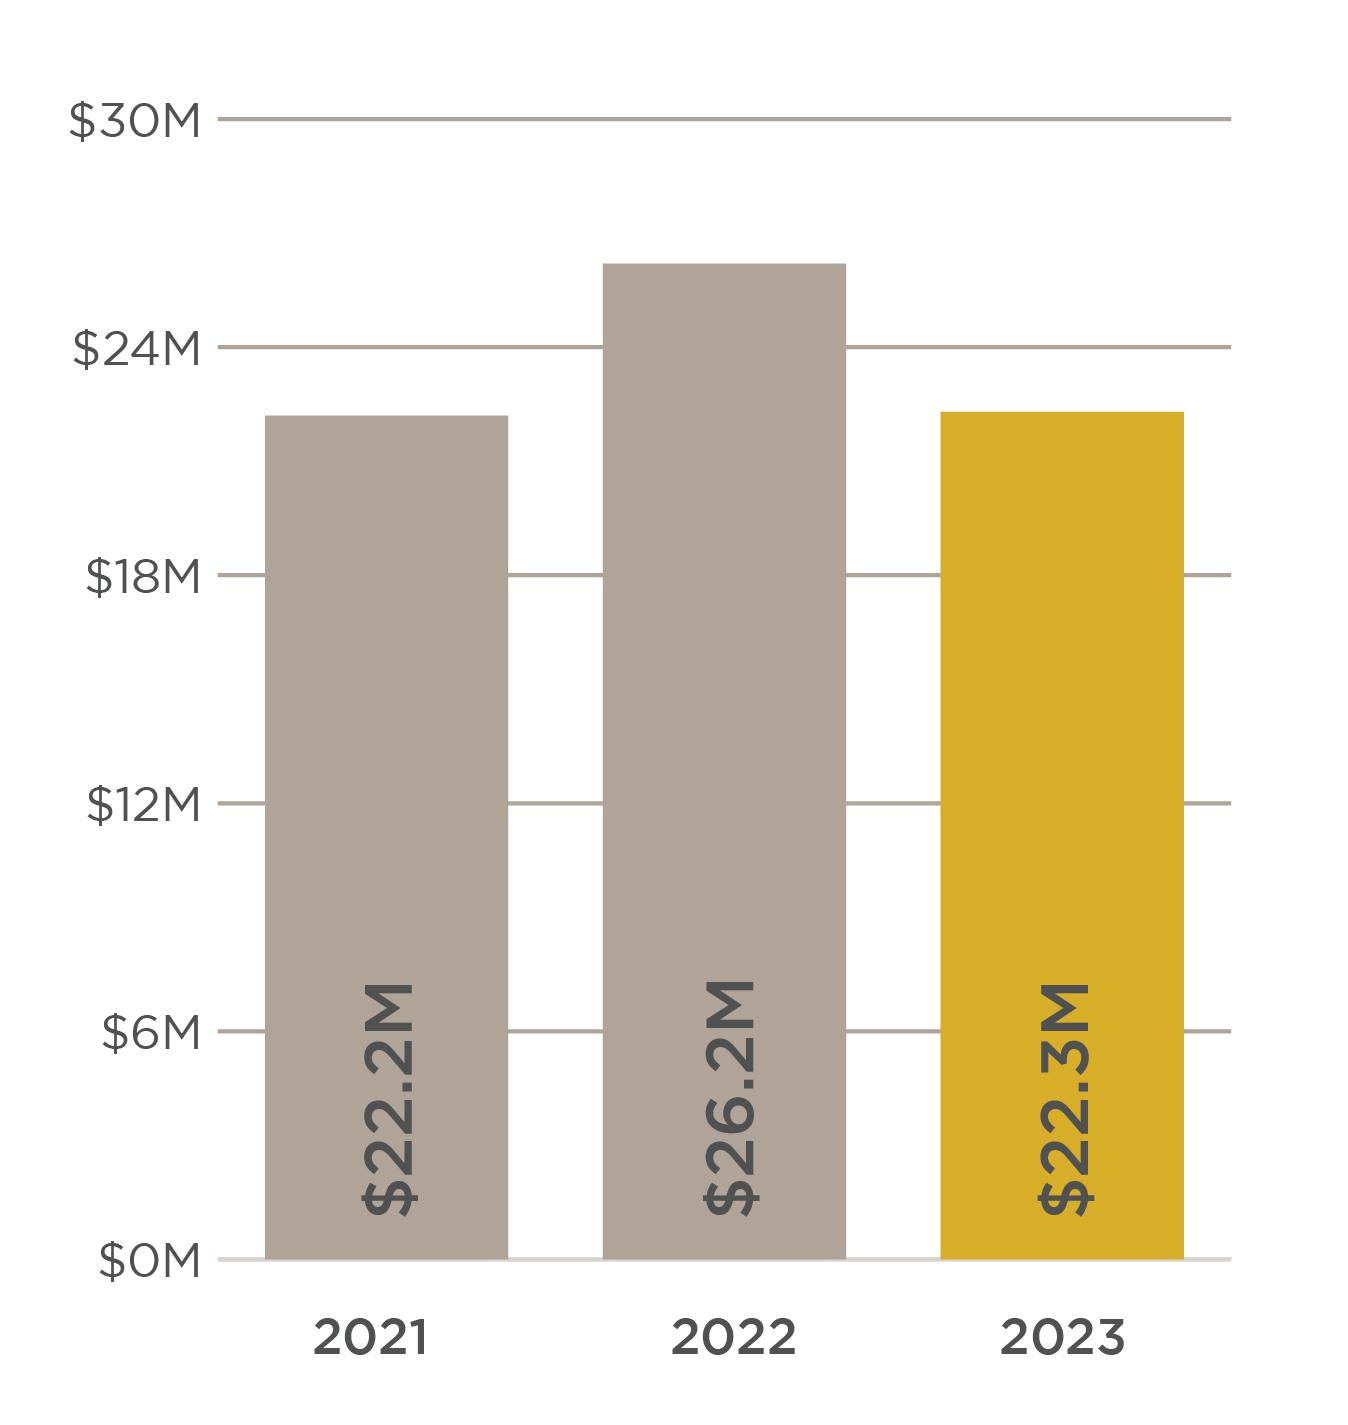
COMMERCIAL SALES VOLUME COMPARISON
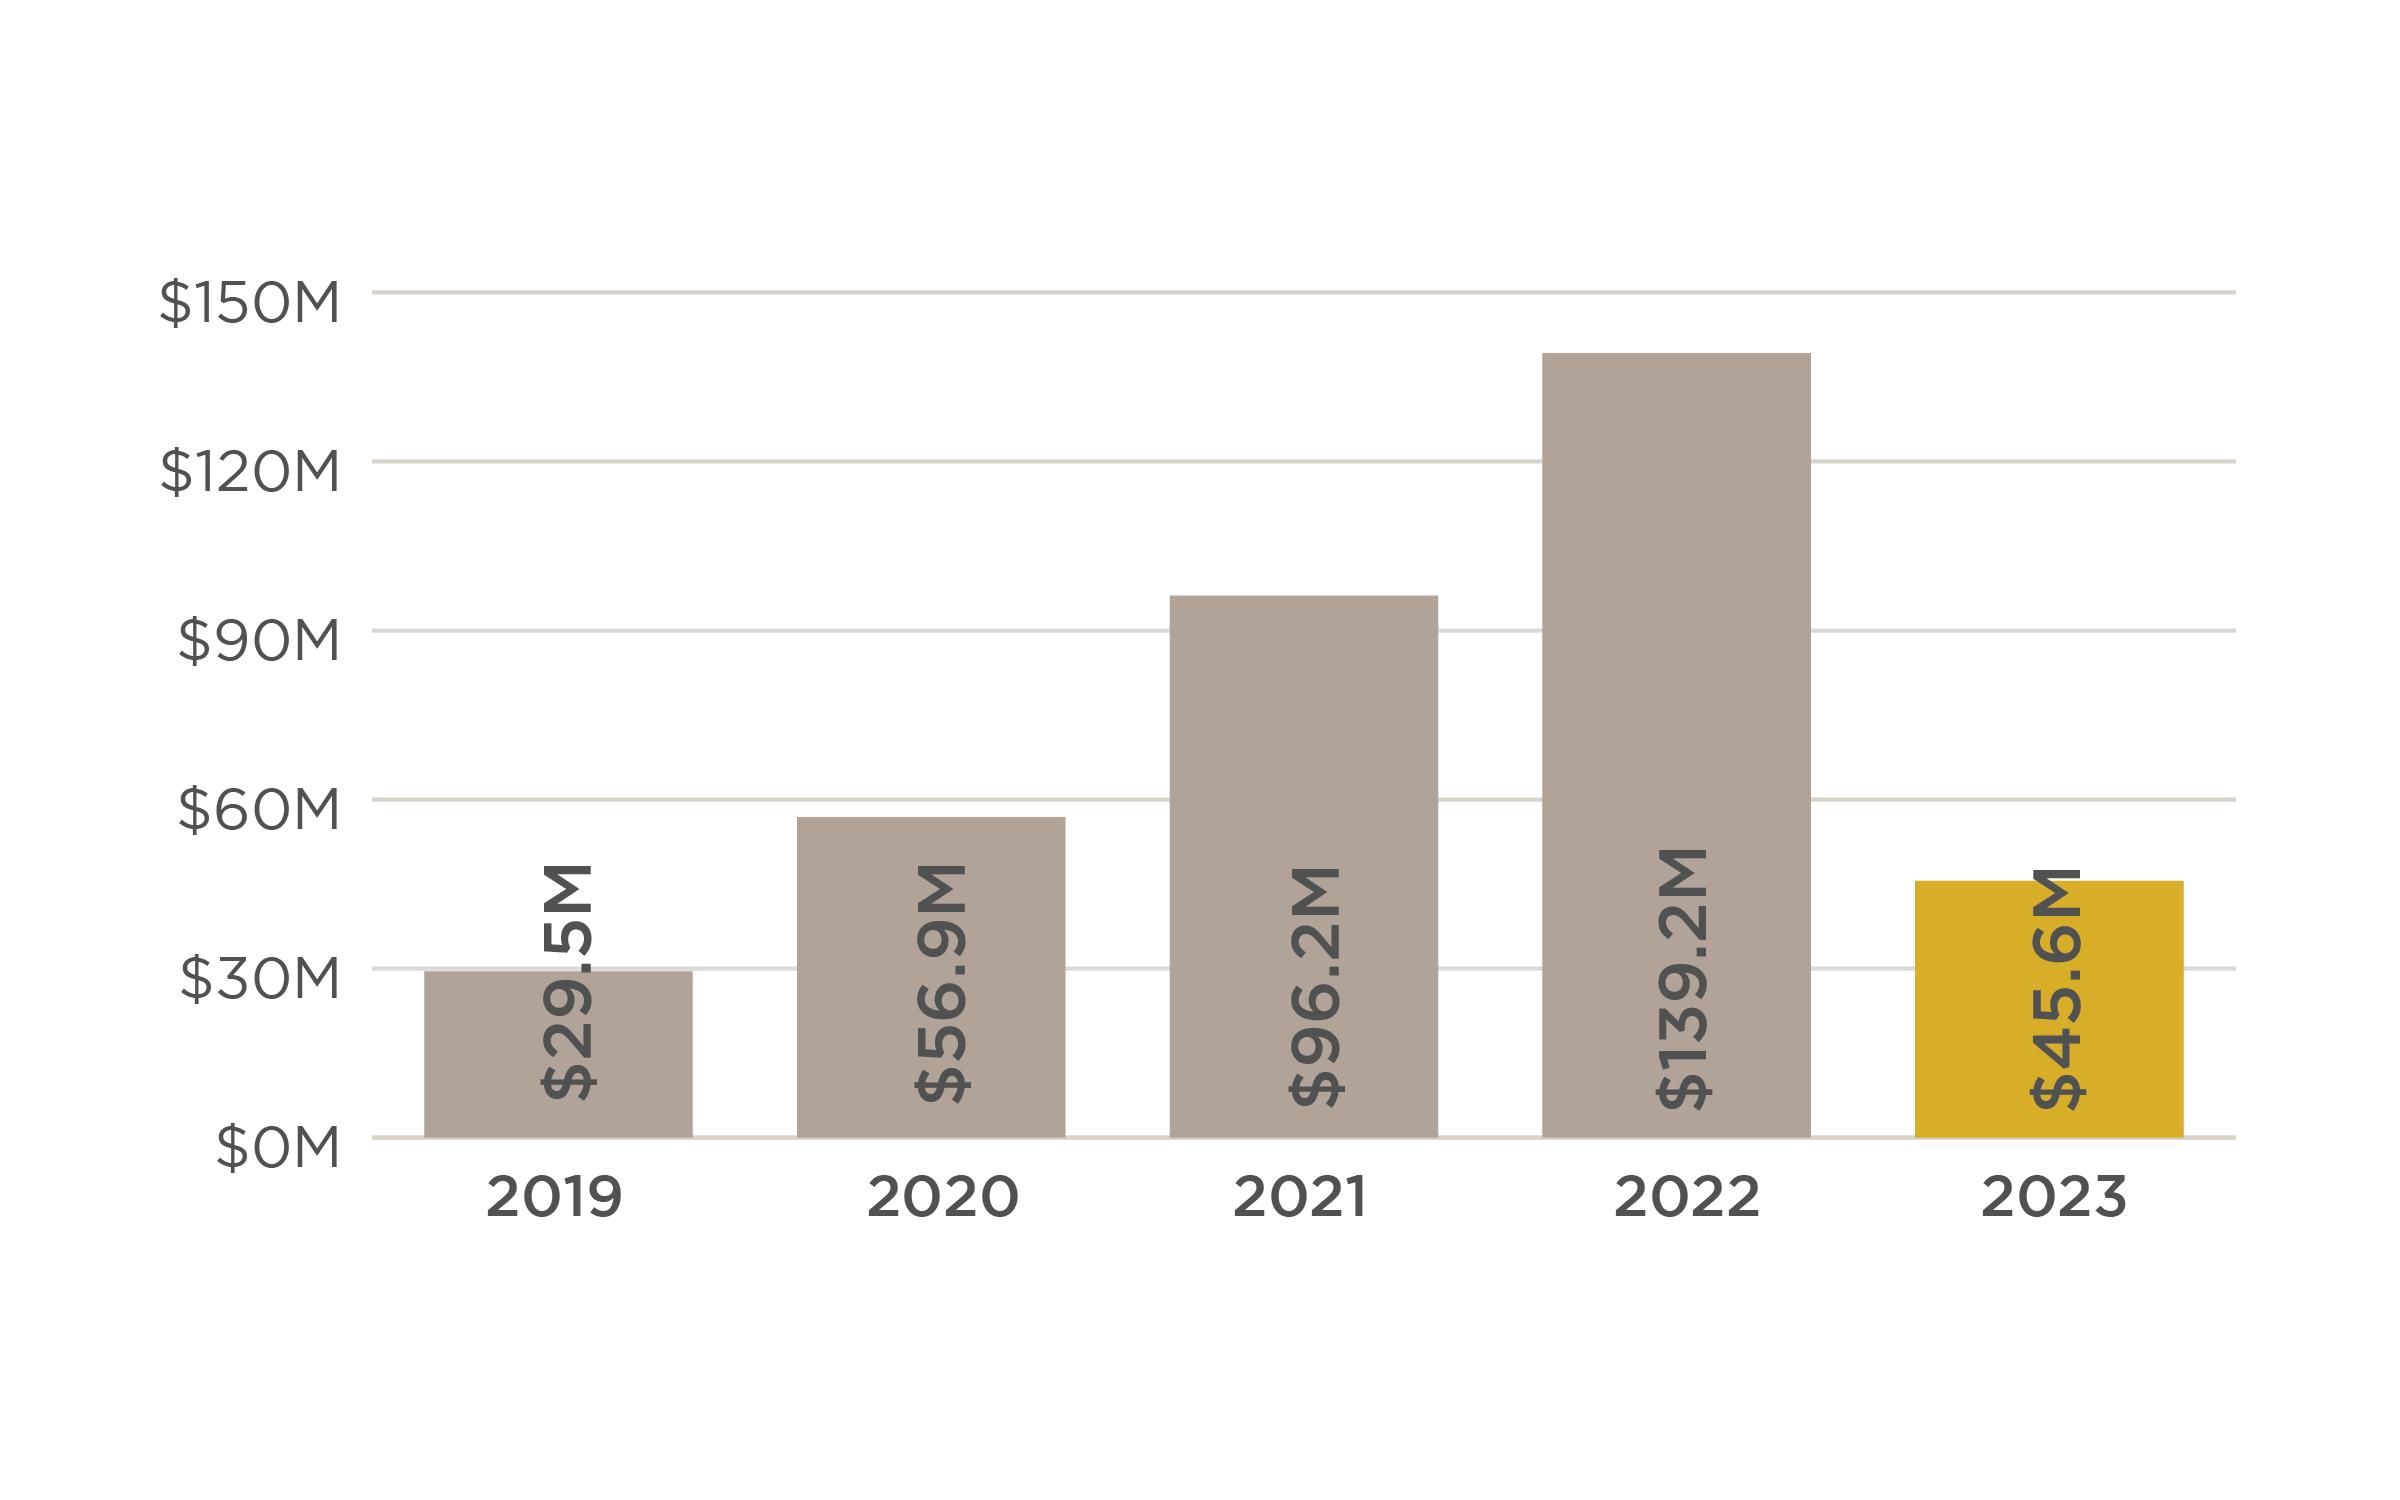
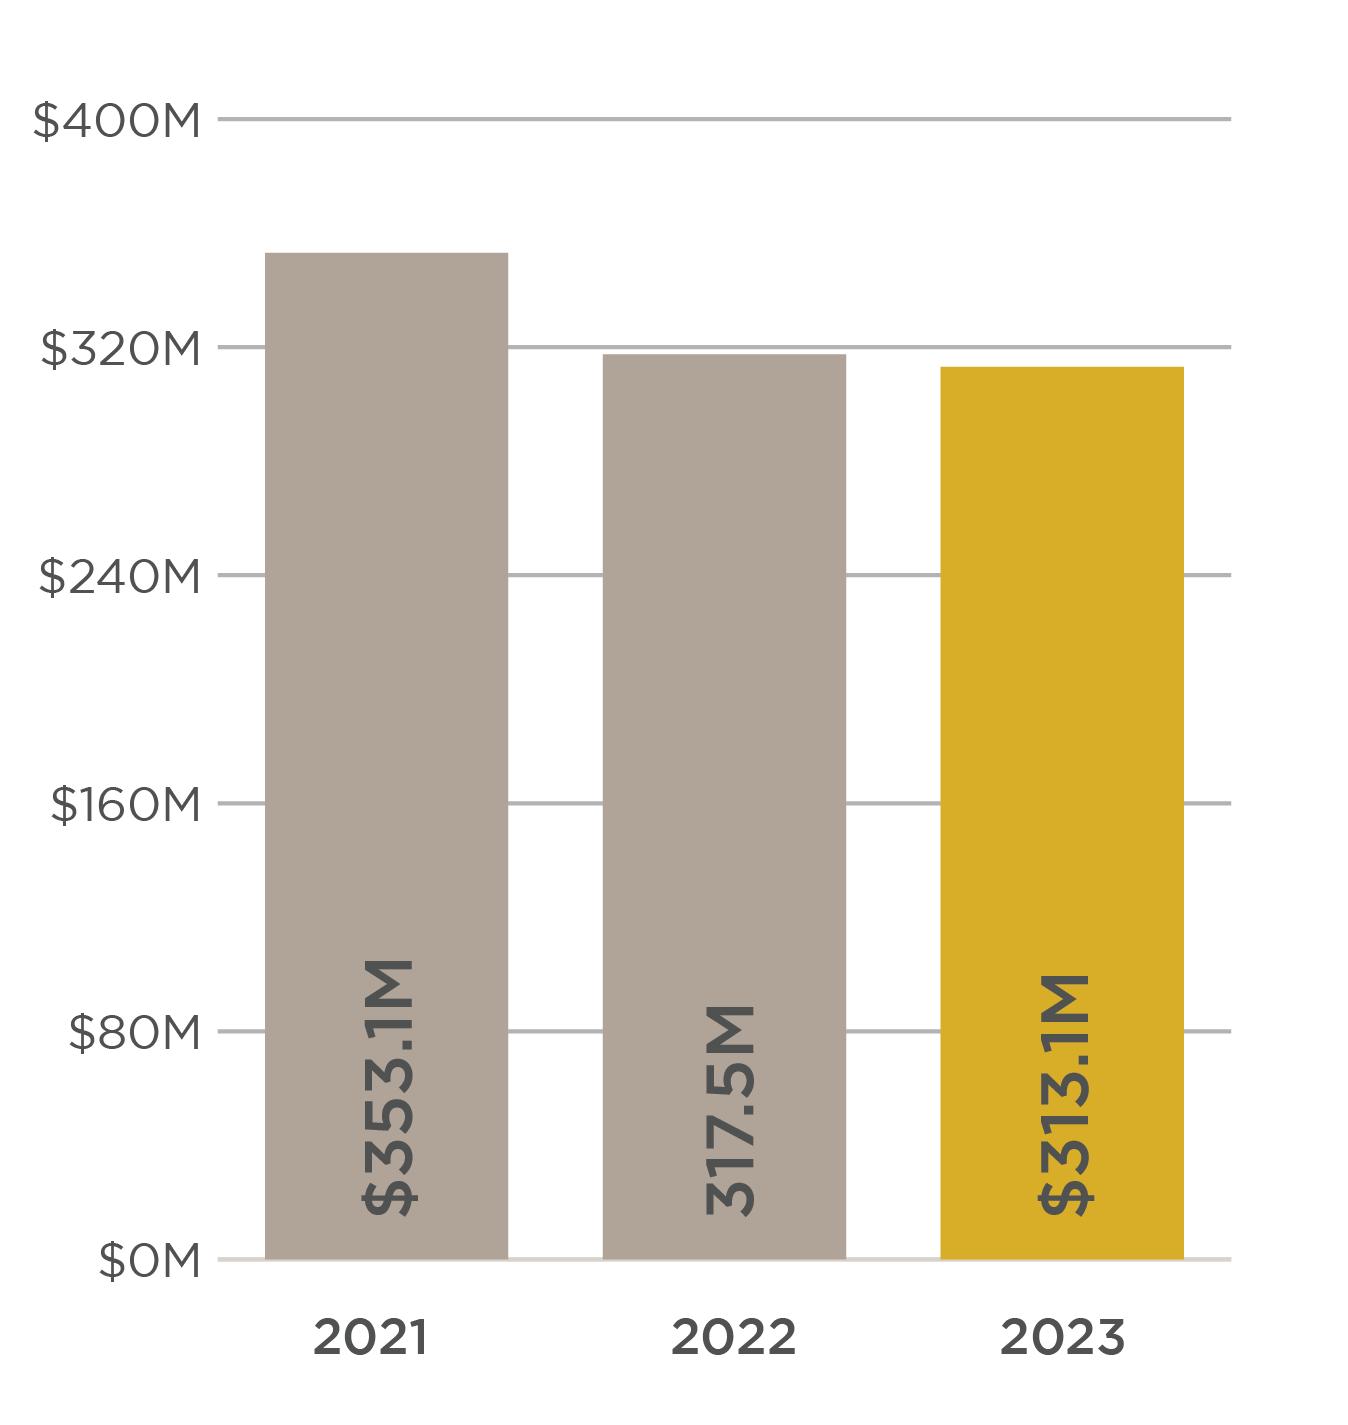
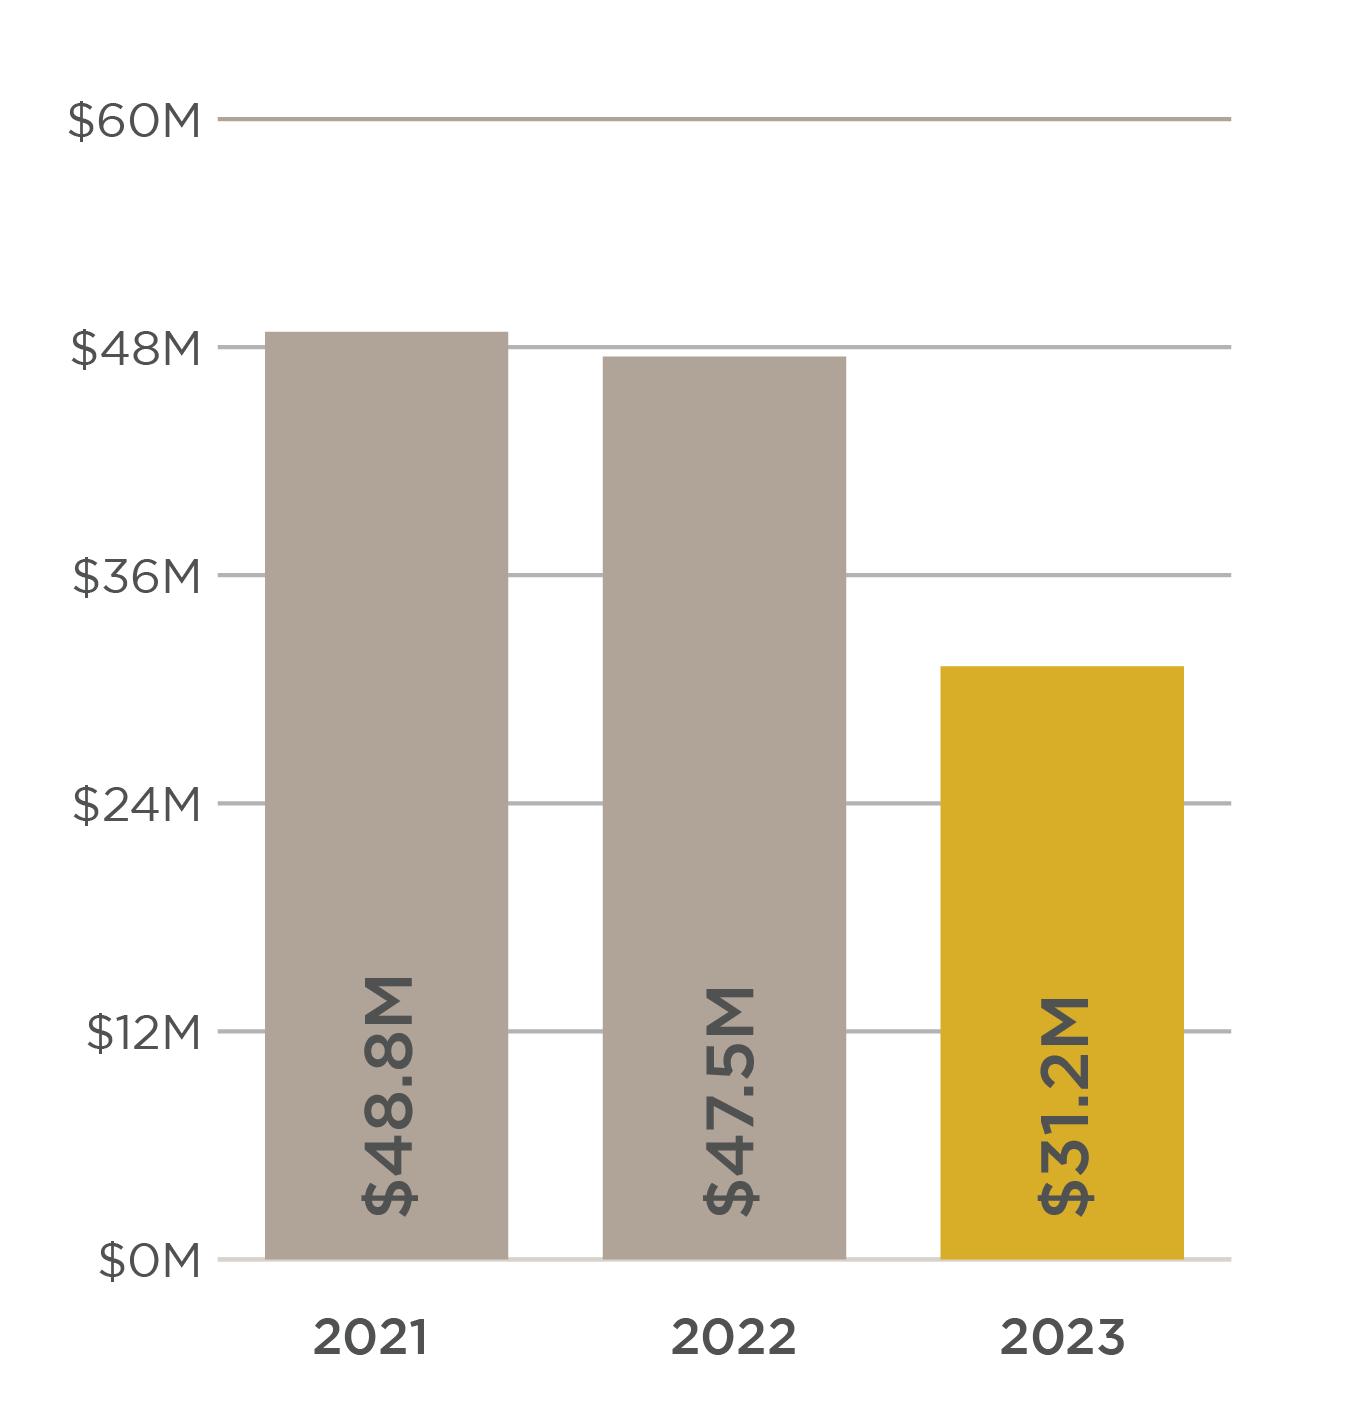
LAND SALES VOLUME COMPARISON
The Slifer Report 2023 | 7
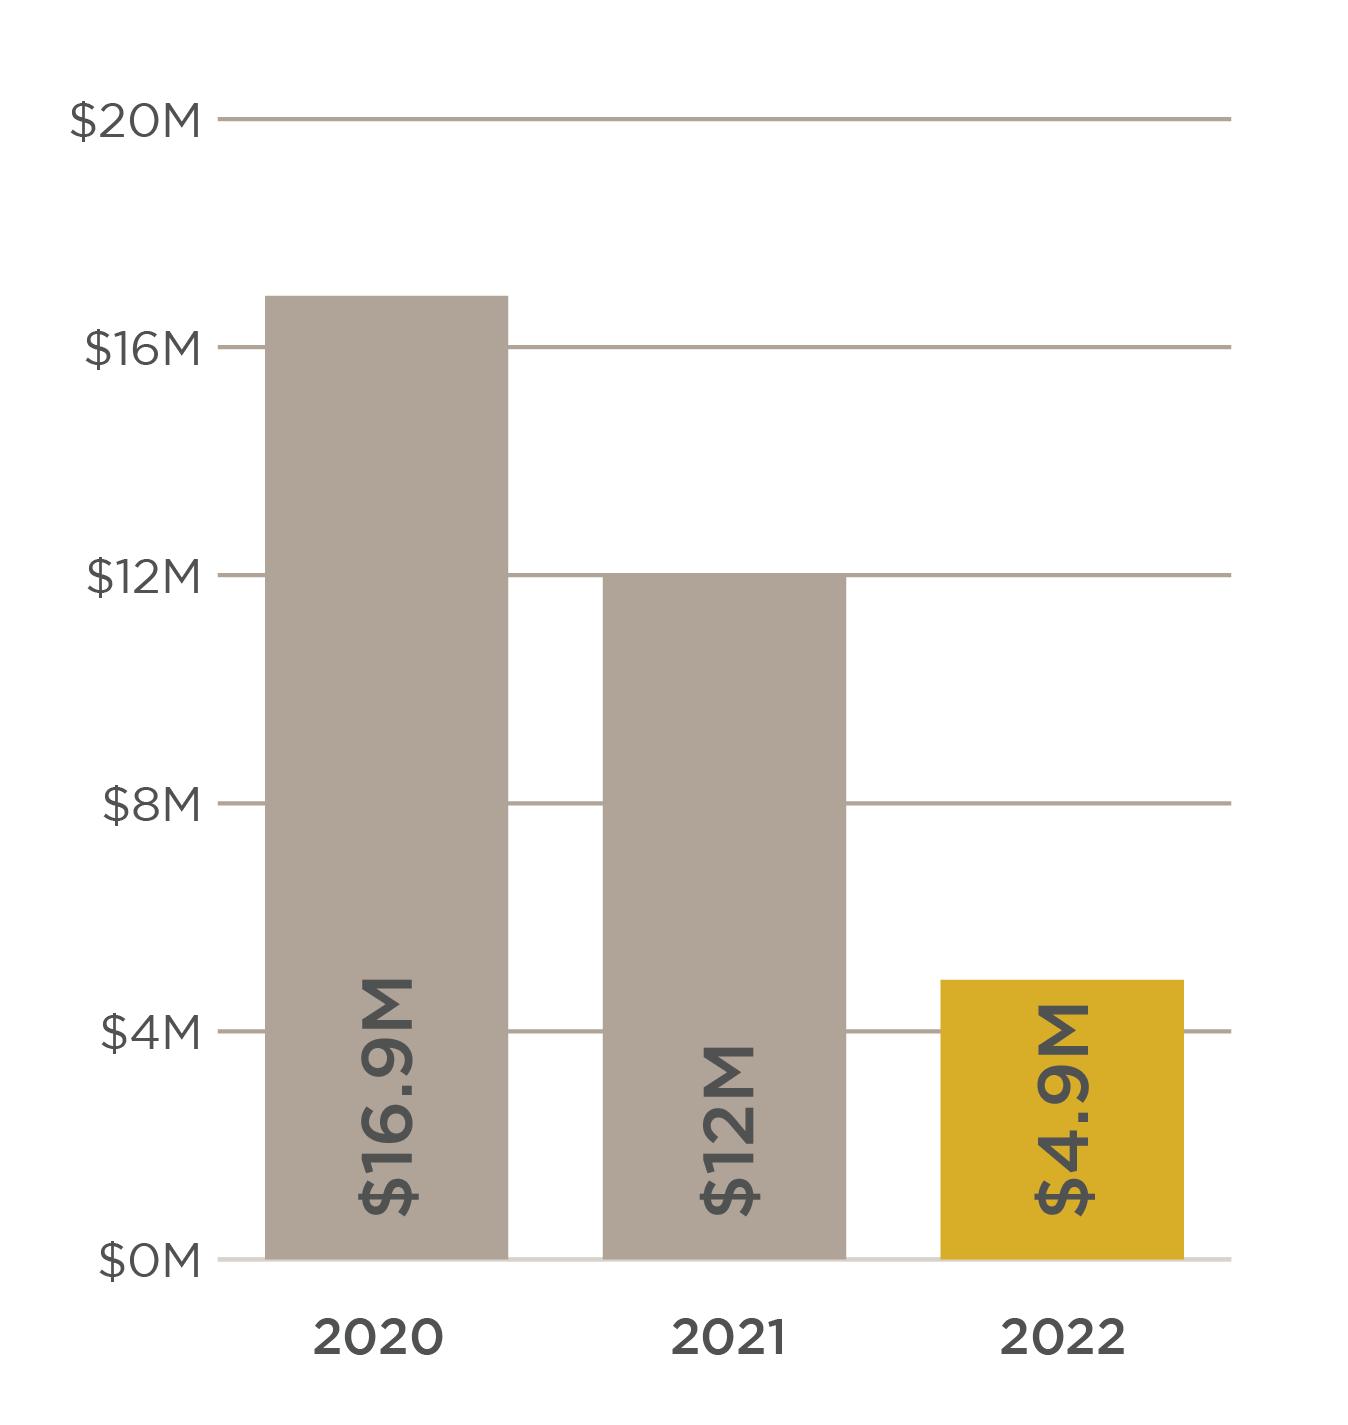
SALES VOLUME COMPARISON
Slifer Smith & Frampton Real Estate | 8
SINGLE FAMILY SALES VOLUME NO OF SALES AVG DAYS ON MARKET AVG SALE AVG PRICE/ SF 2019 $356,906,850 45 351 $7,931,263 $1,434 2020 $203,271,468 22 321 $9,239,612 $1,535 2021 $844,504,601 64 303 $13,195,384 $2,101 2022 $827,736,909 42 187 $19,708,022 $3,001 2023 $628,703,871 44 153 $14,288,724 $3,153 CONDOMINIUM & TOWNHOME SALES VOLUME NO OF SALES AVG DAYS ON MARKET AVG SALE AVG PRICE/ SF 2019 $163,804,940 74 211 $2,213,580 $1,565 2020 $176,129,131 40 353 $4,403,228 $1,977 2021 $256,162,816 107 173 $2,394,045 $1,800 2022 $307,015,999 66 88 $4,651,758 $2,817 2023 $168,678,000 38 131 $4,438,895 $2,808
SINGLE FAMILY & DUPLEX CONDOMINIUM & TOWNHOME 2019 91% 95% 2020 87% 93% 2021 95% 96% 2022 97% 98 % 2023 93% 95%
ASPEN
AREA highlights
volumefor
familyhomes
decreasein number of sales for condosand townhomes SALE VS LIST PRICE COMPARISON
24% decreaseinsales
single
42%

The Slifer Report 2023 | 9
CREEK SINGLE FAMILY SALES VOLUME NO OF SALES AVG DAYS ON MARKET AVG SALE AVG PRICE/ SF 2019 $8,773,000 7 403 $1,168,000 $410 2020 $1,900,000 1 376 $1,900,000 $485 2021 $53,570,000 5 248 $10,714,000 $1,018 2022 $585,000 1 75 $585,000 $571 2023 $10,015,000 3 101 $3,338,333 $1,202 CONDOMINIUM & TOWNHOME SALES VOLUME NO OF SALES AVG DAYS ON MARKET AVG SALE AVG PRICE/ SF 2019 $213,000 1 51 $213,000 $587 2020 $0 0 0 $0 $0 2021 $405,000 1 251 $405,000 $743 2022 $328,449 1 586 $328,449 $733 2023 $0 0 0 $0 $0 AREA highlights SALES VOLUME COMPARISON SINGLE FAMILY & DUPLEX CONDOMINIUM & TOWNHOME 2019 95% 97% 2020 83% 0% 2021 94% 98% 2022 90% 103% 2023 97% 0% SALE VS. LIST PRICE COMPARISON 110%
squarefoot for singlefamily homes
familyhomesales
WOODY
increasein averagepriceper
200% increasein number of single
SNOWMASS VILLAGE
Slifer
&
Real Estate | 10
Smith
Frampton
SINGLE FAMILY SALES VOLUME NO OF SALES AVG DAYS ON MARKET AVG SALE AVG PRICE/ SF 2019 $84,260,600 20 323 $4,213,030 $930 2020 $22,239,000 7 167 $3,177,000 $823 2021 $185,771,500 34 241 $5,463,868 $1,241 2022 $191,747,114 27 189 $7,101,745 $1,587 2023 $88,327,500 12 149 $7,360,625 $1,691 CONDOMINIUM & TOWNHOME SALES VOLUME NO OF SALES AVG DAYS ON MARKET AVG SALE AVG PRICE/ SF 2019 $68,676,400 65 235 $1,056,560 $802 2020 $65,361,954 51 319 $1,281,607 $830 2021 $167,350,112 130 172 $1,287,309 $894 2022 $125,723,900 62 92 $2,027,805 $1,495 2023 $224,734,000 107 516 $2,100,308 $1,529 SINGLE FAMILY & DUPLEX CONDOMINIUM & TOWNHOME 2019 93% 96% 2020 93% 93% 2021 96% 97% 2022 96% 99% 2023 92% 98% SALES VOLUME COMPARISON SALE VS LIST PRICE COMPARISON AREA highlights 54% decreaseinsales volumefor single familyhomes
increaseinsales volumefor condosand townhomes
79%
36% increasein averageprice/
56% decreaseinsales volumeof single familyhomes
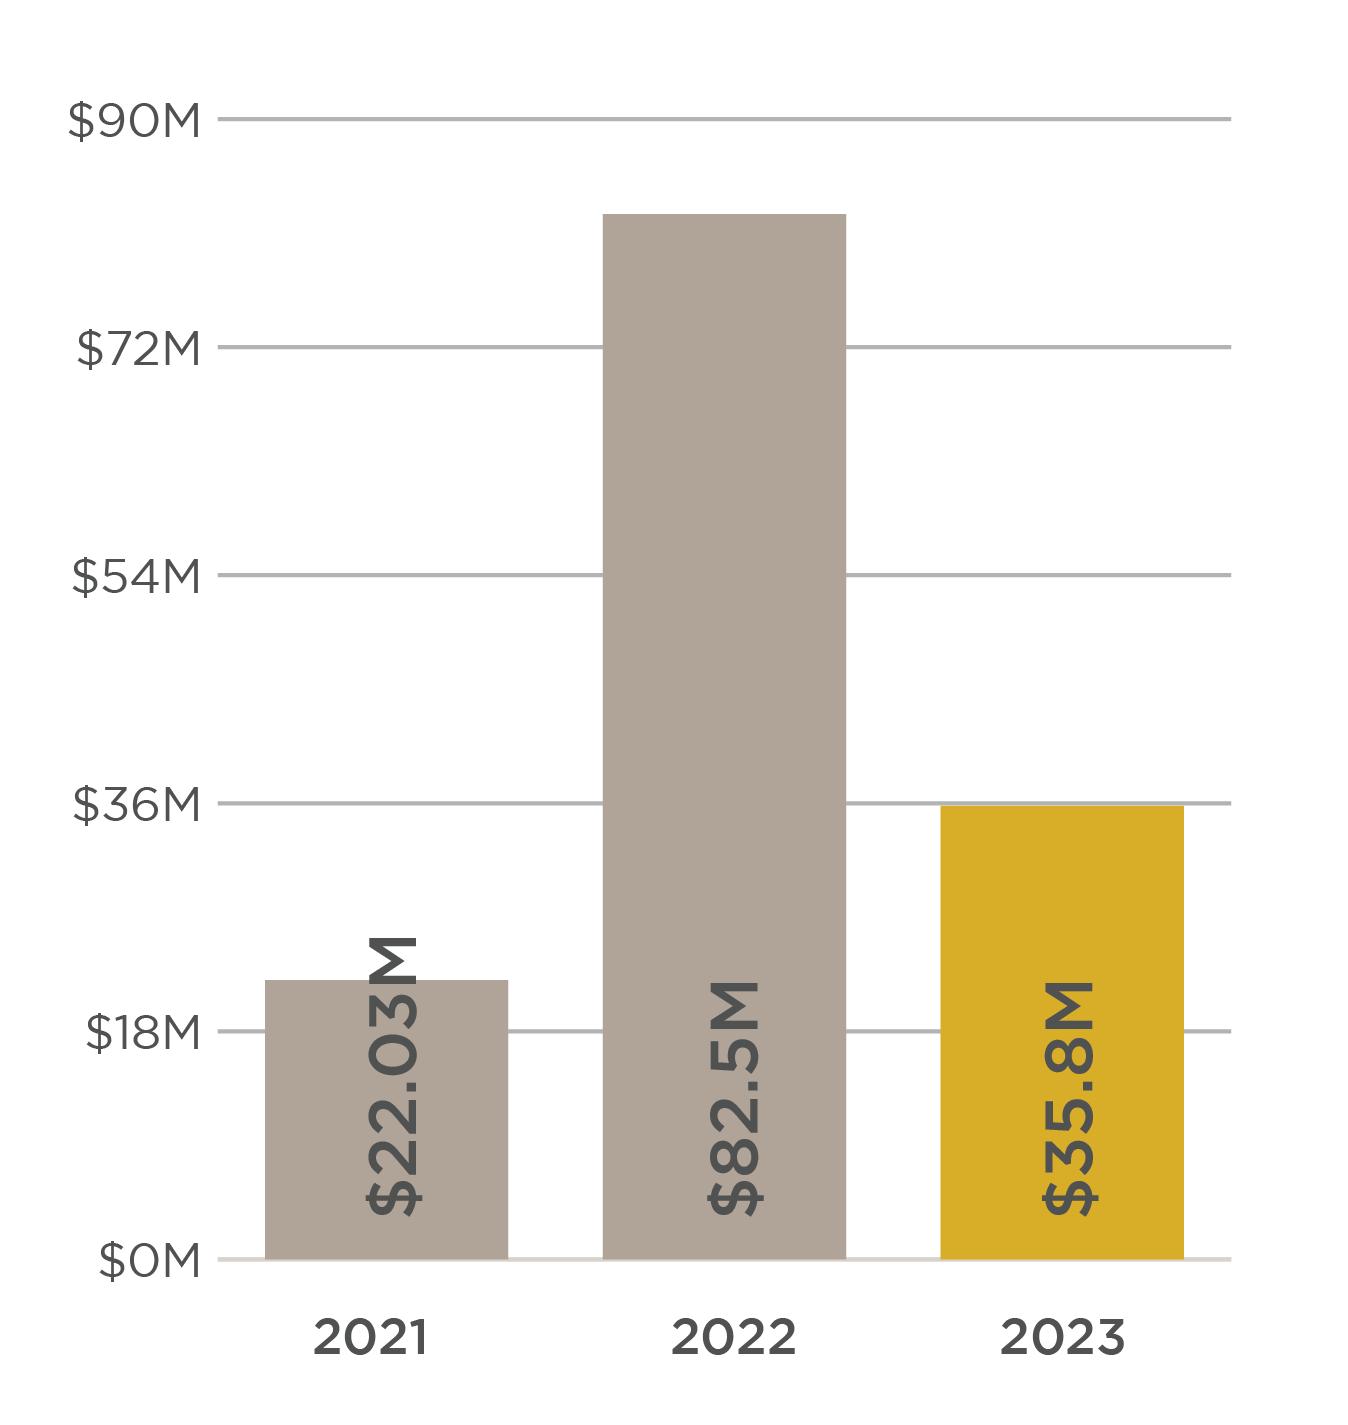
The Slifer Report 2023 | 11 OLD
SINGLE FAMILY SALES VOLUME NO OF SALES AVG DAYS ON MARKET AVG SALE AVG PRICE/ SF 2019 $7,095,000 5 216 $1,419,000 $395 2020 $34,835,299 10 610 $3,483,530 $600 2021 $22,030,000 9 115 $2,447,778 $616 2022 $81,750,000 13 236 $6,288,462 $1,134 2023 $35,824,070 8 113 $4,478,009 $1,541 CONDOMINIUM & TOWNHOME SALES VOLUME NO OF SALES AVG DAYS ON MARKET AVG SALE AVG PRICE/ SF 2019 $0 0 0 $0 $0 2020 $0 0 0 $0 $0 2021 $0 0 0 $0 $0 2022 $725,000 1 67 $725,000 $1,436 2023 $0 0 0 $0 $0 SALES VOLUME COMPARISON SINGLE FAMILY & DUPLEX CONDOMINIUM & TOWNHOME 2019 90% 0% 2020 90% 0% 2021 97% 0% 2022 94% 97% 2023 90% 0% SALE VS LIST PRICE COMPARISON AREA highlights
SNOWMASS
squarefoot
for singlefamily homes
Slifer Smith & Frampton Real Estate | 12
SINGLE FAMILY SALES VOLUME NO OF SALES AVG DAYS ON MARKET AVG SALE AVG PRICE/ SF 2019 $39,061,529 36 177 $1,085,042 $404 2020 $40,743,000 33 210 $1,234,636 $499 2021 $64,673,500 39 187 $1,658,295 $478 2022 $34,513,000 23 112 $1,500,565 $587 2023 $55,758,150 48 226 $1,161,628 $884 CONDOMINIUM & TOWNHOME SALES VOLUME NO OF SALES AVG DAYS ON MARKET AVG SALE AVG PRICE/ SF 2019 $20,676,250 32 164 $646,133 $432 2020 $24,062,175 33 192 $729,157 $460 2021 $27,931,800 39 97 $716,200 $482 2022 $54,671,500 50 143 $1,093,430 $719 2023 $64,277,500 27 130 $2,380,648 $849 SINGLE FAMILY & DUPLEX CONDOMINIUM & TOWNHOME 2019 96% 97% 2020 95% 96% 2021 96% 99% 2022 101% 101% 2023 100% 96% SALES VOLUME COMPARISON SALE VS LIST PRICE COMPARISON
of
singlefamily
of
condosand townhomes
BASALT
AREA highlights 109% increasein number
sales for
homes 46% decreasein number
sales for
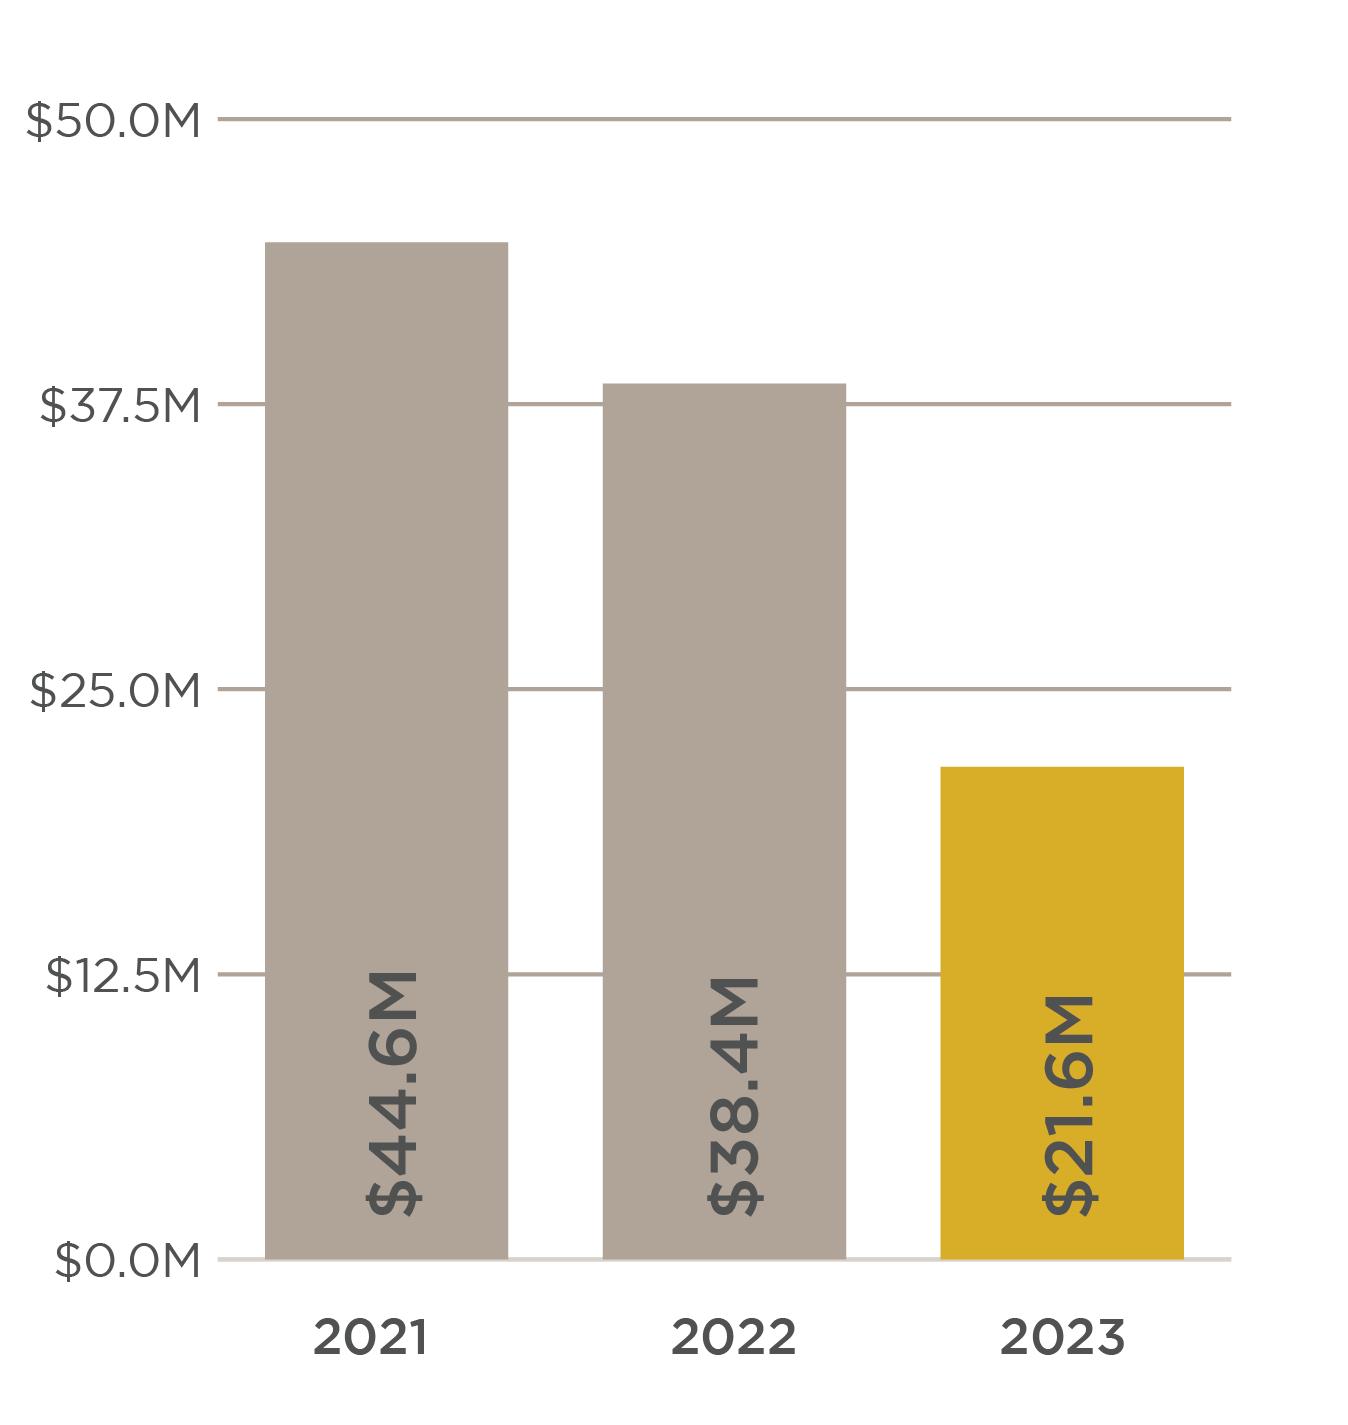
The Slifer Report 2023 | 13 MISSOURI HEIGHTS SINGLE FAMILY SALES VOLUME NO OF SALES AVG DAYS ON MARKET AVG SALE AVG PRICE/ SF 2019 $19,042,870 19 227 $1,002,256 $308 2020 $19,563,754 15 312 $1,304,250 $351 2021 $44,559,375 23 196 $1,937,364 $428 2022 $38,376,183 16 182 $2,398,511 $631 2023 $21,613,000 9 152 $2,401,44 $654 CONDOMINIUM & TOWNHOME SALES VOLUME NO OF SALES AVG DAYS ON MARKET AVG SALE AVG PRICE/ SF 2019 $0 0 0 $0 $0 2020 $0 0 0 $0 $0 2021 $0 0 0 $0 $0 2022 $0 0 0 $0 $0 2023 $0 0 0 $0 $0 SALES VOLUME COMPARISON SINGLE FAMILY & DUPLEX CONDOMINIUM & TOWNHOME 2019 94% 0% 2020 94% 0% 2021 96% 0% 2022 99% 0% 2023 95% 0% SALE VS. LIST PRICE COMPARISON AREA highlights 44% decreasein number of sales for singlefamily homes
Slifer Smith & Frampton Real Estate | 14
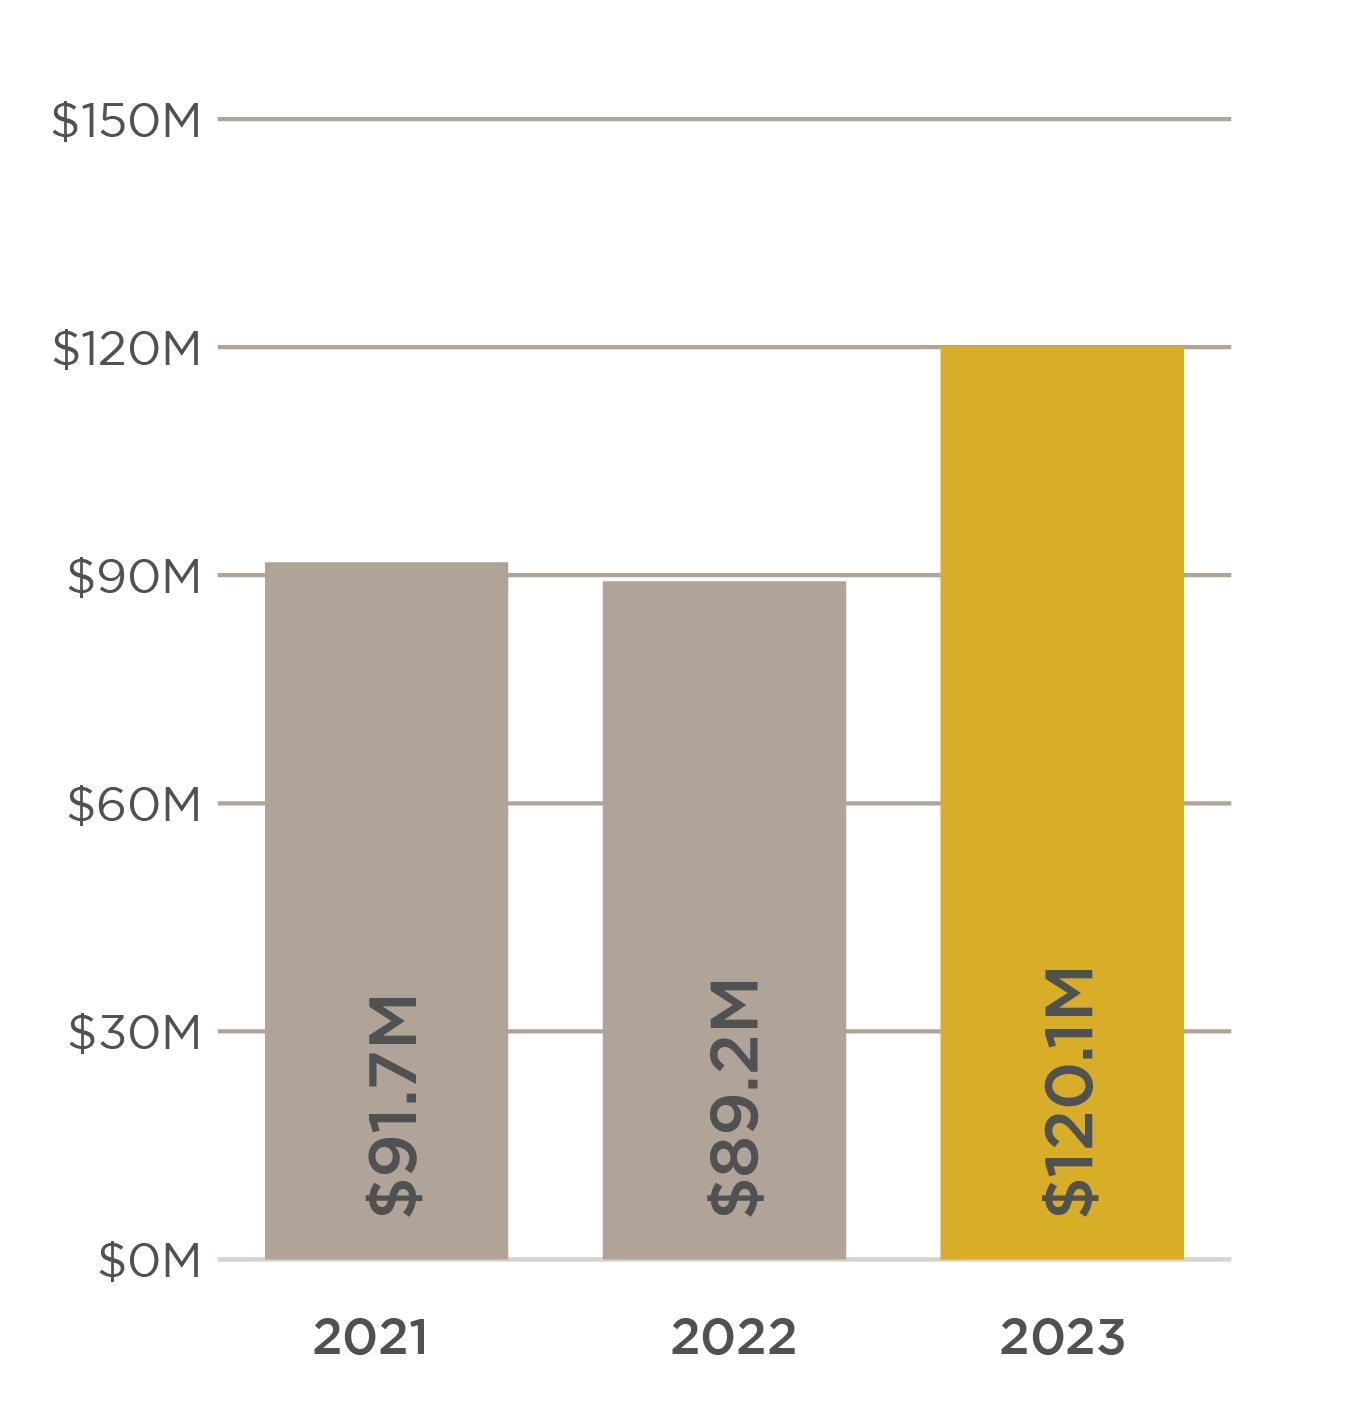
SINGLE FAMILY SALES VOLUME NO OF SALES AVG DAYS ON MARKET AVG SALE AVG PRICE/ SF 2019 $42,915,250 44 196 $975,347 $309 2020 $52,776,590 48 204 $1,099,512 $337 2021 $81,117,075 52 99 $1,559,944 $453 2022 $61,936,366 32 154 $1,935,511 $610 2023 $106,807,665 48 158 $2,225,160 $636 CONDOMINIUM & TOWNHOME SALES VOLUME NO OF SALES AVG DAYS ON MARKET AVG SALE AVG PRICE/ SF 2019 $16,004,300 29 134 $551,872 $307 2020 $16,798,527 29 149 $579,260 $323 2021 $25,885,852 43 164 $601,997 $401 2022 $21,913,109 24 275 $913,046 $487 2023 $27,518,158 25 101 $1,100,726 $554 SINGLE FAMILY & DUPLEX CONDOMINIUM & TOWNHOME 2019 96% 99% 2020 96% 98% 2021 98% 100% 2022 98% 99% 2023 98% 96% SALES VOLUME COMPARISON SALE VS LIST PRICE COMPARISON AREA
increaseinsales volumefor single familyhomes
increasein
pricefor condos +townhomes
CARBONDALE
highlights 72%
20%
averagesales
The Slifer Report 2023 | 15 REDSTONE SINGLE FAMILY SALES VOLUME NO OF SALES AVG DAYS ON MARKET AVG SALE AVG PRICE/ SF 2019 $3,116,6111 5 145 $623,322 $462 2020 $7,975,000 10 254 $797,500 $297 2021 $16,373,797 18 98 $909,655 $369 2022 $11,975,000 1 564 $11,975,000 $477 2023 $4,699,000 4 206 $1,174,750 $463 CONDOMINIUM & TOWNHOME SALES VOLUME NO OF SALES AVG DAYS ON MARKET AVG SALE AVG PRICE/ SF 2019 $0 0 0 $0 $0 2020 $162,000 1 318 $162,000 $621 2021 $485,000 2 38 $242,500 $646 2022 $0 0 0 $0 $0 2023 $215,000 1 16 $215,000 $824 SALES VOLUME COMPARISON SINGLE FAMILY & DUPLEX CONDOMINIUM & TOWNHOME 2019 97% 0% 2020 94% 88% 2021 94% 100% 2022 98% 0% 2023 100% 100% SALE VS LIST PRICE COMPARISON AREA highlights 300% increasein number of sales for singlefamily homes 100% increasein number of sales for condosand townhomes
Slifer Smith & Frampton Real Estate | 16
SINGLE FAMILY SALES VOLUME NO OF SALES AVG DAYS ON MARKET AVG SALE AVG PRICE/ SF 2019 $425,000 1 81 $425,000 $295 2020 $3,325,000 4 401 $831,250 $279 2021 $2,031,000 3 120 $677,000 $263 2022 $0 0 0 $0 $0 2023 $1,550,000 1 330 $1,550,000 $478 CONDOMINIUM & TOWNHOME SALES VOLUME NO OF SALES AVG DAYS ON MARKET AVG SALE AVG PRICE/ SF 2019 $0 0 0 $0 $0 2020 $0 0 0 $0 $0 2021 $0 0 0 $0 $0 2022 $0 0 0 $0 $0 2023 $0 0 0 $0 $0 SINGLE FAMILY & DUPLEX CONDOMINIUM & TOWNHOME 2019 99% 0% 2020 92% 0% 2021 99% 0% 2022 0% 0% 2023 96% 0% SALES VOLUME COMPARISON SALE VS LIST PRICE COMPARISON AREA highlights 100% increasein number of sales for singlefamily homes
MARBLE
sales
The Slifer Report 2023 | 17
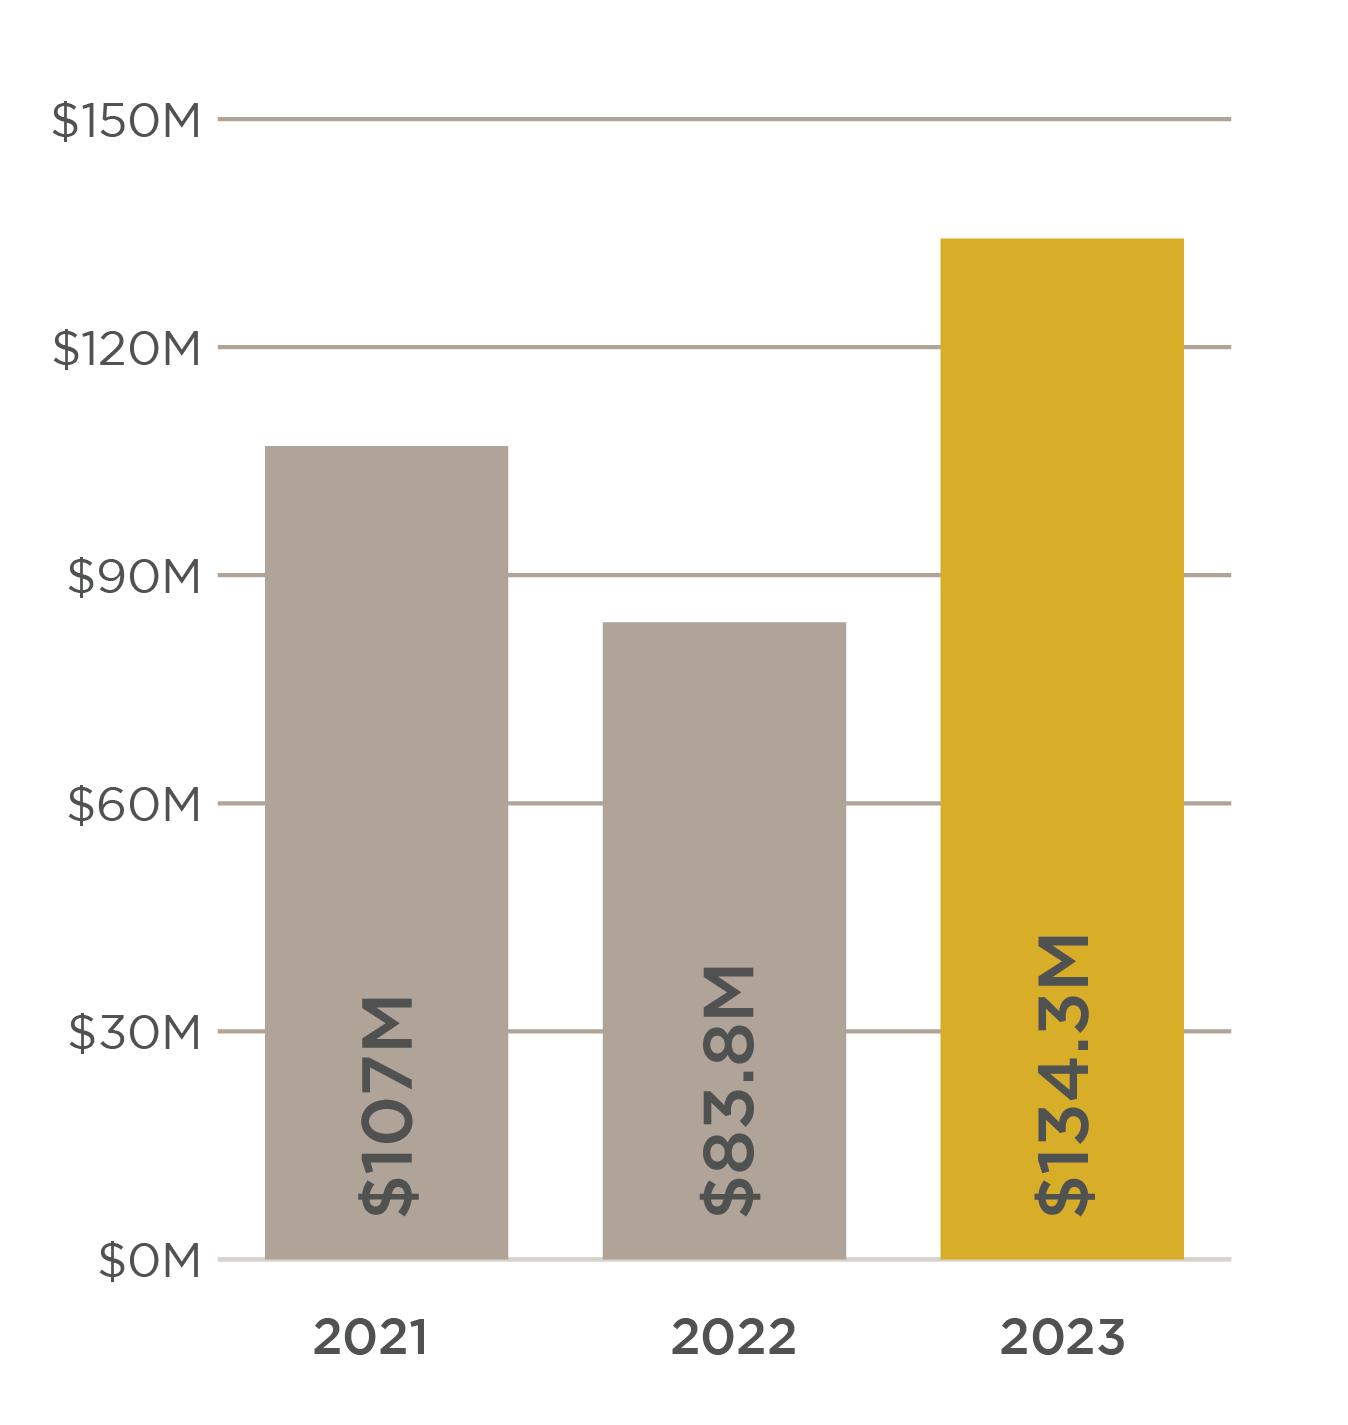
SINGLE FAMILY SALES VOLUME NO OF SALES AVG DAYS ON MARKET AVG SALE AVG PRICE/ SF 2019 $40,120,290 66 127 $607,883 $247 2020 $50,219,450 78 120 $643,839 $249 2021 $83,352,073 104 94 $801,462 $319 2022 $75,201,254 82 90 $917,088 $396 2023 $60,407,352 63 89 $958,847 $431 CONDOMINIUM & TOWNHOME SALES VOLUME NO OF SALES AVG DAYS ON MARKET AVG SALE AVG PRICE/ SF 2019 $14,688,000 47 114 $312,511 $252 2020 $9,889,300 30 88 $329,643 $250 2021 $14,356,900 38 58 $377,813 $295 2022 $22,660,620 45 116 $503,569 $351 2023 $12,632,999 25 78 $505,320 $424 SALES VOLUME COMPARISON SINGLE FAMILY & DUPLEX CONDOMINIUM & TOWNHOME 2019 97% 98% 2020 98% 98% 2021 98% 98% 2022 99% 100% 2023 97% 99% SALE VS LIST PRICE COMPARISON AREA highlights
of sales
condo
townhome
GLENWOOD SPRINGS
20% decreasein number
for singlefamily homes 44% decreasein number of
and
NEW CASTLE
22% increasein averagesales pricefor
and
14% decreasein number of sales for singlefamily homes
Slifer Smith & Frampton Real Estate | 18
SINGLE FAMILY SALES VOLUME NO OF SALES AVG DAYS ON MARKET AVG SALE AVG PRICE/ SF 2019 $20,594,000 47 110 $438,170 $207 2020 $14,986,900 36 123 $416,303 $231 2021 $28,055,336 52 79 $539,526 $251 2022 $24,388,470 37 84 $659,148 $315 2023 $20,648,450 32 82 $645,264 $323 CONDOMINIUM & TOWNHOME SALES VOLUME NO OF SALES AVG DAYS ON MARKET AVG SALE AVG PRICE/ SF 2019 $10,149,300 34 93 $298,509 $210 2020 $5,936,000 20 100 $296,800 $208 2021 $9,459,600 29 54 $326,193 $250 2022 $11,037,590 29 42 $380,607 $290 2023 $10,191,458 22 168 $463,248 $299 SINGLE FAMILY & DUPLEX CONDOMINIUM & TOWNHOME 2019 99% 99% 2020 98% 99% 2021 99% 100% 2022 99% 100% 2023 99% 99%
SALE VS LIST PRICE COMPARISON
SALES VOLUME COMPARISON
AREA highlights
condos
townhomes
The Slifer Report 2023 | 19 SILT SINGLE FAMILY SALES VOLUME NO OF SALES AVG DAYS ON MARKET AVG SALE AVG PRICE/ SF 2019 $17,270,642 44 130 $392,515 $183 2020 $14,034,300 32 103 $438,572 $196 2021 $20,879,200 43 81 $485,563 $237 2022 $23,289,433 44 87 $529,305 $285 2023 $20,260,300 38 81 $533,166 $9,218 CONDOMINIUM & TOWNHOME SALES VOLUME NO OF SALES AVG DAYS ON MARKET AVG SALE AVG PRICE/ SF 2019 $4,006,400 14 112 $286,171 $165 2020 $949,000 4 87 $237,250 $174 2021 $1,366,000 4 48 $341,500 $163 2022 $2,895,000 8 50 $361,875 $234 2023 $2,071,500 5 51 $414,300 $230 SALES VOLUME COMPARISON SINGLE FAMILY & DUPLEX CONDOMINIUM & TOWNHOME 2019 98% 99% 2020 98% 99% 2021 100% 101% 2022 99% 99% 2023 97% 99% SALE VS LIST PRICE COMPARISON AREA highlights
increasein
condos+ townhomes
14%
averagesaleprice for
14% decreasein number of single familyhomesales
AREA highlights
36% decreasein number of sales for singlefamily homes
31% decreasein number of sales for condos+ townhomes
SALES VOLUME COMPARISON
Real Estate | 20
SINGLE FAMILY SALES VOLUME NO OF SALES AVG DAYS ON MARKET AVG SALE AVG PRICE/ SF 2019 $29,880,000 90 88 $332,000 $173 2020 $27,148,600 80 91 $339,358 $188 2021 $38,634,291 96 85 $402,441 $226 2022 $40,307,355 84 83 $479,849 $263 2023 $25,588,988 54 72 $473,870 $265
& TOWNHOME SALES VOLUME NO OF SALES AVG DAYS ON MARKET AVG SALE AVG PRICE/ SF 2019 $4,071,400 21 118 193,876 $142 2020 $4,126,000 20 88 $206,300 $147 2021 $10,138,850 41 97 $247,289 $176 2022 $7,190,500 26 118 $276,558 $219 2023 $5,614,500 18 56 $311,917 $235 SINGLE FAMILY & DUPLEX CONDOMINIUM & TOWNHOME 2019 98% 99% 2020 98% 98% 2021 99% 101% 2022 99% 100% 2023 97% 99%
Slifer Smith & Frampton
RIFLE
CONDOMINIUM
NEW DEVELOPMENT REVIEW
NEW DEVELOPMENT SPOTLIGHT
9 Projects launched in 2022
$1B+ Division historic closed + pending sales
200+ New homes delivered
Weareproud to betheonlybrokerageinColorado withafull divisiondedicated to bringingnewdevelopmentsto market.Our end-to-endservicecontinuedto deliver in 2022,creatingmorenewhomesinour communitiesthanever before Thisyear the divisioncelebratedover $1billion inclosed &pending salessinceit startedin2020.
To learnmore,visit SliferDevelopmentSales com >>>
The Slifer Report 2023 | 21
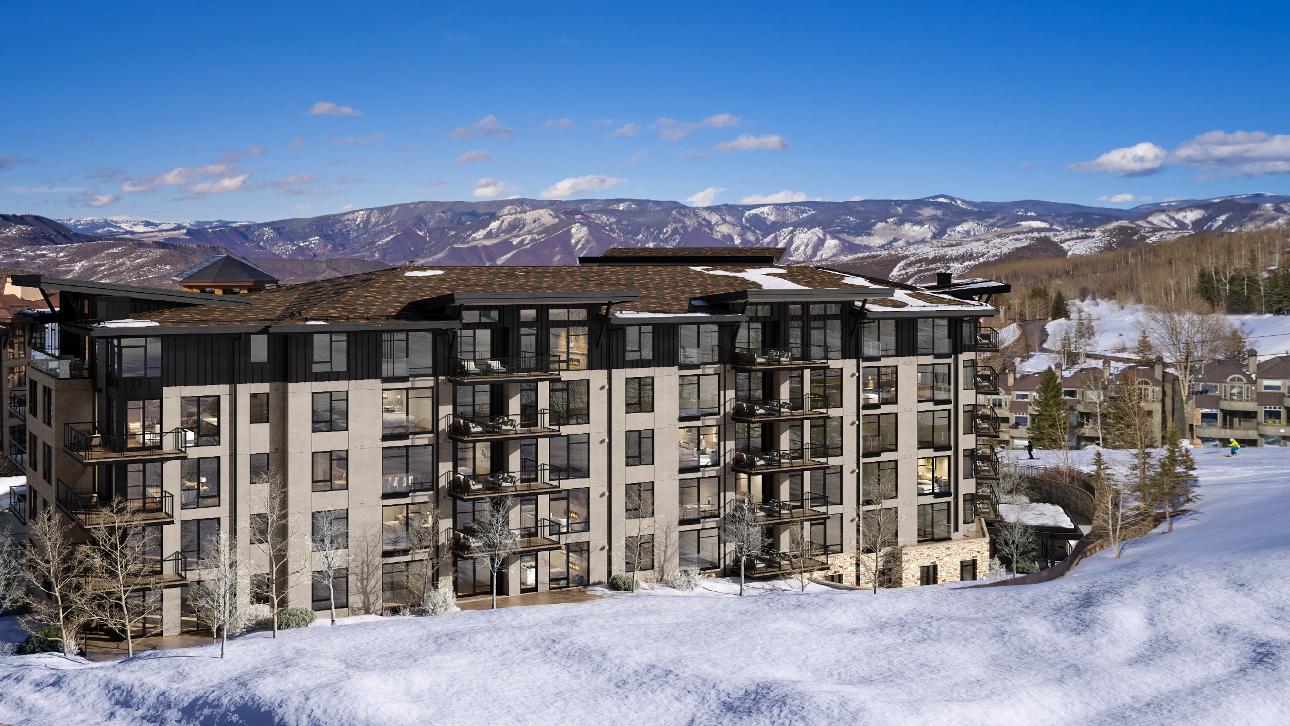
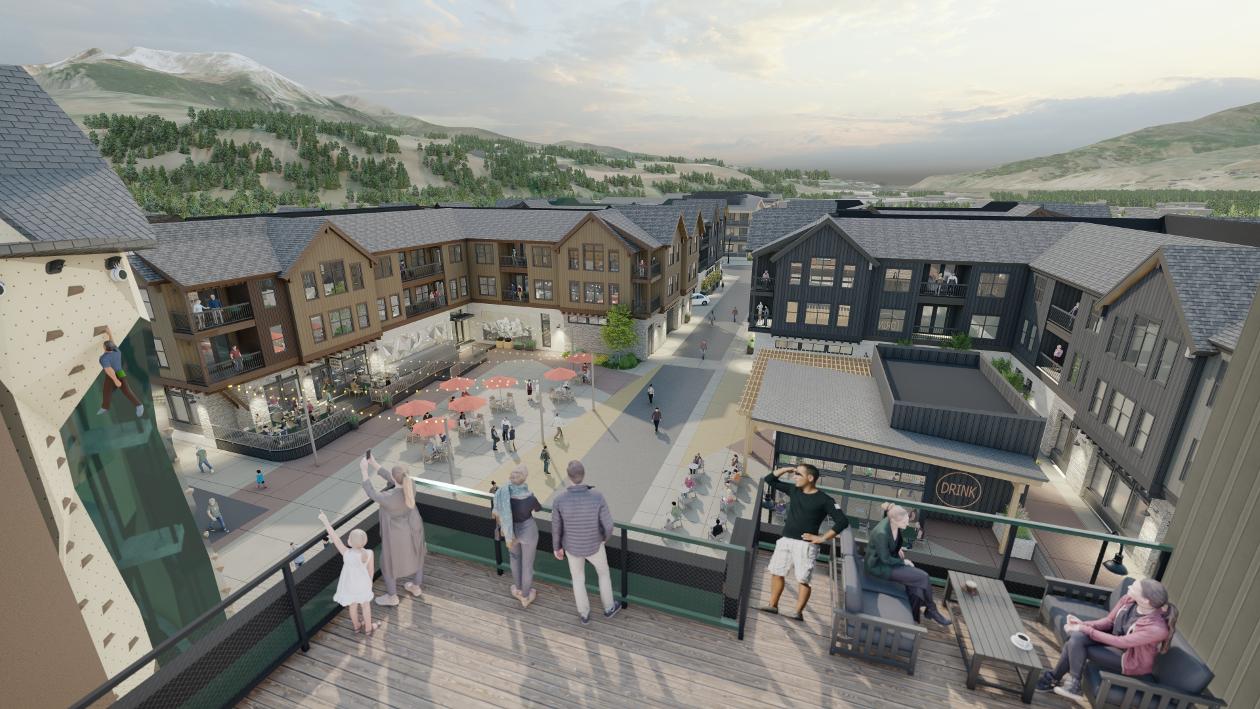
LEGACY AT VAIL SQUARE Lionshead | Vail LegacyVail com IN.HABITANCE Downtown | Silverthorne LiveAtInhabitance com CIRQUE X VICEROY Snowmass Base Village CirqueViceroycom
AREA CLOSED VOLUME CONTRACTS CLOSED PENDING VOLUME PENDING CONTRACTS TOTAL VOLUME TOTAL CONTRACTS Roaring Fork Valley $1,339,500 17 $96,356,289 11 $97,695,789 28 Eagle County $31,720,000 8 $280,389,656 103 $312,109,656 111 Summit County $28,877,000 30 $208,649,400 126 $237,526,400 156 Denver - - $16,511,169 27 $16,511,169 27 Tot al $61,936,50 0 55 $60 1,90 6,514 267 $663,843,0 14 322
S TA Y U P T O D A T E ALL YEAR & V I E W O U R P R O P E R T I E S ANYTIME A S P E N R E A L E S TA T E . C O M
