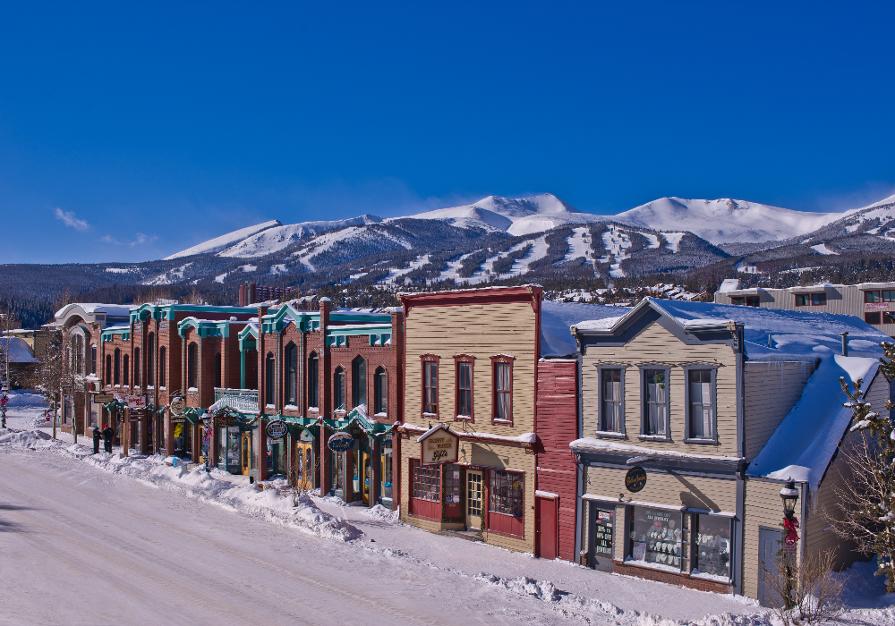
THE SLIFER REPORT


2 0 2 3 V A I L V A L L E Y R E A L E S TA T E M A R K E T
STAY UP TO DATE ALL YEAR LONG
Our teamof market expertsupdates TheSlifer Report throughout theyear. To seethelatest numbersanddiveeven deeper into thereport,scanthecodeor visit:
VailRealEstate.com/Resources/Slifer-Report
SOURCE
Soldresidential propertieswithinEagleCounty,countingboth listingandbuysidefromJanuary1,2022- December 31,2022
Sourceof all datainthisreport istheVail Boardof Realtors MultipleListingService Informationdeemedreliablebut not guaranteed Consult your Slifer Smith&FramptonBroker for moreinformation

6 | 7 | 9 | 10 | 16 | 18 | 26 | 29 | 30 | MARKET SHARE MARKET OVERVIEW LUXURY MARKET OVERVIEW UP-VALLEY MARKET REVIEW S 20 22 NOTABLE SALES MID-VALLEY MARKET REVIEW S DOW N-VALLEY MARKET REVIEW S LAND REVIEW NEW DEVELOPMENT REVIEW CONTENTS
2
Slifer Smith & Frampton Real Estate
|
A LETTER FROM OUR PRESIDENT REFLECTING ON 20 22
As we reflect on 2022, Slifer Smith & Frampton has much to celebrate, including our 60th anniversary and the growth of our team of brokers in the Front Range Our people remain our biggest asset and Slifer Smith & Frampton is well prepared to provide a high level of service to our Clients as we look to 2023
In the first quarter of 2022, the market dynamic was still somewhat frenzied and experiencing continued impacts of post-pandemic market drivers With the increase of mortgage rates in the second quarter, the market did react, particularly in the lower price points which tend to be more interest rate sensitive. However, the main driver this year continued to be the strength of the luxury segment of the market, a trend which we anticipate will continue into 2023
In addition, a major milestone was reached in 2022 with the last two residences at One Riverfront put under contract The grand finale to Riverfront Village ? which has been transformative to Avon ? is now completely sold out.
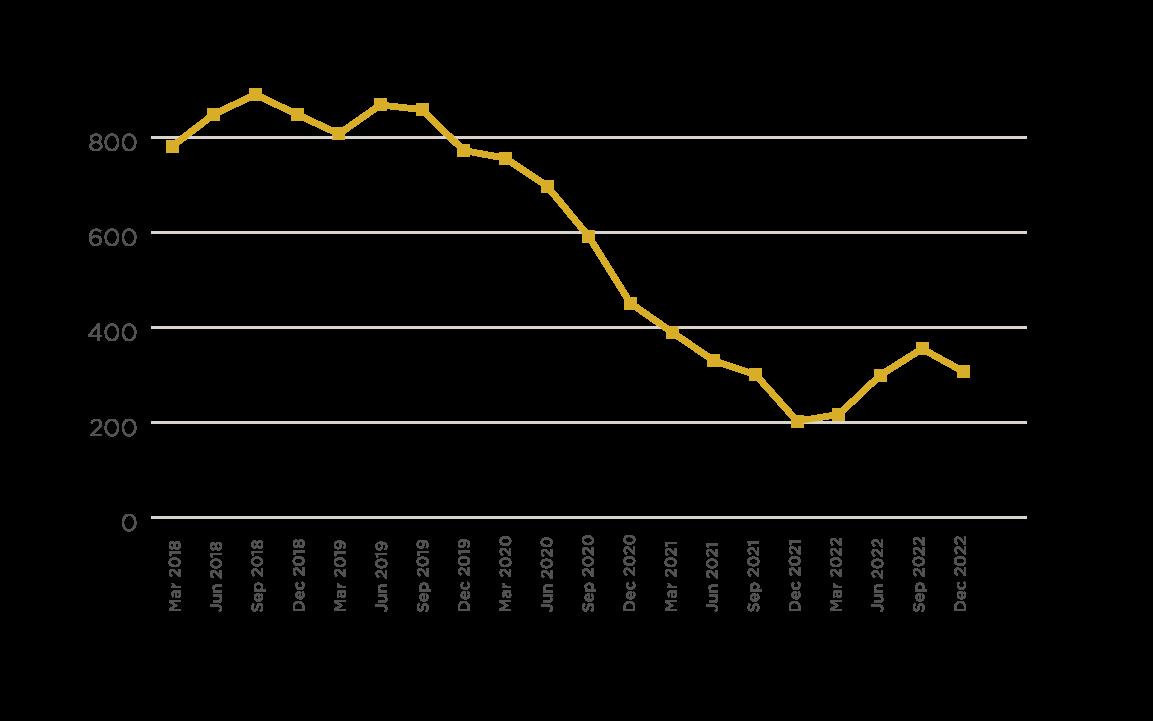
As we look to 2023, limited inventory continues to be the primary challenge
As of the end of 2022, we are down to below 300 residential listings in the Vail Valley. This is down significantly from the end of 2018 and 2019 when inventory hovered around 800 to 900 homes However, we do anticipate as the year progresses that we will see a more normalized real estate process with opportunities for both buyers and sellers despite limited inventory.
One thing that is foundational to our firm and continues to set us apart is our commitment to our local community. In 2022, we announced a cornerstone sponsorship agreement with the Vail Valley Foundation as its exclusive real estate services provider This multi-year partnership will help to support the Vail Valley Foundation?s mission of providing critical financial and logistical support for our community in the areas of arts, education and athletics.
Also in 2022, Slifer Smith & Frampton celebrated our 60th anniversary. It gives us great pride to have been invested in and committed to Colorado communities since 1962 A second major milestone was welcoming Colorado Landmark Realtors, a pioneer in the Boulder Valley Real Estate market for 45 years, to Slifer Smith & Frampton. This expansion not only led to our designation as the No 1 Independent Real Estate Brokerage in Colorado but allowed us to expand our Front Range presence adding three Boulder Valley offices to our two Downtown Denver offices
As we look into 2023 we reaffirm our commitment to being stewards of the Vail Valley and the Colorado communities which we proudly serve. We look forward to bringing the same vision and innovation to our next 60 years
 Vail Valley Market President

MATT FITZGERALD
PROUDLY INDEPENDENT REAL ESTATE
AcrossColorado
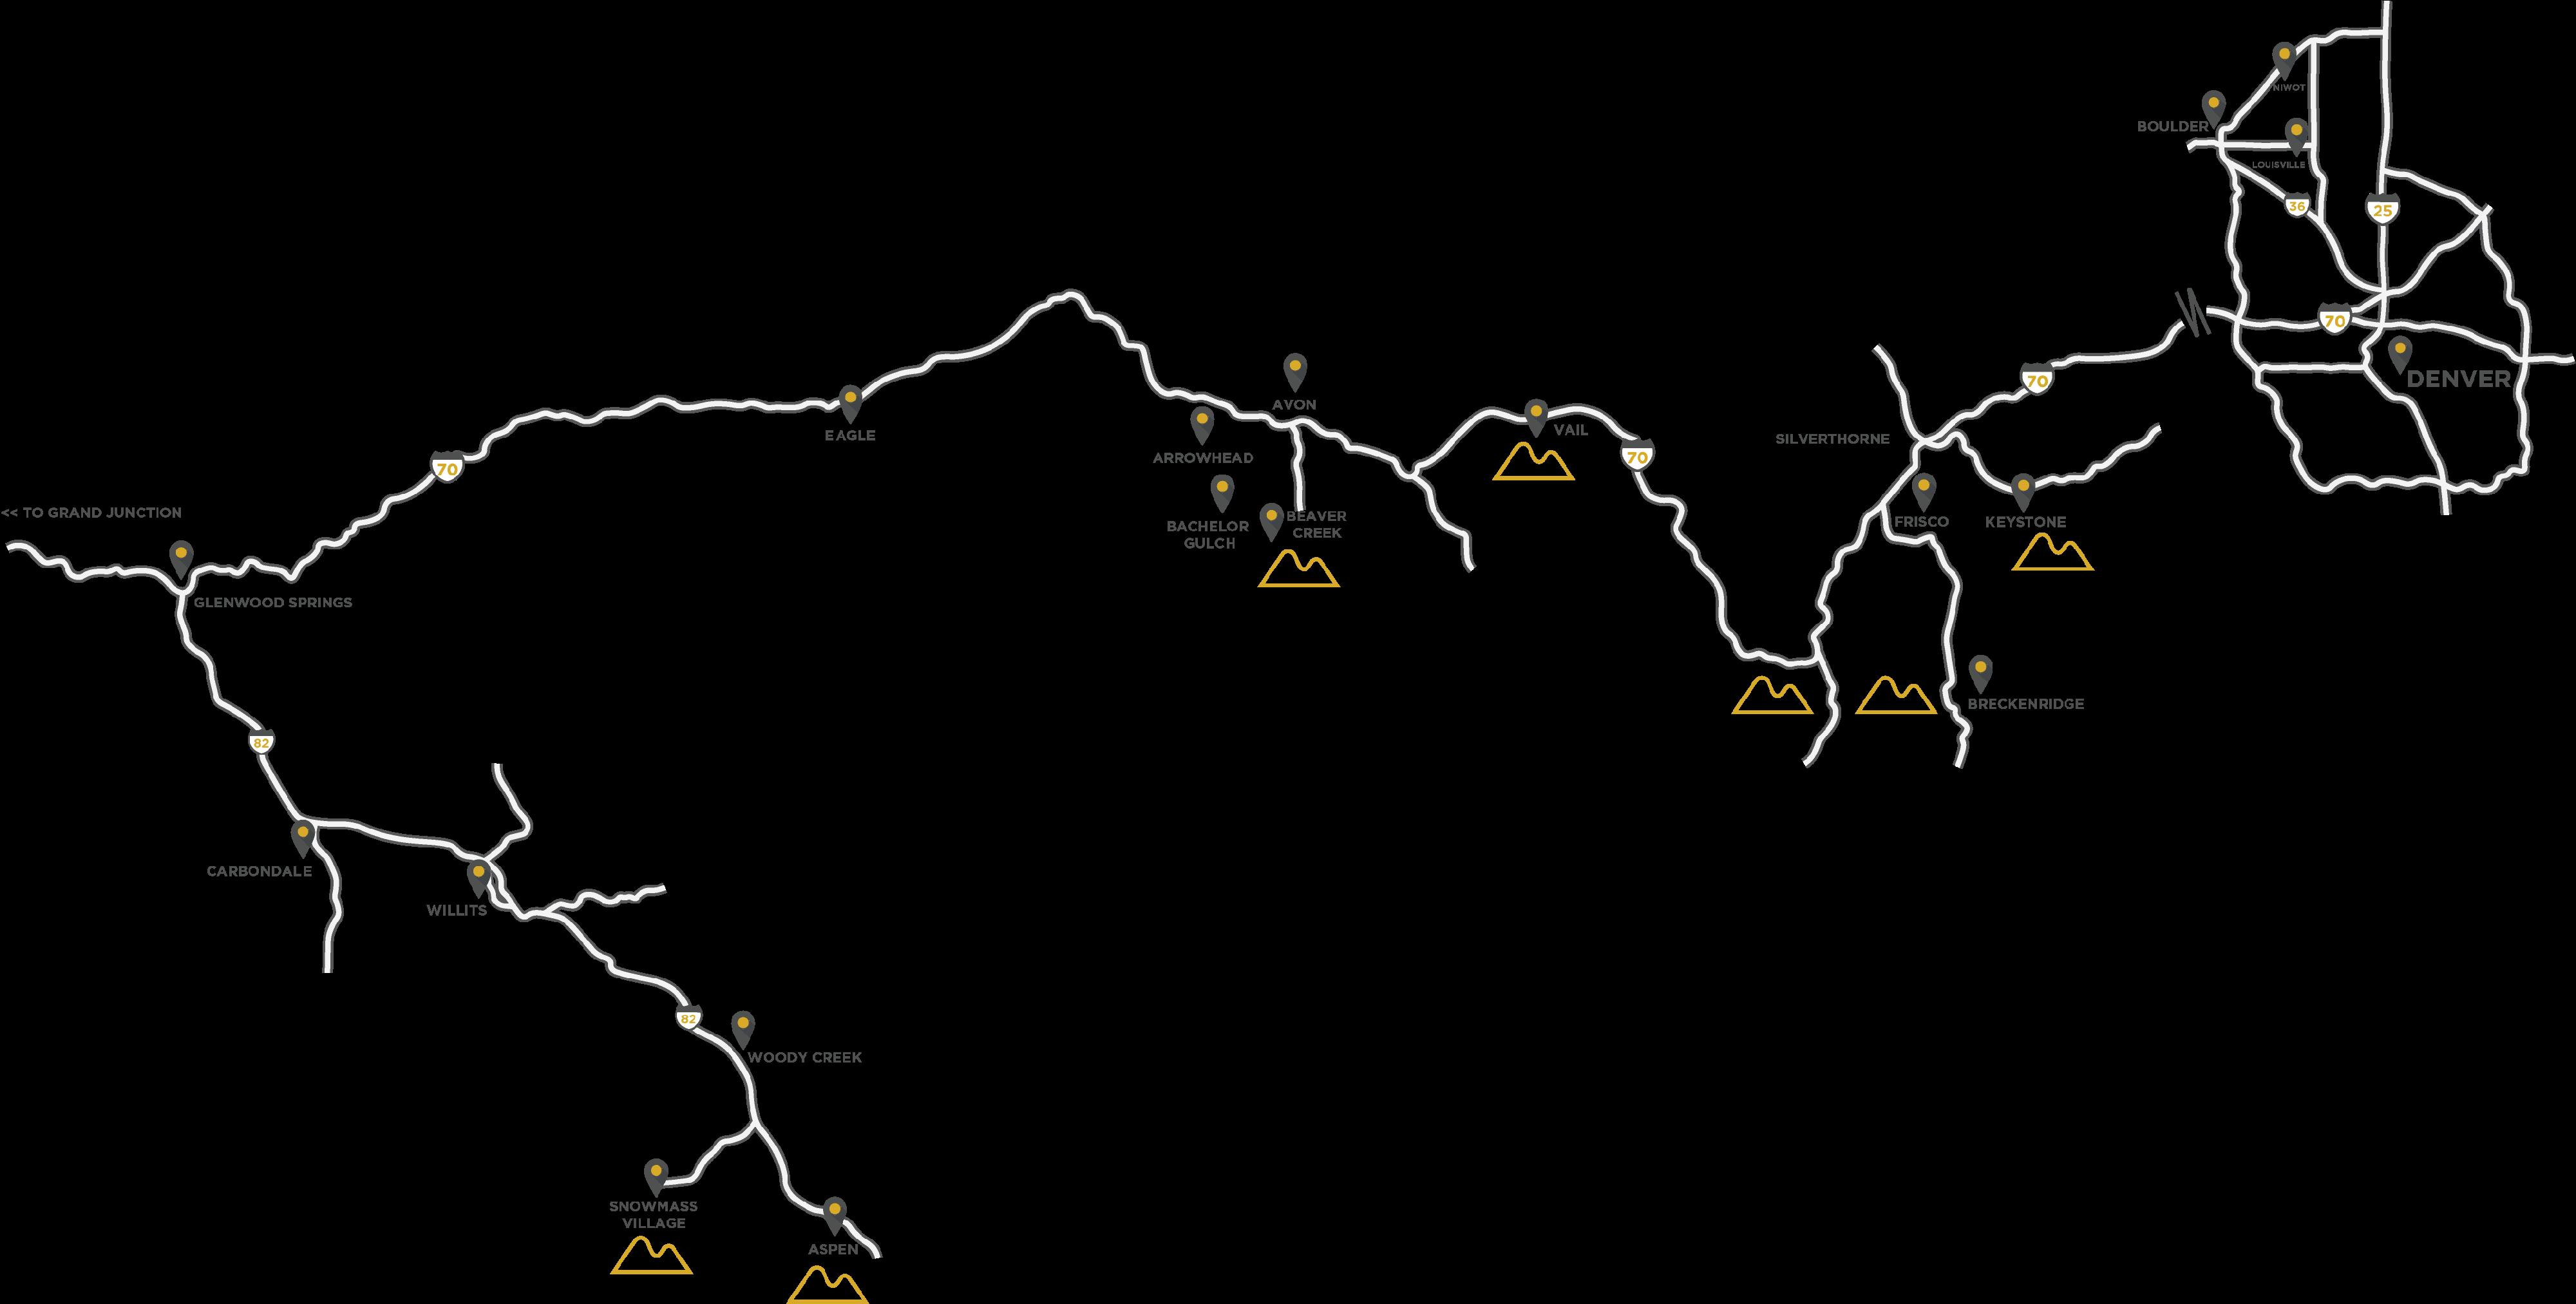
FoundedinVail,1962,thehistoryof Slifer Smith&FramptonReal Estateisoneof hard-wonsuccessand careful stewardshipfor thecommunitiesweserveand call home. Today,we'vegrownacrossthestate,serving four uniquemarketsfromAspento theFront Range,but our passionfor creatingincredible communitiesremainsunwavering It'sjust onereasonwhyweareproud to be Colorado'sleading,independent real estatebrokerage
WepublishTheSlifer Report inall of our markets,so to keepyour finger onthepulse of real estateacrossColorado pleasevisit: SliferSmithAndFrampton.com/Market-Reports
RoaringForkValley 6 LOCATIONS VailValley 10 LOCATIONS
270+ world-class agents across Colorado
120+ dedicated & local support staff
$10B+ sales volume since 2020
#1
Colorado's leading, independent real estate company
100% Colorado owned & operated

SummitCounty 5 LOCATIONS Front Range 5 LOCATIONS
THE SLIFER DIFFERENCE
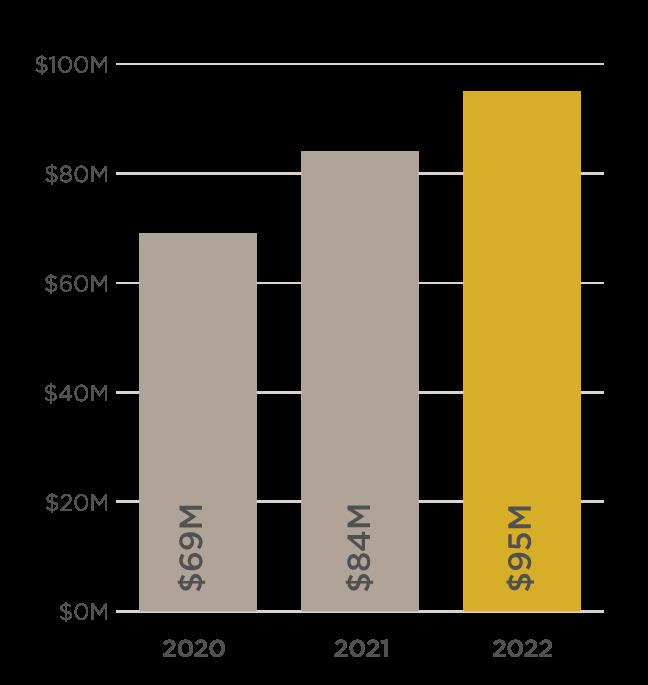
OUR MARKET SHARE
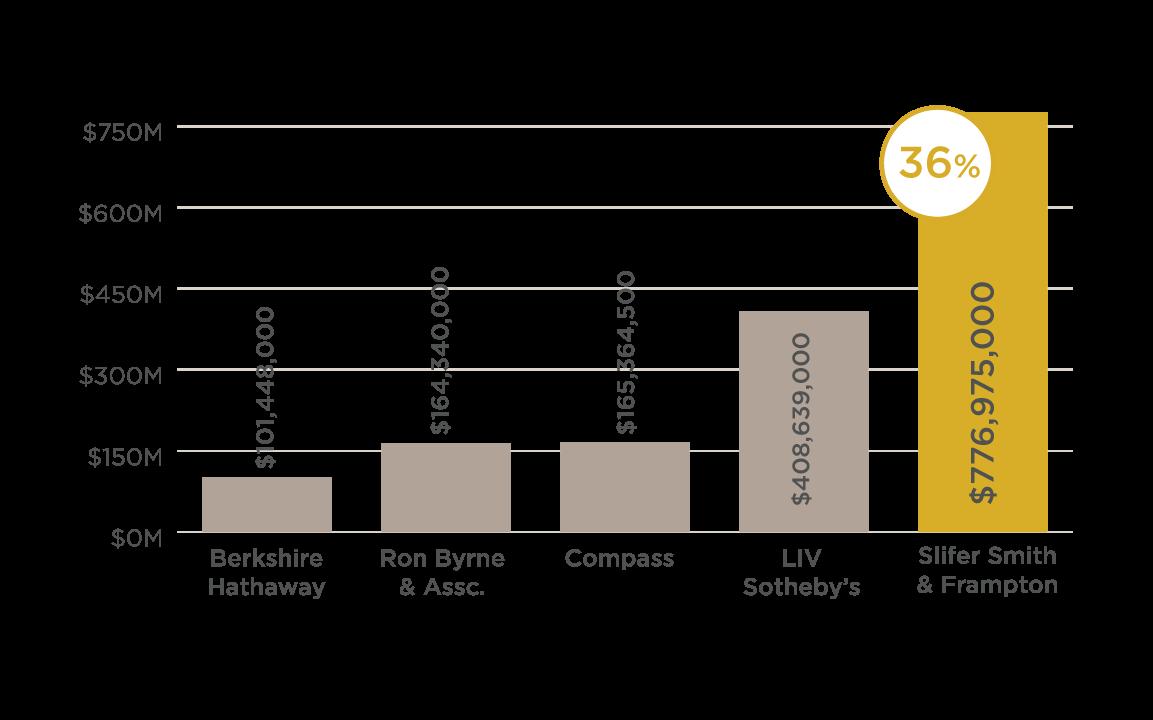
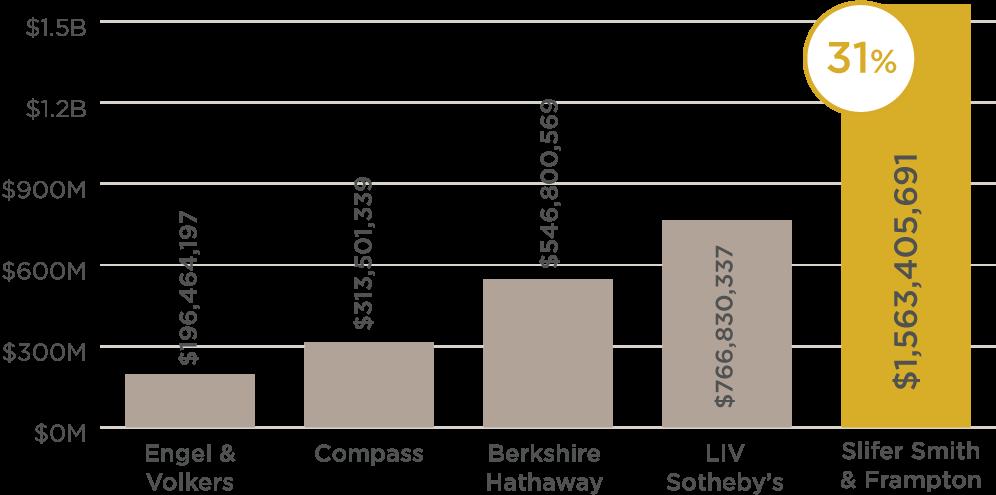
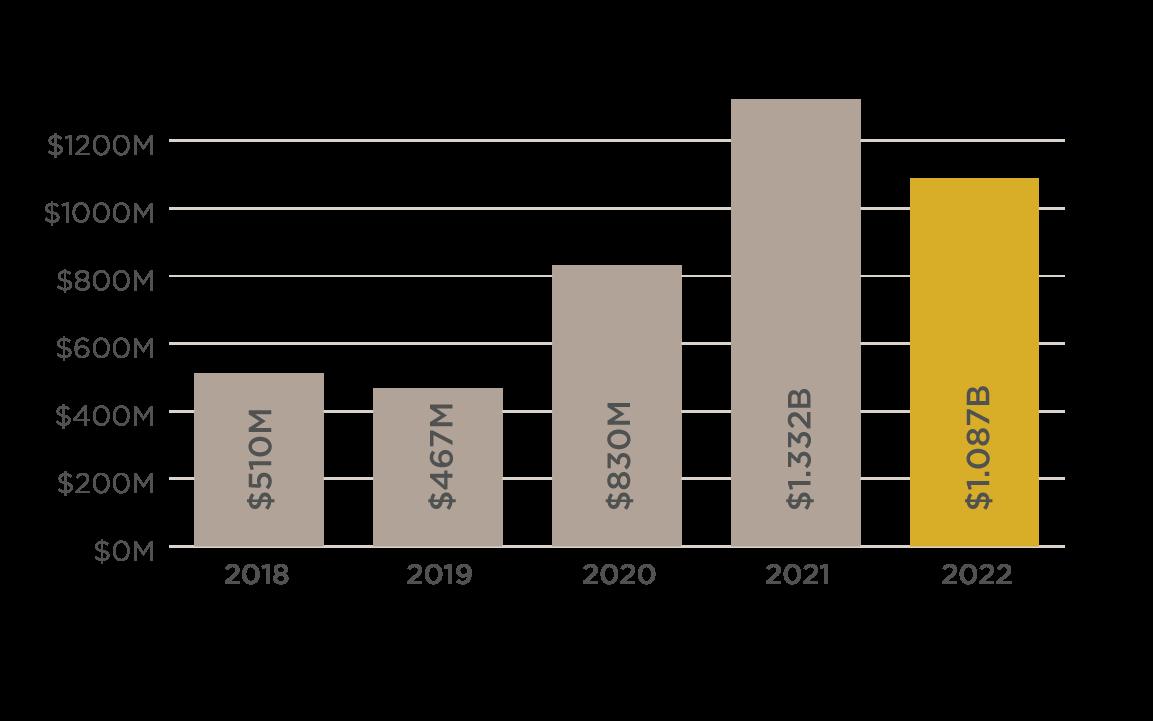
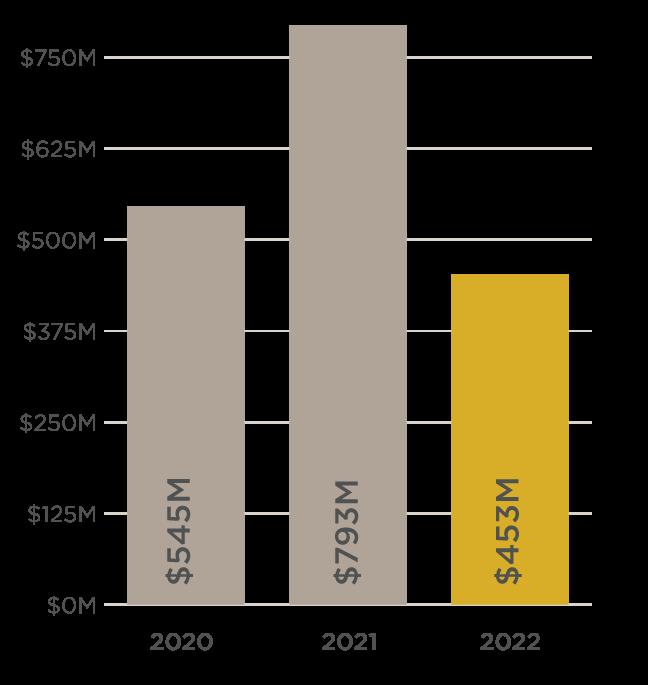
SALES VOLUME COMPARISON | SSF MARKET SHARE Slifer Smith & Frampton Real Estate | 6 LUXURY SALES VOLUME COMPARISON | SSF MARKET SHARE
Sales Over
Million
Residential
$4
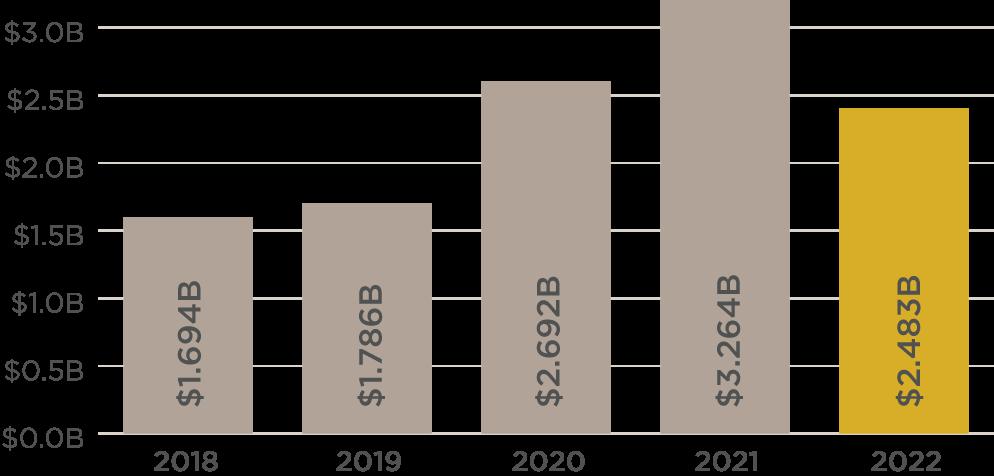
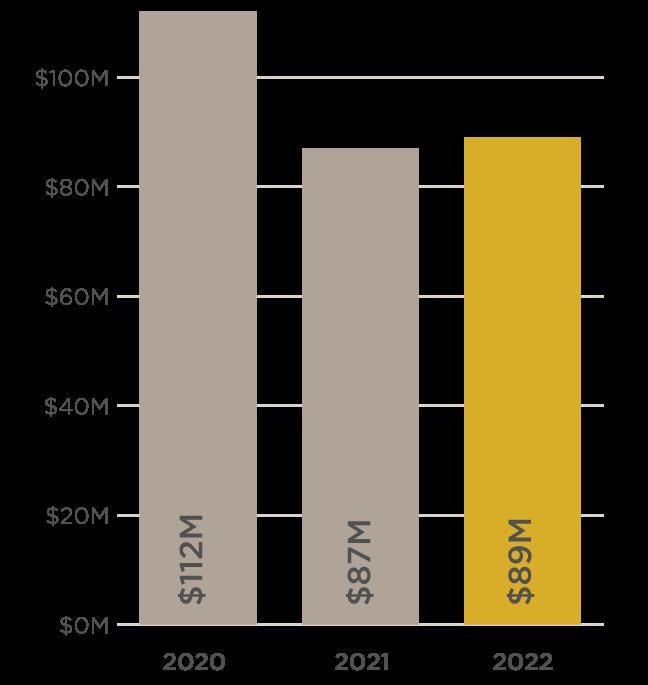
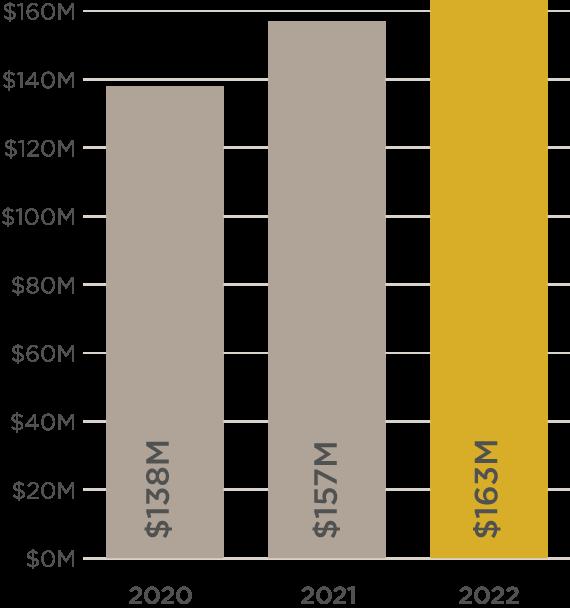
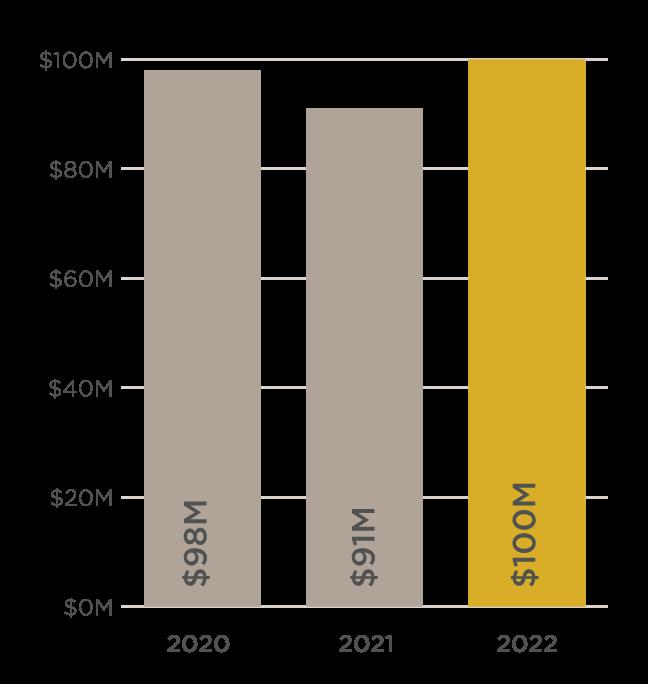
SALES VOLUME COMPARISON
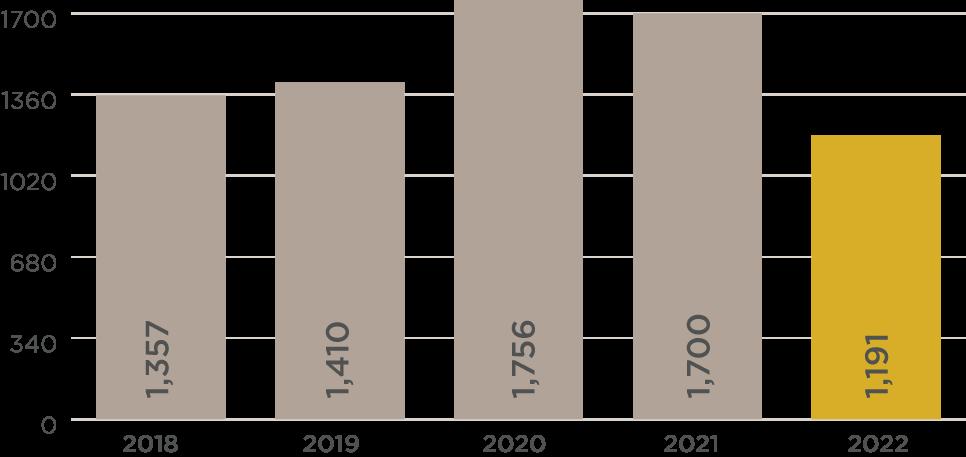
MARKET OVERVIEW
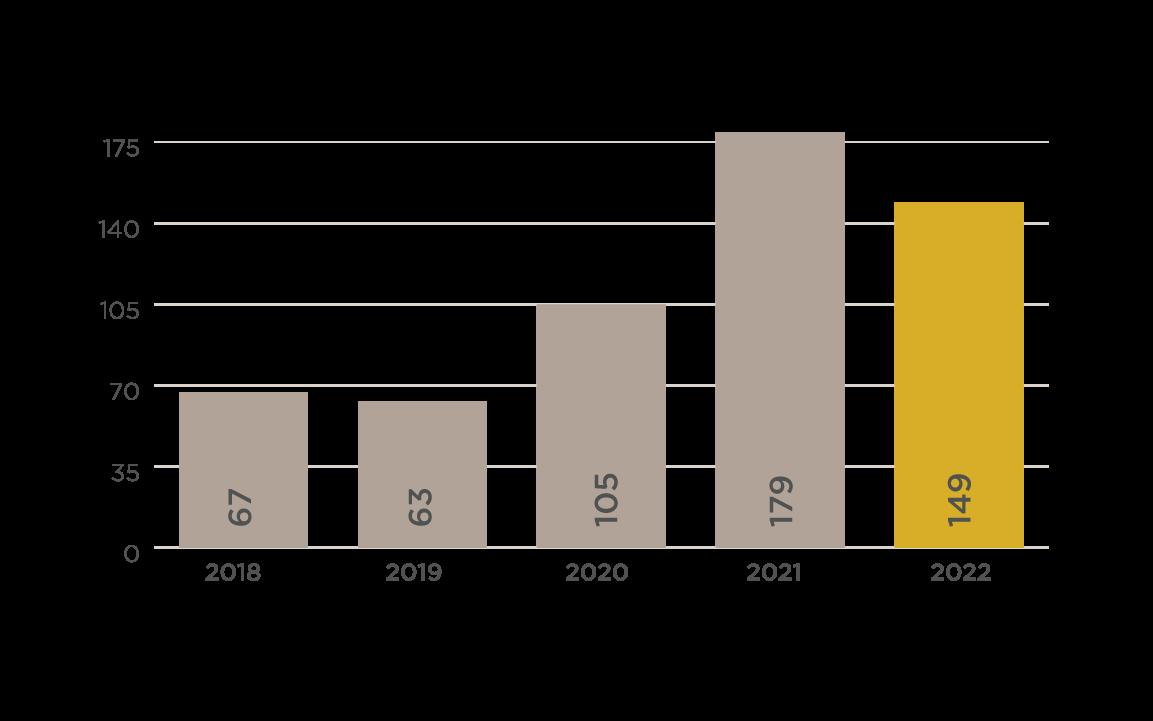
TRANSACTION COMPARISON
The Slifer Report 2023 | 7
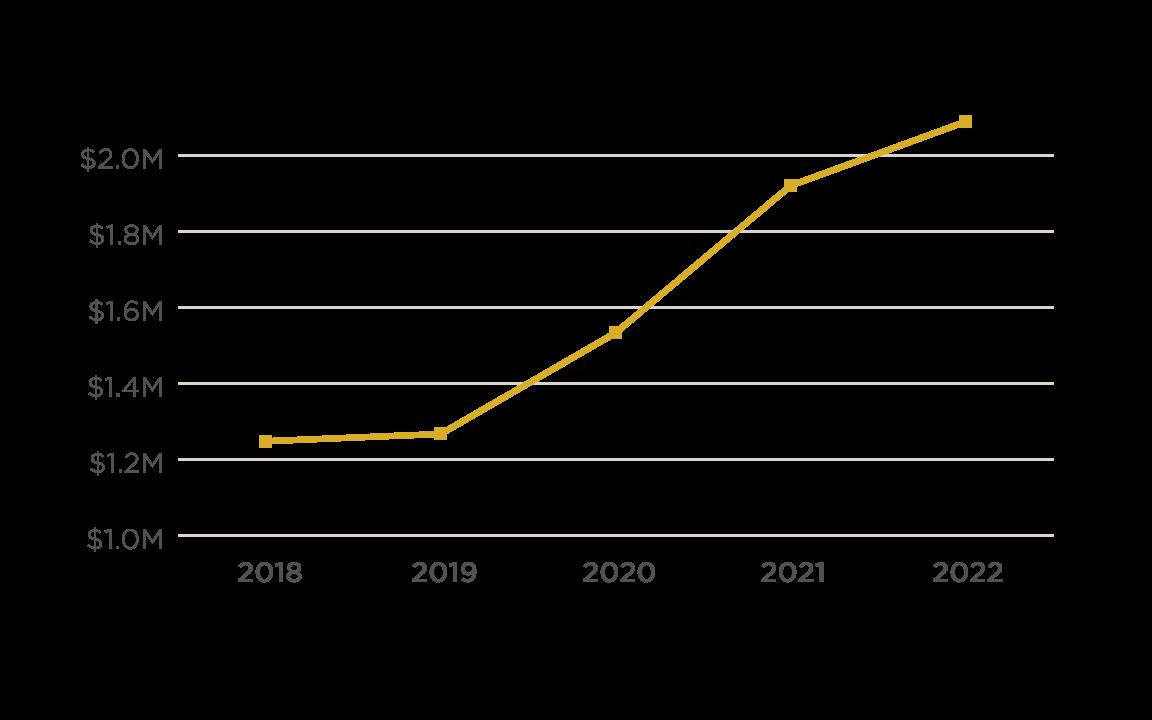
MARKET OVERVIEW
RESIDENTIAL AVERAGE SALES PRICE COMPARISON
ACTIVE INVENTORY BY MONTH
Slifer Smith &
Real Estate | 8
Frampton
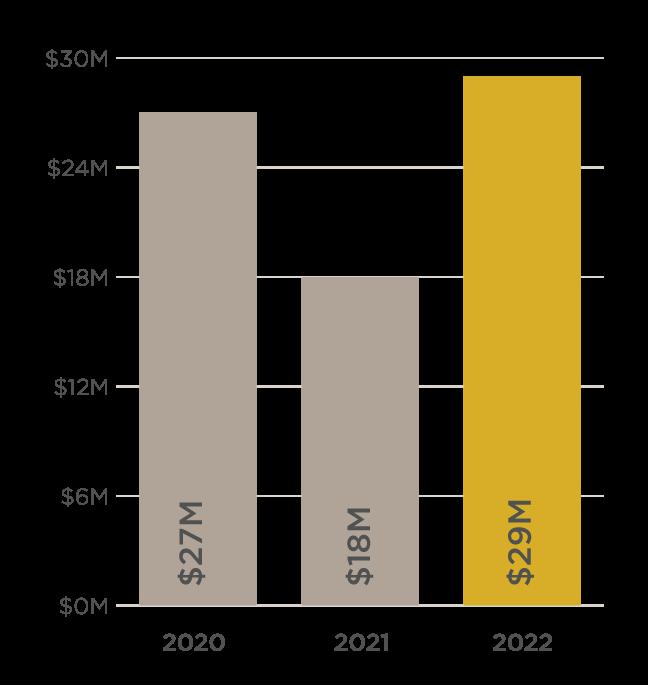
LUXURY OVERVIEW
Residential Sales Over $4 Million
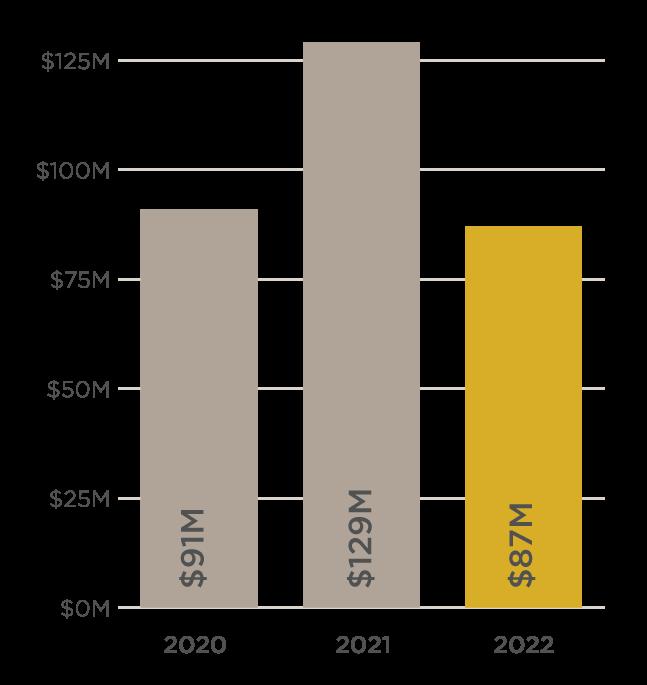
LUXURY SALES VOLUME COMPARISON

LUXURY TRANSACTION COMPARISON
The Slifer Report 2023 | 9
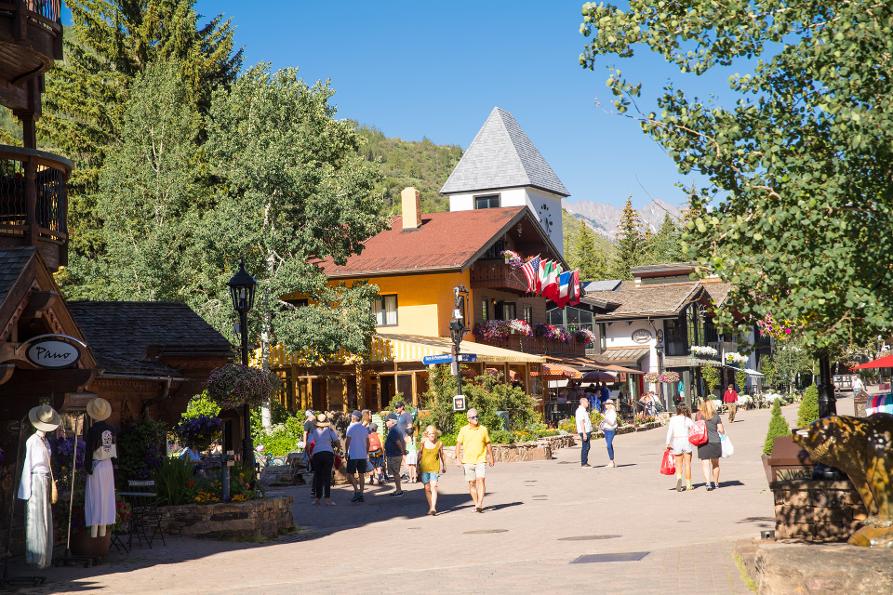
VAIL VILLAGE & LIONSHEAD
$5.5M averagesold price, a29%increase over 2021
Real
| 10
Slifer Smith & Frampton
Estate
SINGLE FAMILY & DUPLEX SALES VOLUME NO. OF SALES AVG. DAYS ON MARKET AVG. SALE MEDIAN SALE 2018 $135,465,000 12 218 $11,288,750 $9,525,000 2019 $62,957,500 5 509 $12,591,500 $12,000,000 2020 $203,183,680 13 221 $15,629,513 $11,900,000 2021 $248,450,000 17 346 $14,614,706 $12,450,000 2022 $148,435,000 8 196 $18,554,375 $15,800,000 CONDOMINIUM & TOW NHOME SALES VOLUME NO OF SALES AVG DAYS ON MARKET AVG SALE MEDIAN SALE 2018 $271,696,250 90 259 $3,018,847 $2,190,000 2019 $244,266,100 81 325 $3,015,631 $2,100,000 2020 $338,543,300 101 278 $3,351,914 $2,600,000 2021 $545,401,415 168 155 $3,246,437 $2,650,000 2022 $305,260,500 74 68 $4,125,142 $3,212,500
AVERAGE PRICE PER SQUARE FOOT
VS. LIST PRICE COMPARISON 2018 2019 2020 2021 2022 Single Family & Duplex $2,112 $2,577 $2,752 $2,939 $3,183 Condominium & Townhome $1,575 $1,596 $1,710 $1,915 $2,193 AVERAGE SALE / LAST LISTED PRICE Single Family & Duplex 93% Condominium & Townhome 98% #1 IN MARKET SHARE SALES
AREA highlights
SALE
VOLUME COMPARISON
residence
$30 .9M highest sale single-family
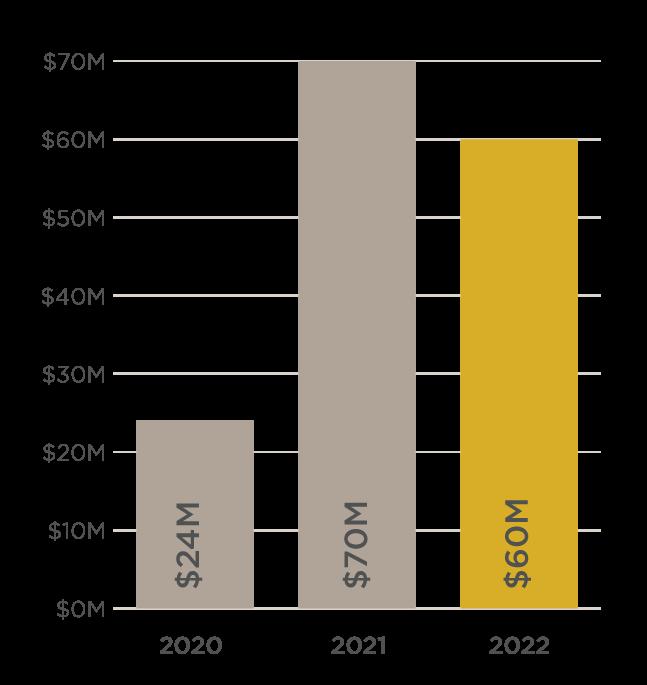
VAIL GOLF COURSE, SPRADDLE CREEK & CASCADE VILLAGE
$1,511 averagesold price per squarefoot,a 24%increaseover 2021
$15.5M highest sale SSFrepresented theseller
AREA highlights #1 IN MARKET
The Slifer Report 2023 | 11
SINGLE FAMILY & DUPLEX SALES VOLUME NO. OF SALES AVG. DAYS ON MARKET AVG. SALE MEDIAN SALE 2018 $69,438,750 11 313 $6,312,614 $6,093,750 2019 $95,176,788 14 216 $6,798,342 $4,550,000 2020 $58,321,125 8 212 $7,290,141 $7,351,562 2021 $74,775,000 11 206 $6,797,727 $8,050,000 2022 $56,050,000 6 115 $9,341,667 $9,850,000 CONDOMINIUM & TOW NHOME SALES VOLUME NO OF SALES AVG DAYS ON MARKET AVG SALE MEDIAN SALE 2018 $3,369,000 3 115 $1,123,000 $700,000 2019 $27,061,500 16 102 $1,691,344 $1,937,500 2020 $33,175,000 20 132 $1,658,760 $1,425,000 2021 $54,329,000 24 102 $2,263,708 $2,325,000 2022 $31,462,500 13 7 $2,420,192 $2,400,000 AVERAGE PRICE PER SQUARE FOOT SALE VS. LIST PRICE COMPARISON 2018 2019 2020 2021 2022 Single Family & Duplex $1,150 $1,366 $1,675 $1,507 $1,957 Condominium & Townhome $703 $840 $890 $1,088 $1,305 AVERAGE SALE / LAST LISTED PRICE Single Family & Duplex 97% Condominium & Townhome 99%
SALES VOLUME COMPARISON
SHARE
EAST VAIL & BOOTH CREEK
SINGLE
&
Real Estate | 12
Slifer Smith
Frampton
DUPLEX SALES VOLUME NO OF SALES AVG DAYS ON MARKET AVG SALE MEDIAN SALE 2018 $55,231,200 27 124 $2,045,600 $1,715,000 2019 $80,382,169 31 145 $2,592,973 $1,575,000 2020 $95,260,705 42 136 $2,268,112 $1,801,000 2021 $70,722,000 21 140 $3,367,714 $2,400,000 2022 $43,206,000 14 41 $3,086,143 $2,472,500
FAMILY &
SALES VOLUME NO OF SALES AVG DAYS ON MARKET AVG SALE MEDIAN SALE 2018 $39,002,500 59 61 $661,059 $600,000 2019 $29,508,260 49 36 $602,209 $600,000 2020 $47,406,000 70 44 $677,229 $607,000 2021 $55,343,825 70 21 $790,626 $689,750 2022 $41,843,111 41 21 $1,020,564 $975,000 AREA highlights AVERAGE PRICE PER SQUARE FOOT SALE VS. LIST PRICE COMPARISON 2018 2019 2020 2021 2022 Single Family & Duplex $597 $733 $691 $960 $1,003 Condominium & Townhome $573 $595 $651 $757 $1,003 AVERAGE SALE / LAST LISTED PRICE Single Family & Duplex 97% Condominium & Townhome 101% #1 IN MARKET SHARE SALES VOLUME COMPARISON 25% increaseof averagesold price per squarefoot over 2021 $8.3M highest sale SSFrepresented theseller
CONDOMINIUM & TOW NHOME
WEST VAIL, SANDSTONE & LIONSRIDGE
The Slifer Report 2023 | 13
SINGLE FAMILY & DUPLEX SALES VOLUME NO OF SALES AVG DAYS ON MARKET AVG SALE MEDIAN SALE 2018 $41,408,187 23 155 $1,800,356 $1,695,000 2019 $45,113,950 26 125 $1,735,152 $1,512,500 2020 $55,171,170 30 98 $1,839,039 $1,537,500 2021 $50,128,582 26 78 $1,928,022 $1,730,000 2022 $45,540,000 15 43 $3,036,000 $2,900,000 CONDOMINIUM & TOW NHOME SALES VOLUME NO OF SALES AVG DAYS ON MARKET AVG SALE MEDIAN SALE 2018 $32,084,800 51 93 $629,114 $545,000 2019 $40,663,390 65 80 $625,591 $647,500 2020 $56,349,830 78 57 $722,434 $644,000 2021 $37,159,813 49 58 $758,364 $640,000 2022 $43,554,400 46 17 $946,835 $881,000 AVERAGE PRICE PER SQUARE FOOT SALE VS. LIST PRICE COMPARISON 2018 2019 2020 2021 2022 Single Family & Duplex $548 $599 $585 $726 $953 Condominium & Townhome $516 $523 $582 $639 $850 AVERAGE SALE / LAST LISTED PRICE Single Family & Duplex 96% Condominium & Townhome 100% AREA highlights SALES VOLUME COMPARISON #1 IN MARKET SHARE $1.46M averagesold price, a25.5%increase over 2021 $
averagesold
876
price per squarefoot,a 31%increaseover 2021
MINTURN & RED CLIFF
CONDOMINIUM & TOW NHOME
Slifer Smith & Frampton Real Estate | 14
FAMILY & DUPLEX SALES VOLUME NO OF SALES AVG DAYS ON MARKET AVG SALE MEDIAN SALE 2018 $13,896,650 20 88 $715,275 $632,500 2019 $13,310,550 16 113 $831,909 $877,750 2020 $16,039,898 19 133 $844,205 $735,000 2021 $12,157,000 16 130 $759,812 $755,000 2022 $21,415,000 18 42 $1,189,722 $1,052,500
SINGLE
SALES VOLUME NO OF SALES AVG DAYS ON MARKET AVG SALE MEDIAN SALE 2018 $2,025,000 3 117 $675,000 $635,000 2019 $4,223,250 7 150 $603,321 $654,000 2020 $11,167,500 18 98 $620,417 $670,000 2021 $6,054,500 9 119 $672,722 $690,000 2022 $8,208,500 9 25 $912,056 $959,000 AREA highlights AVERAGE PRICE PER SQUARE FOOT SALE VS. LIST PRICE COMPARISON 2018 2019 2020 2021 2022 Single Family & Duplex $338 $417 $498 $455 $589 Condominium & Townhome $374 $375 $424 $421 $636 AVERAGE SALE / LAST LISTED PRICE Single Family & Duplex 95% Condominium & Townhome 100% SALES VOLUME COMPARISON $1.09M averagesold price, a51%increase over 2021 36 averagedayson market,a71% decreaseover 2021
$1.28M averagesold price, a29%increase over 2021
17 averagedayson market,the lowest intheVail Valley*
The Slifer Report 2023 | 15 EAGLE-VAIL SINGLE FAMILY & DUPLEX SALES VOLUME NO OF SALES AVG DAYS ON MARKET AVG SALE MEDIAN SALE 2018 $26,292,956 29 69 $906,654 $795,000 2019 $31,413,750 31 111 $1,013,347 $842,000 2020 $40,434,289 34 58 $1,189,244 $1,030,312 2021 $49,478,937 35 21 $1,413,684 $1,329,500 2022 $54,773,339 30 25 $1,825,778 $1,501,000 CONDOMINIUM & TOW NHOME SALES VOLUME NO OF SALES AVG DAYS ON MARKET AVG SALE MEDIAN SALE 2018 $21,763,600 43 38 $506,130 $497,000 2019 $19,799,075 38 63 $521,028 $487,000 2020 $29,058,764 50 69 $581,175 $575,500 2021 $35,112,539 50 9 $702,251 $697,500 2022 $40,260,500 44 12 $915,011 $902,000
AREA highlights AVERAGE PRICE PER SQUARE FOOT SALE VS. LIST PRICE COMPARISON 2018 2019 2020 2021 2022 Single Family & Duplex $384 $383 $400 $524 $672 Condominium & Townhome $345 $378 $393 $495 $669 AVERAGE SALE / LAST LISTED PRICE Single Family & Duplex 98% Condominium & Townhome 102% SALES VOLUME COMPARISON
*based on the areas featured in this report
2022 NOTABLE SALES
As a founding member Slifer Smith & Frampton is proud to fly the Forbes Global Properties flag from Aspen to the Front Range. This powerful, global, network of top-tier independent brokerages gives our agents, and our clients, exclusive access to an invaluable network of the world's finest homes and the agents representing them.

In 20 22 our membership with Forbes Global Properties brought some incredible Vail Valley homes to a global audience. Here are some of our most notable sales of the year.
VAIL VILLAGE | $15,750,000
THE CHALETS AT THE LODGE AT VAIL 12
Represented The Seller
SQUAW CREEK | $11,OOO,OOO
501UTE FOREST LANE
Represented Buyer & Seller
MOUNTAIN STAR | $10,500,000
274 WILD ROSE
Represented Buyer & Seller
VAIL VILLAGE | $15,850,000 THE CHALETS AT THE LODGE AT VAIL 2
Represented The Seller
BEAVER CREEK | $10,200,000
75 ELK TRACK COURT
Represented The Seller
VAIL GOLF COURSE | $15,500,000
1160 HORNSILVER CIRCLE
Represented The Seller
Real Estate | 16
Slifer Smith & Frampton
View incredible properties from around the world anytime at:

ForbesGlobalProperties com
The Slifer Report 2023 | 17
VAIL VILLAGE | $17,500,000 VAIL ROWHOUSE 8 Represented The Seller
ARROWHEAD | $15,500,000 2495 CRESTA ROAD Represented Buyer & Seller
BEAVER CREEK | $8,700,000 102 SOUTH FAIRWAY DRIVE Represented Buyer & Seller
VAIL VILLAGE | $8,650,000 SOLARIS RESIDENCE 7A EAST Represented The Seller
VAIL VILLAGE | $14,900,000 FOUR SEASONS RESIDENCE 8201 Represented The Seller
MOUNTAIN STAR | $20,250,000 255 WILD ROSE Represented The Seller
AVON & WILDRIDGE
SINGLE
CONDOMINIUM & TOW NHOME
Slifer Smith & Frampton Real Estate | 18
FAMILY & DUPLEX SALES VOLUME NO OF SALES AVG DAYS ON MARKET AVG SALE MEDIAN SALE 2018 $39,225,250 37 134 $1,060,142 $990,000 2019 $26,236,500 24 127 $1,093,188 $972,500 2020 $50,124,133 37 118 $1,354,706 $1,297,000 2021 $35,187,000 24 27 $1,466,125 $1,332,500 2022 $35,091,150 19 41 $1,846,903 $1,600,000
SALES VOLUME NO OF SALES AVG DAYS ON MARKET AVG SALE MEDIAN SALE 2018 $64,522,393 122 99 $528,872 $415,000 2019 $103,118,038 142 89 $726,183 $515,250 2020 $156,902,634 178 93 $881,475 $632,250 2021 $165,246,599 190 40 $869,719 $625,125 2022 $132,014,280 126 27 $1,047,732 $702,500
highlights AVERAGE PRICE PER SQUARE FOOT SALE VS. LIST PRICE COMPARISON 2018 2019 2020 2021 2022 Single Family & Duplex $330 $351 $408 $468 $581 Condominium & Townhome $495 $534 $651 $710 $906 AVERAGE SALE / LAST LISTED PRICE Single Family & Duplex 97% Condominium & Townhome 100% #1 IN MARKET SHARE SALES VOLUME COMPARISON $863 averagesold price per squarefoot,a 26%increaseover 2021 $4 .4M highest sale SSFrepresented theseller
AREA
The Slifer Report 2023 | 19 MOUNTAIN STAR SINGLE FAMILY & DUPLEX SALES VOLUME NO OF SALES AVG DAYS ON MARKET AVG SALE MEDIAN SALE 2018 $5,425,000 1 739 $5,425,000 $5,425,000 2019 $13,095,000 3 543 $4,365,000 $3,550,000 2020 $24,040,000 4 230 $6,010,000 $6,117,500 2021 $70,347,500 10 470 $7,034,750 $6,100,000 2022 $60,600,000 6 152 $10,100,000 $8,200,000
20 .25M
sale
AREA highlights AVERAGE PRICE PER SQUARE FOOT SALE VS. LIST PRICE COMPARISON 2018 2019 2020 2021 2022 Single Family & Duplex $620 $633 $762 $819 $1,316 AVERAGE SALE / LAST LISTED PRICE Single Family & Duplex 94% #1 IN MARKET SHARE SALES VOLUME COMPARISON 44 % increaseinaverage sold priceover 2021
$
highest
SSFrepresented theseller
BEAVER CREEK
SINGLE
CONDOMINIUM & TOW
Slifer
&
Real Estate | 20
Smith
Frampton
FAMILY & DUPLEX SALES VOLUME NO OF SALES AVG DAYS ON MARKET AVG SALE MEDIAN SALE 2018 $115,179,000 25 287 $4,607,160 $3,400,000 2019 $64,566,316 17 376 $3,798,019 $3,000,000 2020 $84,815,000 16 472 $5,300,938 $5,062,500 2021 $173,203,676 30 230 $5,773,456 $5,584,500 2022 $80,875,500 13 218 $6,221,192 $5,700,000
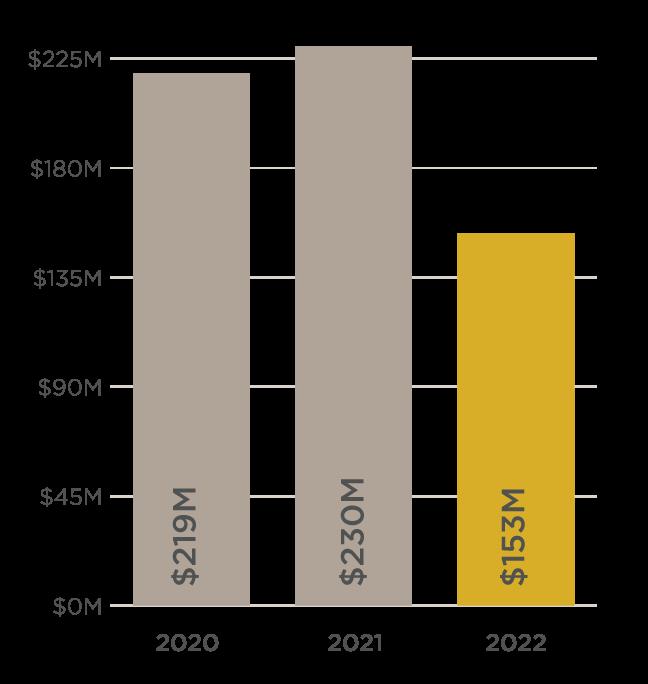
SALES VOLUME NO OF SALES AVG DAYS ON MARKET AVG SALE MEDIAN SALE 2018 $143,871,399 90 166 $1,598,571 $1,087,500 2019 $130,588,025 93 182 $1,404,172 $1,085,000 2020 $139,391,900 93 164 $1,498,838 $1,121,400 2021 $219,898,575 125 96 $1,759,189 $1,460,000 2022 $190,586,375 79 27 $2,412,486 $2,150,000
AVERAGE PRICE PER SQUARE FOOT SALE VS. LIST PRICE COMPARISON 2018 2019 2020 2021 2022 Single Family & Duplex $669 $715 $942 $926 $1,106 Condominium & Townhome $777 $779 $795 $985 $1,342 AVERAGE SALE / LAST LISTED PRICE Single Family & Duplex 99% Condominium & Townhome 98% #1 IN MARKET SHARE SALES VOLUME COMPARISON
NHOME
AREA highlights
price
squarefoot over 2021,to $1,309
.2M
sale
34 % increaseof averagesold
per
$10
highest
SSFrepresented theseller
The Slifer Report 2023 | 21 BACHELOR GULCH SINGLE FAMILY & DUPLEX SALES VOLUME NO OF SALES AVG DAYS ON MARKET AVG SALE MEDIAN SALE 2018 $12,000,000 3 132 $4,000,000 $2,300,000 2019 $30,595,000 4 111 $7,648,750 $7,700,000 2020 $106,887,500 14 298 $7,634,821 $8,300,000 2021 $167,062,750 20 179 $8,353,138 $8,525,000 2022 $72,320,000 8 35 $9,040,000 $8,847,500 CONDOMINIUM & TOW NHOME SALES VOLUME NO OF SALES AVG DAYS ON MARKET AVG SALE MEDIAN SALE 2018 $33,561,500 17 159 $1,974,206 $1,732,500 2019 $38,270,500 21 258 $1,822,405 $1,600,000 2020 $112,431,500 51 119 $2,204,539 $2,175,000 2021 $94,423,500 34 125 $2,777,162 $2,432,500 2022 $67,375,500 17 24 $3,963,265 $3,995,000
decreaseover 2021 AVERAGE PRICE PER SQUARE FOOT SALE VS. LIST PRICE COMPARISON 2018 2019 2020 2021 2022 Single Family & Duplex $870 $947 $935 $1,096 $1,255 Condominium & Townhome $879 $890 $985 $1,226 $1,530 AVERAGE SALE / LAST LISTED PRICE Single Family & Duplex 97% Condominium & Townhome 97% AREA highlights SALES VOLUME COMPARISON #1 IN MARKET SHARE $1,442 averagesold price per squarefoot,a 22%increaseover 2021
27 averagedayson market,an81%
SINGLE
Slifer Smith & Frampton Real Estate | 22
ARROWHEAD
FAMILY & DUPLEX SALES VOLUME NO OF SALES AVG DAYS ON MARKET AVG SALE MEDIAN SALE 2018 $69,522,500 25 157 $2,780,900 $2,500,000 2019 $79,837,500 30 222 $2,661,250 $2,060,000 2020 $153,581,800 47 194 $3,267,698 $2,787,500 2021 $115,319,950 30 95 $3,843,998 $3,621,500 2022 $120,344,500 23 94 $5,232,370 $4,950,000
SALES VOLUME NO OF SALES AVG DAYS ON MARKET AVG SALE MEDIAN SALE 2018 $25,539,400 23 142 $1,110,409 $1,075,000 2019 $27,713,500 25 147 $1,108,540 $1,060,000 2020 $46,054,400 39 117 $1,180,882 $1,165,000 2021 $48,517,500 31 28 $1,565,081 $1,285,000 2022 $43,652,500 24 10 $1,818,854 $1,742,500
AVERAGE PRICE PER SQUARE FOOT SALE VS. LIST PRICE COMPARISON 2018 2019 2020 2021 2022 Single Family & Duplex $569 $548 $644 $756 $958 Condominium & Townhome $630 $663 $713 $929 $1,169 AVERAGE SALE / LAST LISTED PRICE Single Family & Duplex 99% Condominium & Townhome 100% #1 IN MARKET SHARE SALES VOLUME COMPARISON $3.48M averagesold price, a30%increase over 2021 $15.5M highest sale SSFrepresented buyer&seller
CONDOMINIUM & TOW NHOME
AREA highlights
EDWARDS, HOMESTEAD & LAKE CREEK VALLEY
The Slifer Report 2023 | 23
SINGLE FAMILY & DUPLEX SALES VOLUME NO OF SALES AVG DAYS ON MARKET AVG SALE MEDIAN SALE 2018 $29,448,000 26 153 $1,132,615 $948,750 2019 $70,099,585 41 144 $1,709,746 $1,030,000 2020 $72,539,751 46 104 $1,576,951 $1,286,500 2021 $106,580,612 48 48 $2,220,429 $1,700,000 2022 $113,487,540 27 77 $4,203,242 $2,000,000 CONDOMINIUM & TOW NHOME SALES VOLUME NO OF SALES AVG DAYS ON MARKET AVG SALE MEDIAN SALE 2018 $29,732,894 62 58 $479,563 $471,000 2019 $33,961,950 67 63 $506,895 $485,000 2020 $31,765,993 61 28 $520,754 $485,000 2021 $41,568,500 61 10 $681,451 $625,000 2022 $49,246,544 59 15 $834,687 $772,500 $40 M highest sale,a 250-acreestate AREA highlights AVERAGE PRICE PER SQUARE FOOT SALE VS. LIST PRICE COMPARISON 2018 2019 2020 2021 2022 Single Family & Duplex $327 $402 $412 $536 $861 Condominium & Townhome $368 $367 $399 $491 $627 AVERAGE SALE / LAST LISTED PRICE Single Family & Duplex 98% Condominium & Townhome 101% SALES VOLUME COMPARISON $700 averagesold price per squarefoot,a 35%increaseover 2021
Slifer Smith & Frampton Real Estate | 24
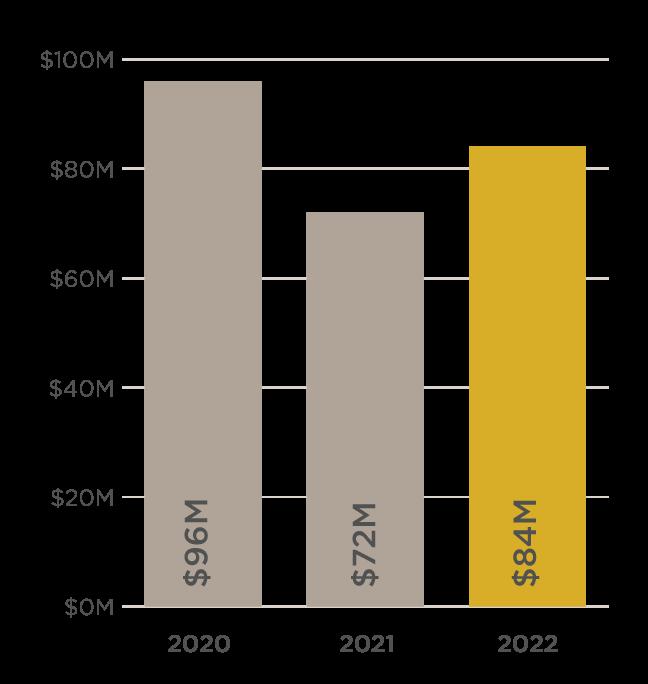
SINGLE FAMILY & DUPLEX SALES VOLUME NO OF SALES AVG DAYS ON MARKET AVG SALE MEDIAN SALE 2018 $54,096,307 49 113 $1,104,006 $1,025,000 2019 $53,999,100 45 112 $1,199,980 $1,100,000 2020 $90,859,320 64 110 $1,419,677 $1,297,500 2021 $62,666,000 38 43 $1,649,105 $1,425,000 2022 $77,166,000 34 28 $2,269,588 $1,960,000 CONDOMINIUM & TOW NHOME SALES VOLUME NO OF SALES AVG DAYS ON MARKET AVG SALE MEDIAN SALE 2018 $5,062,500 7 15 $723,214 $582,500 2019 $3,405,000 4 15 $851,250 $885,000 2020 $5,397,530 6 226 $899,588 $912,500 2021 $9,761,500 10 8 $976,150 $925,000 2022 $7,100,000 5 8 $1,420,000 $1,575,000
AVERAGE PRICE PER SQUARE FOOT SALE VS. LIST PRICE COMPARISON 2018 2019 2020 2021 2022 Single Family & Duplex $366 $384 $409 $533 $607 Condominium & Townhome $441 $429 $410 $590 $745 AVERAGE SALE / LAST LISTED PRICE Single Family & Duplex 96% Condominium & Townhome 98% SALES VOLUME COMPARISON $2.16M averagesold price, a43%increase over 2021 26 averagedayson market,a28% decreaseover 2021
SINGLETREE
AREA highlights
CORDILLERA & TIMBER SPRINGS
The Slifer Report 2023 | 25
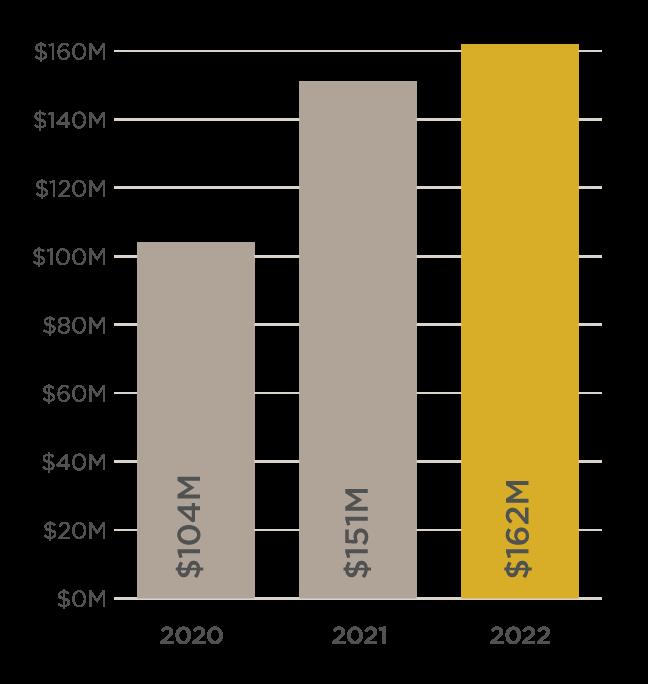
SINGLE FAMILY & DUPLEX SALES VOLUME NO OF SALES AVG DAYS ON MARKET AVG SALE MEDIAN SALE 2018 $76,493,500 43 227 $1,778,919 $1,600,000 2019 $117,661,083 56 233 $2,101,091 $2,059,950 2020 $203,140,804 91 210 $2,342,692 $2,150,000 2021 $230,347,377 74 63 $3,112,802 $3,155,000 2022 $153,725,671 40 56 $3,843,142 $3,497,500 $10 M highest sale single-family residence AREA highlights AVERAGE PRICE PER SQUARE FOOT SALE VS. LIST PRICE COMPARISON 2018 2019 2020 2021 2022 Single Family & Duplex $355 $402 $400 $598 $717 AVERAGE SALE / LAST LISTED PRICE Single Family & Duplex 97% #1 IN MARKET SHARE SALES VOLUME COMPARISON $717 averagesold price per squarefoot,a 20%increaseover 2021
WOLCOTT, BELLYACHE & RED SKY RANCH
Slifer Smith & Frampton Real Estate | 26
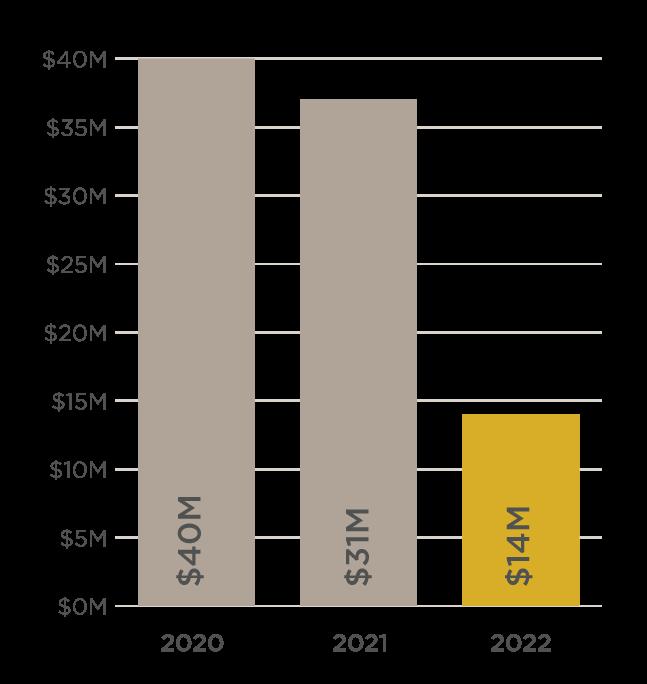
SINGLE FAMILY & DUPLEX SALES VOLUME NO OF SALES AVG DAYS ON MARKET AVG SALE MEDIAN SALE 2018 $18,575,250 11 179 $1,688,659 $1,340,000 2019 $6,155,650 7 100 $879,379 $755,000 2020 $40,220,500 17 212 $2,365,912 $1,875,000 2021 $37,757,000 12 59 $3,146,417 $2,112,500 2022 $14,625,000 5 39 $2,925,000 $2,975,000 AREA highlights AVERAGE PRICE PER SQUARE FOOT SALE VS. LIST PRICE COMPARISON 2018 2019 2020 2021 2022 Single Family & Duplex $335 $331 $411 $505 $620 AVERAGE SALE / LAST LISTED PRICE Single Family & Duplex 97% #1 IN MARKET SHARE SALES
5
SSFrepresented theseller inall 5 salesinWolcott, and represented 2 of thebuyers $4 .9M highest sale
VOLUME COMPARISON
SALES
EAGLE & EAGLE RANCH
$1.13M averagesold
a21.5%increase over 2021
$3.3M highest sale SSFrepresented theseller
The Slifer Report 2023 | 27
SINGLE FAMILY & DUPLEX SALES VOLUME NO OF SALES AVG DAYS ON MARKET AVG SALE MEDIAN SALE 2018 $79,981,054 112 100 $714,117 $657,812 2019 $67,982,540 94 97 $723,219 $653,500 2020 $103,685,828 115 78 $901,616 $779,000 2021 $126,063,269 101 25 $1,248,151 $1,095,000 2022 $141,633,825 107 29 $1,323,681 $1,200,000 CONDOMINIUM & TOW NHOME SALES VOLUME NO OF SALES AVG DAYS ON MARKET AVG SALE MEDIAN SALE 2018 $23,793,946 63 61 $377,682 $374,000 2019 $25,101,635 64 60 $392,213 $393,500 2020 $28,483,997 68 42 $418,882 $426,388 2021 $30,016,542 64 6 $469,008 $450,000 2022 $22,191,583 37 15 $599,773 $595,000
AREA highlights AVERAGE PRICE PER SQUARE FOOT SALE VS. LIST PRICE COMPARISON 2018 2019 2020 2021 2022 Single Family & Duplex $243 $255 $291 $345 $428 Condominium & Townhome $268 $285 $307 $366 $434 AVERAGE SALE / LAST LISTED PRICE Single Family & Duplex 98% Condominium & Townhome 101% #1 IN MARKET SHARE SALES VOLUME COMPARISON
price,
GYPSUM & COTTON RANCH
CONDOMINIUM & TOW NHOME
Slifer Smith & Frampton Real Estate | 28
FAMILY & DUPLEX SALES VOLUME NO OF SALES AVG DAYS ON MARKET AVG SALE MEDIAN SALE 2018 $59,770,682 122 70 $489,924 $472,050 2019 $52,946,117 103 66 $514,040 $495,000 2020 $82,058,834 141 74 $581,978 $545,000 2021 $64,003,924 100 15 $640,039 $608,000 2022 $81,174,031 103 32 $788,097 $710,000
SINGLE
SALES VOLUME NO OF SALES AVG DAYS ON MARKET AVG SALE MEDIAN SALE 2018 $7,896,885 22 153 $358,949 $305,500 2019 $19,166,958 52 147 $368,595 $318,000 2020 $16,471,826 39 76 $422,355 $358,550 2021 $23,441,585 58 41 $404,165 $375,000 2022 $14,501,125 30 6 $483,371 $477,500
highlights
AREA
COMPARISON 2018 2019 2020 2021 2022 Single Family & Duplex $229 $234 $244 $309 $365 Condominium & Townhome $251 $292 $293 $321 $367 AVERAGE SALE / LAST LISTED PRICE Single Family & Duplex 100% Condominium & Townhome 102% SALES
over 2021
AVERAGE PRICE PER SQUARE FOOT SALE VS. LIST PRICE
VOLUME COMPARISON $731K averagesold price, a32%increase
$2.295M highest salefor a ranch SSFrepresented thebuyer&seller
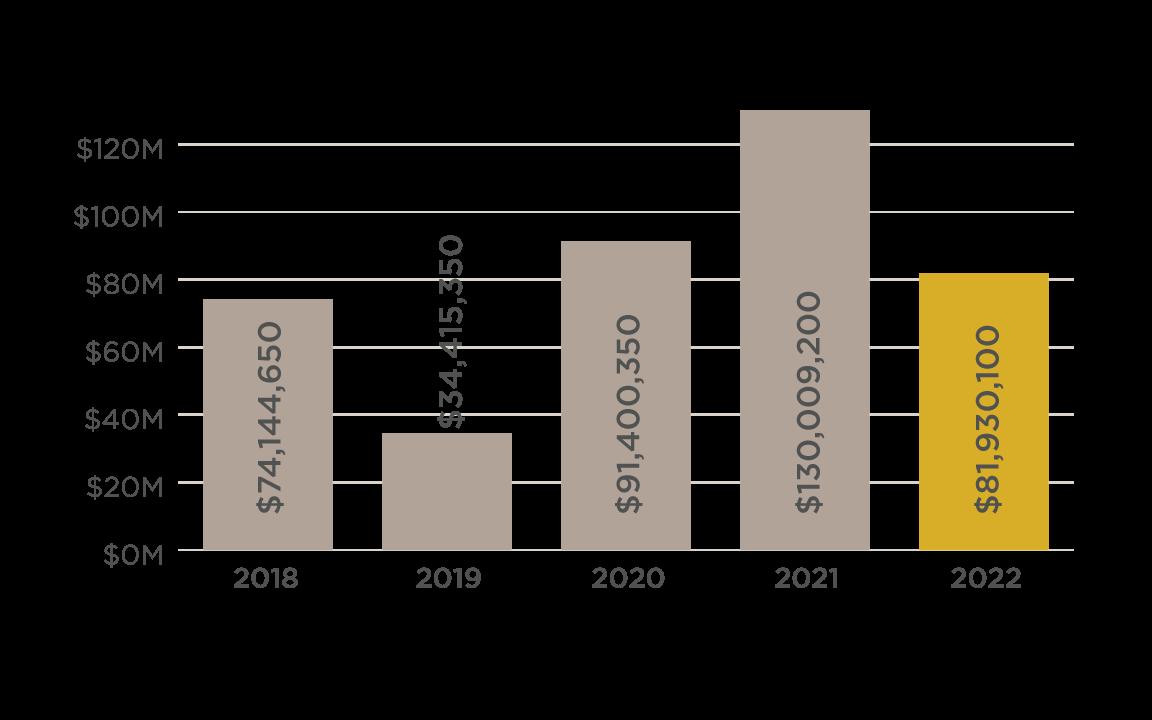
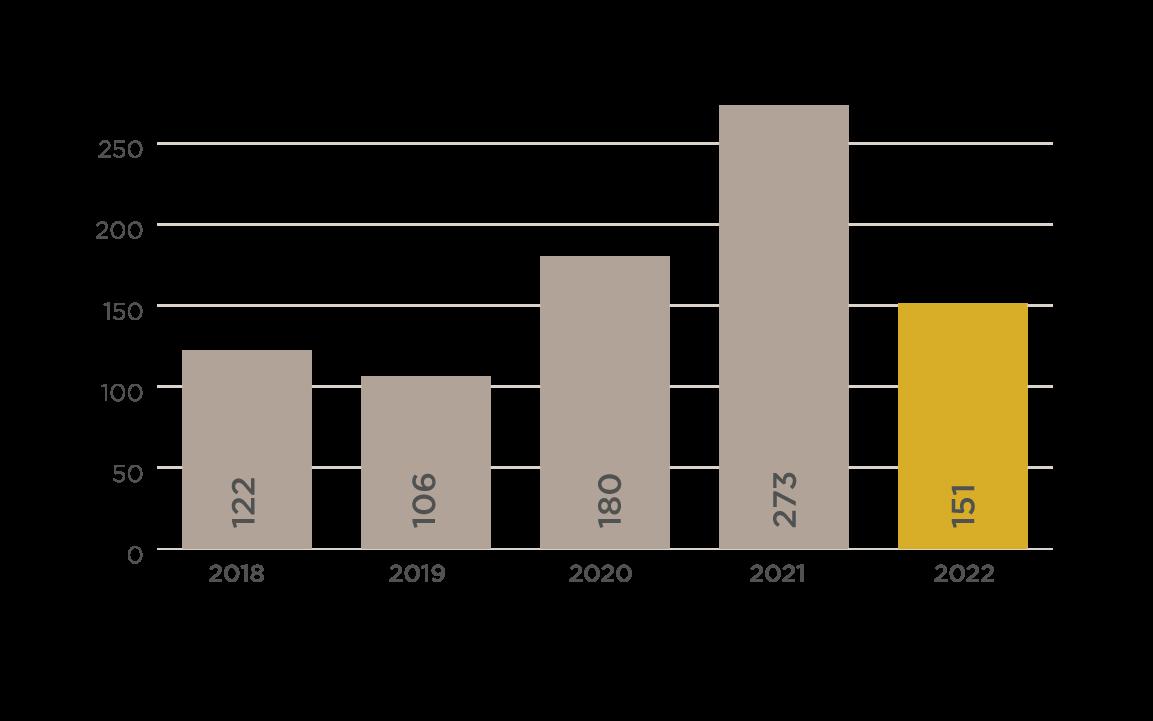
The Slifer Report 2023 | 29 LAND OVERVIEW LAND TRANSACTION VOLUME COMPARISON LAND SALES VOLUME COMPARISON SOURCE SoldlandpropertieswithinEagleCountyJanuary1,2022- December 31,2022 Sourceof all datainthisreport istheVail Boardof RealtorsMultiple ListingService Informationdeemedreliablebut not guaranteed
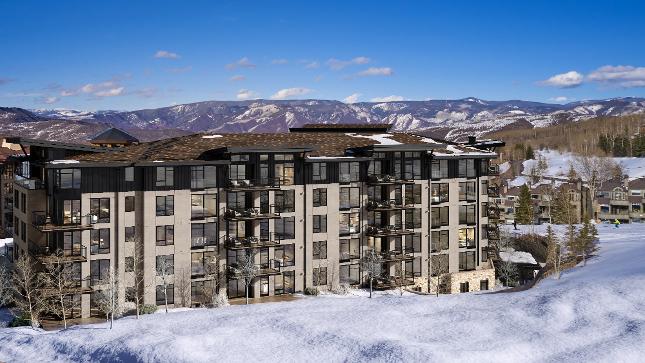
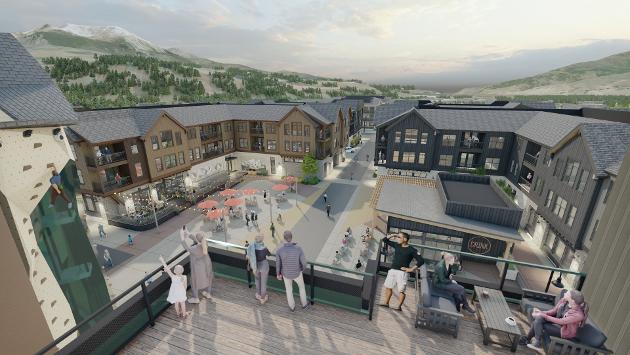
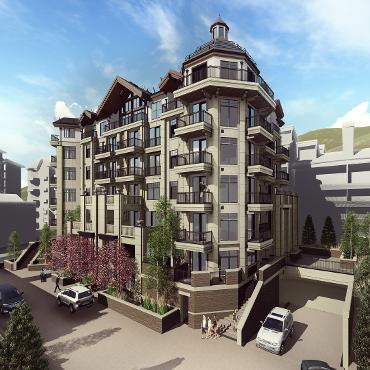
NEW DEVELOPMENT REVIEW
NEW DEVELOPMENT SPOTLIGHT
9 Projects launched in 20 22
Weareproudto betheonlybrokerageinColorado withafull divisiondedicated to bringingnewdevelopmentsto market.Our end-to-endservicecontinuedto deliver in 2022,creatingmorenewhomesinour communitiesthanever before Thisyear the divisioncelebratedover $1billion inclosed &pending salessinceit startedin2020.
20 0 + New homes delivered
| 30 AREA CLOSED VOLUME CONTRACTS CLOSED PENDING VOLUME PENDING CONTRACTS TOTAL VOLUME TOTAL CONTRACTS Roaring Fork Valley $1,339,500 17 $96,356,289 11 $97,695,789 28 Eagle County $31,720,000 8 $280,389,656 103 $312,109,656 111 Summit County $28,877,000 30 $208,649,400 126 $237,526,400 156 Denver - - $16,511,169 27 $16,511,169 27 Tot al $61,936,50 0 55 $60 1,90 6,514 267 $663,843,0 14 322
Slifer Smith & Frampton Real Estate
To learnmore,visit SliferDevelopmentSales com >>> $1B+
historic closed + pending sales LEGACY AT VAIL SQUARE Lionshead | Vail LegacyVail com IN HABITANCE Downtown Silverthorne LiveAtInhabitance.com CIRQUE X VICEROY Snowmass Base Village CirqueViceroy.com
Division
21 COUNTRIES 400 W ORLD-W IDE LOCATIONS
12,800 LUXURY EXPERTS
In 2022 the Forbes Global Properties network of brokerages continued to grow including here in Colorado as Slifer Smith & Frampton expanded to cover the Boulder Valley, we now proudly fly the Forbes flag from Aspen to the Front Range. Around the world the network added new brokerages in incrediblelocations,connectedexpert agents,and representedtheworld'sfinest homes
ForbesGlobalProperties.com >>>
F O R B E S G L O B A L P R O P E R T I E S I N 2 0 2 2

S TA Y U P T O D A T E ALL YEAR & V I E W O U R P R O P E R T I E S ANYTIME V A I L R E A L E S TA T E . C O M
