
Local Market Update
Associationof REALTORS®
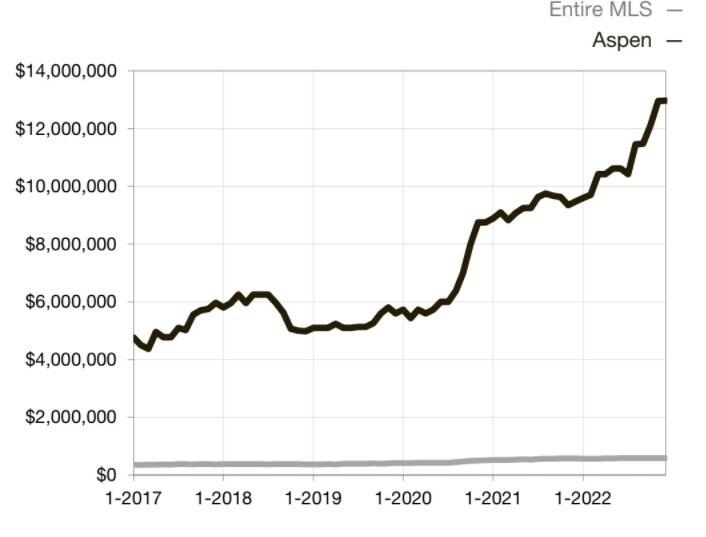
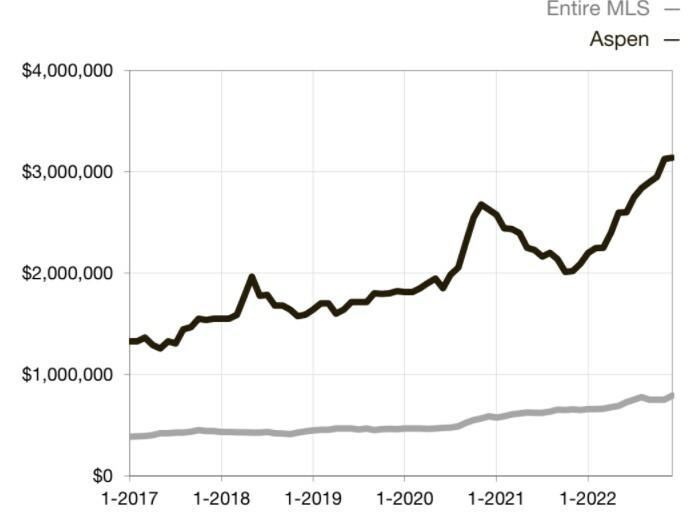
Aspen
of Realtors
2021 2022 % Change 2021 2022 % Change New Listings 9 9 0 0% 175 153 -12 6% Sold Listings 20 4 -80 0% 154 80 -48 1% Median Sales Price $8,950,000 $7,550,000 -15 6% $9,475,000 $12,975,000 +36 9% Average Sales Price $15,706,273 $9,025,000 -42 5% $12,219,436 $16,881,374 +38 2% %of List Price Received 95 0% 100 5% +5 8% 94 8% 95 4% +0 6% Days on Market 130 65 -50 0% 136 108 -20 6% Inventory of Homes for Sale 67 68 +1 5% -- -- -Months Supply of Inventory 5 2 10 2 +96 2% -- -- -December Year to Date 2021 2022 % Change 2021 2022 % Change New Listings 11 13 +18 2% 234 178 -23 9% Sold Listings 21 4 -81 0% 250 120 -52 0% Median Sales Price $2,600,000 $5,362,500 +106 3% $2,091,000 $3,137,500 +50 0% Average Sales Price $5,376,571 $9,543,750 +77 5% $3,129,674 $4,562,875 +45 8% %of List Price Received 99 4% 96 6% -2 8% 97 3% 97 5% +0 2% Days on Market 62 19 -69 4% 93 45 -51 6% Inventory of Homes for Sale 32 52 +62 5% -- -- -Months Supply of Inventory 1 5 5 2 +246 7% -- -- -December Year to Date Townhouse/ Condo Single Family Med ian Sales Pr ice- Sing le Fam ily Rolling 12-Month Calculation Med ian Sales Pr ice- Tow nho use/ Co nd o Rolling 12-Month Calculation Current asof January 5, 2023 All data from the Aspen/Glenwood SpringsMLSInc Report © 2022 ShowingTime
December 2022 Aresearchtool provided bytheColorado
and the
Board
ASPEN
December 2022
Local Market Update
2021 2022 % Change 2021 2022 % Change New Listings 3 2 -33 3% 74 70 -5 4% Sold Listings 9 1 -88 9% 76 34 -55 3% Median Sales Price $1,450,000 $2,000,000 +37 9% $1,472,500 $1,662,500 +12 9% Average Sales Price $1,830,556 $2,000,000 +9 3% $2,049,479 $2,055,647 +0 3% %of List Price Received 94 4% 95 3% +1 0% 95 9% 96 5% +0 6% Days on Market 107 46 -57 0% 110 53 -51 8% Inventory of Homes for Sale 15 14 -6 7% -- -- -Months Supply of Inventory 2 4 4 9 +104 2% -- -- -December Year to Date 2021 2022 % Change 2021 2022 % Change New Listings 21 2 -90 5% 123 99 -19 5% Sold Listings 3 1 -66 7% 85 78 -8 2% Median Sales Price $585,000 $855,000 +46 2% $714,000 $942,500 +32 0% Average Sales Price $596,667 $855,000 +43 3% $820,796 $1,160,089 +41 3% %of List Price Received 97 9% 95 5% -2 5% 99 6% 100 3% +0 7% Days on Market 50 28 -44 0% 44 32 -27 3% Inventory of Homes for Sale 30 26 -13 3% -- -- -Months Supply of Inventory 4 2 4 0 -4 8% -- -- -December Year to Date Townhouse/ Condo Single Family Med ian Sales Pr ice- Sing le Fam ily Rolling 12-Month Calculation Med ian Sales Pr ice- Tow nho use/ Co nd o Rolling 12-Month Calculation Current asof January 5, 2023 All data from the Aspen/Glenwood SpringsMLSInc Report © 2022 ShowingTime
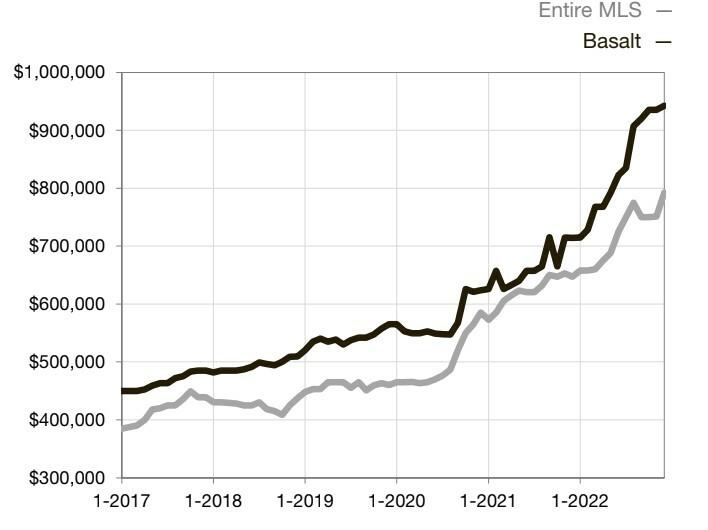
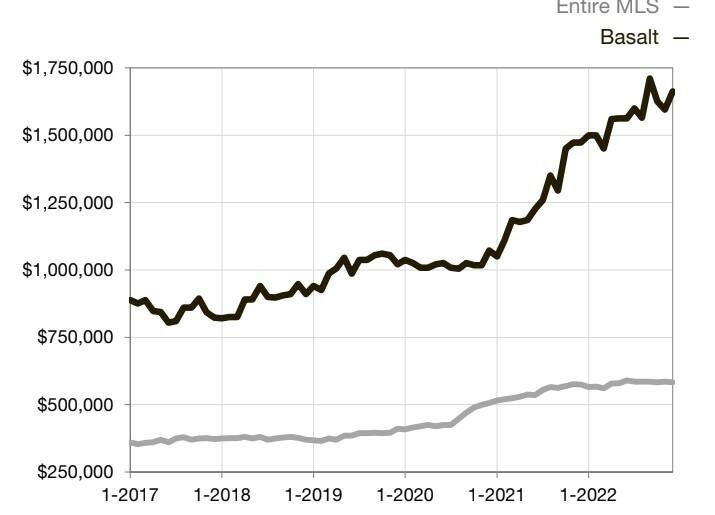
Aresearchtool provided bytheColorado Associationof REALTORS® and the Aspen Board of Realtors BASALT
provided bytheColorado Associationof REALTORS® and the Aspen Board of Realtors
2021 2022 % Change 2021 2022 % Change New Listings 7 10 +42 9% 200 190 -5 0% Sold Listings 14 7 -50 0% 181 122 -32 6% Median Sales Price $1,573,750 $960,000 -39 0% $1,425,000 $1,552,500 +8 9% Average Sales Price $1,889,148 $1,154,357 -38 9% $1,546,287 $1,826,720 +18 1% %of List Price Received 97 6% 96 1% -1 5% 98 0% 97 5% -0 5% Days on Market 87 50 -42 5% 57 73 +28 1% Inventory of Homes for 42 48 +14 3% -- -- -Months Supply of Inventory 2 8 4 7 +67 9% -- -- -December Year to Date 2021 2022 % Change 2021 2022 % Change New Listings 0 0 -- 84 71 -15 5% Sold Listings 9 4 -55 6% 105 64 -39 0% Median Sales Price $1,086,818 $951,600 -12 4% $650,000 $870,500 +33 9% Average Sales Price $1,119,499 $1,089,550 -2 7% $742,550 $998,176 +34 4% %of List Price Received 99 6% 91 7% -7 9% 100 0% 99 0% -1 0% Days on Market 15 83 +453 3% 52 49 -5 8% Inventory of Homes for Sale 4 13 +225 0% -- -- -Months Supply of Inventory 0 5 2 4 +380 0% -- -- -December Year to Date Townhouse/ Condo Single Family Med ian Sales Pr ice- Sing le Fam ily Rolling 12-Month Calculation Med ian Sales Pr ice- Tow nho use/ Co nd o Rolling 12-Month Calculation Current asof January 5, 2023 All data from the Aspen/Glenwood SpringsMLSInc Report © 2022 ShowingTime
Local Market Update December 2022 Aresearchtool
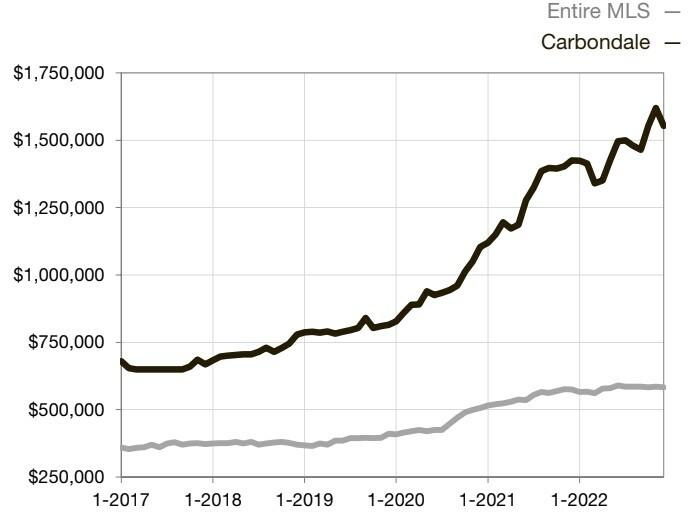
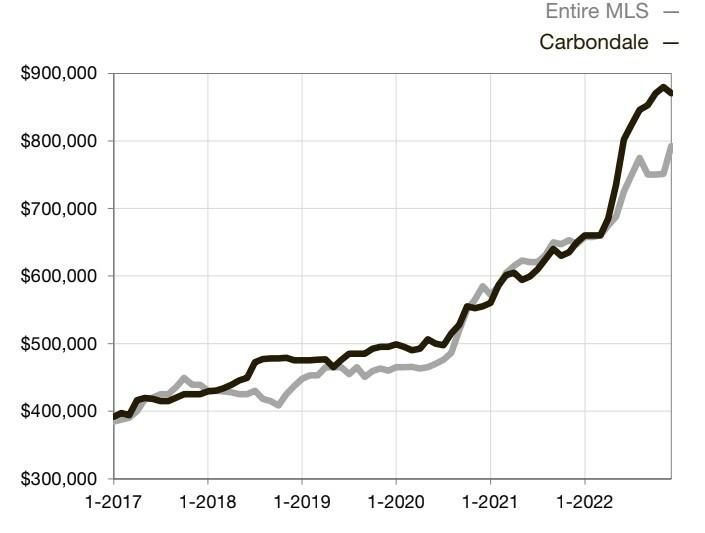
CARBONDALE
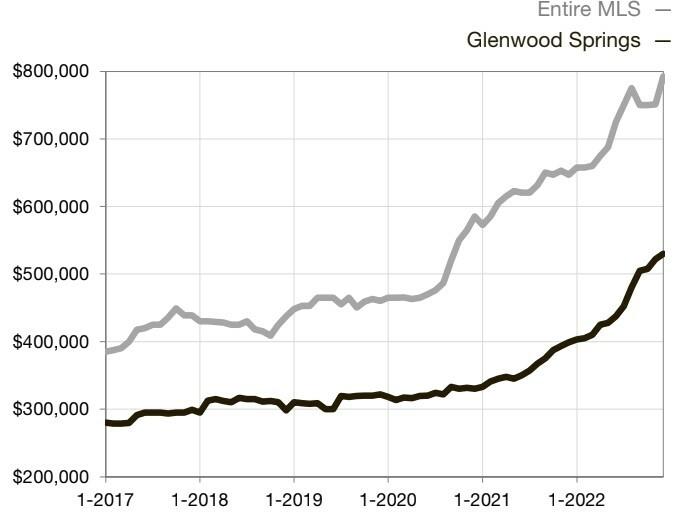
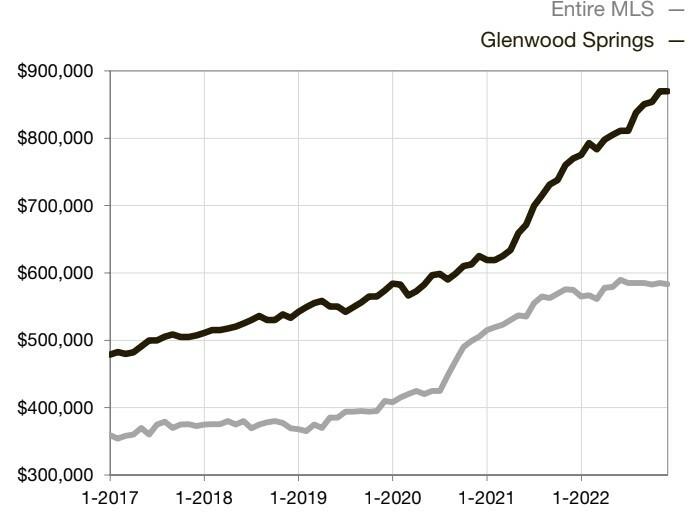
GLENW OOD SPRINGS
Local Market Update
provided bytheColorado Associationof REALTORS® and the Aspen Board of Realtors
December 2022 Aresearchtool
2021 2022 % Change 2021 2022 % Change New Listings 6 6 0 0% 233 203 -12 9% Sold Listings 13 8 -38 5% 222 161 -27 5% Median Sales Price $950,000 $1,012,500 +6 6% $770,000 $870,000 +13 0% Average Sales Price $888,507 $1,225,542 +37 9% $840,357 $981,817 +16 8% %of List Price Received 98 2% 93 8% -4 5% 99 2% 97 9% -1 3% Days on Market 50 63 +26 0% 37 50 +35 1% Inventory of Homes for Sale 30 31 +3 3% -- -- -Months Supply of Inventory 1 6 2 3 +43 8% -- -- -December Year to Date 2021 2022 % Change 2021 2022 % Change New Listings 6 5 -16 7% 102 85 -16 7% Sold Listings 14 1 -92 9% 96 85 -11 5% Median Sales Price $445,500 $458,000 +2 8% $398,675 $530,000 +32 9% Average Sales Price $448,036 $458,000 +2 2% $402,459 $531,225 +32 0% %of List Price Received 99 9% 100 0% +0 1% 100 1% 98 8% -1 3% Days on Market 121 8 -93 4% 38 56 +47 4% Inventory of Homes for Sale 12 11 -8 3% -- -- -Months Supply of Inventory 1 5 1 4 -6 7% -- -- -December Year to Date Townhouse/ Condo Single Family Med ian Sales Pr ice- Sing le Fam ily Rolling 12-Month Calculation Med ian Sales Pr ice- Tow nho use/ Co nd o Rolling 12-Month Calculation Current asof January 5, 2023 All data from the Aspen/Glenwood SpringsMLSInc Report © 2022 ShowingTime
Local Market Update
Aresearchtool provided bytheColorado Associationof REALTORS® and the Aspen Board of Realtors
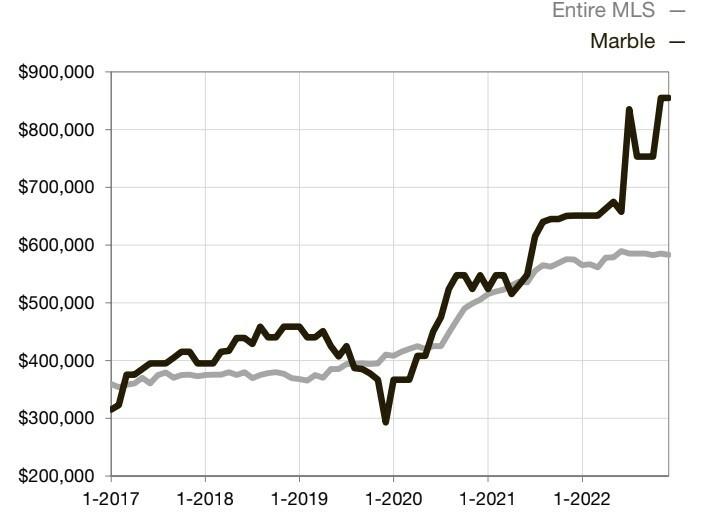
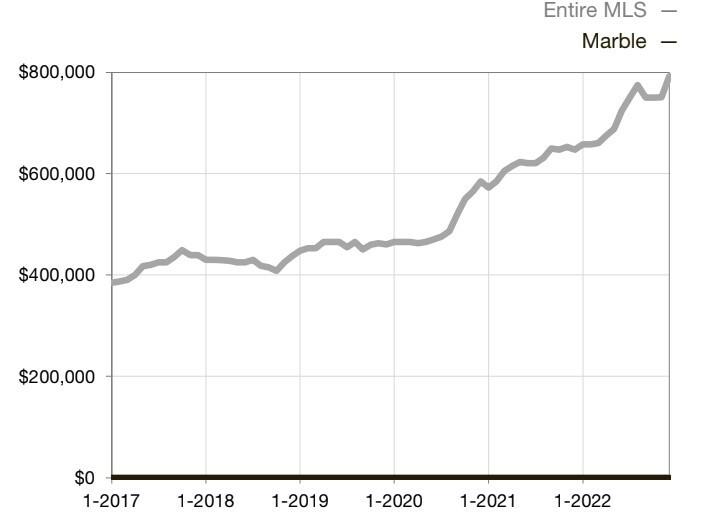
2021 2022 % Change 2021 2022 % Change New Listings 0 0 -- 6 4 -33 3% Sold Listings 0 0 -- 7 3 -57 1% Median Sales Price $0 $0 -- $651,000 $855,000 +31 3% Average Sales Price $0 $0 -- $708,000 $1,030,167 +45 5% %of List Price Received 0 0% 0 0% -- 99 8% 98 4% -1 4% Days on Market 0 0 -- 96 143 +49 0% Inventory of Homes for Sale 1 2 +100 0% -- -- -Months Supply of Inventory 0 9 1 3 +44 4% -- -- -December Year to Date 2021 2022 % Change 2021 2022 % Change New Listings 0 0 -- 0 0 -Sold Listings 0 0 -- 0 0 -Median Sales Price $0 $0 -- $0 $0 -Average Sales Price $0 $0 -- $0 $0 -%of List Price Received 0 0% 0 0% -- 0 0% 0 0% -Days on Market 0 0 -- 0 0 -Inventory of Homes for Sale 0 0 -- -- -- -Months Supply of Inventory 0 0 0 0 -- -- -- -December Year to Date Townhouse/ Condo Single Family Med ian Sales Pr ice- Sing le Fam ily Rolling 12-Month Calculation Med ian Sales Pr ice- Tow nho use/ Co nd o Rolling 12-Month Calculation Current asof January 5, 2023 All data from the Aspen/Glenwood SpringsMLSInc Report © 2022 ShowingTime
December 2022
MARBLE
Local Market Update December
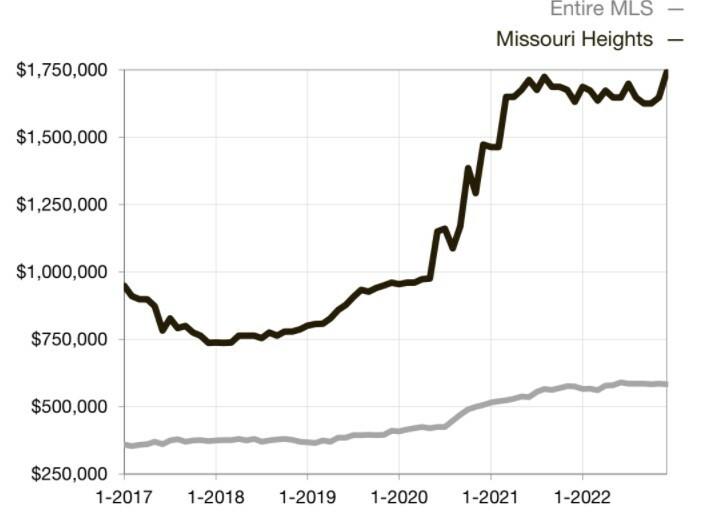
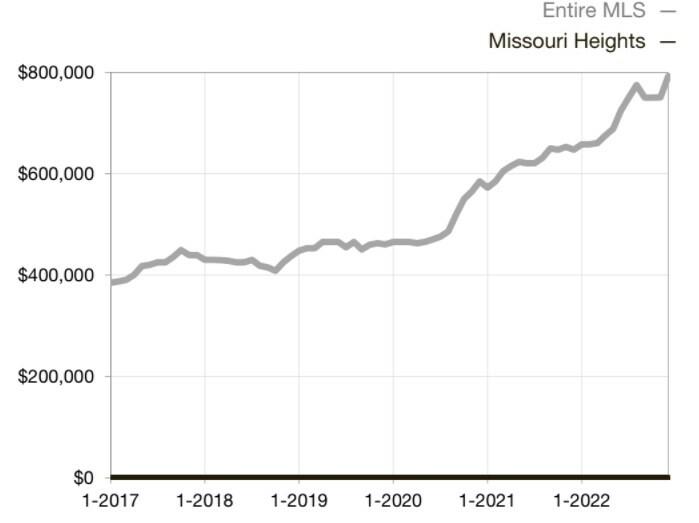
Aresearchtool provided bytheColorado Associationof REALTORS® and the Aspen Board of Realtors MISSOURI HEIGHTS 2021 2022 % Change 2021 2022 % Change New Listings 1 4 +300 0% 40 37 -7 5% Sold Listings 4 1 -75 0% 42 26 -38 1% Median Sales Price $1,573,750 $1,887,500 +19 9% $1,631,250 $1,742,500 +6 8% Average Sales Price $2,515,625 $1,887,500 -25 0% $1,859,383 $2,190,911 +17 8% %of List Price Received 92 8% 96 8% +4 3% 96 0% 97 4% +1 5% Days on Market 112 76 -32 1% 98 119 +21 4% Inventory of Homes for Sale 9 14 +55 6% -- -- -Months Supply of Inventory 2 6 5 4 +107 7% -- -- -December Year to Date 2021 2022 % Change 2021 2022 % Change New Listings 0 0 -- 0 0 -Sold Listings 0 0 -- 0 0 -Median Sales Price $0 $0 -- $0 $0 -Average Sales Price $0 $0 -- $0 $0 -%of List Price Received 0 0% 0 0% -- 0 0% 0 0 -Days on Market 0 0 -- 0 0 -Inventory of Homes for Sale 0 0 -- -- -- -Months Supply of Inventory 0 0 0 0 -- -- -- -December Year to Date Townhouse/ Condo Single Family Med ian Sales Pr ice- Sing le Fam ily Rolling 12-Month Calculation Med ian Sales Pr ice- Tow nho use/ Co nd o Rolling 12-Month Calculation Current asof January 5, 2023 All data from the Aspen/Glenwood SpringsMLSInc Report © 2022 ShowingTime
2022
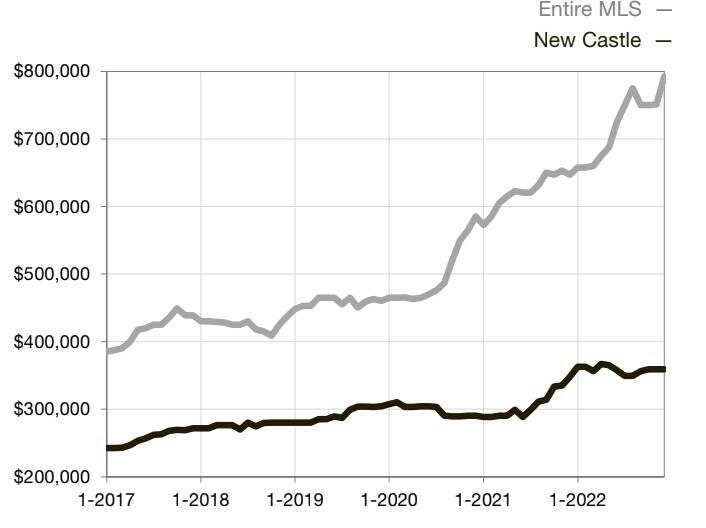
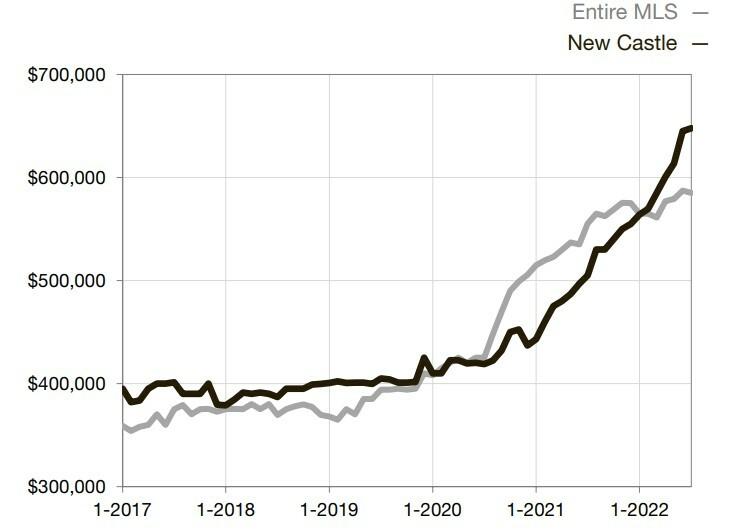
NEW CASTLE
Local Market Update
provided bytheColorado Associationof REALTORS® and the Aspen Board of Realtors
December 2022 Aresearchtool
2021 2022 % Change 2021 2022 % Change New Listings 2 3 +50 0% 111 92 -17 1% Sold Listings 11 2 -81 8% 107 85 -20 6% Median Sales Price $585,000 $505,000 -13 7% $555,000 $655,000 +18 0% Average Sales Price $589,636 $505,000 -14 4% $586,321 $658,484 +12 3% %of List Price Received 99 2% 84 3% -15 0% 99 0% 98 4% -0 6% Days on Market 43 55 +27 9% 38 33 -13 2% Inventory of Homes for Sale 8 15 +87 5% -- -- -Months Supply of Inventory 0 9 2 1 +133 3% -- -- -December Year to Date 2021 2022 % Change 2021 2022 % Change New Listings 9 0 -100 0% 70 53 -24 3% Sold Listings 4 0 -100 0% 64 51 -20 3% Median Sales Price $361,500 $0 -100 0% $348,000 $359,000 +3 2% Average Sales Price $371,616 $0 -100 0% $349,087 $398,884 +14 3% %of List Price Received 99 1% 0 0% -100 0%% 100 3% 100 7% +0 4% Days on Market 28 0 -100 0% 17 13 -23 5% Inventory of Homes for Sale 13 8 -38 5% -- -- -Months Supply of Inventory 2 4 1 6 -33 3% -- -- -December Year to Date Townhouse/ Condo Single Family Med ian Sales Pr ice- Sing le Fam ily Rolling 12-Month Calculation Med ian Sales Pr ice- Tow nho use/ Co nd o Rolling 12-Month Calculation Current asof January 5, 2023 All data from the Aspen/Glenwood SpringsMLSInc Report © 2022 ShowingTime
December 2022
Aresearchtool provided bytheColorado Associationof REALTORS® and the Aspen Board of Realtors
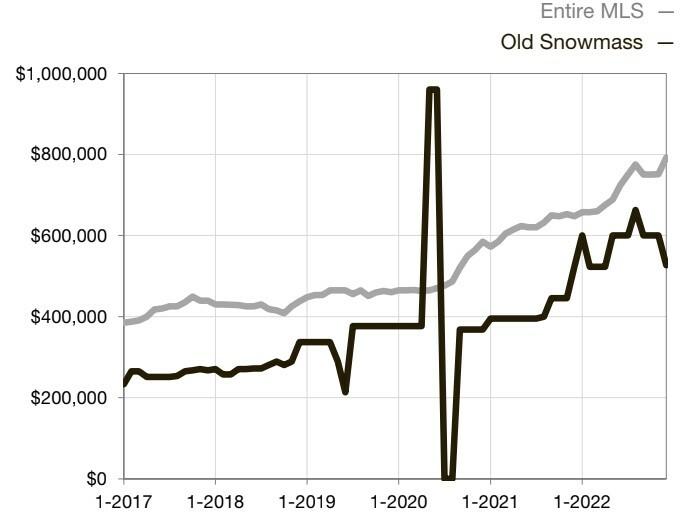
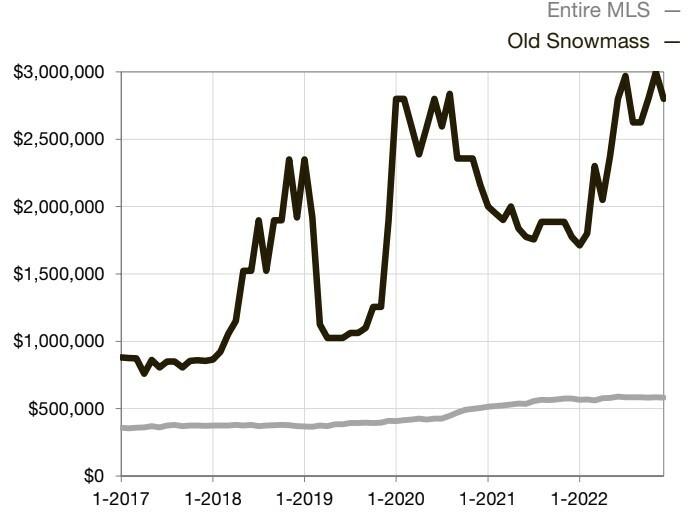
OLD SNOW MASS
Local Market Update
2021 2022 % Change 2021 2022 % Change New Listings 1 5 +400 0% 28 27 -3 6% Sold Listings 3 0 -100 0% 25 21 -16 0% Median Sales Price $3,250,000 $0 -100 0% $1,775,000 $2,800,000 +57 7% Average Sales Price $3,050,000 $0 -100 0% $3,213,370 $6,081,483 +89 3% %of List Price Received 91 0% 0 0% -100 0% 95 4% 95 2% -0 2% Days on Market 279 0 -100 0% 109 77 -29 4% Inventory of Homes for Sale 6 8 +33 3% -- -- -Months Supply of Inventory 2 9 3 8 +31 0% -- -- -December Year to Date 2021 2022 % Change 2021 2022 % Change New Listings 0 0 -- 3 1 -66 7% Sold Listings 1 0 -100 0% 4 2 -50 0% Median Sales Price $600,000 $0 -100 0% $522,500 $526,725 +0 8% Average Sales Price $600,000 $0 -100 0% $906,250 $526,725 -41 9% %of List Price Received 92 3% 0 0% -100 0% 96 3% 99 7% +3 5% Days on Market 108 0 -100 0% 82 149 +81 7% Inventory of Homes for Sale 0 0 -- -- -- -Months Supply of Inventory 0 0 0 0 -- -- -- -December Year to Date Townhouse/ Condo Single Family Med ian Sales Pr ice- Sing le Fam ily Rolling 12-Month Calculation Med ian Sales Pr ice- Tow nho use/ Co nd o Rolling 12-Month Calculation Current asof January 5, 2023 All data from the Aspen/Glenwood SpringsMLSInc Report © 2022 ShowingTime
December 2022 Aresearchtool
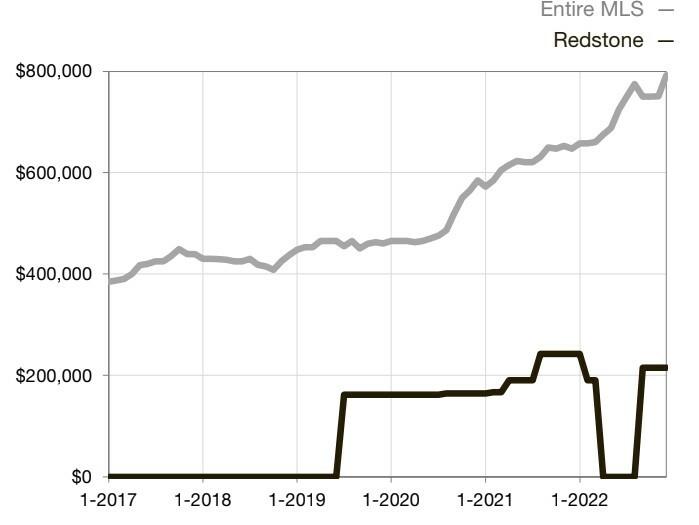
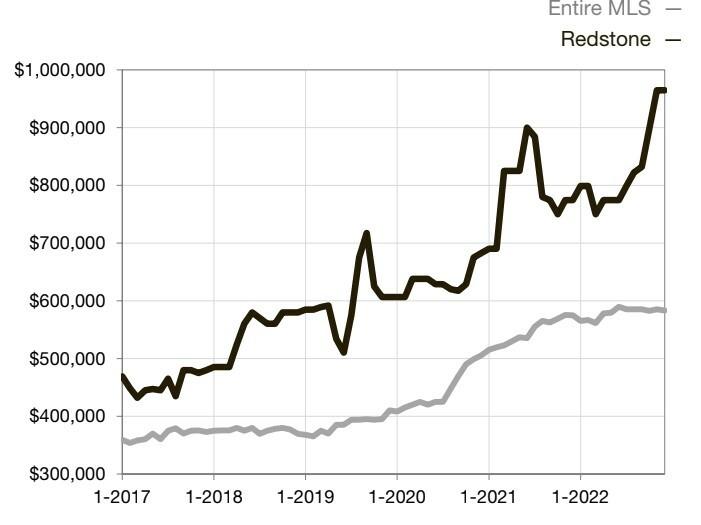
REDSTONE
Local Market Update
provided bytheColorado Associationof REALTORS® and the Aspen Board of Realtors
2021 2022 % Change 2021 2022 % Change New Listings 0 0 -- 23 11 -52 2% Sold Listings 1 1 0 0% 24 9 -62 5% Median Sales Price $1,575,000 $6,000,000 +281 0% $774,500 $965,000 +24 6% Average Sales Price $1,575,000 $6,000,000 +281 0% $926,906 $2,724,222 +193 9% %of List Price Received 93 8% 85 8% -8 5% 94 6% 94 7% +0 1% Days on Market 231 125 -45 9% 45 146 +224 4% Inventory of Homes for Sale 4 1 -75 0% -- -- -Months Supply of Inventory 1 7 0 6 -64 7% -- -- -December Year to Date 2021 2022 % Change 2021 2022 % Change New Listings 0 0 -- 2 4 +100 0% Sold Listings 0 0 -- 2 1 -50 0% Median Sales Price $0 $0 -- $242,500 $215,000 -11 3% Average Sales Price $0 $0 -- $242,500 $215,000 -11 3% %of List Price Received 0 0% 0 0% -- 100 2% 104 9% +4 7% Days on Market 0 0 -- 6 3 -50 0% Inventory of Homes for Sale 0 0 -- -- -- -Months Supply of Inventory 0 0 0 0 -- -- -- -December Year to Date Townhouse/ Condo Single Family Med ian Sales Pr ice- Sing le Fam ily Rolling 12-Month Calculation Med ian Sales Pr ice- Tow nho use/ Co nd o Rolling 12-Month Calculation Current asof January 5, 2023 All data from the Aspen/Glenwood SpringsMLSInc Report © 2022 ShowingTime
RIFLE
Local Market Update
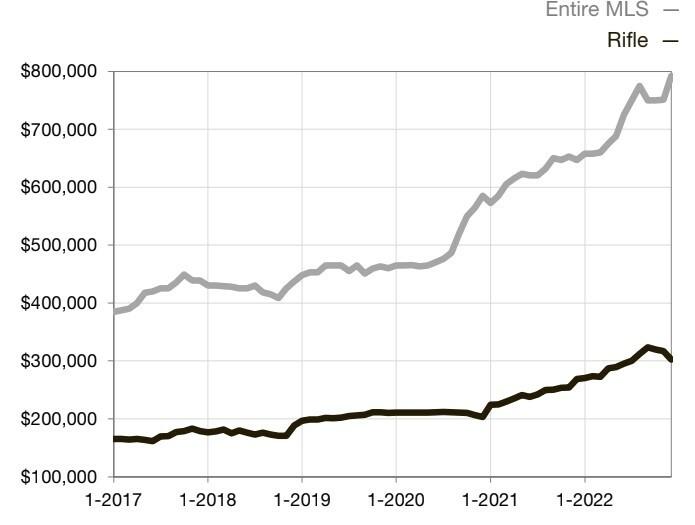
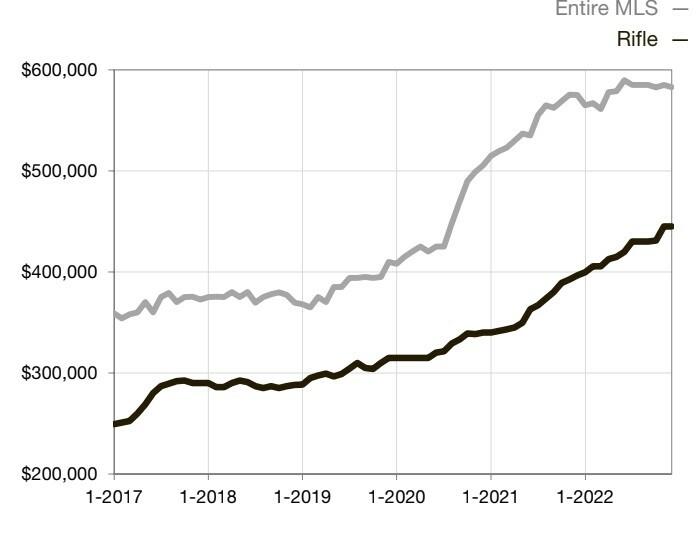
December 2022
Aresearchtool provided bytheColorado Associationof REALTORS® and the Aspen Board of Realtors
2021 2022 % Change 2021 2022 % Change New Listings 11 8 -27 3% 250 164 -34 4% Sold Listings 23 14 -39 1% 220 155 -29 5% Median Sales Price $399,000 $434,500 +8 9% $396,500 $445,000 +12 2% Average Sales Price $457,529 $430,393 -5 9% $419,924 $481,363 +14 6% %of List Price Received 98 0% 97 6% -0 4% 99 0% 98 6% -0 4% Days on Market 53 80 +50 9% 41 38 -7 3% Inventory of Homes for 26 18 -30 8% -- -- -Months Supply of 1 4 1 4 0 0% -- -- -December Year to Date 2021 2022 % Change 2021 2022 % Change New Listings 3 1 -66 7% 72 36 -50 0% Sold Listings 10 1 -90 0% 86 37 -57 0% Median Sales Price $323,750 $385,000 +18 9% $268,500 $302,500 +12 7% Average Sales Price $322,915 $385,000 +19 2% $266,803 $280,959 +5 3% %of List Price Received 100 0% 101 3% +1 3% 100 4% 99 8% -0 6% Days on Market 149 92 -38 3% 59 51 -13 6% Inventory of Homes for Sale 3 1 -66 7% -- -- -Months Supply of Inventory 0 4 0 3 -25 0% -- -- -December Year to Date Townhouse/ Condo Single Family Med ian Sales Pr ice- Sing le Fam ily Rolling 12-Month Calculation Med ian Sales Pr ice- Tow nho use/ Co nd o Rolling 12-Month Calculation Current asof January 5, 2023 All data from the Aspen/Glenwood SpringsMLSInc Report © 2022 ShowingTime
Local Market Update
December 2022
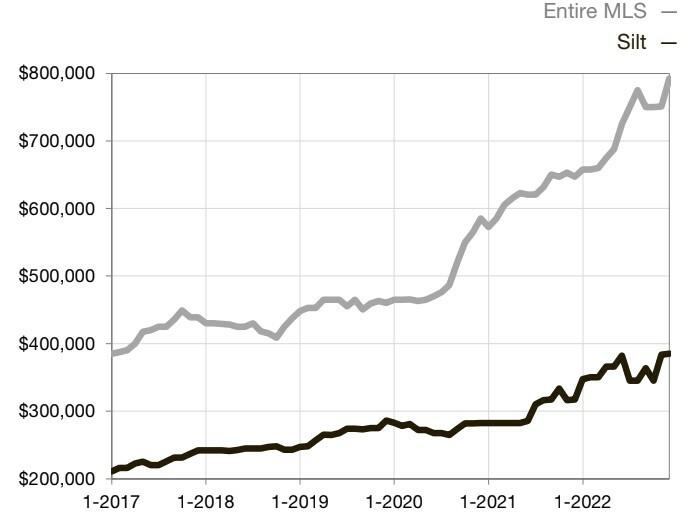
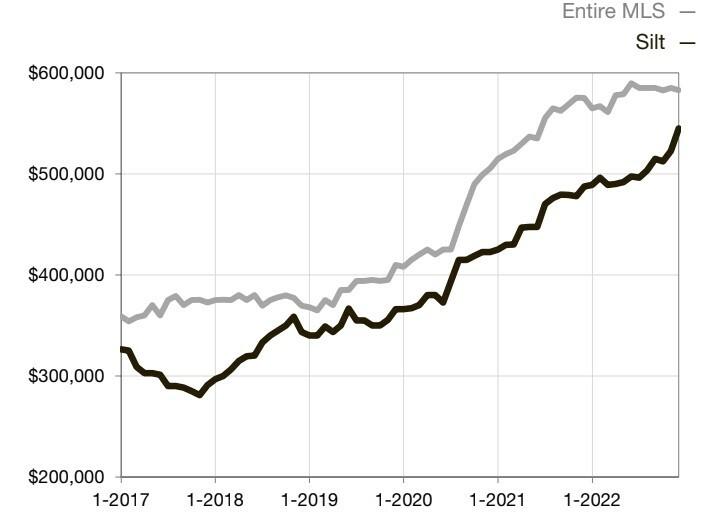
2021 2022 % Change 2021 2022 % Change New Listings 1 2 +100 0% 120 91 -24 2% Sold Listings 12 5 -58 3% 101 77 -23 8% Median Sales Price $493,250 $610,000 +23 7% $487,500 $545,000 +11 8% Average Sales Price $587,542 $623,450 +6 1% $514,580 $559,974 +8 8% %of List Price Received 98 3% 94 9% -3 5% 98 8% 98 3% -0 5% Days on Market 39 156 +300 0% 42 49 +16 7% Inventory of Homes for Sale 16 13 -18 8% -- -- -Months Supply of Inventory 1 9 2 0 +5 3% -- -- -December Year to Date 2021 2022 % Change 2021 2022 % Change New Listings 2 0 -100 0% 12 13 +8 3% Sold Listings 1 0 -100 0% 11 11 0 0% Median Sales Price $310,000 $0 -100 0% $317,000 $385,000 +21 5% Average Sales Price $310,000 $0 -100 0% $331,909 $354,091 +6 7% %of List Price Received 100 0% 0 0% -100 0% 100 4% 98 8% -1 6% Days on Market 1 0 -100 0% 22 24 +9 1% Inventory of Homes for Sale 1 0 -100 0% -- -- -Months Supply of Inventory 0 5 0 0 -100 0% -- -- -December Year to Date Townhouse/ Condo Single Family Med ian Sales Pr ice- Sing le Fam ily Rolling 12-Month Calculation Med ian Sales Pr ice- Tow nho use/ Co nd o Rolling 12-Month Calculation Current asof January 5, 2023 All data from the Aspen/Glenwood SpringsMLSInc Report © 2022 ShowingTime
Aresearchtool provided bytheColorado Associationof REALTORS® and the Aspen Board of Realtors SILT
Aresearchtool provided bytheColorado Associationof REALTORS® and the Aspen Board of Realtors
SNOW MASS VILLAGE
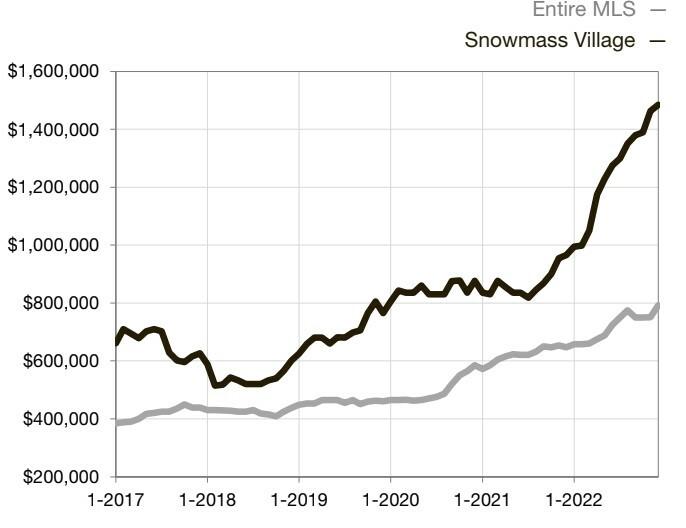
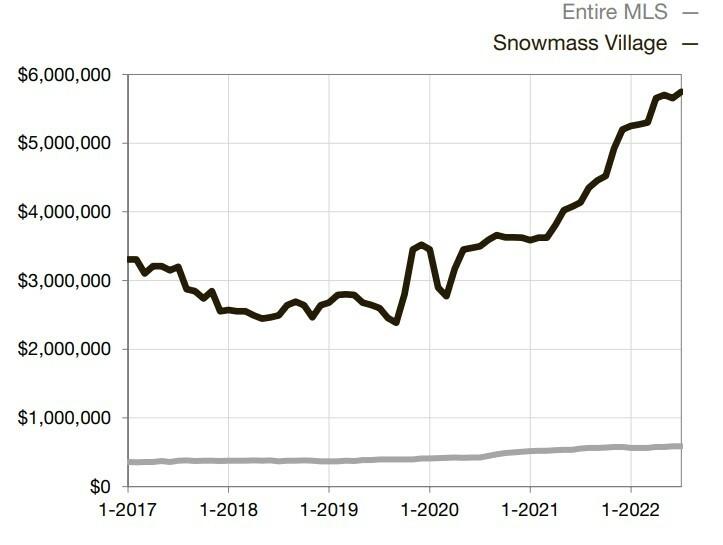
Local Market Update December 2022
2021 2022 % Change 2021 2022 % Change New Listings 3 4 +33 3% 65 53 -18 5% Sold Listings 5 0 -100 0% 73 33 -54 8% Median Sales Price $5,700,000 $0 -100 0% $5,200,000 $6,272,500 +20 6% Average Sales Price $5,285,000 $0 -100 0% $5,437,514 $7,265,287 +33 6% %of List Price Received 96 2% 0 0% -100 0% 96 5% 95 6% -0 9% Days on Market 59 0 -100 0% 140 110 -21 4% Inventory of Homes for Sale 11 18 +63 6% -- -- -Months Supply of Inventory 1 8 5 5 +205 6% -- -- -December Year to Date 2021 2022 % Change 2021 2022 % Change New Listings 7 55 +685 7% 266 219 -17 7% Sold Listings 14 6 -57 1% 243 118 -51 4% Median Sales Price $1,307,000 $1,600,000 +22 4% $965,000 $1,485,000 +53 9% Average Sales Price $1,840,500 $2,433,333 +32 2% $1,438,090 $2,036,726 +41 6% %of List Price Received 98 7% 93 2% -5 6% 97 9% 97 2% -0 7% Days on Market 35 134 +282 9% 90 46 -48 9% Inventory of Homes for Sale 19 88 +363 2% -- -- -Months Supply of Inventory 0 9 8 9 +888 9% -- -- -December Year to Date Townhouse/ Condo Single Family Med ian Sales Pr ice- Sing le Fam ily Rolling 12-Month Calculation Med ian Sales Pr ice- Tow nho use/ Co nd o Rolling 12-Month Calculation Current asof January 5, 2023 All data from the Aspen/Glenwood SpringsMLSInc Report © 2022 ShowingTime
W OODY CREEK
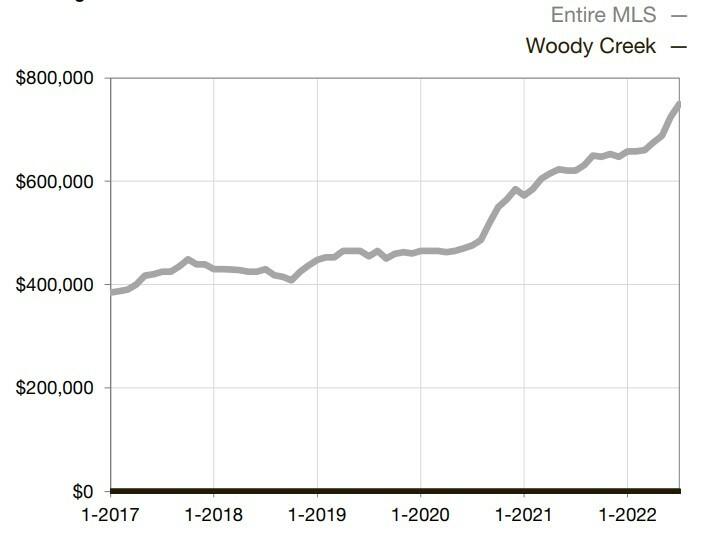
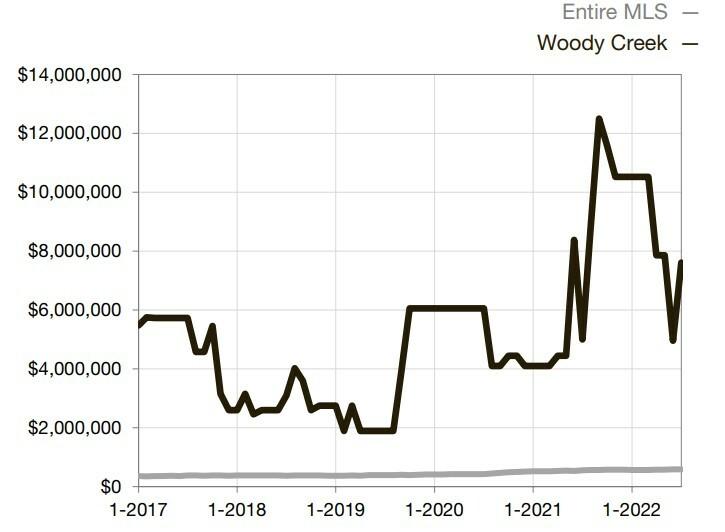
Local
Update
Aresearchtool provided bytheColorado Associationof REALTORS® and the Aspen Board of Realtors
Market
December 2022
2021 2022 % Change 2021 2022 % Change New Listings 0 0 -- 11 12 +9 1% Sold Listings 0 0 -100 0% 11 0 -100 0% Median Sales Price $3,730,000 $0 -100 0% $10,525,000 $0 -100 0% Average Sales Price $3,730,000 $0 -100 0% $11,579,545 $0 -100 0% %of List Price Received 99 5% 0 0% -100 0% 96 7% 0 0% -100 0% Days on Market 128 0 -100 0% 187 0 -100 0%Inventory of Homes for Sale 4 0 -100 0% -- -- -Months Supply of Inventory 2 9 0 0 -100 0% -- -- -December Year to Date 2021 2022 % Change 2021 2022 % Change New Listings 0 0 -- 0 0 -Sold Listings 0 0 -- 0 0 -Median Sales Price $0 $0 -- $0 $0 -Average Sales Price $0 $0 -- $0 $0 -%of List Price Received 0 0% 0 0% -- 0 0% 0 0% -Days on Market 0 0 -- 0 0 -Inventory of Homes for Sale 0 0 -- -- -- -Months Supply of Inventory 0 0 0 0 -- -- -- -December Year to Date Townhouse/ Condo Single Family Med ian Sales Pr ice- Sing le Fam ily Rolling 12-Month Calculation Med ian Sales Pr ice- Tow nho use/ Co nd o Rolling 12-Month Calculation Current asof January 5, 2023 All data from the Aspen/Glenwood SpringsMLSInc Report © 2022 ShowingTime
