4 minute read
8.3 INDEX CALCULATION
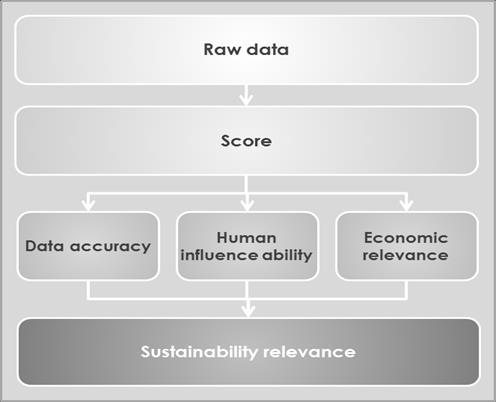
The raw data consist of numerical values. While values can be ranked against each other, they cannot be compared or added to other values (two apples plus three oranges are not equal to five pineapples). It is therefore necessary to extract a scalable and comparable score from the raw data as a first step.
When comparing raw data of variables of different countries, an “absolute best” cannot be defined. Scores therefore cannot be calculated against a real or calculated best score. For the purpose of this index, the raw data was analysed and ranked for each indicator individually. Trough calculation of the average deviation, the best performing 5% receive the highest score (100), and the lowest 5% receive the lowest possible score (0). Scores between the highest and the lowest 5% are linearly assigned relative to the best 5% and the worst 5%.
Advertisement
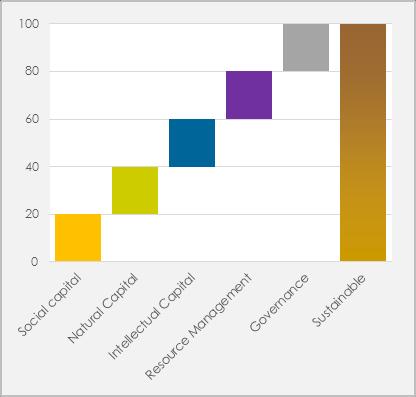
In a second step, the relative importance (weight) of the indicator is assessed against other indicators to calculate scores for the 5 sub-indexes. The Sustainable Competitiveness Index is calculated based on the sub-indexes, each weighted equally.
Data in perspective
Raw data has to be analysed in perspective: 5000 ha of forest might be a large area for a country like Andorra, but it is a small area in China. Depending on the indicator, the denominator might be the land area, the size of the population, or intensity measurements, e.g. GDP. For certain indicators, (e.g. energy efficiency, but also innovation indicators), the performance is evaluated against two denominators (normally population size and GDP) in order to gain a more altruistic picture of the national sustainability performance that incorporates economic and human efficiency.
Trend analysis: Integrating recent developments
Current data limits the perspective to a momentary picture in time. However, the momentary status is not sufficient to gain a true picture of the sustainable competitiveness, which is, by definition, forward-looking. Of equal importance are therefore the trend developments. Analysing trends and developments allow for understanding of where a country is coming from –and, more importantly - indicates the direction of future developments. Increasing agricultural efficiency, for example, indicates a country's capability to feed an increasing population in the future, or the opposite if the trends are decreasing. Where sufficient data series are available, the trend was calculated for the latest 5 years available and scored to evaluate the current level as well as the future outlook and sustainability potential of a country based on recent developments.
Calculating scores from raw data
Each level of the Sustainable Competitiveness Pyramid is equally important and therefore equally weighted

In order to reflect a dynamic performance picture, performance trends are analysed, scored and integrated in the Sustainable Competitiveness Index

D a t a S o u r c e s
Over 90% of the sustainable competitiveness indicators are purely quantitative performance indicators. Data sources were chosen according to reliability and availability of global data. The largest percentage of indicators was derived from the World Bank’s indicator database, followed by data sets and indicators provided by various UN agencies. Index calculation
Data reliability & accuracy
The accuracy of the index relies on the accuracy of the underlying data. Given the many individual and agencies involved in data collected around the World, it cannot be excluded that some of the data is not completely accurate. Data sources chosen for this Index (World Bank, UN agencies, OECD, IEA) are considered reasonably reliable. Raw data from the various databases was used as a basis for calculation as-is, i.e. without verifying the actual data.
L i m i t a t i o n s of q u a n t it a t i v e a n a l y s i s
In order to exclude subjectivity, only quantitative data has been taken into account. However, quantitative indicators sometimes are not able to differentiate or express real and actual levels of quality. High spending on health care for example does not necessarily guarantee high quality health care system available for the average citizen. Equally, the percentage of school enrolment (on all levels, form primary levels to college and universities) is not necessarily an expression of the quality of the education. However, for some indicators, quality is equally important to quantity from a sustainability viewpoint. For such indicators, quantitative indicators have limited informative value and serve as a proxy.
While explanatory power of quantitative indicators is limited, conducting a qualitative evaluation of the indicators used on the global level would go far beyond the limitations of this index. For indicators with a potentially low correlation between quantity and quality, the weighting has been adjusted accordingly. In order to integrate some qualitative aspects, results of global surveys have been included, e.g. for the quality of public services, or perceived life satisfaction.
T i m e f r a m e o f d a t a u s e d
The Sustainable Competitiveness Index 2020 is based on the latest available data. For most data series, the latest data available dates 2019. Where 2019 data is not available, the latest available data pint is used.
A v a i l a b i l i t y of d a t a
For some indicators data is not available for all countries (in particular for the less or least developed economies). If non-available data points would be converted to a 0 (zero) score, the rankings would be distorted. In order to present a balanced overall picture, the missing data points from those countries have been replaced with calculated values, extrapolated based on regional averages, income and development levels, as well as geographical features and climatic averages.


