17 minute read
Unprecedented Price Crash: What Happened?


By: Ken Rice Adjunct Professor South Texas College of Law Houston
Although the oil and gas industry has seen significant price volatility since the seventies, never before have we seen the level of volatility as experienced earlier this year. Not only did the crude price crash, but for the first time in history, crude futures for West Texas Intermediate (WTI) went negative, meaning that sellers of crude were actually willing to pay buyers to take future deliveries of the product. What caused this unprecedented event? What were the series of events culminating in the widest crude price swings and most severe price crash in the history of the industry? This article addresses those questions.
Advertisement
Overview
At the macro level, the price crash of early 2020 was caused by two primary factors. The first was the spread of the COVID-19 virus, which had huge negative impacts on the global economy and demand for hydrocarbons. Governmental responses around the world resulted in significant oil and gas demand destruction as governments took measures to slow the spread of the disease. These measures included shelter-in-place requirements for many countries, the closing of businesses and other non-essential sectors of the economy, and the halting of international travel.1 Although the effectiveness of these measures in preventing the spread of the disease varies from country to country and is the subject of some debate, there is general acceptance that these preventive measures taken by governments, while successfully stemming the spread of the disease, drastically reduced the level of global demand for crude. This drop in demand put unprecedented downward pressure on the price of oil.
The second factor greatly contributing to the price crash was the brief price war that emerged between two members of the Organization of the Petroleum Exporting Countries organization (OPEC+): Saudi Arabia and Russia. In March of 2020, Russia refused to agree to additional production cuts requested by OPEC. Saudi Arabia responded by reducing their price to Asian buyers and announcing that crude production would be increased from just under ten million barrels per day to over twelve million barrels per day, putting additional downward pressure on the price of crude.2 Eventually, the members of OPEC+ were able to reach agreement on production cuts and stabilize supply levels, but this initial disagreement greatly contributed to the price crash.
Evolution of Covid-19
The first cases of COVID-19 were reported in December of 2019, in Wuhan, China.3 Within the next few weeks, the disease spread to other parts of China, due mainly to the size and transient nature of the Wuhan population. The Chinese government attempted to prevent the spread of COVID-19 by imposing a mandatory quarantine in Wuhan on January 23, 2020, but by that time, millions of residents had already left the city. Within a month from the first reported case, the virus had spread to several other countries, including Italy, the United States, and Germany.4 On January 22, 2020, the World Health Organization (WHO) Director General convened the WHO Emergency Committee to discuss whether to declare the outbreak in China as a public health emergency of international concern. The committee members could not reach a consensus at that meeting and requested to reconvene ten days later after further information gathering and additional consideration of the
matter. After a WHO delegation traveled to China on January 28, 2020, the WHO Emergency Committee reconvened on January 30, 2020, and the Director-General, on the recommendation of the EC, declared the novel COVID-19 outbreak (2019-nCoV) a Public Health Emergency of International Concern (PHEIC).5 Approximately five weeks later, the WHO declared the virus a global pandemic.
The impact of COVID-19 on the global economy cannot be overstated. The virus spread rapidly and had an unprecedented impact on the major economies of the world, many of which are members of the OECD. The table below depicts currently the ten most affected countries with the highest number of cases to date and includes the date of the first known case in each country:6
Although cases continue to rise and appear to have accelerated in certain countries recently, the mitigative measures governments implemented earlier this year were effective in slowing the spread of the disease, at least until recently. The following section describes the impact that these governmental mitigative measures have had on global hydrocarbon demand.
Country7 Confirmed
Cases Cumulative Deaths Date first case reported8
United States 9,868,389 236,042 1/21/2020
India 8,591,730 127,059 1/29/2020
Brazil 5,664,115 162,802 2/25/2020
France 1,857,309 41,062 1/23/2020
Russia 1,802,762 30,899 1/30/2020
Spain 1,381,218 39,345 1/31/2020
Argentina 1,262,476 34,183 3/2/2020
UK 1,237,198 49,861 1/30/2020
Colombia 1,155,356 33,128 3/5/2020
Italy 995,463 42,330 1/30/220
Mexico 967,825 95,027 2/28/2020 9
Global demand for hydrocarbons
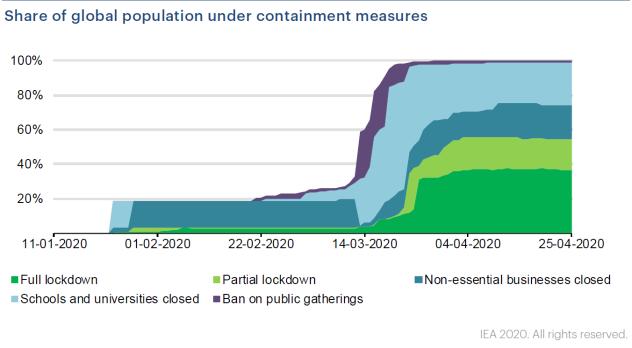
As the virus continued to spread throughout the world earlier this year, governments began to enforce various restrictions on the movement of people and social interactions. These measures include, among other things, complete or partial lockdowns, curfews, closings of schools and nonessential businesses, and bans on public gatherings with large groups of people.10 These restrictions significantly reduced demand for energy as they were implemented. Demand for jet fuel collapsed due to international travel restrictions. Demand for gasoline and other petroleum-based fuels used for transportation declined severely, causing unprecedented market imbalances between crude demand and crude supply. The International Energy Agency’s Global Energy Review 2020 captures the impact of COVID-19 on energy demand in general and crude demand in particular. In the period of a single month, between mid-March and mid-April, the global share of energy use impacted by governmental restrictions increased from 5% to 50%. Further, the IEA’s analysis indicates that countries with complete lockdown measures in place faced an average 25% weekly decrease in energy demand, while countries with partial lockdowns averaged an 18% weekly decline in energy demand.11 Overall, during the first quarter of 2020, global energy demand declined by just under 4% due to governmental actions. By the end of April, just one month into the second quarter of 2020, more than four billion people, representing approximately 54% of the global population and just under 60% of global GDP, were impacted by governmental restrictions.12
The graph below depicts the percentage of the global population impacted by governmental containment measures over time. The graph
distinguishes between containment measures taken by governments based on the degree of severity of the measure, ranging from limited social restrictions to full lockdowns. In midJanuary 2020, roughly 20% of the world’s population was under some form of containment measure, consisting primarily of closings of schools and universities, as well as non-essential businesses. By mid-March, as the spread of the virus increased exponentially, some form of containment measures impacted practically the entire global population.
13
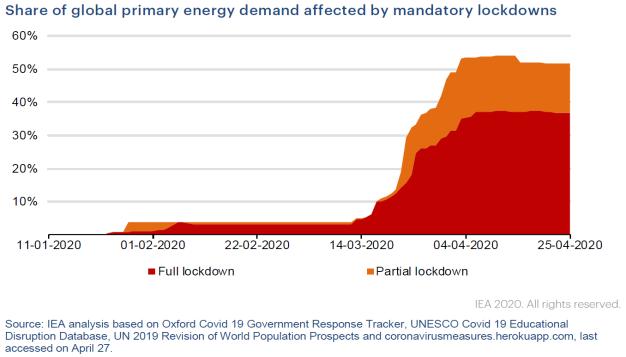
The graph below shows the percentage of energy demand impacted by containment efforts. January and February remained relatively flat at just under 5%. By mid-March, the percentage of global energy demand impacted by lockdowns (either full or partial) skyrocketed to over 50%, causing significant demand destruction and greatly contributing to the falling crude price.
14
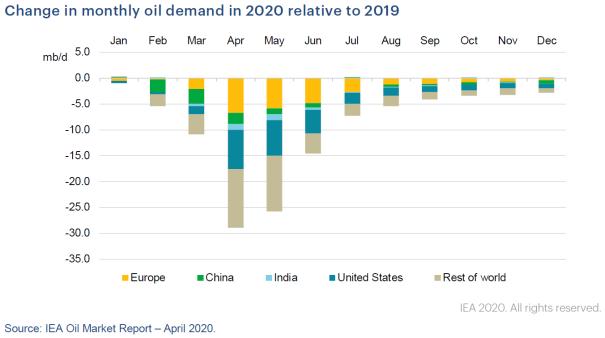
As can be expected, significant declines in oil demand were felt in most major economies of the world. The graph below compares the Y-O-Y decline in monthly oil demand from 2019 to 2020 among the world’s highest consuming regions. The largest declines were seen in April and May, with a fairly steady recovery expected heading into the fourth quarter of 2020. Although we’ve seen an improvement in demand through midyear, if a second spike in COVID-19 cases emerges, which appears likely, recovering demand could begin to decline again.
15
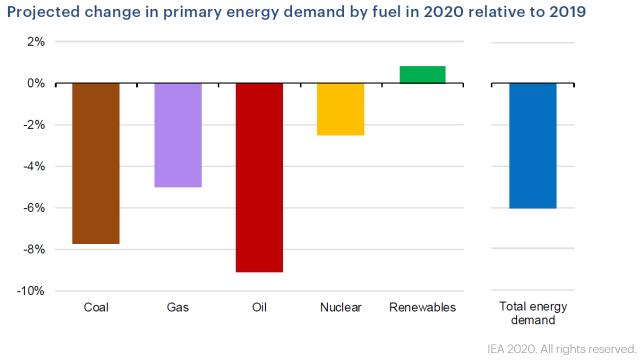
The diagram below is prospective in nature in that it provides a projected breakdown of the anticipated change in energy demand by source, comparing 2020 to 2019. The most significant energy source impacted is expected to be oil, projected to fall by roughly 9% year-over-year. This dramatic decrease in demand for crude oil is the primary contributor to the price crash.
16
In terms of actual impact on demand for oil and related products, crude demand was down approximately 5% during the first quarter of 2020, due mainly to restrictions on mobility and the sharp decline in aviation activity. Mobility and aviation account for nearly 60% of global oil demand. By the end of the first quarter, global road-based transport had fallen almost 50% below the 2019 average, while aviation was roughly 60% below the 2019 average. The data below illustrates the drop in road transport by region, as well as the drop-in global aviation activity.
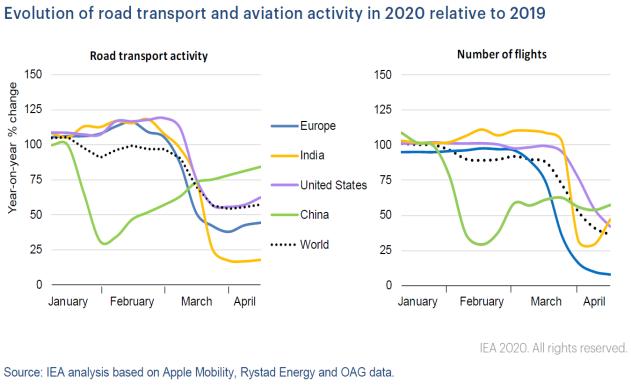
17
The IEA predicts that for 2020, oil demand could fall by 9%, or roughly 9 mb/d, which would reduce global oil demand to levels not seen since 2012.18 The combination of drastically reduced demand for road transport and an even more severe decline in jet fuel was the most significant factor leading to the price crash.
OPEC
Although the demand destruction caused by the COVID-19 virus was a major contributor to the fall in crude price, the other significant factor is the failure of OPEC+ to reach an agreement on production cuts. The failure of two key OPEC+ members (Saudi Arabia and Russia) to agree on volume reductions precipitated a price war between the two, with both producers announcing that they would be increasing production despite crashing crude prices.19 This disagreement will be described below, but first a brief history of the creation and decisions of OPEC+ will be discussed.
In September 2016, Saudi Arabia and OPEC, along with Russia and several other non-OPEC countries, agreed to cooperate in reducing global crude supply, with the intent of stabilizing the global crude price. This informal alliance of OPEC and non-OPEC producers was dubbed "OPEC+,” and would be formalized at the “Joint OPEC-Non-OPEC Producing Countries’ Ministerial Meeting” in December of 2016, via an instrument called the Declaration of Cooperation.20
One month prior to the formal creation of OPEC+, OPEC member countries met on November 30, 2016, for the 171st OPEC Ministerial Conference and agreed to a production adjustment of 1.2 million barrels a day, effective January 1, 2017. Simultaneous with the OPEC agreement was the agreement of eleven non-OPEC members to reduce production by 558,000 barrels per day, effective as of January 1, 2017. 21 Non-OPEC member reductions would also be for six months, extendable for an additional six-month timeframe. This initial 1.8 million barrels per day reduction (1.2 million barrels by OPEC and 600,000 by OPEC+ members) was the first agreement reached by OPEC+, but was followed by numerous additional agreements to control production levels with a view to stabilizing prices. Below is a summary of subsequent OPEC+ meetings and the production level adjustments reached by the group since inception:
● Second OPEC+ meeting held May of 2017, where agreement was reached to continue volume reductions for an additional nine months, starting July of 2017 to March of 2018.
● Third OPEC+ meeting in November of 2017, with agreement that the volume adjustments agreed to in May would extend through the entire year of 2018. ● Fifth OPEC+ meeting in December of 2018, the group agreed to revise the initial 1.8 million barrels per day adjustment to 1.2 million barrels per day, starting
January 2019, for a period of six months.
OPEC countries would reduce production by 800,000 barrels per day, while OPEC+ members would reduce production by 400,000 barrels per day. ● Sixth OPEC+ meeting was held in July of 2019, and the December 2018 volume reductions were extended from July 2019 to March 31, 2020. ● Seventh OPEC+ meeting held in
December of 2019, where production cuts were increased to 1.7 million barrels per day by the group, while several additional countries, including Saudi Arabia, agreed to additional voluntary cuts in production, bringing the total reduction to 2.1 million barrels per day.
The price war emerged during the 178th (Extraordinary) Meeting of the Conference, which occurred on March 5, 2020. At the summit, in addition to extending the 1.7 million barrels per day cuts agreed to at the seventh OPEC+ meeting for the remainder of the year, OPEC members agreed on an additional production cut of 1.5 million barrels per day through the first half of 2020 (OPEC cuts of 1.0 million barrels per day; non-OPEC cuts of 500,000 barrels per day), subject to further consideration and discussion at the next OPEC+ meeting. 22 This additional increase brought the total proposed volume reduction to 3.6 million barrels per day, as compared to 2016. Russia refused to agree to these volume reductions on the basis that it was too soon to determine whether additional production cuts would serve as an adequate remedy to the falling commodity price. 23 Russia’s unwillingness to agree to the additional production cuts rattled the commodity markets and resulted in prices falling even further than they had in the prior weeks due to declining demand. On March 6, 2020, the closing price for WTI was $41.14, and by the following Monday, WTI had fallen dramatically, closing at $31.05.24 As a response to Russia’s refusal to implement production cuts, Saudi Arabia announced on March 9, 2020,,their decision to discount Saudi crude exports by between six and eight dollars to various regions of Asia, which caused a further decline in the crude price.25 The following day, Saudi Arabia announced its intention to increase crude production from just under ten million barrels of oil per day to over twelve million barrels per day.26 Russia also announced its plan to increase production by approximately 300,000 barrels per day. 27 These actions collectively caused panic in the markets, exacerbating the price decline already caused by COVID-19.
Eventually, corrective action was taken by the group at the April 9OPEC+ meeting, where the group agreed to cut production by ten million barrels per day between May 1, 2020, and June 30, 2020, eight million barrels per day for the time period July 1to December 31, 2020 with a six million barrel per day reduction for the time period January 1, 2021, to April 30, 2022.
28 However, these corrective actions by OPEC+ were not sufficient to prevent the WTI futures price from continuing to slide steadily until reaching $36 on April 20, 2020. This was the first time in recorded history that prices had reached negative territory.
History of Pricing
The past fifteen years have seen extreme crude price volatility. The crude price began to climb from around $30 per barrel in 2005 to a peak of just over $140 per barrel in 2008. In 2009, due to the global financial crisis, the price fell precipitously to just over $30 per barrel again, followed by fluctuations in price from between
$30 to $130 per barrel between 2009 and 2012. Between 2012 and 2015, the price hovered between $70 and $110 per barrel range, then fell to levels ranging between $30 and $90 between 2015 and 2020. The graph below depicts the history of crude prices (Brent and WTI) dating back to 1987.
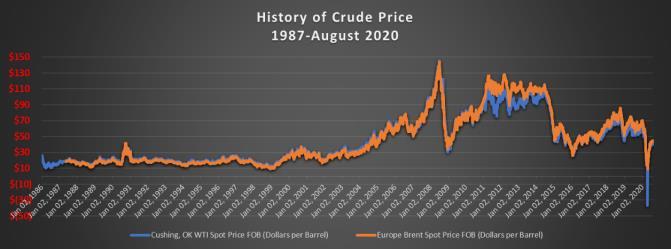
29
When focusing more closely on the six months or so leading up to the price crash of April 2020, prices were actually relative stable. Prices hovered in the mid $50 per barrel range between October of 2019 and early March of 2020. However, in early March, the price began to fall steadily until by mid-April, after the full impact of COVID-19 was felt and OPEC+ failed to reach agreement on production cuts, WTI crashed to historic levels. Prices reached negative territory for the first time in recorded history, falling to $36.78 on April 20, 2020.
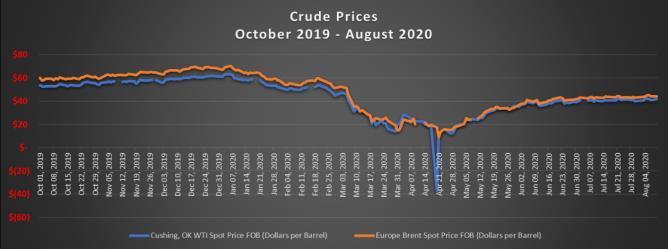
30
Fortunately, WTI recovered quickly, reaching positive territory the following day and climbing to the $40 level by early June, where the price has generally remained. Governmental easing of social restrictions resulting in increasing demand for crude combined with OPEC+ agreement on production cuts have helped stabilize the price.
Crude storage capacity also contributed to the negative WTI price, as there was widespread concern that if drastic measures weren’t taken to reduce supply, crude storage capacity at Cushing, Oklahoma would become insufficient to store the crude being produced and shut-ins would be needed.31
Impact of price crash on E&P Companies
As a result of the price crash, exploration and production companies have been forced to take extreme measures by drastically reducing capital spend in light of decreasing revenues due to lower prices. Citing GlobalData analysis, Offshore Magazine reported that total CAPEX cuts by oil and gas companies had reached $85 billion as early as April 2020.32 The reduction in investment levels within the industry has been made even worse due to numerous bankruptcies that have taken place. The graph below shows the breakdown of CAPEX cuts by segment within the oil and gas industry, in both dollar terms and as a percentage of CAPEX for each oil and gas industry segment.
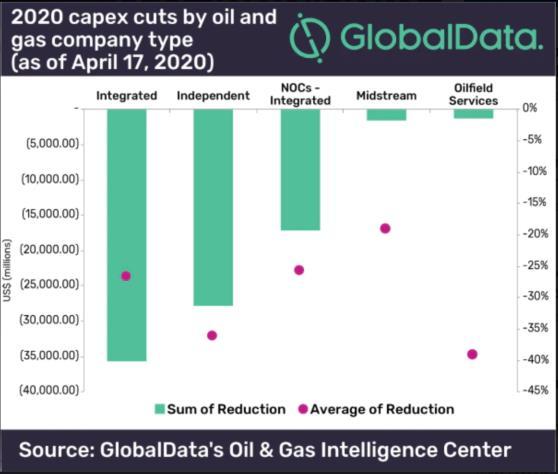
33
Outlook
Covid cases appear to be increasing recently in various places throughout the world, although the distribution and deployment of vaccines should greatly stem the increasing number of cases going forward. The IEA projects in their Stated Policies scenario that global energy demand will grow beyond 2019 levels before
2025 as COVID-19 impacts reduce and long-term drivers prevail. 34 For oil and natural gas producers, reduced cash flows of current lower pricing require near term cost cutting and reduced investment measures. Currently reduced investment levels are expected to increase again enabling the ability to meet recovering demand, as existing oil and natural gas supply reduces by natural depletion.
1 Considerations for implementing and adjusting public health and social measures in the context of COVID-19, WHO, Interim Guidance (Nov. 4, 2020), https://www.who.int/publications/i/item/considerations-inadjusting-public-health-and-social-measures-in-the-contextof-covid-19-interim-guidance. 2 Jillian Ambrose, Saudi Arabia steps up oil price war with big production increase, THE GUARDIAN (Mar. 11, 2020), https://www.theguardian.com/world/2020/mar/11/saudiarabia-oil-price-war-production-increase-aramco. 3 Listings of WHO’s Response to COVID-19, WHO, https://www.who.int/news/item/29-06-2020-covidtimeline (last updated Dec. 28, 2020). 4 Fan, Jingchun et al., Epidemiology of Coronavirus Disease in Gansu Province, China, 2020, 26, 6, Emerging Infectious Diseases 1257, 1257 (Mar. 13, 2020), https://wwwnc.cdc.gov/eid/article/26/6/20-0251_article. 5 Listings of WHO’s response to COVID-19, WHO, https://www.who.int/news/item/29-06-2020-covidtimeline (last updated Dec. 28, 2020). 6 WHO Coronavirus (COVID-19) Dashboard, WHO (Mar. 1, 2021 5:03pm), https://covid19.who.int (providing real time data of the number of confirmed COVID-19 cases and deaths in countries across the world). 7 WHO Coronavirus (COVID-19) Dashboard, WHO, https://covid19.who.int/ (last visited Feb. 28, 2021, 5:31 PM). 8 Johns Hopkins Coronavirus Resource Center, New Cases of Covid-19 In World Countries., JOHNS HOPKINS UNIV. & MED., https://coronavirus.jhu.edu/data/new-cases (last visited Nov. 9, 2020). 9 Mexico Confirms First 2 Cases of Coronavirus, ASSOCIATED PRESS NEWS (Feb. 28, 2020), https://apnews.com/article/a7d2aaac19fc3022ba686ba91e7 d4395. 10 Considerations for implementing and adjusting public health and social measures in the context of COVID-19, WHO, Interim Guidance (Nov. 4, 2020), https://www.who.int/publications/i/item/considerations-inadjusting-public-health-and-social-measures-in-the-contextof-covid-19-interim-guidance. 11 Global Energy Review 2020: The Impacts of the Covid19 crisis on global energy demand and CO2 emissions, IEA, 3, (Apr. 2020), https://www.iea.org/reports/global-energyreview-2020. 12 Id. at 5. 13 Id. at 6. 14 Id. at 6. 15 Id. at 20. 16 Id. at 15. 17 Id. at 18. 18 Oil Market Report 2020, IEA, (Apr. 2020), https://www.iea.org/reports/oil-market-report-april-2020 (detailing statistics on oil supply, demand, inventories, prices and refining activity, and oil trade for IEA and selected non-IEA countries). 19 Sam Meredith, OPEC+ fails to agree on massive supply cut, sending crude prices to 2017 lows, CNBC (Mar. 6, 2020, 12:12 p.m.), https://www.cnbc.com/2020/03/06/opecmeeting-coronavirus-weighs-on-oil-demand-as-oil-pricesfall.html. 20 Declaration of Cooperation, Organization of the Petroleum Exporting Countries (OPEC), (Dec. 10, 2016), https://www.opec.org/opec_web/en/publications/4580.htm. (OPEC includes the following countries: Azerbaijan, the Kingdom of Bahrain, Brunei Darussalam, Equatorial Guinea, Kazakhstan, Malaysia, Mexico, the Sultanate of Oman, the Russian Federation, the Republic of Sudan, and the Republic of South Sudan).
22 Press Release, Org. of the Petroleum Exporting Countries, OPEC 178th (Extraordinary) Meeting of the Conference concludes (Mar. 5, 2020), https://www.opec.org/opec_web/en/press_room/5865.htm. 23 Irina Slav, The Reason Why Russia Refused To Cut Oil Production, (Mar. 12, 2020, 11:00 AM), https://oilprice.com/Energy/Energy-General/The-ReasonWhy-Russia-Refused-To-Cut-Oil-Production.html. 24 U.S. Energy Information Administration, http://www.eia.gov/dnav/pet/pet_pri_spt_s1_d.htm (last visited Mar. 1, 2021.) (Providing Spot Prices for Crude Oil and Petroleum Products. In order to obtain data, view the history under daily values and then download XLS file). 25 Tak, Natasha. Oil Nose-dives as Saudi Arabia and Russia set off ‘Scorched Earth’ Price War, CNBC (Mar. 9, 2020, 5:33 PM), https://www.cnbc.com/2020/03/08/opec-dealcollapse-sparks-price-war-20-oil-in-2020-is-coming.html. 26 Jillian Ambrose, Saudi Arabia steps up oil price war with big production increase, THE GUARDIAN (Mar. 11, 2020, 8:09 PM), https://www.theguardian.com/world/2020/mar/11/saudiarabia-oil-price-war-production-increase-aramco. 27 Id. 28 Press Release, Organization of the Petroleum Exporting Countries (OPEC), The 9th (Extraordinary) OPEC and nonOPEC Ministerial Meeting concludes, (Apr. 9, 2020), https://www.opec.org/opec_web/en/press_room/5882.htm. 29 U.S. Energy Information Administration, Spot Prices for Crude Oil and Petroleum Products, EIA, http://www.eia.gov/dnav/pet/pet_pri_spt_s1_d.htm (last visited Nov. 29, 2020). 30 Id.
31 Crude Oil Tanks: A Look Into Oil Prices and Storage., Brown Brothers Harriman (May 1, 2020), https://www.bbh.com/us/en/insights/private-bankinginsights/crude-oil-tanks-a-look-into-oil-prices-andstorage.html; Krien Van Beek, Crude Storage Broker: Remaining Global Oil Storage Capacity is “Maybe Less Than One Percent” (Apr. 24, 2020, 6:10 AM), https://www.cnbc.com/video/2020/04/24/crude-storagebroker-remaining-global-oil-storage-capacity-is-maybeless-than-one-percent.html. 32 Capex Cuts Reach More the $85 Billion, Offshore Mag. (May 4, 2020), https://www.offshoremag.com/home/article/14175262/capex-cuts-reach-morethe-85billion#:~:text=Integrated%20oil%20and%20gas%20comp anies,exploration%20budgets%2C%20and%20unsanctione d%20developments. 33 Id. 34 World Energy Model: Part of World Energy Outlook, IEA, 5, (Oct. 2020), https://www.iea.org/reports/worldenergy-model/stated-policies-scenario.
