Αλέξανδρος Ζυμπίδης: Εξερευνώντας τον «κώδικα Da Vinci»… των καταστροφικών σεισμών

Page 1

Earthquakes have literally shaken up our world recently. We still cannot predict them, so how best to model the financial risks? Working on a fault line in Greece, Alexandros Zimbidis and Emmanouil Louloudis have come up with a new method.

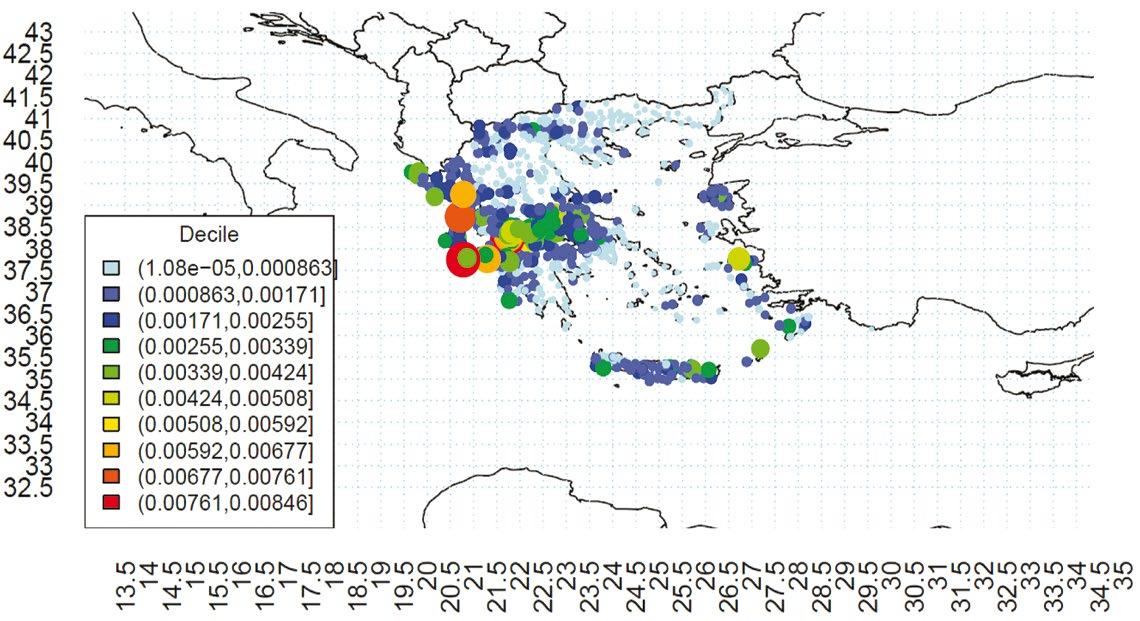
While highly volatile from year to year, economic losses from natural catastrophes (natcats) have been increasing in OECD countries since 2000 – at a slightly faster rate than GDP. The risks include floods, hurricanes, wildfires, earthquakes, tsunamis, pandemics – basically any unexpected event capable of causing extreme losses. Financial management of these risks is a key challenge for governments, insurers, banks and other institutions and is particularly important such risks and have limited capacity to manage the financial hit they cause. The importance of urgently addressing this challenge is increasingly being recognized. For example, the European Central Bank, through a report it published in December, underlined the necessity of incorporating the impact of environmental risk into the banking system using climate stress-testing exercises. The OECD has also published reports regarding flood and seismic risk. According to the seismic European hazard map provided by EFEHR (European Facilities for Earthquake Hazard and Risk), Greece is highly exposed to seismic risk. Other countries in this category include Italy, Romania and Turkey. In light of the 7.8 magnitude earthquake that hit southern Turkey and north-western Syria on 6 February this year, and the unusually strong aftershock that occurred nine hours later, it has become evident that buildings in high-risk areas need to be sturdy and have sufficient quake resistance and be constructed according to the very latest seismic codes – as well as having insurance contracts in place to protect them.

EARTHQUAKE ESSENTIALS

• Earthquakes take place along geological fault lines, where tectonic plates in the Earth’s crust lie close together

• Energy from the Earth’s core generates currents (seismic waves) in the Earth’s crust. This causes friction between plates, which then rub, scrape or bump together

• Earthquakes are more frequent than we imagine, with thousands

taking place every day. They are unnoticed because they’re small and take place far below the Earth’s surface, or deep in the seabed. The number of quakes noticeable without instruments is around 50,000 each year

• Earthquakes are measured in many different ways and on different scales. Magnitude (more correctly, the ‘moment magnitude scale’, denoted Mw) measures the strength and duration of seismic waves. Anything over 7Mw is a major event

• In 1935, the American seismologist Charles F Richter published the Richter scale: the logarithm to base 10 of the maximum seismic wave amplitude (in thousandths of a millimetre) recorded on a standard seismograph 100km from the epicentre

• About 80% of earthquakes happen along the rim of the Pacific Ocean, the Circum-Pacific Belt – also known as the Ring of Fire because of its large number of volcanoes

• About 15% of earthquakes take place along the Alpide Belt, running east from the Mediterranean through Asia and linking to the Circum-Pacific Belt

• There’s no known formula as to why earthquakes happen, so predicting them isn’t yet possible. Seismologists can look for changes in Earth elements (eg radon gas, electromagnetism, geology, geochemistry) but it’s still uncertain. This is why historical records, often sketchy and inexact, are also analysed

• Earthquakes would cause less damage if humans didn’t inhabit fault lines, invested in proper precautions and thought more

long-term about risk. It may be argued that it wouldn’t be beneficial to be able to predict them, as this would make us complacent about mitigation measures.

Declustering

All of this makes it clear that a robust methodology for evaluating the premium rates and capital requirements associated with natcat risk is more essential than ever. As available data for historical quake events along with their associated financial consequences

EACH YEAR, 2014–23*

sufficiently modelled under a Poisson process, offering a longterm inference of each region. There are several declustering methods available. For example, an introductory algorithm was presented by Gardner and Knopoff in 1974. More complicated methods include branching processes such as the Epidemic Type Aftershock Sequence model. According to this, the background events behave as a stationary in time Poisson process, while each event – background or triggered – generates further events along a non-stationary Poisson process.

Historical data gap

FIGURE 1: Expected loss ratio per postal code using historical catalogues

on buildings are insufficient, the actuarial estimates of seismic risk must be based on stochastic simulations involving the geometry of active or less active faults. As insurance policies for earthquake peril typically cover some months or years, long-term inference is needed for simulation of the earthquake events. This is treated by declustering the historical catalogue to background and triggering events. Background events are independent and can be

Most actuarial studies use only historical catalogues to quantify seismic risk. However, the incorporation of faults in a seismic risk analysis is crucial. While historical catalogues typically cover some hundreds of years, the geophysical slip rates of faults can help us assess recurrence information going back up to 15,000 years. To address this data gap, we propose that faults must be considered along with historical catalogues when conducting such risk studies. To this end, we have developed a fault-specific model for insurance pricing and reserving. Our paper ‘Stochastic assessment of seismic risk using faults to address the incomplete information in historical catalogues’ was published in July. We consider the reactivation times of faults either as exponential random variables or as truncated lognormal random variables, where some faults can be associated with recent events. The geometry of faults provides information about the potential magnitude they can produce during an earthquake. In practice, fault sources are responsible for the generation of stronger events, while area sources are responsible for the generation of weaker events.

Per-building calculations

The loss random variable of each building in our work is considered as the maximum annual damage accepted from all seismic sources together and the total portfolio loss is equal to their summation. Our proposed simulations are structured in such a way that precise loss estimates per building can be calculated, thus providing deep insight to an insurance company’s portfolio. Although most actuarial

works produce premium rates over large regions (such as CRESTA zones), our pricing model considers the exact co-ordinates of each building on the Earths’ surface. This provides significant advantages to the insurance company in avoiding or handling adverse selection and staying competitive, but also in allowing it to process more accurate calculations for capital requirements under Solvency II.

The fault factor

Solvency II’s solvency capital requirement (SCR) does not consider significant parameters such as the existence of faults or each building’s exact co-ordinates, materials, height and year of construction – leading insurance companies to occasionally overestimate capital requirements. Moreover, the extraction of the SCR standard mathematical formula is a

‘black box’. We have applied our model to the region of Greece. In the case of 2% deductibles, seismic hazard maps are produced for the entire country.

As an example, the expected loss by postal code for high-rise moderate code buildings (constructed before 1994) is

presented in Figure 1 and Figure 2.

incorporates faults. There is no doubt that faults add a significant contribution to premium rating, particularly over the Ionian Islands, Attica, Crete and the South Aegean – regions with a high density of fault sources. We believe it is necessary for actuarial analysts to contribute and share their precious knowledge on the field of climate and physical risks, as well to reduce the current opacity in standard formulas.

NEXTDEAL #518 31 ΜΑΪΟΥ 2023 NEXTDEAL #518 31 ΜΑΪΟΥ 2023 Αφιέρωμα Αφιέρωμα 50 51
LARGEST EARTHQUAKE
Figure 1 includes only historical catalogues, while Figure 2 WHERE WHEN MAGNITUDE (Mw) Iquique, Chile 1 April 2014 8.2 Illapel, Chile 16 September 2015 8.3 Solomon Islands 8 December 2016 7.8 Chiapas, Mexico 8 September 2017 8.2 Fiji 19 August 2018 8.2 Peru 26 May 2019 8.0 Alaskan Peninsula, US 22 July 2020 7.8 Chignik, Alaska, US 29 July 2021 8.2 Michoacan, Mexico/ Papua New Guinea 19 September / 10 September 2022 7.6 Turkey-Syria 6 February 2023 7.8 * At time of writing
Seismic shift
FIGURE 2: Expected loss ratio per postal code using both historical catalogues and fault sources Authors: ALEXANDROS ZIMBIDIS & EMMANOUIL LOULOUDIS The text above has been published in May edition of “The Actuary”, the official magazine of the Institute and Faculty of Actuaries

Turn static files into dynamic content formats.

Create a flipbook
Issuu converts static files into: digital portfolios, online yearbooks, online catalogs, digital photo albums and more. Sign up and create your flipbook.