4 minute read
7. Maritime Monitoring via Low-Earth Orbit Satellite Constellation
Zhuo Zhuzhen, You Xinmei Mabel, Peng Xinqi, Hwa Chong Institution
Abstract
Advertisement
With the ever-increasing volume of marine ships involved in commercial activities in an already globalised world, ensuring the efficiency and safety of these operations has become paramount. To accurately monitor their movement, satellite constellations are often used, making it crucial to optimise the performance of these constellations. However, there has been a lack of research done on the theoretical results of using large scale satellite constellations to monitor maritime activities. This report mainly investigates how key elements of a satellite constellation, such as the number of satellites per plane, number of planes, inclination, and combination, affect the coverage of the system. Experimentation and configuration will be done through Freeflyer software simulations. We hypothesise that increasing the inclination should increase the total number of maritime vessels observed but cause a decrease in the contact time of the satellite constellation with the ground stations. There should be a general increase in the contact time and the time taken to observe most of the satellites as the number of satellites, be it the number of planes or the satellites per plane, increases. More satellites per plane would also be more effective than more planes.
1.0 Methodology
1.1 Satellite constellation
For our simulations, the eccentricity and argument of perigee were assumed to be zero, and with reference to existing constellations, the altitude of satellites was 780km, and the cone half-angle was 17°. The satellites and their planes were equally distributed.
The inclination, number of satellites per plane, and the number of planes of the satellite constellation were varied. The inclination ranged from 70° to 85°, while the number of planes in each simulation ranged from 5 to 11, and the number of satellites per plane ranged from 5 to 15.
1.2 Ground Stations
To ensure continuous contact with ground stations and to mimic global demand for such a satellite constellation, ground stations were placed at the busiest container ports and at a diverse range of latitudes and longitudes.
1.3 Contact Analysis
Maritime vessels were simulated by point groups. Due to constraints, only 2064 maritime vessels were used, with a total simulation time of one day as the majority of marine vessels would have been detected.
The average time taken to observe 99% of our point groups and the average contact time of the satellite constellation with the ground stations were recorded to assess the performance of the constellation.
2.0 Results & Discussion
2.1 Effects of Inclination
Firstly, the impacts of changing inclination were investigated.
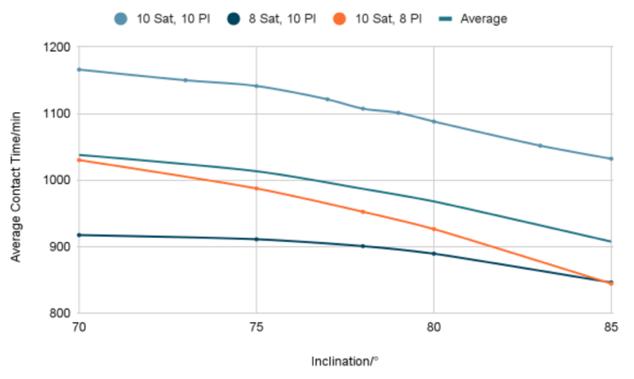
From Fig.1, the average contact time of the satellite constellation with the ground stations generally decreases with the increase of inclination, likely because the constellation would spend more time orbiting at higher latitudes, where fewer ground stations are.
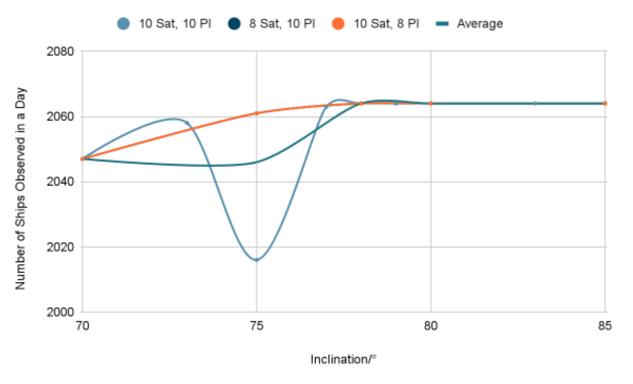
Fig.2 shows that the number of ships detected by the constellation generally increases with inclination.
However, there is an anomaly at 75° of inclination, likely due to the difference in the initial position of the satellites which may have caused the constellation to “miss” some of the point groups.
Next, the effect of inclination on the time taken to observe the majority of the ships was investigated.
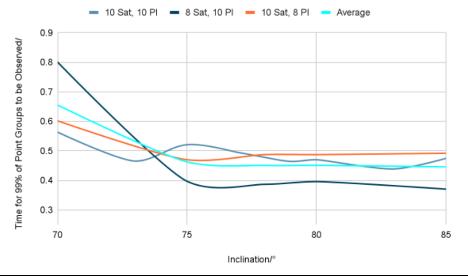
Fig.3 suggests a negative relationship between inclination and the time taken to observe 99% of point groups because as inclination increases, the ground track of the satellites covers more latitudes, so more ships at higher latitudes are observed.
2.2 Effects of Change in Number of Satellite Planes
The inclination was then fixed at 80° and the effect of the number of planes on the constellation performance was investigated.
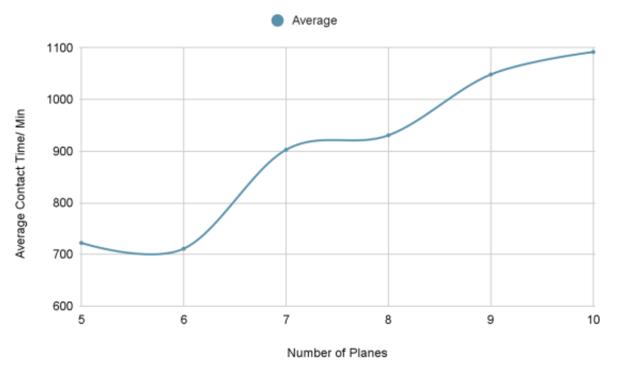
From Fig.4, the average contact time increased with the number of planes, though increasing from an odd number of planes to an even number had a negligible effect, falling partly within our expectations.
Fig.5 shows how the effect of the number of planes seems erratic, but a minimum time is observed at 8 and 10 planes.
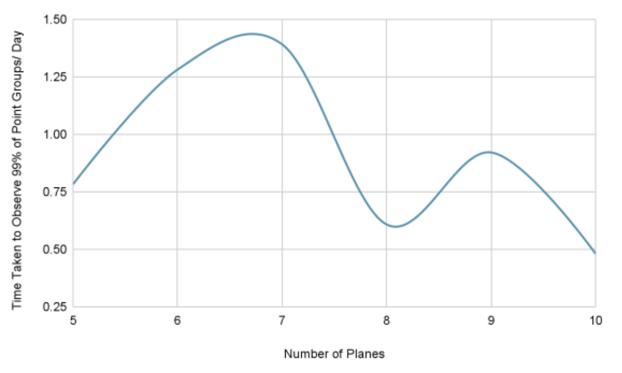
The observation from Fig.5 is further indicated by Fig.6, which shows the apparent lack of pattern.
2.3 Effects of Change in Number of Satellite per Plane
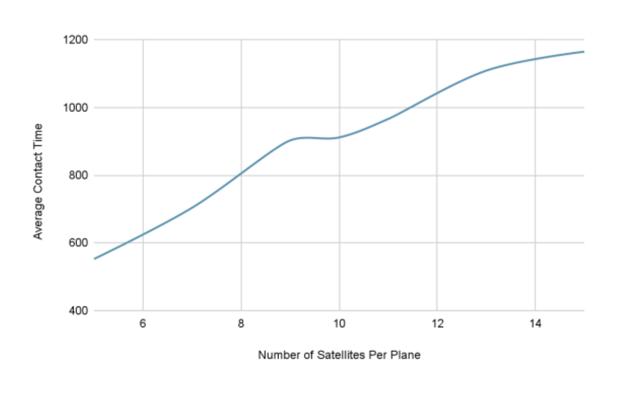
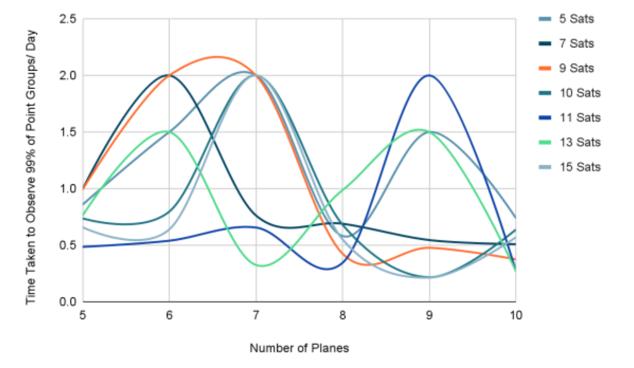
A similar analysis of changes in the number of planes was done for changes in the number of satellites per plane.
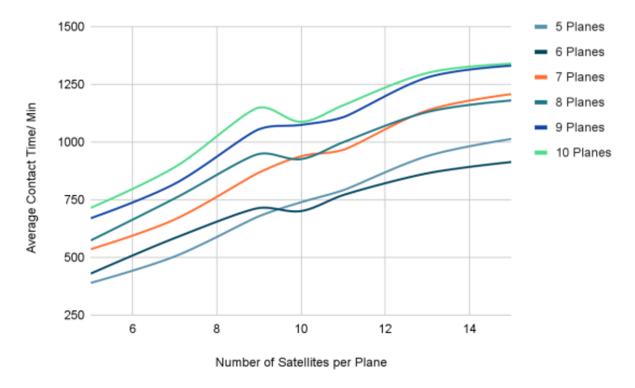
The general increasing trend observed in Fig.7 is to be expected. However, from 9 satellites per plane to 10 satellites per plane, the average contact time only increased marginally.
This effect is seen more clearly in Fig.8, where a drop in the average contact time when the number of satellites per plane increases from 9 to 10 and the number of planes is even, not odd, can be observed. We suspect that this is due to different initial conditions.
From Fig.9, it appears that a minimum average time taken to observe the majority of the point groups occurs at 7 and 11 satellites per plane, while a maximum point occurs at 9 and 13 satellites per plane.
2.4 Analysing the Effects of Number of Total Satellites
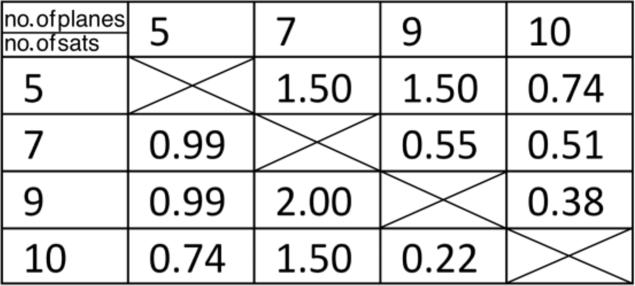
When determining the effects of changing the number of planes and the number of satellites per plane, questions on whether to increase the number of planes or the number of satellites per plane arise. We will use a table to discuss this.
With reference to Fig.10, for most combinations, having more satellites per plane is better than more planes, as stated in our hypothesis. However, an anomaly occurred in 7 orbital planes, likely due to the constellation configuration that results in more satellites being above land in the 24 hours of simulation.

3.0 Conclusion
From our previous discussions, the most efficient configuration of our satellite constellation has a 78° inclination, 10 orbital planes, and 11 satellites per plane. A larger number of satellites per plane is more beneficial.
3.1 Limitations
The increment for the increase in inclination and the step size of the simulation can be reduced to provide more accurate results.
Additionally, the combinations and range of inclination, the number of satellites per plane, and the number of orbital planes are non-exhaustive.
Costs were also not considered, resulting in a bias towards larger numbers of satellites, which may not be cost-effective.
References
Header Image: Mashkov, I. (2020). Radio telescope under bright starry sky. https://www.pexels.com/photo/radio-telescope-underbright-starry-sky-6325003/


