Property Market Indicator Summary
All data to week ending 16 July 2023
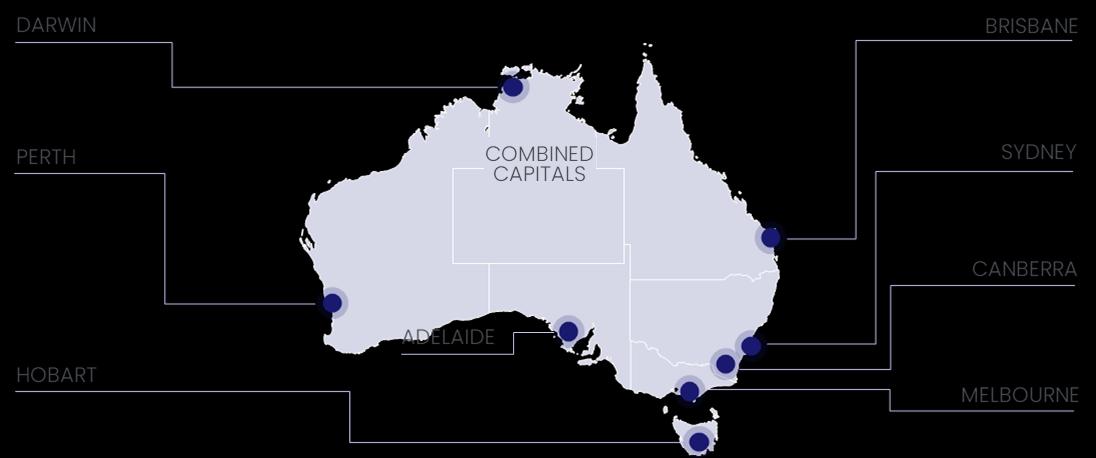
Preliminary capital city clearance rate holds above 70% for the 11th week as the volume of auctions rises.
TheendingofschoolholidaysacrossVictoria sawcapitalcity auctions rise6.3%thisweek, with1,518 homesauctionedacrossthecombined capitals.Thisweek'sliftinauctionnumberswaspredominantly driven bythelargerauctionmarketsofSydney andMelbourne,whileauction numbersacrossthesmallercapitalsremainedrelatively flat.Although upfromtheprevious week, thisweek'scapitalcity auctionactivity is10.1%below thenumbersrecorded thistimelastyear(1,689). With 1,132resultscollected forfar,thecombined capital'spreliminary clearanceratetrended lowerthisweek (72.3%),down2.2percentage pointsfromlastweek'spreliminaryclearancerateof74.5%(revisedto 68.4%atfinalnumbers).Thetimelastyear,53.0%ofauctionswere successful.
Aftereasingovertheschoolholidays,auctionactivity acrossMelbourne rebounded 11.4%thisweek,with636 auctionshostedacrossthecity. Thelastweek saw571 homesauctioned, whilethistimelastyear,675 homeswentunderthehammer.Melbournewastheonlycapitalto recordariseinthepreliminaryclearanceratethisweek, with74.3%of the502resultscollectedtodatereturningapositive result.Thisweek's preliminaryclearanceratewas1.5percentagepointsabovelastweek's preliminaryrate(72.8%revised to68.0%)and22.1percentagepoints higherthanthistimelastyear(52.2%),whensellingconditions were markedlyweaker.
InSydney,600homeswentunderthehammerthisweek,upfrom567 theweek prior but-6.0%below the638auctionedthistimelastyear.Of

Clearance rate
the434resultscollectedsofar,74.9%returnedasuccessfulresult, down70 basispointsfromtheprevious week. Thedipinthe preliminaryclearancerateseemstobe driven byalackofvendor confidence, withthewithdrawalraterisingto12.7%whiletheportion ofproperties passedinatauctionfellto12.4%.Despite thefall,Sydney recorded thehighestpreliminary clearancerateacrossthecapitals. Lastweek apreliminary clearancerateof75.6%(reviseddownto 68.8%)wasrecorded, whilethistimelastyear54.0%ofauctionsheld recorded asuccessfulresult.
Acrossthesmallercapitals,bothAdelaide andBrisbanesaw102 homes gounderthehammerthisweek. Bothmarketsalsorecorded their lowestpreliminary clearancerateinfourweeks,with71.4%ofAdelaide auctionsand59.8%ofBrisbaneauctionsreportingasuccessfulresult. Canberrasawadecline inboththepreliminaryclearancerateand auctionnumbers(down -16.3percentagepointsand -20.8percentage pointsrespectively), with60.0%ofthe57homesauctionedacrossthe city thisweek recording asuccessfulresult.InPerth,20homeswent underthehammerthisweek;fivehavebeensuccessfulsofar.Theone auctionheldinTasmaniathisweek wassuccessful.

Theunseasonalriseinauctionactivity isexpected tocontinuenext week, withapproximately1,850 auctionscurrentlyscheduledacross thecapitals.Wecouldseethepreliminaryclearanceratedip below 70%forthefirsttimein12 weeksiftheincreaseinauctionnumbersis notmetwithadditionalbuyer demand.
Total auctions

Mediaenquiries:media@corelogic.com.au
■ This week ■ Lastyear ■ This week ■ Lastyear
Capital
Please note: A minimum sample size of 10 results is required to report a clearance rate PropertyMarketIndicatorSummary 600 636 102 102 20 1 57 1,518 638 675 156 124 9 0 87 1,689 Sydney Melbourne Brisbane Adelaide Perth Tasmania Canberra Total 74.9% 74.3% 59.8% 71.4% 29.4% 60.0% 72.3% 54.0% 52.2% 44.8% 63.7% 54.0% 53.0% Sydney Melbourne Brisbane Adelaide Perth Tasmania Canberra Weighted
CityAuction Statistics (Preliminary)
Average
Weekly

rates
Melbourne Brisbane Sydney Adelaide 20% 30% 40% 50% 60% 70% 80% 90% 100% Jul 13 Jul 14 Jul 15 Jul 16 Jul 17 Jul 18 Jul 19 Jul 20 Jul 21 Jul 22 Jul 23 Weekly auction clearance rate 4 week average


Mediaenquiries:media@corelogic.com.au 10% 20% 30% 40% 50% 60% 70% 80% 90% 100% Jul13 Jul14 Jul15 Jul16 Jul17 Jul18 Jul19 Jul20 Jul21 Jul22 Jul23 10% 20% 30% 40% 50% 60% 70% 80% 90% 100% Jul13 Jul14 Jul15 Jul16 Jul17 Jul18 Jul19 Jul20 Jul21 Jul22 Jul23 20% 30% 40% 50% 60% 70% 80% 90% 100% Jul13 Jul14 Jul15 Jul16 Jul17 Jul18 Jul19 Jul20 Jul21 Jul22 Jul23 10% 20% 30% 40% 50% 60% 70% 80% 90% 100% Jul13 Jul14 Jul15 Jul16 Jul17 Jul18 Jul19 Jul20 Jul21 Jul22 Jul23 City Clearancerate Totalauctions CoreLogic auctionresults Clearedauctions Unclearedauctions Sydney 74.9% 600 434 325 109 Melbourne 74.3% 636 502 373 129 Brisbane 59.8% 102 82 49 33 Adelaide 71.4% 102 56 40 16 Perth 29.4% 20 17 5 12 Tasmania n.a. 1 1 1 0 Canberra 60.0% 57 40 24 16 WeightedAverage 72.3% 1,518 1,132 817 315
Combined capital cities clearance
PropertyMarketIndicatorSummary
PropertyMarket IndicatorSummary
Capital City Auction Statistics (Preliminary)
PropertyMarket IndicatorSummary
Sub-region auction statistics (Preliminary)

Theaboveresultsarepreliminary,with‘final’auctionclearanceratespublishedeach Thursday.CoreLogic,onaverage,collects99%of auctionresultseachweek.Clearance ratesarecalculatedacrosspropertiesthathavebeentakentoauctionoverthepastweek.

Mediaenquiries:
media@corelogic.com.au
PropertyMarketIndicatorSummary Clearance rate Total auctions CoreLogic auction results Cleared auctions Uncleared auctions Sydney sub-regions Central Coast n.a. 13 8 5 3 BaulkhamHillsandHawkesbury 66.7% 30 18 12 6 Blacktown 61.1% 46 18 11 7 City andInnerSouth 79.3% 62 53 42 11 EasternSuburbs 83.3% 42 36 30 6 InnerSouthWest 74.6% 69 55 41 14 InnerWest 85.1% 56 47 40 7 NorthSydney andHornsby 78.7% 72 47 37 10 NorthernBeaches 76.5% 38 34 26 8 OuterSouthWest n.a. 11 6 4 2 OuterWest andBlueMountains n.a. 14 9 7 2 Parramatta 73.5% 49 34 25 9 Ryde 77.8% 28 18 14 4 SouthWest 51.6% 45 31 16 15 Sutherland 75.0% 25 20 15 5 Melbourne sub-regions Inner 72.9% 78 59 43 16 InnerEast 76.9% 52 39 30 9 InnerSouth 78.7% 78 61 48 13 NorthEast 76.9% 102 91 70 21 NorthWest 74.6% 77 55 41 14 OuterEast 80.4% 72 56 45 11 SouthEast 72.6% 100 73 53 20 West 60.7% 64 56 34 22 MorningtonPeninsula 75.0% 13 12 9 3 RegionalSA4 NewcastleandLakeMacquarie 58.8% 22 17 10 7 Illawarra 57.9% 21 19 11 8 GoldCoast 61.3% 50 31 19 12 SunshineCoast 36.8% 40 19 7 12 Geelong 50.0% 17 14 7 7
PropertyMarket IndicatorSummary


Year to date change

12 Month change
Themonthlychangeisthechangeoverthepast28days. ResultsarebasedontheCoreLogicDailyHomeValueIndex.Furtherinformationanddailyupdateson theindexresultsareavailablefrom http://www.corelogic.com.au/research/daily-indices.html
Mediaenquiries:
0.3% 0.1% 0.4% 0.2% 0.2% 0.2% Sydney Melbourne Brisbane Adelaide Perth Combined 5 capitals 1.4% 0.5% 1.1% 0.6% 0.6% 1.0% Sydney Melbourne Brisbane Adelaide Perth Combined 5 capitals 5.9% 1.0% 1.9% 1.3% 3.3% 3.5% Sydney Melbourne Brisbane Adelaide Perth Combined 5 capitals -3.7% -4.9% -7.5% 0.0% 2.7% -3.7% Sydney Melbourne Brisbane Adelaide Perth Combined 5 capitals
media@corelogic.com.au
Capital city home value changes Weekly change Monthly change
Monthly change in home value index, 5 capital city aggregate
PropertyMarketIndicatorSummary 60 110 160 210 -3.0% -1.0% 1.0% 3.0% Jun 13 Jun 14 Jun 15 Jun 16 Jun 17 Jun 18 Jun 19 Jun 20 Jun 21 Jun 22 Jun 23 Monthly Change in Index Dwelling Index
PropertyMarket IndicatorSummary

Theseresults arecalculated across properties that havebeen advertised for saleover the28days ending 16July 2023. A new listing is onewhich has not been previously advertised for salewithin 75days, total listings includenew listings and properties which havebeen previously advertised.


Mediaenquiries:media@corelogic.com.au
Capital city properties listed for sale – four week count
of homes for sale, combined capital cities
12 month change (%) NEW LISTINGS ■ TOTAL LISTINGS ■ PropertyMarketIndicatorSummary 5.7% -4.5% -23.2% -17.0% -15.8% -19.3% -4.0% -12.3% -8.7% -19.4% -12.3% -23.1% -26.4% -32.3% 25.9% -1.2% -1.6% -19.3% Sydney Melbourne Brisbane Adelaide Perth Hobart Darwin Canberra Combined Capitals NewListings–12monthchange(%) Totallistings–12monthchange(%)
Number
Listings
543 1,875 73,202 22,102 6,189 19,069 6,604 24,227 3,514 11,226 1,460 3,803 246 1,275 3,332 10,614 214 1,113 0 20,000 40,000 60,000 80,000 100,000 120,000 140,000 Jul-14 Jul-15 Jul-16 Jul-17 Jul-18 Jul-19 Jul-20 Jul-21 Jul-22 Jul-23 NewListings TotalListings
PropertyMarket IndicatorSummary


Rental

Mediaenquiries:media@corelogic.com.au
Capital city properties listed for rent – four week count
of homes for rent, combined capital cities Listings 12 month change (%) NEW LISTINGS ■ TOTAL LISTINGS ■ PropertyMarketIndicatorSummary -4.6% -19.2% -2.5% -0.7% -11.4% 24.1% 12.3% 8.8% -9.2% -14.0% -27.6% -7.1% -7.6% -18.7% 31.4% -11.0% 25.1% -16.9% Sydney Melbourne Brisbane Adelaide Perth Hobart Darwin Canberra Combined Capitals NewListings–12monthchange(%) Totallistings–12monthchange(%) 73,041 33,274 12,524 28,716 10,302 22,049 4,219 8,961 1,018 2,385 392 997 3,042 6,328 2,956 310 649 1,467
Number
0 20000 40000 60000 80000 100000 120000 140000 Jul-14 Jul-15 Jul-16 Jul-17 Jul-18 Jul-19 Jul-20 Jul-21 Jul-22 Jul-23 NewListings TotalListings Region Medianrent Month Quarter 12months Current 12months ago Current 12months ago Sydney $733 0.7% 3.2% 12.9% 3.12% 2.65% 1.5% 1.9% Melbourne $551 1.1% 3.9% 12.6% 3.47% 2.92% 0.8% 1.7% Brisbane $614 0.7% 2.1% 10.3% 4.28% 3.56% 1.2% 1.1% Adelaide $549 1.0% 2.5% 9.6% 4.06% 3.70% 0.4% 0.4% Perth $599 0.9% 3.4% 13.4% 4.89% 4.38% 0.7% 1.2% Hobart $552 -0.8% -1.0% 1.3% 4.27% 3.70% 2.7% 1.6% Darwin $600 0.5% 0.7% 3.5% 6.44% 6.04% 1.3% 1.5% Canberra $669 -0.4% -1.0% -2.8% 4.02% 3.86% 2.2% 1.2% Combinedcapitals $617 0.8% 3.0% 11.5% 3.64% 3.11% 1.1% 1.5% Combinedregionals $517 0.3% 1.1% 4.9% 4.55% 4.08% 1.5% 1.4% Changeinrents (alldwellings) Grossyields (alldwellings) Vacancyrates (alldwellings)
snapshot – datato June, 2023
PropertyMarket IndicatorSummary
Mortgage market activity
CoreLogic Mortgage Index

Month on month change
CoreLogicsystemsmonitormorethan100,000mortgageactivityeventsevery monthacrossour4mainfinanceindustryplatforms. Monitoring theactivityeventsacrossthisplatformprovidesaunique andtimelyleadindicatortohousingfinancecommitments.The indexshowsan81% correlationwiththeABShousingfinancedataseries(88%usingtheseasonallyadjustedseries).Basedonthe strongcorrelationandsignificant numberofeventsbeingmonitored,theMortgageIndexprovidesthemosttimelyandholistic measureofmortgagemarketactivity available.
Toaccessdetailed analysisofsomeofthesekeyindicatorsonasuburblevel,pleaseloginto yourCoreLogicProfessionalsystem orcontactus oninfo@corelogic.com.au Alternatively,ring1300734318tosubscribetoMarketTrends


Mediaenquiries:media@corelogic.com.au
Index value
PropertyMarketIndicatorSummary 84.1 85.8 58.7 35.2 80.7 154.2 85.7 NSW QLD SA TAS VIC WA National -9.2% -14.9% -14.7% -19.2% -19.6% -17.7% -15.3% NSW QLD SA TAS VIC WA National 0 20 40 60 80 100 120 140 160 180 Jul19 Jan20 Jul20 Jan21 Jul21 Jan22 Jul22 Jan23 Jul23 MortgageIndex ABSOwnerOccupierhousingfinancecommitments(monthly)
Toptwosales over the past week,states andterritories


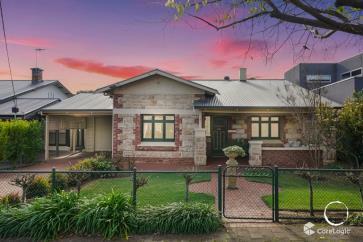
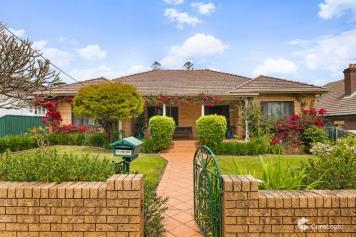
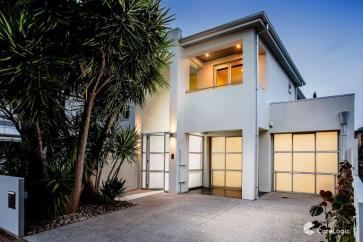


Mediaenquiries:media@corelogic.com.au To access detailed analysis of some of these key indicators on a suburb level, please log into your CoreLogic Professional system or contact us on info@corelogic.com.au Alternatively, ring 1300 734 318 to subscribe to Market Trends
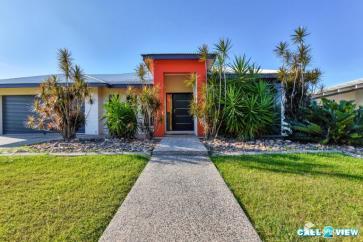
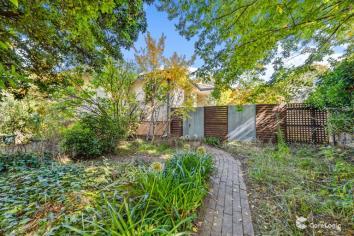
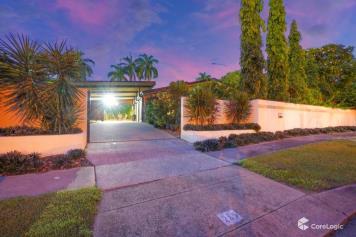
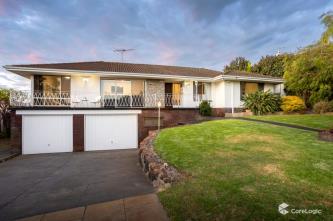
Australian Capital Territory New South Wales Northern Territory Queensland South Australia 20LivingstoneStreet Burwood 4 4 4 Belle Property Strathfield $6,150,000 19TurnerPlace Yarralumla 3 1 1 Ray White Canberra $1,700,000 57SirBruceSmallBoulevard Benowa 5 5 3 Kollosche $4,650,000 59TheCorso IsleOfCapri 6 6 6 Kollosche $24,000,000 17EarlStreet HuntersHill 4 4 2 BresicWhitney Hunters Hill $6,000,000 2NorthTerrace Highgate 4 2 2 Ous Property $1,525,000 51AArthurStreet Unley 3 2 4 Thomas Real Estate $1,660,000 28TaylorCrescent Bellamack 4 2 2 Call2View Real Estate $650,000 285McmillansRoad Anula 3 2 4 Real Estate Central NT $735,000 7/2KerridgeStreet Kingston 3 3 0 Hive Property $1,538,000
PropertyMarketIndicatorSummary
PropertyMarket IndicatorSummary
PropertyMarket IndicatorSummary
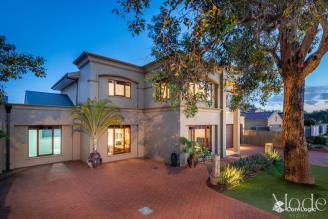


Mediaenquiries:media@corelogic.com.au To access detailed analysis of some of these key indicators on a suburb level, please log into your CoreLogic Professional system or contact us on info@corelogic.com.au Alternatively, ring 1300 734 318 to subscribe to Market Trends
Tasmania Victoria Western Australia 20
6 3 2 Mode
Pleasant $2,130,000 46ObanRoad
Beach 4 2 3 Shore Property $2,300,000 22JohnStreet Kew 4 3 2 Zed Real Estate $5,000,000
4
Signature
2/12AuburnRoad KingstonBeach 3 3 3 Roberts Real Estate
$1,000,000
Toptwosales over the past week,states andterritories
BookerStreet Attadale
Realty Mount
City
42GrosvenorParade Balwyn 5 4 2 Marshall White Balwyn $4,368,000 103MarysHopeRoad Rosetta 4 3
Harcourts
$781,000
Sorell
PropertyMarketIndicatorSummary
PropertyMarket IndicatorSummary
Disclaimers
Incompilingthispublication,RPDataPtyLtdtradingasCoreLogichasrelieduponinformationsuppliedbya numberofexternalsources.CoreLogicdoesnotwarrantitsaccuracyorcompletenessandtothefullextent allowedbylawexcludesliabilityincontract,tortorotherwise,foranylossordamagesustainedbysubscribers, orbyanyotherpersonorbodycorporatearisingfromorinconnectionwiththesupplyoruseofthewholeor anypartoftheinformationinthispublicationthroughanycausewhatsoeverandlimitsanyliabilityitmayhave totheamountpaidtoCoreLogicforthesupplyofsuchinformation.
QueenslandData

BasedonorcontainsdataprovidedbytheStateofQueensland (DepartmentofResources)2023.InconsiderationoftheState permittinguseofthisdatayouacknowledgeandagreethatthe Stategivesnowarrantyinrelationtothedata(includingaccuracy, reliability, completeness,currencyorsuitability) andacceptsno liability (includingwithoutlimitation,liability innegligence)for anyloss,damageorcosts(includingconsequentialdamage) relatingtoanyuseofthedata.Datamustnotbeusedfordirect marketingorbeusedinbreachoftheprivacylaws.
SouthAustralian Data
ThisinformationisbasedondatasuppliedbytheSouthAustralian Governmentandispublishedbypermission. ©2023 Copyrightin thesupplieddatabelongstotheSouthAustralianGovernmentand theSouthAustralianGovernmentdoesnotacceptany responsibility fortheaccuracy,completenessorsuitability forany purposeofthepublishedinformationortheunderlyingdata.
New SouthWales Data
Containspropertysalesinformationprovidedunderlicencefrom theLandandPropertyInformation(“LPI”). RPDataPtyLtdtrading asCoreLogicisauthorisedasaPropertySalesInformation providerbytheLPI.
Victorian Data
TheStateofVictoriaownsthecopyrightinthepropertysalesdata andreproductionofthatdatainanywaywithouttheconsentof theStateofVictoriawillconstituteabreachoftheCopyrightAct 1968 (Cth).TheStateofVictoriadoesnotwarranttheaccuracyor completenessofthelicensedmaterialandanypersonusingor relyinguponsuchinformationdoessoonthebasisthattheState ofVictoriaacceptsnoresponsibility orliability whatsoeverforany errors,faults,defectsoromissionsintheinformationsupplied.
WesternAustralian Data
Basedoninformationprovidedbyandwiththepermission ofthe WesternAustralianLandInformationAuthority(2023)tradingas Landgate.
Australian Capital Territory Data
TheTerritory DataisthepropertyoftheAustralianCapital Territory.Nopartofitmayinanyformorbyanymeans (electronic,mechanical,microcopying,photocopying,recording orotherwise)bereproduced,storedinaretrievalsystemor transmittedwithoutpriorwrittenpermission.Enquiriesshouldbe directedto:Director,CustomerServicesACTPlanningandLand AuthorityGPOBox1908CanberraACT2601.
Tasmanian Data
Thisproductincorporatesdatathatiscopyrightownedbythe CrowninRightofTasmania.Thedatahasbeenusedintheproduct withthepermissionoftheCrowninRightofTasmania.TheCrown inRightofTasmaniaanditsemployeesandagents:
a) givenowarrantyregardingthedata'saccuracy, completeness,currencyorsuitability foranyparticular purpose;and
b) donotacceptliability howsoeverarising,includingbutnot limitedtonegligenceforanylossresultingfromtheuseofor relianceuponthedata.
BasedatafromtheLIST©StateofTasmania http://www.thelist.tas.gov.au
© 2023 CoreLogic No unauthorized use or disclosure. All rights reserved. CORELOGIC and the CoreLogic logo are New Zealand and Australian trademarks of CoreLogic, Inc. and/or its subsidiaries.


Mediaenquiries:media@corelogic.com.au
PropertyMarketIndicatorSummary


