12 minute read
Structural Testing
issues and advances related to structural testing
As cost pressures grow with regard to mounting systems for solar arrays, manufacturers look to module frames as a means to augment, or even replace, mounting structures. Practically, this makes sense. Module frames and mounting structures have traditionally been designed independently, neither taking into account the strength and stiffness contribution the other makes to the overall structure. Ignoring this interaction equates to inefficient design and wasted material. Put another way, properly integrating the module frame into the mounting structure should lead to a decrease in materials and the cost of the overall mounting structure. A fundamental requirement for developing an integrated solution, however, is a clear understanding of the characteristics and magnitude of the environmental loads the structure must safely resist. Unfortunately, in the case of wind loads, especially those on arrays mounted on flat rooftops, not much is known. Very little peer-reviewed research Why Current Module has been published and the building codes, e.g. Frame-Based Mounting ASCE 7, are largely silent on this issue. With no clear Systems are Inadequate standard, the industry is currently using a hodgepodge of approaches to estimate wind loads on The Challenge of these systems. These approaches include using Resisting High Localized a code based design methodology intended for roof surfaces or roof-mounted signs, relying on Wind Loads manufacturers’ wind-tunnel test results, or basing estimates on various computational fluid dynamic By Christopher Tilley, P.E. (CFD) simulations. These methods are fraught with potential problems and often result in widely different estimates of the wind loading. Over the last five years, SunLink has undertaken an extensive wind tunnel test program at the Boundary Layer Wind Tunnel Laboratory Christopher Tilley, P.E. is CEO of SunLink Corporation. Chris may be reached at ctilley@sunlink.com. at the University of Western Ontario (BLWTL) aimed at understanding, in great detail, the magnitudes and characteristics of wind loads on flat-rooftop mounted solar arrays. SunLink has measured surface pressures on many different types of arrays on various building configurations (see www.sunlink.com for more about this test program) and developed design curves for each array tested that appropriately envelope the largest measured pressures. The test procedures used to develop these curves followed the same methodology that was used as the basis for the rooftop load design curves in the ASCE 7 standard. All of the test results show the same consistent phenomenon: The maximum pressures measured on small surface areas (e.g. 20 ft2 or one typical module) are much greater than the maximum average pressures measured on larger surface areas (e.g. 300 ft2 or 15 modules). This reflects a fundamental characteristic of wind loading on building components and equipment, which is reflected in the prescribed code-design methodology. For small tributary areas (e.g. one roof panel), higher pressures must be used for design than for larger tributary areas (e.g. the area supported by a roof joist). In the case of rooftop structures for photovoltaic (PV) modules, this means that the structure supporting one module must be designed to resist the pressure expected for the tributary area of one module, or approximately 20 square feet. An array-roof connection intended to support 20 modules should be designed to resist the load implied by the tributary area of these 20 modules, or 400 square feet. An appropriate mounting system design needs to demonstrate that both of these requirements are met. In the case of rooftop PV systems, a nearly universally accepted design objective is to reduce the number of connections into the roof, or to reduce the weight of the PV system if ballast is used in the place of connections to resist wind loads. One way to achieve this result is to design a support structure that is stiff and strong enough to transfer loads across larger effective areas of the system. By doing this, the lower design pressure coefficients associated with larger tributary areas can be used to determine ballast requirements. Without a stiff and strong structure that interconnects each module, this strategy doesn’t work, and sufficient ballast must be deployed at each module to resist the maximum pressures that can be experienced for the tributary area of one module (20 ft2). SunLink’s testing clearly shows that the building code level pressures experienced by areas of 20 square feet are greater than 15 psf, even in mild wind environments. This leads to the conclusion that unless sufficient capacity can be shown in the surrounding structure, each module needs to have more than 15 psf of ballast to safely remain on the roof during a code level wind event, even in mild wind zones. Very few, if any, flat roof mounting systems in use today are ballasted with more than 15 psf. The implication is, therefore, that the structure that interconnects modules is providing the incremental capacity needed to make up for the deficiency in ballast. Unfortunately, calculations of this type are not typically being performed or required by building officials. Based on the magnitude of the wind loads measured in testing and the ballast configurations typically observed in use, it appears doubtful that many of the systems being deployed can demonstrate sufficient structural capacity needed to meet code-level requirements. This is especially the case for mounting systems that rely heavily on the module frame for structural capacity. Consider the following rooftop PV example that illustrates the issue and the reason to draw this conclusion:
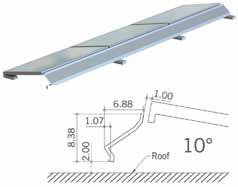
Figure 1: Drawing and model of system tested by SunLink.
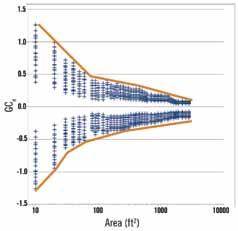
A 12-module-by-12-module array of the system depicted in Figure 1 was tested in the BLWTL on a standard flat roof building. Pressures were measured on all surfaces at a frequency and duration consistent with the test method accepted by the ASCE 7 standard. Pressure taps on the top and bottom of each surface were summed to provide net pressures. The maximum net pressures measured for different contiguous areas of modules were then calculated from the measurements. A design envelop was created from this testing using the same methodology as used in the ASCE 7 Standard and is shown in Figure 2. As can be seen from the curve, for one module area, the GCn coefficient for this system is 1.0. Per the ASCE Code, this GCn value is multiplied by the basic velocity pressure, qh to provide the design pressure, p= GCn*qh. For a 35-foot high building in a 90 mph 3 second gust speed wind zone and with open terrain around it, the basic velocity pressure would be 17.8 psf per ASCE 7. The design pressure for one module would therefore be 17. 8 psf (17.8* 1.0). For three modules, the GCn coefficient would be 0.6. So the design pressure that should be used for three interconnected modules on the same building would be 10.6 psf (17.8 * 0.6). For nine interconnected modules on the same building, the design pressure would be approximately 7.1 psf (17.8 *.4).

Figure 2: Panel + Shroud vertical area averaged net pressure coefficient constructed for use in ASCE 7 plotted vs. area.
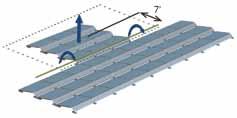
For 30 modules, the coefficient would be just above 2, giving a design pressure of 3.7 pounds. With a perfectly stiff and infinitely strong structure interconnecting 30 modules, a weight of 3.7 psf based on the module area (distributed appropriately) should be enough ballast for this system. With the same perfectly stiff and strong structure connecting nine modules, a weight of 7.1 psf in ballast should be enough to keep the system on the roof. Note that all of the calculations above represent unfactored 50 year loads. When designing the structure per ASCE 7, these wind loads would need to be factored by 1.6 and the weight would be reduced by 10% (i.e. the relevant load combination in ASCE 7 is 1.6W+0.9D). Calculation results can be seen in Table 1. To understand what these numbers mean for the structure of a real array, let’s look at the 3x3 group of modules within the dashed line in Figure 3 (page 12). Assuming that these 9 modules are ballasted to 5 psf, the design load for wind uplift on these modules would be 1240 pounds (11.4-5 * 0.9 = 6.9 psf; 6.9 psf * 20 ft2 * 9 modules). The connections between the three modules at the interface to the larger array need to be shown to have the capacity to resist the moment generated. If the 1240 pound load is assumed to be uniformly distributed, the
Table 1.
Number of Modules 1 3 9 30 GCn value for tributary area 1.00 0.60 0.40 0.23 Design Pressure (psf) 17.8 10.6 7.1 3.7 Factored Design Pressure per ASCE 7 (i.e. * 1.6) (psf) 28.4 16.9 11.4 6.0 Ballast Weight Required Per ASCE Load Combination (/.9) 31.6 18.8 12.7 6.6

Just Point, Shoot and Measure!
Remote Detection of Vibrations on Large and Distant Structures
Non-contact, optical vibration meas urement on civil structures for health monitoring and FE model validation ■ Long stand-off distance ■ True 0 Hz capabilities with mHz reso lution for low frequency response and displacement measurements ■ Easy targeting with integrated video camera ■ Easy set-up in minutes – no cabling or measurement point preparation ■ Sub-μm resolution – for reliable results ■ Small laser spot size – precise target ing, e.g. on cable-stayed bridges
Register for one or many seminars at the Polytec Web Academy at http://polytec.webex.com
Polytec GmbH 76337 Waldbronn · Germany www.polytec.com

Figure 3.
resulting moment around these connections is 8,680 ft-lbs (7ft * 1240). It is hard to imagine that the typical module frame can handle a 2900 ft-lb (8680/3) moment about one of its sides. Note that all of these calculations were based on a fairly benign wind environment. For higher wind zone regions, these numbers would be significantly larger. The numbers calculated for a 50-foot high building in a 120 mph wind zone and surrounded by open terrain can be seen in Table 2. The code-based design velocity pressure for this case would be 34.15 psf per ASCE 7. The design load on the 3x3 section of the array described above would therefore be 3,132 lbs (21. 9-5 * 0.9 = 17.4 psf; 17.4 psf * 20 ft2 * 9 modules). The resulting moment around the connections is now 21,924 ft-lbs (7ft * 3132), leaving each module frame to handle a 7,308 ft-lb moment about one of its sides (Figure 4).
Use of Deflectors and Shrouds
Note that, for this example, test data for a system that has shrouds (deflectors) was used. While this type of system provides better aerodynamics and lower overall net pressure coefficients compared to an open system (i.e. one without shrouds), it has a very significant potential drawback. One of the key aerodynamic mechanisms that accounts for the reduced net pressure coefficients is the shrouding, which extends down close to the roof and prevents wind from impinging on the underside of the modules. The aerodynamics of this type of system can change dramatically if the shrouding lifts off the roof, even locally (e.g. over one or two modules). As a result, shrouded systems need to have additional stiffness requirements when looking at the connections discussed above. Namely, not only does the frame connection need to have the strength to resist such a moment, it also needs to provide enough stiffness to keep the modules from rising even a few inches off the roof. SunLink has yet to see a module frame that can deliver this level of stiffness or strength.
The Importance of Proper Wind Tunnel Testing
If rooftop PV systems really do need to be designed to this magnitude of load, why are so many companies and engineers standing behind systems that are clearly short of the mark? A good deal of the problem lies in the type of wind tunnel testing that is being performed and the way the results of this testing are being applied (See Rooftop Solar Arrays and Wind Loading: A Primer on Using Wind Tunnel Testing as a Basis for Code Compliant Design per ASCE 7, available at the SunLink website). To illustrate a typical example, “fly-away” testing is used to determine the wind speed at which a small array first moves (“fails”). A conclusion is then drawn that this array can be placed safely on a roof as long as the design wind speed is less than the measured “failure” wind speed. To draw this conclusion, however, the shape, location and size of the array needs to be the same as that which is tested and, more importantly, the strength and stiffness characteristics of the model need to be properly scaled to match those of the actual array. Because this type of testing needs to be done at scales of 1:20 or smaller, this type of fidelity in the model is nearly impossible to achieve (imagine getting the structural characteristics of a 1 inch module clamp accurately represented in 3 dimensions at 1:20 scale). The likely error is that the model will, with proper scaling, be stiffer than the actual fullscale array. For a 30-module array that is particularly stiff, array movement will first
Table 2.
Number of Modules 1 3 9 30
GCn value for tributary area 1.00 0.60 0.40 0.21 Design Pressure (psf) 34.2 20.5 13.7 7.2 Factored Design Pressure per ASCE 7 54.6 32.8 21.9 11.4 (i.e. * 1.6) (psf)
Ballast Weight Required Per ASCE 60.7 36.4 24.3 12.7 Load Combination (/.9)

Figure 4: 7,308 ft-lb capacity for each side of the module frame.
occur in testing at a speed that is commensurate with the GCn coefficient that corresponds to a tributary area of 30 modules. As can be seen by the above analysis, this yields a much lower number than what is seen over smaller tributary areas. The result is that the higher pressures associated with smaller tributary areas are hidden by the testing, and therefore ignored in design.
Conclusion
Everyone in the solar industry is committed to the same goal – namely increasing the amount of clean, reliable, renewable energy produced in way that is both safe and cost effective. As the industry matures, we will need to create standards that assure the safety of these systems. SunLink’s research indicates that there is more work to be done in the area of wind loading.
Overview of SunLink’s R&D on Wind and Solar Arrays
Over the last 5 years, SunLink has performed over 1000 test runs on more than 75 different array and building models. • Effect tilt angle: 2°, 5°, 10°, 15°, 20°, 30°, 35° systems have been tested. • Effect of height off the roof or ground: various tests from 0 to 4-foot clearance. • Effect of spacing between rows: various tests with spacing between 2 and 4 times the height. • Effect of set-backs from roof edge: various tests from very close to the edge to distances of nearly twice the building height from the side of building. • Effect of deflectors/shrouds: various deflector designs and configurations applied to the arrays. • Effect of roof height: from 24 to 72-foot buildings. • Effect of panel height (chord length) from 3 feet to 15 feet. • Effect of arrays on roof surface loads. • Effect of combinations of the above.▪


