
Merle

Merle


Physical performance, fall risk and bone quality in patients with a recent fracture
Merle Rosan Schene
Colofon
Copyright © M.R. Schene, 2024
All rights preserved. No part of this thesis may be reproduced in any form or by any means without written permission from the author, or, when appropriate, from the publisher of the publication.
Cover design: Luc Dinnissen (studio ds)
Layout: Mijn Proefschrift | www.mijn-proefschrift.nl
Production: Ipskamp Printing, Enschede
ISBN: 9789083380063
The work described in this thesis was supported by Stichting The Weijerhorst and Wetenschapsfonds VieCuri. Dissemination of this thesis is financially supported by Maastricht University.
Physical performance, fall risk and bone quality in patients with a recent fracture
voor het behalen van de graad van Doctor aan de Universiteit van Maastricht, onder gezag van de Rector Magnificus, Prof. dr. P. Habibović, overeenkomstig met het besluit van het College van Decanen, in het openbaar te verdedigen op dinsdag 11 februari 2025, om 13:00 uur
door
Rosan Schene
Promotor
Prof. dr. J.P. van den Bergh VieCuri Medisch Centrum Venlo/Universiteit Maastricht/Maastricht UMC+
Copromotores
Dr. C.E Wyers Universiteit Maastricht/VieCuri Medisch Centrum Venlo
Dr. H.C. Willems
Beoordelingscommissie
Voorzitter:
Amsterdam Universitair Medisch Centrum, Universiteit van Amsterdam
Prof. R.A. De Bie Universiteit Maastricht
Leden:
Dr. S.P.G Bours Maastricht UMC+
Prof. M.H. Emmelot-Vonk Universiteit Utrecht
Prof. N. van der Velde
Amsterdam Universitair Medisch Centrum, Universiteit van Amsterdam
and Ageing 2023; 52: 1–9
Chapter 3 PPI use is not associated with bone microarchitecture and strength assessed with HR-pQCT after three-years followup in patients visiting the Fracture Liaison Service
Bone 2024, 182: 117066
Chapter 4 Physical performance and sarcopenia assessment in patients with a recent fracture visiting the Fracture Liaison Service
Osteoporosis International 2024, 35: 851–862
Chapter 5 Physical functioning in patients with a recent fracture: The “can do, do do” framework applied to explore physical capacity, physical activity and fall risk factors
Calcified Tissue International 2023, 113: 195–206
Chapter 6 The “can do, do do” framework applied to assess the association between physical capacity, physical activity and prospective falls, subsequent fractures, and mortality in patients visiting the fracture Liaison service 135 Journal of Personalized Medicine 2024, 14, 337
(μ)FE (micro-) finite element analysis
(95%-) CI (95%-) confidence interval
6 MWT 6 minute walking test
aBMD areal bone mineral density
ADL activities of daily living
ALM appendicular lean mass [ALM/m2]
AOM anti-osteoporosis medication
ATC anatomical therapeutic chemical
ASBMR American society of bone and mineral research
BL baseline
BMD bone mineral density
BMI body mass index
CI confidence interval
CICR cumulative incidence competing risk
CKD chronic kidney disease
COPD chronic obstructive pulmonary disease
CPRD clinical practice research datalink [GOLD]
Ct.Ar cortical bone area [mm2]
Ct.BMD cortical bone mineral density [mg HA/cm3]
CtF capture the fracture
Ct.Po cortical porosity [- or %]
Ct.Po.Dm cortical pore diameter [mm]
Ct.Th cortical thickness [mm]
DA dynamic activity
DM diabetes mellitus
DXA dual-energy X-ray absorptiometry
ED emergency department
EFORT European federation of national associations of orthopaedics and traumatology
eGFR estimated glomerular filtration rate
ER emergency room
EULAR European league against rheumatism
EWGSOP European working group on sarcopenia in older people
FL failure load [N or kN]
FLS fracture liaison service
FRID fall risk increasing drug
GP general practitioner
HGS handgrip strength
HTh hyperthyroidism
HPT hyperparathyroidism
HR-pQCT high-resolution peripheral quantitative computed tomography
ICD international statistical classification of diseases
IOF international osteoporosis foundation
IQR interquartile range
IR incidence rate
IRR incidence rate ratio
KPI key performance indicator
LPA low physical activity
LSC least-significant change
METS metabolic equivalents
MGUS monoclonal gammopathy of unknown significance
MOF major osteoporotic fracture
MVPA moderate to vigorous physical activity
NSAID non-steroidal anti-inflammatory drug
PA physical activity
PC physical capacity
PPI proton pump inhibitor
PY person years
RR relative risk
S stiffness [kN/mm]
SD standard deviation
SECOB secondary osteoporosis and metabolic bone disease
T0 baseline
T3 3-year follow-up
Tb.Ar trabecular bone area [mm2]
Tb.BMD trabecular bone mineral density [mg Ha/cm3]
Tb.BV/TV trabecular bone volume fraction [- or %]
Tb.1/N.SD trabecular heterogeneity [mm]
Tb.N trabecular number [mm-1]
Tb.Th trabecular thickness [mm]
Tb.Sp trabecular separation [mm]
TMD tissue mineral density of the total bone region [mg HA/cm3]
Tt.Ar total bone area [mm2]
Tt.BMD total bone mineral density [mg HA/cm3]
TUG timed up and go
UK United Kingdom
(v)BMD (volumetric) bone mineral density
VPA vigorous physical activity
VF vertebral fracture
VFA vertebral fracture assessment
WHO world health organization
WMO medical research involving human subjects act (Dutch: Wet medisch-wetenschappelijk onderzoek met mensen)


The global population is aging rapidly. In 1950, approximately 5% of the world’s population was aged 65 years or older.1 In 2022 this was 10% and this number is projected to increase to 16% by 2050.1, 2 In the European Union, the proportions are even higher; approximately 9% in 1950 and 30% in 2050, respectively.1 With these life-years gained, the need for active and healthy aging of older persons is paramount for their wellbeing and active engagement in society to live a healthy and fulfilled life.3 On a societal level, healthy aging has large scale economic implications in terms of public health care expenditure and longterm care costs.4 In the Netherlands, healthcare costs are expected to double between 2015 and 2040.5 The proportion of healthcare costs specifically for older persons, is expected to increase from 44 to 59% of the total budget, respectively.5 The incidence of several diseases, such as dementia, ischemic heart disease and chronic obstructive pulmonary disease (COPD) increases with age.6 As the population ages, the incidence of falling and fall related injuries, such as fractures have also risen in the last years.7 Fractures cause an increasing health concern as they are an important cause of immobility, decreased physical independence, high morbidity, and a decrease in quality of life.8 For instance, the one-year mortality rate after hip fracture is approximately 20%, and increases with age.9 Hip fractures rank 23rd on the list of the most expensive diseases in the Netherlands, accounting for roughly 607 million euro each year.10 Therefore, hip fractures alone account for higher healthcare costs than heart failure, hypertension or pneumonia. The lifetime risk of sustaining a fracture after the age of 50 is approximately 20% for men and 50% for women.11, 12 In the Netherlands in 2016, the incidence of fractures in persons aged 50 years and older was estimated to be 120.000.13, 14 Incident fractures are an important risk factor for subsequent fractures;15 individuals over 50 years of age with a fracture have a two-fold higher lifetime risk of subsequent fractures.16, 17 This risk is highest in the first two years (relative risk of 5) after the initial fracture and decreases thereafter.17-20 This phenomenon has been labelled as an “imminent (subsequent) fracture risk”.17, 21, 22 Consequently, a large proportion of the fracture burden in the 50+ age group is caused by subsequent fractures. Therefore, healthcare services should focus both on adequate primary and secondary fracture prevention. The objective of this thesis is to enhance the understanding of fall and fracture risk factors that are relevant for secondary fracture prevention.
Why does one person fracture when they fall, and another one does not? A fracture occurs when the external force applied to a bone exceeds its
strength.23 To avoid a fracture, bone must be stiff, so that it does not bend when loaded. However, bones must be able to absorb the energy imposed by loading; they must also be flexible.24 In terms of bone properties, a low bone mineral density (BMD) is considered a major fracture risk factor and an important answer to the question “who fractures?”. Osteoporosis is “a disease characterized by low BMD and microarchitectural deterioration of bone tissue, leading to enhanced bone fragility and consequent increase in fracture risk”.25 Osteoporosis can be divided into primary and secondary types. Bone loss due to age and oestrogen deficiency accounts for primary osteoporosis. Causes of secondary osteoporosis and other metabolic bone diseases (SECOB) include chronic kidney disease (CKD), diabetes mellitus (DM), COPD, rheumatoid arthritis, primary hyperparathyroidism, intestinal bowel disease, hyperthyroidism, nutritional deficits such as low calcium intake and vitamin D deficiency and drug-induced osteoporosis, such as glucocorticoid-induced osteoporosis, among others.26 For many years, the most common technique to diagnose osteoporosis is the assessment of areal BMD (aBMD) by dual-energy X-ray absorptiometry (DXA). DXA measurement provides T-scores of BMD measurement; the number of standard deviations [SD] from the mean BMD for a healthy 30 year old female, at the lumbar spine, femoral neck or total hip.27 The WHO definition states that osteoporosis is diagnosed if the lowest T-score of the three locations is ≤ -2.5 and osteopenia is defined as a BMD between a T-score of -2.5 to -1 SD.28 Low BMD is a risk factor for fracture and BMD measurements are therefore of major importance for the assessment of fracture risk and remain the current gold-standard.29 However, it does not fully explain the occurrence of fractures in terms of bone properties. In the past decade, research has also focused on the assessment of other bone properties that are associated with increased fracture risk,30 such as structural properties (e.g. spatial arrangement of the bone material) including bone microarchitecture and strength.30, 31 The structure of bone has a cortical and trabecular component with their own microarchitectural properties; the cortical bone forms the dense outer layer of the bone, and the trabecular bone forms the inner layer of the bone with a porous honeycomb like structure (the trabeculae).32 High Resolution peripheral Quantitative Computerized Tomography (HR-pQCT) imaging is a recently developed technique to measure bone microarchitecture and bone strength in vivo.31 It provides 3D X-ray based imaging of BMD and bone microarchitecture in both cortical and trabecular compartments of the peripheral skeleton, at the distal radius and tibia.33 Moreover, using (micro-) finite element analysis (μ)FE, a computer modeling technique that simulates boneload bearing, bone stiffness (resistance to deformities) can be calculated and failure load can be estimated.33 HR-pQCT measurements have provided new insights into pathophysiological mechanisms in skeletal structures, for instance due to metabolic bone disease, the use of anti-osteoporotic medication (AOM) and fracture prediction.31, 33 In this thesis, we use HR-pQCT measurement to
further explore fracture risk factors in patients with a recent fracture.
A fracture due to osteoporosis is commonly called an “osteoporotic fracture” or a “fragility fracture”. The definition of osteoporotic fracture in the literature varies.34 Some adhere strictly to the WHO T-score definition of an osteoporotic fracture. Others have defined any low-energy trauma fracture as an osteoporotic fracture.34 However, also with high energy trauma, osteoporotic patients appear to fracture more often compared to those without osteoporosis.35 In a large study of osteoporosis in Europe (SCOPE-21) osteoporotic fractures were defined as “sites of fracture that increase in frequency the lower the BMD and the incidence of which increase progressively with age after the age of 50 years”.36 The most well-known fracture categorisation based on this definition is that of major osteoporotic fractures (MOF), namely hip, vertebral, distal radius and proximal humerus fractures, versus non-MOF fractures (all other fractures).37 However, in addition to MOF, multiple rib, pelvis, other femoral and tibial fractures are associated with a low BMD.36 The definitions of osteoporosis, osteoporotic fractures, and BMD thresholds are important, as these measures, combined with absolute fracture risk calculations, have been used to guide intervention thresholds.38-40 However, osteoporosis in terms of a BMD threshold only accounts for a minority of the fractures (18%-26%) and only 30-40% of patients who were evaluated for secondary fracture prevention were diagnosed with osteoporosis, while the majority was diagnosed with osteopenia.26, 41, 42 Thus, other groups of fracture categorizations may be useful, for instance, based on clinical outcomes. In this thesis we used two categorizations of fractures: the MOF and the categorization according to Center et al. The latter categorizes fractures based on post-fracture mortality risk into four groups: 1. hip fractures, 2. major fractures; vertebra, multiple rib, proximal humerus, pelvis, femur (non-hip) and proximal tibia, 3. minor fractures; and 4. finger and toe fractures.43
A large diagnostic and treatment gap exists in osteoporotic care and in secondary fracture prevention.8 In Europe in 2019, 25.5 million females and 6.5 million males were estimated to have osteoporosis and 4.3 million persons had an osteoporotic fracture.36 However, a minority of patients with osteoporosis or a recent low-trauma fracture receive diagnostic work-up and treatment.8, 44 The country-specific treatment gap for osteoporosis is estimated to range from 31% to 86% depending on the European country.8 In the majority of countries, the treatment gap has increased since 2010.36 As stated, the risk of a subsequent fracture is at least doubled after an initial fracture, and this risk is highest in the first few years after the fracture.15, 17, 45 Therefore, prompt
secondary fracture prevention is recommended for all patients over 50 years of age who have sustained a recent clinical fracture.29, 46, 47 However, the proportion of the 120.000 Dutch 50+ fracture patients who were referred for DXA assessment in 2016 was only 26.3%. It is estimated that approximately half of the fracture patients gets offered an evaluation by their care giver and half of the referred patients attends the DXA evaluation.14, 48 Therefore, a large part of fracture patients does not receive adequate evaluation and secondary fracture prevention.
To close the treatment gap, post-fracture care is optimally organized in Fracture Liaison Services (FLSs).49, 50 The concept of the FLS was first reported in 199951 as a concept of integrated fracture care with a standardized systemic evaluation of fracture risk factors, together with personalized subsequent fracture prevention based treatment.51-53 Invited to the FLS are all men and women over the age of 50 years who presented with low trauma fractures (defined as those sustained in falls from standing height or less). Patients with skull and facial fractures and fractures sustained in high energy trauma were not routinely offered assessment, because these fractures were not considered to occur as a consequence of osteoporosis.51 Over the years, the core organizational structure of the FLS has remained largely similar, but important improvements have been made. In 2012, a 5-step program for optimal fracture prevention has been proposed (Figure 1)54: step 1. the attention to education and motivation of the patient to emphasise the importance of FLS attendance. Step 2. recommendations on the detailed systemic assessment of the patient in the fracture risk evaluation, including evaluation of medical history and medication use, clinical risk factors, assessment of dietary intake of vitamin D and calcium. Further, it includes a BMD and vertebral fracture assessment (VFA) by DXA, fall risk assessment, and in step 3 evaluation of contributors to SECOB. Step 4. gives recommendations on a multifactorial treatment with lifestyle interventions, treatment of contributors to SECOB and falls prevention in addition to calcium and vitamin D suppletion and treatment with AOM. Step 5. Lastly, recommendations on follow-up are given with a focus on treatment adherence and response.
FLS care has shown to effectively reduce the risk of subsequent fractures and mortality.53 Importantly, FLS care has been proven cost-effective.34, 55, 56 In the past decade, several international societies including the International Osteoporosis Foundation (IOF) in the Capture the Fracture (CtF) campaign, American Society of bone and Mineral research (ASBMR), European League Against Rheumatism (EULAR) and the European Federation of National
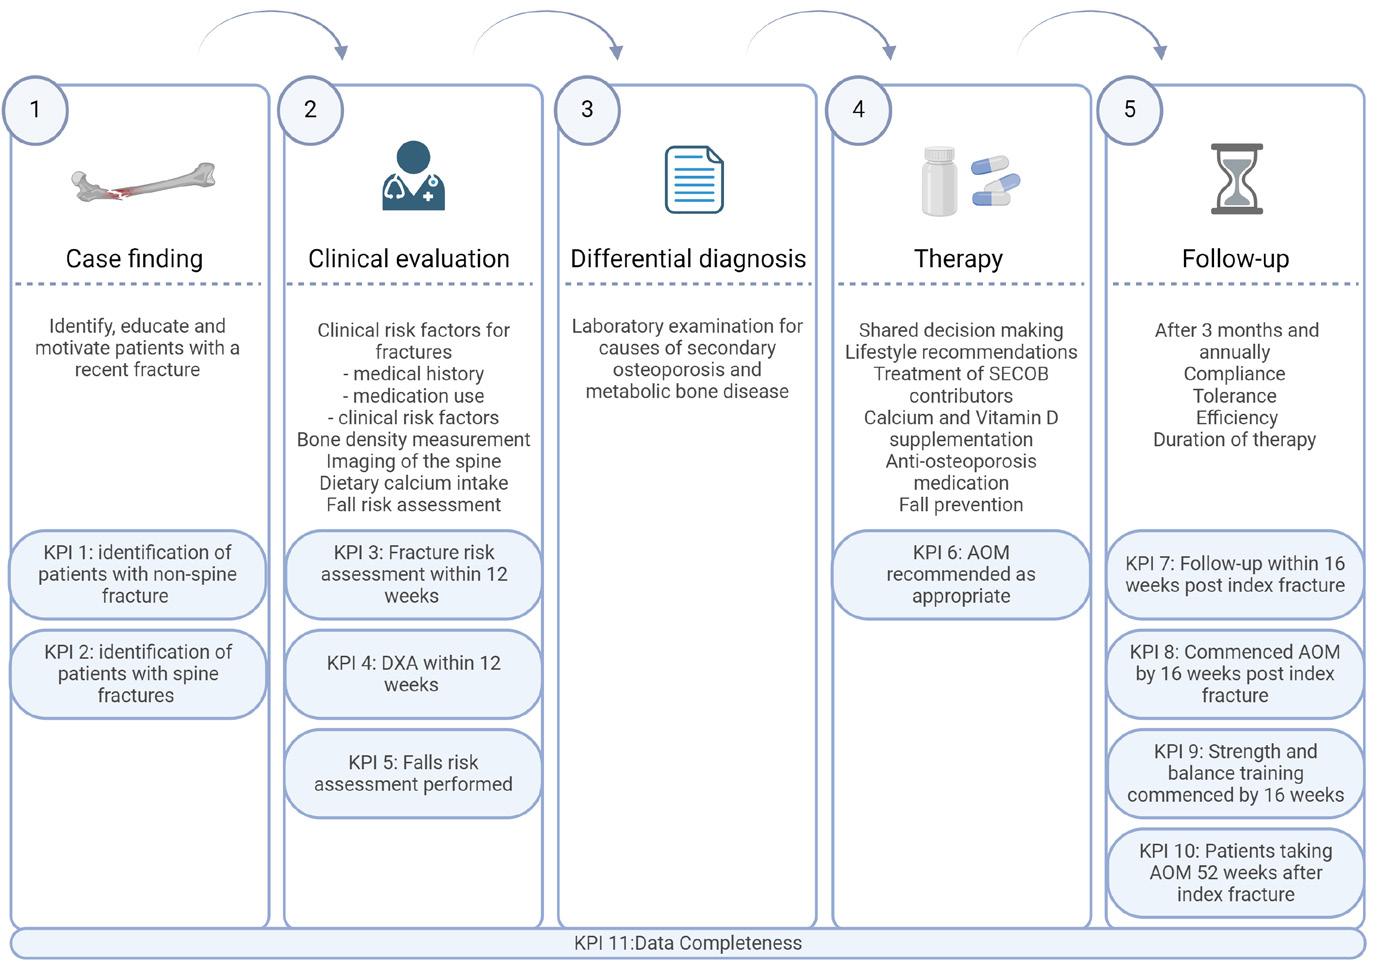
Associations of Orthopaedics and Traumatology (EFORT) have recommended the use of the FLS model to optimize post-fracture care.34, 50, 57, 58 In 2020, a set of Key Performance Indicators (KPI) was published by the Capture the Fracture framework as a guidance for the FLS clinics, measure fracture care delivery at the patient level and guide clinicians in a systematic, uniform approach52 (Figure 1). To adequately interpret the research within the FLS field, it is important to note that the FLS population is a selection of the total fracture population in several ways; as stated, only people 50 years or older with a fracture are invited for fracture risk evaluation, and not al invited fracture patients respond to the invitation.
FLS patients are at high imminent risk of subsequent fractures. Therefore, is important to evaluate a patient in terms of predictors of subsequent fractures. Of Dutch fracture patients, 16% sustains a subsequent fracture in the first 5 years after fracture.17 A quarter of these subsequent fractures occurs in the first year after the initial fracture.17 Importantly, this means that at least 80% does not sustain a subsequent fracture. However, currently no FLS specific models exist to predict which patient is at highest risk, as predictors from population
studies are not always discriminative in the FLS population. Therefore, more research is needed to differentiate which patients are at highest risk. Currently, most fracture prediction tools are developed in general older (nonfracture) populations and do not consider imminent risk. A common element is that most fracture prediction tools use a combination of history of fracture and BMD measurement (if available) and clinical risk factors for fracture risk prediction.59 The most widely used tool is the FRAX tool which predicts 10year fracture risk of major osteoporotic fractures (MOF) and hip fractures (frax. shef.ac.uk/FRAX/).60 Besides aBMD, FRAX includes clinical risk factors such as age, sex, BMI, smoking, (family) history of fracture and use of glucocorticoids.60 Other fracture risk tools are the Garvan fracture risk calculator61, 62 and the QFracture.63, 64 The Garvan tool provides 5- and 10-year risk calculations and includes the number of falls in the last 12 months as one of the main predictors. QFracture provides a yearly fracture risk for the next 10 years and includes a wide range of clinical risk factors, including falls in the last 12 months.64, 65
In the last few years, the scientific field has started to focus on predicting time-dependent fracture risk by exploring specific imminent fracture risk factors.66 Some describe “imminent fracture risk” in general or osteoporotic populations,67-74 for instance to assess predictors of short-term fracture risk in non-fracture patients, while other studies have evaluated the imminent fracture risk in fracture populations and assess time-dependence of subsequent fracture incidence and its determinants,20, 22, 75-81 effectively studying “imminent subsequent fracture risk”. This last group of studies is particularly important for FLS care. Predictors of imminent subsequent fracture risk that have been identified include: age, sex, incident fracture type, BMI and history of falls.20, 75, 81
Fracture assessment = fall risk assessment
A fall is defined as an event that results in a person coming to rest inadvertently on the ground, floor, or other lower level.82 Approximately 30% of people older than 65 years fall at least once a year,83, 84 and 10-15% falls at least twice a year.85, 86 Depending on the definition, registration and reporting of injurious falls and the demographics of the included population, 3-60% of falls results in injury (injurious falls),87, 88 of which about 2.5-15% result in a fracture.87, 89 In patients 65 years and older, up to 90% of all fractures are caused by a fall.88 The importance of falls prevention in secondary fracture prevention has increased over the past few decades.81 As shown in figure 1, fall risk assessment and intervention is advised to be a part of FLS care.57 Contrarily, at many FLSs fall risk assessment is not yet routinely performed and consequent referral to fall risk intervention programs is still too low.90, 91 A possible explanation is that consensus on what this falls assessment should entail is lacking; which
determinants are discriminative for future injurious falls? Which assessment instrument or approach should be used to adhere to KPI-5? What is the minimum standard of care? And what are effective intervention strategies? Thus, the form and degree of falls assessment implementation varies widely between FLS clinics.52, 57, 90 The recommendations of many guidelines do not provide clinicians with hands on information on the implementation of fall risk assessment and intervention strategies, especially in those under 65 years of age.52, 58, 92, 93 For example, KPI-9, which scores the implementation of falls interventions, solely scores based on initiation of strength and balance training. While these are important, they do not account for the many other patient characteristics that are recommended in a multifactorial falls assessment and interventions, such as sensory deprivation and use of fall-risk-increasing drugs.94 Therefore, it is essential to gain more insight into fall risk factors in FLS patients specifically. In this thesis we aim to add to the current knowledge on fall risk factors in FLS patients and its association with clinical outcomes.
Fall risk factors in fracture prediction, what do we know?
Fall-related risk factors in osteoporotic populations
In osteoporotic patients, a history of falls was found to be one of the most important risk factors for a fracture in the next 12 months,67, 69, 70 and has been proven to predict incident fractures independently of FRAX probability. This is not surprising, as FRAX does not include falls history63, 95 and it leads to an approximately 30% underestimation of the calculated FRAX 10-year hip fracture probability for each fall.96 Recently, the predictors of imminent fracture risk have been studied in osteoporotic patient populations. These studies describe fall risk factors and bone-related risk factors. Fall-related risk factors that predict fractures include specific comorbidities such as cardiovascular disease, dementia, use of fall-risk-increasing drugs, decreased physical functioning, and wheelchair use also shows significant associations with 1-year fracture risk.67, 69, 70, 74 Thus, the importance of fall risk factors in fracture prediction is evident, although many are not included in fracture risk prediction tools.
Fall risk factors in patients with a recent fracture
Compared to osteoporotic and general older populations the fracture population is especially prone to fall; the majority have proven to have a history of falls, and a previous fall is the most important risk factor for a future fall.97, 98 As expected, individuals who have experienced fractures are more likely to have a high prevalence of fall risk factors and a high fall incidence after fracture.41, 88, 97, 99 A study of 512 consecutive FLS patients was conducted over a period of three months. During this period, already 15% of the patients reported experiencing
a fall, with only 1% reported sustaining a new fracture.100 The most important risk factors for a fall included female sex, ADL difficulties, polypharmacy and orthostatic hypotension. In a recent study of Vranken et al.,97 FLS patients were followed for 3 years. This study showed that subsequent fractures were primarily caused by a fall.Importantly, patients who fell ≥1 time after the initial fracture that prompted the FLS visit, had a 9-fold risk of sustaining a subsequent fracture, despite treatment with AOM according to the Dutch guideline.46 In the past decade, several studies in fracture patients assessed fall related risk factors when exploring determinants of imminent subsequent fracture risk. Fall history in the last 12 months, specific comorbidities, such as heart failure and epilepsy and use of fall-risk-increasing drugs were found to be associated with imminent subsequent fractures.20, 79, 81, 101 Other risk factors that might be of importance, specifically in fracture populations, include mobility issues, medication use, pain and decreased physical functioning.71, 73, 101, 102
Imminent fracture risk or imminent fall risk?
As stated, there is an imminent subsequent fracture risk after an initial fracture. Given the importance of falls as a cause of subsequent fractures, the imminent fracture risk might be explained, at least partially, by an imminent fall risk. Two studies already suggested this hypothesis; in the study of Vranken et al. a higher incidence of first falls was found in the first year after fracture compared to later years (40% in the first year, 20% in the second, and 20% in the third year).97 This high short-term annual fall incidence rate after an initial fracture was also found in a population-based study in Hong Kong. Here, the fall incidence declined steadily during the first five years after fracture.76 To the best of our knowledge, these studies were the only studies to assess the time-dependence of fall risk after fracture and limited to small97 or very old76 fracture populations. Given this scarce evidence in literature, it is important to gain more knowledge on fall incidence and timing and to study the fall related risk factors in patients with a recent fracture.
PPI use and fracture risk
Proton pump inhibitors (PPIs) are considered one of the risk factors for future fractures.103-105 Although PPI’s are generally considered safe to use,106, 107 a potential increased fracture risk may cause concern, since many individuals use PPI in daily life, especially since this medication is available over the counter. Therefore, caution is advised regarding the risk of fractures, according to osteoporosis guidelines and pharmacotherapeutic best practices.47, 103,
104, 108-111 Potential biological mechanisms that could cause bone related side effects of PPI use include a decreased calcium and vitamin B12 absorption and hypergastrinemia,103, 112 or interference with osteoclastic and osteoblastic functioning, all resulting in altered bone turnover.103, 113, 114 Nevertheless, the association between PPIs and a loss of BMD remains controversial,103, 109 and the association with bone structure and strength remains unclear. Associations between PPI use and aBMD (measured by DXA) or bone geometry, volumetric BMD and strength (measured by peripheral quantitative CT scanners) are inconsistent.109, 115-120 In a cross-sectional study, PPI use was not associated with decreased bone microarchitecture and strength measured by HR-pQCT.121 However, PPI use, bone microarchitecture and strength measured by HR-pQCT have never been assessed prospectively, nor have they been evaluated in the group with the highest risk of future fractures.
Although it is known that fracture patients have a high fall risk, little is known about the fall risk profile in an FLS population and the predictors of falls and fall-related subsequent fractures. One of the modifiable fall risk factors is physical performance. Evaluation of strength and physical performance is one of the main facets of a fall risk assessment, and typically encompasses muscle strength, balance and gait evaluation.94 Performance on these domains can be quantified by several performance tests, such as handgrip strength (HGS), the timed-up and go test (TUG), the 30 second chair stand test (30CST) and measurements of gait or walking ability.122 Fracture populations have lower physical performance after fracture.102 This lower performance after fracture might partly explain the cause of the fall and fracture, but it is also possible that performance after fracture deteriorates further because of immobilization, fear of falling and pain.102 In general (older) populations, an abundance of literature is available on physical performance tests in terms of normative values and test-reliability. Some performance tests show predictive ability for adverse health outcomes, such as fractures.123-125 However, in fracture populations, large heterogeneity exists among studies of physical performance; many studies include only one fracture type or one of the sexes. Furthermore, most studies focus on an older population and do not include 50-65 year olds.102 Therefore, caregivers at the FLS lack a comprehensive overview of the physical performance of patients at the time of FLS evaluation, most importantly including the ‘younger’ patients with a fracture, and patients with a broad range of fracture types. This complicates identification of patients that are eligible for fall risk assessment and intervention.
Next to a paucity of data on baseline muscle strength and physical performance, another problem that clinicians encounter is the scarcity of studies that associate physical performance measures with clinical outcomes in fracture populations, and more specifically FLS populations. During clinical
evaluation at the FLS, resources and testing time are limited and expensive. Therefore, guidance in the decision which tests to perform is essential. In the general older population, a combination of balance and gait tests is advised, but there is no consensus on the optimal test for use in fall or fracture risk prediction.123, 126-129 For individuals with a recent fracture, the main question remains: does performance on these tests differentiate between who will fall and who will fracture again, in a population already burdened with a history of falls and fractures?
Several physical performance instruments measure physical performance with more than one test on either one or more domains. Multidomain instruments, such as the short physical performance battery (combining balance, gait and lower extremity testing),130 or dual tasks tests (evaluating the role of cognition, the dual task, in gait assessment,131 might be beneficial in providing a more comprehensive insight of physical performance of a patient and may also be of use in developing individually targeted interventions.131 A recent initiative in multidomain testing is the “can do, do do” framework presented by Koolen et al.132 This framework combines physical capacity (PC), measured by 6 minute walking test (6MWT) and physical activity (PA) measures into four domains based on predefined cut-off scores for poor performance: (1) low PC, low PA “can’t do, don’t do”; (2) preserved PC, low PA “can do, don’t do”; (3) low PC, preserved PA “can’t do, do do”; (4) preserved PC, preserved PA “can do, do do”. Several studies have applied this concept to different patient populations with COPD or asthma.132-135 The framework has not yet been applied to fracture patients, but might be of added benefit in differentiating these patients into groups with specific fall and fracture risk factors. Thus, this framework might be useful in establishing risk profiles for patients with a recent fracture in terms of relevant clinical outcomes such as falls, subsequent fractures and mortality.
Study cohorts used in this thesis
In this thesis we used data from three cohorts.
In chapter 2 data from the Clinical Practice Research Datalink (CPRD) GOLD database was used. The dataset comprises routinely recorded computerized medical data from over 650 general practices in the United Kingdom (UK)136 of approximately 7% of the UK population. The data has been shown to be largely representative of the UK population in terms of age, sex and ethnicity.136, 137 Registrations in CPRD have shown high validity for hip and vertebral fractures diagnosis138 and has been proven to be fairly accurate for mortality.139, 140
FLS cohort
This cohort included all consecutive patients who were invited to the FLS at the VieCuri Medical Center between November 2013 and June 2016. As part of usual care, adults of 50 years or older, with a recent, radiologically confirmed, clinical fracture were screened and invited for fracture risk evaluation. Patients were not invited when living outside of the FLS region, had facial fractures, fractures due to high-energy trauma, prosthetic failure, bone metastasis or osteomyelitis. At the FLS, patients were evaluated and treated according to the Dutch guidelines for osteoporosis and fracture prevention.29 Data on demographics, comorbidities, risk factors for fracture, osteoporosis and falls were obtained by questionnaire during the FLS visit. Furthermore, blood sampling, BMD measurement using DXA and VFA using lateral spine images acquired with DXA and physical functioning tests were performed. In chapter 4 data from the FLS cohort are used.
FX MoVie cohort
The FX MoVie cohort is a subset of the FLS cohort and based on a prospective cohort study including 500 participants. The primary objective of the FX MoVie study was to assess physical activity, bone structure parameters and bone strength in relation to falls, subsequent fractures and mortality. At the FLS, patients were asked if they were willing and able to participate in the 3-year prospective study. Excluded from participation were non-Dutch speaking persons, non-Caucasians and patients with cognitive impairment. Additional measurements for FX MoVie participants included accelerometer assisted physical activity measurement and bone imaging using HR-pQCT. Followup was carried out at 3 and 6 months and 1 year, 2 years and 3 years after inclusion. Follow-up included subsequent fall, subsequent fracture and mortality incidence, changes in medical history, medication use, physical performance measures and repeat HR-pQCT evaluation. In chapter 3, 5 and 6 data from the FX MoVie study are used.
Aims and outline of this thesis
In this thesis, we aim to explore risk factors for falls and subsequent fractures in patients with a recent fracture. In chapter 2 we explore if fall risk is time-dependent after a recent fracture in the CPRD population. In chapter 3 we study changes in bone microarchitecture and strength in PPI users compared to non-users in a 3-year prospective study in FLS patients, using high-resolution peripheral quantitative CT (HRpQCT). In chapter 4 we provide a comprehensive overview of the physical performance of FLS patients by comparing measures of several performance tests. In chapter 5 we aim to assess the physical capacity and physical activity
measures of FLS patients and to categorize physical performance using the “can do, do do” framework. Subsequently, in chapter 6 we aim to study the association of physical capacity and physical activity domain categories with prospective falls, subsequent fractures, and mortality in FLS patients.
In chapter 7 we provide a general discussion of our findings, including future perspectives for clinical practice and research. In chapter 8 we summarize our findings and in chapter 9 we discuss the scientific, clinical and societal impact of our findings.
1. European Environment Agency. Population trends 1950 – 2100: globally and within Europe. European Environment Agency,. 2021 https://www.eea. europa.eu/data-and-maps/indicators/totalpopulation-outlook-from-unstat-3/assessment-1 Accessed April 16th 2024.
2. The World Bank. Population ages 65 and above (% of total population). 2022 https://data.worldbank. org/indicator/SP.POP.65UP.TO.ZS Accessed April 20th 2024.
3. GBD 2019 Ageing Collaborators. Global, regional, and national burden of diseases and injuries for adults 70 years and older: systematic analysis for the Global Burden of Disease 2019 Study. Bmj. 2022;376:e068208.
4. Commission E. The 2018 ageing report: economic and budgetary projections for the EU member states (2016–2070). Institutional Paper No 79 Luxembourg: Publications Office of the European Union. 2018;
5. Rijksinstuitut voor Volksgezondheid en Millieu. Volksgezondheid Toekomst VerkeningZorguitgaven. 2018 https://www.vtv2018.nl/ zorguitgaven Accessed March 7th 2024.
6. Le Couteur DG, Thillainadesan J. What Is an AgingRelated Disease? An Epidemiological Perspective. J Gerontol A Biol Sci Med Sci. 2022;77:2168-2174.
7. VeiligheidNL. Letsels 2022 - Kerncijfers Letsels in Nederland. 2022 https://www.veiligheid.nl/sites/ default/files/2023-11/lis_kerncijfers_letsels_2022. pdf Accessed February 14th 2024.
8. Willers C, Norton N, Harvey NC, et al. Osteoporosis in Europe: a compendium of country-specific reports. Arch Osteoporos. 2022;17:23.
9. Bliuc D, Alarkawi D, Nguyen TV, et al. Risk of subsequent fractures and mortality in elderly women and men with fragility fractures with and without osteoporotic bone density: the Dubbo Osteoporosis Epidemiology Study. J Bone Miner Res. 2015;30:637-646.
10. VZinfo. Ranglijsten | Aandoeningen op basis van zorguitgaven. 2022 https://www.vzinfo. nl/ranglijsten/aandoeningen-op-basis-vanzorguitgaven Accessed March 7th 2024.
11. Kanis JA, Johnell O, Oden A, et al. Long-term risk of osteoporotic fracture in Malmö. Osteoporos Int. 2000;11:669-674.
12. van Staa TP, Dennison EM, Leufkens HG, et al. Epidemiology of fractures in England and Wales. Bone. 2001;29:517-522.
13. VeiligheidNL. Kosten van osteoporotische
fracturen in Nederland. VeiligheidNL. 2021 https://www.veiligheid.nl/sites/default/ files/2022-05/Rapport%20Kosten%20van%20 osteoporotische%20fracturen.pdf Accessed April 8th 2024.
14. Zorginstituut Nederland. Zinnige Zorg - Verbetersignalement Osteoporose. Zorginstituut Nederland. 2020 https:// www.zorginstituutnederland.nl/publicaties/ rapport/2020/08/11/zinnige-zorgverbetersignalement-osteoporose Accessed May 5th 2024.
15. Klotzbuecher CM, Ross PD, Landsman PB, et al. Patients with prior fractures have an increased risk of future fractures: a summary of the literature and statistical synthesis. J Bone Miner Res. 2000;15:721-739.
16. Kanis JA, Johnell O, De Laet C, et al. A metaanalysis of previous fracture and subsequent fracture risk. Bone. 2004;35:375-382.
17. van Geel TA, van Helden S, Geusens PP, et al. Clinical subsequent fractures cluster in time after first fractures. Ann Rheum Dis. 2009;68:99-102.
18. Johnell O, Kanis JA, Odén A, et al. Fracture risk following an osteoporotic fracture. Osteoporos Int. 2004;15:175-179.
19. Center JR, Bliuc D, Nguyen TV, et al. Risk of subsequent fracture after low-trauma fracture in men and women. Jama. 2007;297:387-394.
20. Banefelt J, Åkesson KE, Spångéus A, et al. Risk of imminent fracture following a previous fracture in a Swedish database study. Osteoporos Int. 2019;30:601-609.
21. Roux C, Briot K. Imminent fracture risk. Osteoporos Int. 2017;28:1765-1769.
22. Johansson H, Siggeirsdóttir K, Harvey NC, et al. Imminent risk of fracture after fracture. Osteoporos Int. 2017;28:775-780.
23. Bouxsein ML, Seeman E. Quantifying the material and structural determinants of bone strength. Best Pract Res Clin Rheumatol. 2009;23:741-753.
24. Seeman E. Bone quality: the material and structural basis of bone strength. J Bone Miner Metab. 2008;26:1-8.
25. Proceedings of a symposium. Consensus Development Conference on Osteoporosis. Am J Med1991 pp 1s-68s.
26. Bours SP, van Geel TA, Geusens PP, et al. Contributors to secondary osteoporosis and metabolic bone diseases in patients presenting with a clinical fracture. J Clin Endocrinol Metab.
2011;96:1360-1367.
27. Writing Group for the ISCD Position Development Conference. Position statement : executive summary. The Writing Group for the International Society for Clinical Densitometry (ISCD) Position Development Conference. J Clin Densitom. 2004;7:7-12.
28. World Health Organisation. Prevention and management of osteoporosis. World Health Organization, World Health Organization Technical Report Series 2003.
29. Federatie Medisch Specialisten. Richtlijn Osteoporose en fractuurpreventie. 2022 https:// richtlijnendatabase.nl/richtlijn/osteoporose_en_ fractuurpreventie/startpagina_-_osteoporose_en_ fractuurpreventie.html
30. Bouxsein ML. Bone quality: where do we go from here? Osteoporos Int. 2003;14 Suppl 5:S118-127.
31. van den Bergh JP, Szulc P, Cheung AM, et al. The clinical application of high-resolution peripheral computed tomography (HR-pQCT) in adults: state of the art and future directions. Osteoporos Int. 2021;32:1465-1485.
32. Seeman E, Delmas PD. Bone quality--the material and structural basis of bone strength and fragility. N Engl J Med. 2006;354:2250-2261.
33. Whittier DE, Boyd SK, Burghardt AJ, et al. Guidelines for the assessment of bone density and microarchitecture in vivo using high-resolution peripheral quantitative computed tomography. Osteoporos Int. 2020;31:1607-1627.
34. Geusens P, Bours SPG, Wyers CE, et al. Fracture liaison programs. Best Pract Res Clin Rheumatol. 2019;33:278-289.
35. Sanders KM, Pasco JA, Ugoni AM, et al. The exclusion of high trauma fractures may underestimate the prevalence of bone fragility fractures in the community: the Geelong Osteoporosis Study. J Bone Miner Res. 1998;13:1337-1342.
36. Kanis JA, Norton N, Harvey NC, et al. SCOPE 2021: a new scorecard for osteoporosis in Europe. Arch Osteoporos. 2021;16:82.
37. Kanis JA, Oden A, Johnell O, et al. The burden of osteoporotic fractures: a method for setting intervention thresholds. Osteoporos Int. 2001;12:417-427.
38. Kanis JA, McCloskey EV, Harvey NC, et al. Intervention Thresholds and the Diagnosis of Osteoporosis. J Bone Miner Res. 2015;30:17471753.
39. Papaioannou A, Morin S, Cheung AM, et al. 2010
clinical practice guidelines for the diagnosis and management of osteoporosis in Canada: summary. Cmaj. 2010;182:1864-1873.
40. Kanis JA, Reginster JY. European guidance for the diagnosis and management of osteoporosis in postmenopausal women--what is the current message for clinical practice? Pol Arch Med Wewn. 2008;118:538-540.
41. Van Helden S, van Geel AC, Geusens PP, et al. Bone and fall-related fracture risks in women and men with a recent clinical fracture. J Bone Joint Surg Am. 2008;90:241-248.
42. Schuit SC, van der Klift M, Weel AE, et al. Fracture incidence and association with bone mineral density in elderly men and women: the Rotterdam Study. Bone. 2004;34:195-202.
43. Center JR, Nguyen TV, Schneider D, et al. Mortality after all major types of osteoporotic fracture in men and women: an observational study. Lancet. 1999;353:878-882.
44. Greenspan SL, Wyman A, Hooven FH, et al. Predictors of treatment with osteoporosis medications after recent fragility fractures in a multinational cohort of postmenopausal women. J Am Geriatr Soc. 2012;60:455-461.
45. Huntjens KM, Kosar S, van Geel TA, et al. Risk of subsequent fracture and mortality within 5 years after a non-vertebral fracture. Osteoporos Int. 2010;21:2075-2082.
46. Dutch Institute for Healthcare Improvement CBO. Richtlijn Osteoporose en Fractuurpreventie, Derde Herziening [Dutch] Dutch Institute for Healthcare Improvement CBO, Utrecht, The Netherlands 2011.
47. National Institute for Health and Care Excellence. Osteoporosis: assessing the risk of fragility fracture. National Institute for Health and Care Excellence. 2012 https://www.nice.org.uk/ guidance/cg146 Accessed 18 March 2024.
48. Lems WFO, A.; Van den Berg, P.; Van den Bergh, J.P.; Appelman, N. M.; De Klerk, G.,. Oplossingen voor fractuurpreventie in Nederland. International Osteoporosis Foundation. 2023 https://www. osteoporosis.foundation/sites/iofbonehealth/ files/2023-01/2022_country_profile_ned-dutch_ netherlands_25.01.pdf Accessed April 18th 2024.
49. Wilson N, Hurkmans E, Adams J, et al. Prevention and management of osteoporotic fractures by non-physician health professionals: a systematic literature review to inform EULAR points to consider. RMD Open. 2020;6:e001143.
50. Lems WF, Dreinhöfer KE, Bischoff-Ferrari H, et al. EULAR/EFORT recommendations for management of patients older than 50 years with a fragility
fracture and prevention of subsequent fractures. Ann Rheum Dis. 2017;76:802-810.
51. McLellan AR, Gallacher SJ, Fraser M, et al. The fracture liaison service: success of a program for the evaluation and management of patients with osteoporotic fracture. Osteoporos Int. 2003;14:1028-1034.
52. Javaid MK, Sami A, Lems W, et al. A patient-level key performance indicator set to measure the effectiveness of fracture liaison services and guide quality improvement: a position paper of the IOF Capture the Fracture Working Group, National Osteoporosis Foundation and Fragility Fracture Network. Osteoporos Int. 2020;31:1193-1204.
53. Li N, Hiligsmann M, Boonen A, et al. The impact of fracture liaison services on subsequent fractures and mortality: a systematic literature review and meta-analysis. Osteoporos Int. 2021;32:1517-1530.
54. van den Bergh JP, van Geel TA, Geusens PP. Osteoporosis, frailty and fracture: implications for case finding and therapy. Nat Rev Rheumatol. 2012;8:163-172.
55. Leal J, Gray AM, Hawley S, et al. CostEffectiveness of Orthogeriatric and Fracture Liaison Service Models of Care for Hip Fracture Patients: A Population-Based Study. J Bone Miner Res. 2017;32:203-211.
56. Wu CH, Kao IJ, Hung WC, et al. Economic impact and cost-effectiveness of fracture liaison services: a systematic review of the literature. Osteoporos Int. 2018;29:1227-1242.
57. Akesson K, Marsh D, Mitchell PJ, et al. Capture the Fracture: a Best Practice Framework and global campaign to break the fragility fracture cycle. Osteoporos Int. 2013;24:2135-2152.
58. Eisman JA, Bogoch ER, Dell R, et al. Making the first fracture the last fracture: ASBMR task force report on secondary fracture prevention. J Bone Miner Res. 2012;27:2039-2046.
59. Fuggle NR, Curtis EM, Ward KA, et al. Fracture prediction, imaging and screening in osteoporosis. Nat Rev Endocrinol. 2019;15:535-547.
60. Kanis JA, Johnell O, Oden A, et al. FRAX and the assessment of fracture probability in men and women from the UK. Osteoporos Int. 2008;19:385397.
61. Nguyen ND, Frost SA, Center JR, et al. Development of a nomogram for individualizing hip fracture risk in men and women. Osteoporos Int. 2007;18:1109-1117.
62. Nguyen ND, Frost SA, Center JR, et al. Development of prognostic nomograms for individualizing 5-year and 10-year fracture risks. Osteoporos Int.
2008;19:1431-1444.
63. van den Bergh JP, van Geel TA, Lems WF, et al. Assessment of individual fracture risk: FRAX and beyond. Curr Osteoporos Rep. 2010;8:131-137.
64. Hippisley-Cox J, Coupland C. Derivation and validation of updated QFracture algorithm to predict risk of osteoporotic fracture in primary care in the United Kingdom: prospective open cohort study. Bmj. 2012;344:e3427.
65. Beaudoin C, Moore L, Gagné M, et al. Performance of predictive tools to identify individuals at risk of non-traumatic fracture: a systematic review, metaanalysis, and meta-regression. Osteoporos Int. 2019;30:721-740.
66. Baim S, Blank R. Approaches to Fracture Risk Assessment and Prevention. Curr Osteoporos Rep. 2021;19:158-165.
67. Bonafede M, Shi N, Barron R, et al. Predicting imminent risk for fracture in patients aged 50 or older with osteoporosis using US claims data. Arch Osteoporos. 2016;11:26.
68. Adachi JD, Berger C, Barron R, et al. Predictors of imminent non-vertebral fracture in elderly women with osteoporosis, low bone mass, or a history of fracture, based on data from the populationbased Canadian Multicentre Osteoporosis Study (CaMos). Arch Osteoporos. 2019;14:53.
69. Barron RL, Oster G, Grauer A, et al. Determinants of imminent fracture risk in postmenopausal women with osteoporosis. Osteoporos Int. 2020;31:21032111.
70. Yusuf AA, Hu Y, Chandler D, et al. Predictors of imminent risk of fracture in Medicare-enrolled men and women. Arch Osteoporos. 2020;15:120.
71. Papaioannou A, Adachi JD, Berger C, et al. Testing a theoretical model of imminent fracture risk in elderly women: an observational cohort analysis of the Canadian Multicentre Osteoporosis Study. Osteoporos Int. 2020;31:1145-1153.
72. Kim KM, Lui LY, Cummings SR. Recent fall and high imminent risk of fracture in older men and women. Age Ageing. 2022;51:afac141.
73. Hannan MT, Weycker D, McLean RR, et al. Predictors of Imminent Risk of Nonvertebral Fracture in Older, High-Risk Women: The Framingham Osteoporosis Study. JBMR Plus. 2019;3:e10129.
74. Sheer RL, Barron RL, Sudharshan L, et al. Validated prediction of imminent risk of fracture for older adults. Am J Manag Care. 2020;26:e91-e97.
75. Balasubramanian A, Zhang J, Chen L, et al. Risk of subsequent fracture after prior fracture among older women. Osteoporos Int. 2019;30:79-92.
76. Wong RMY, Ho WT, Wai LS, et al. Fragility fractures and imminent fracture risk in Hong Kong: one of the cities with longest life expectancies. Arch Osteoporos. 2019;14:104.
77. Pinedo-Villanueva R, Charokopou M, Toth E, et al. Imminent fracture risk assessments in the UK FLS setting: implications and challenges. Arch Osteoporos. 2019;14:12.
78. Iconaru L, Moreau M, Baleanu F, et al. Risk factors for imminent fractures: a substudy of the FRISBEE cohort. Osteoporos Int. 2021;32:1093-1101.
79. Iconaru L, Charles A, Baleanu F, et al. Prediction of an Imminent Fracture After an Index FractureModels Derived From the Frisbee Cohort. J Bone Miner Res. 2022;37:59-67.
80. Leslie WD, Yan L, Lix LM, et al. Time dependency in early major osteoporotic and hip re-fractures in women and men aged 50 years and older: a population-based observational study. Osteoporos Int. 2022;33:39-46.
81. Deloumeau A, Moltó A, Roux C, et al. Determinants of short term fracture risk in patients with a recent history of low-trauma non-vertebral fracture. Bone. 2017;105:287-291.
82. World Health Organisation. Factsheet Falls. 2021 https://www.who.int/news-room/fact-sheets/ detail/falls Accessed may 17th 2021
83. Ganz DA, Latham NK. Prevention of Falls in Community-Dwelling Older Adults. N Engl J Med. 2020;382:734-743.
84. Bergen G, Stevens MR, Burns ER. Falls and Fall Injuries Among Adults Aged ≥65 Years - United States, 2014. MMWR Morb Mortal Wkly Rep. 2016;65:993-998.
85. Ganz DA, Bao Y, Shekelle PG, et al. Will my patient fall? Jama. 2007;297:77-86.
86. Tromp AM, Smit JH, Deeg DJ, et al. Predictors for falls and fractures in the Longitudinal Aging Study Amsterdam. J Bone Miner Res. 1998;13:1932-1939.
87. Schwenk M, Lauenroth A, Stock C, et al. Definitions and methods of measuring and reporting on injurious falls in randomised controlled fall prevention trials: a systematic review. BMC Med Res Methodol. 2012;12:50.
88. Morrison A, Fan T, Sen SS, et al. Epidemiology of falls and osteoporotic fractures: a systematic review. Clinicoecon Outcomes Res. 2013;5:9-18.
89. Tinetti ME, Speechley M, Ginter SF. Risk factors for falls among elderly persons living in the community. N Engl J Med. 1988;319:1701-1707.
90. van den Berg P, Schweitzer DH, van Haard PM, et al. Meeting international standards of secondary
fracture prevention: a survey on Fracture Liaison Services in the Netherlands. Osteoporos Int. 2015;26:2257-2263.
91. Royal College of Physicians. Fracture Liaison Service Database Leading FLS improvement: secondary fracture prevention in the NHS. Falls and Fragility Fracture Audit programme,2017
92. National Institute for Health Care Excellence. Falls in older people: assessing risk and prevention. NICE. 2013
93. Gallacher S, Alexander S, Beswetherick N, et al. Effective secondary prevention of fragility fractures: clinical standards for fracture liaison services. Royal Osteoporosis Society. 2019;1-44.
94. Montero-Odasso M, van der Velde N, Martin FC, et al. World guidelines for falls prevention and management for older adults: a global initiative. Age Ageing. 2022;51:afac205.
95. Harvey NC, Odén A, Orwoll E, et al. Falls Predict Fractures Independently of FRAX Probability: A Meta-Analysis of the Osteoporotic Fractures in Men (MrOS) Study. J Bone Miner Res. 2018;33:510516.
96. Masud T, Binkley N, Boonen S, et al. Official Positions for FRAX® clinical regarding falls and frailty: can falls and frailty be used in FRAX®? From Joint Official Positions Development Conference of the International Society for Clinical Densitometry and International Osteoporosis Foundation on FRAX®. J Clin Densitom. 2011;14:194-204.
97. Vranken L, Wyers CE, Van der Velde RY, et al. Association between incident falls and subsequent fractures in patients attending the fracture liaison service after an index fracture: a 3-year prospective observational cohort study. BMJ Open. 2022;12:e058983.
98. Ambrose AF, Paul G, Hausdorff JM. Risk factors for falls among older adults: a review of the literature. Maturitas. 2013;75:51-61.
99. Vranken L, Wyers CE, van den Bergh JPW, et al. The Phenotype of Patients with a Recent Fracture: A Literature Survey of the Fracture Liaison Service. Calcif Tissue Int. 2017;101:248-258.
100. van Helden S, Wyers CE, Dagnelie PC, et al. Risk of falling in patients with a recent fracture. BMC Musculoskeletal Disorders. 2007;8:1-7.
101. Hadji P, Schweikert B, Kloppmann E, et al. Osteoporotic fractures and subsequent fractures: imminent fracture risk from an analysis of German real-world claims data. Arch Gynecol Obstet. 2021;304:703-712.
102. Szulc P. Impact of Bone Fracture on Muscle Strength and Physical Performance-Narrative
Review. Curr Osteoporos Rep. 2020;18:633-645.
103. Lespessailles E, Toumi H. Proton Pump Inhibitors and Bone Health: An Update Narrative Review. Int J Mol Sci. 2022;23:10733.
104. Zhou B, Huang Y, Li H, et al. Proton-pump inhibitors and risk of fractures: an update meta-analysis. Osteoporos Int. 2016;27:339-347.
105. Park JH, Song YM, Jung JH, et al. Comparative analysis of the risk of osteoporotic fractures with proton pump inhibitor use and histamine-2 receptor antagonist therapy in elderly women: A nationwide population-based nested case-control study. Bone. 2020;135:115306.
106. Moayyedi P, Eikelboom JW, Bosch J, et al. Safety of Proton Pump Inhibitors Based on a Large, MultiYear, Randomized Trial of Patients Receiving Rivaroxaban or Aspirin. Gastroenterology. 2019;157:682-691.e682.
107. Attwood SE, Ell C, Galmiche JP, et al. Longterm safety of proton pump inhibitor therapy assessed under controlled, randomised clinical trial conditions: data from the SOPRAN and LOTUS studies. Aliment Pharmacol Ther. 2015;41:11621174.
108. Park DH, Seo SI, Lee KJ, et al. Long-term proton pump inhibitor use and risk of osteoporosis and hip fractures: A nationwide population-based and multicenter cohort study using a common data model. J Gastroenterol Hepatol. 2022;37:15341543.
109. Nassar Y, Richter S. Proton-pump Inhibitor Use and Fracture Risk: An Updated Systematic Review and Meta-analysis. J Bone Metab. 2018;25:141-151.
110. Poly TN, Islam MM, Yang HC, et al. Proton pump inhibitors and risk of hip fracture: a metaanalysis of observational studies. Osteoporos Int. 2019;30:103-114.
111. Targownik LE, Fisher DA, Saini SD. AGA Clinical Practice Update on De-Prescribing of Proton Pump Inhibitors: Expert Review. Gastroenterology. 2022;162:1334-1342.
112. O’Connell MB, Madden DM, Murray AM, et al. Effects of proton pump inhibitors on calcium carbonate absorption in women: a randomized crossover trial. Am J Med. 2005;118:778-781.
113. Briganti SI, Naciu AM, Tabacco G, et al. Proton Pump Inhibitors and Fractures in Adults: A Critical Appraisal and Review of the Literature. Int J Endocrinol. 2021;2021:8902367.
114. Costa-Rodrigues J, Reis S, Teixeira S, et al. Dosedependent inhibitory effects of proton pump inhibitors on human osteoclastic and osteoblastic cell activity. Febs j. 2013;280:5052-5064.
115. Aleraij S, Alhowti S, Ferwana M, et al. Effect of proton pump inhibitors on bone mineral density: A systematic review and meta-analysis of observational studies. Bone Rep. 2020;13:100732.
116. Shin YH, Gong HS, Baek GH. Lower Trabecular Bone Score is Associated With the Use of Proton Pump Inhibitors. J Clin Densitom. 2019;22:236242.
117. Lau YT, Ahmed NN. Fracture risk and bone mineral density reduction associated with proton pump inhibitors. Pharmacotherapy. 2012;32:67-79.
118. Amoako AO, Jafilan L, Nasiri P, et al. Correlation of Bone Mineral Density Scores and Proton Pump Inhibitors Use in the Elderly. Curr Rheumatol Rev. 2016;12:162-166.
119. Maggio M, Lauretani F, Ceda GP, et al. Use of proton pump inhibitors is associated with lower trabecular bone density in older individuals. Bone. 2013;57:437-442.
120. Targownik LE, Goertzen AL, Luo Y, et al. LongTerm Proton Pump Inhibitor Use Is Not Associated With Changes in Bone Strength and Structure. Am J Gastroenterol. 2017;112:95-101.
121. Kondapalli A, Agarwal S, Germosen C, et al. Bone microstructure in proton pump inhibitor users. Bone. 2023;168:116668.
122. Beaudart C, Rolland Y, Cruz-Jentoft AJ, et al. Assessment of Muscle Function and Physical Performance in Daily Clinical Practice : A position paper endorsed by the European Society for Clinical and Economic Aspects of Osteoporosis, Osteoarthritis and Musculoskeletal Diseases (ESCEO). Calcif Tissue Int. 2019;105:1-14.
123. Beck Jepsen D, Robinson K, Ogliari G, et al. Predicting falls in older adults: an umbrella review of instruments assessing gait, balance, and functional mobility. BMC Geriatr. 2022;22:615.
124. Alajlouni DA, Bliuc D, Tran TS, et al. Muscle strength and physical performance contribute to and improve fracture risk prediction in older people: A narrative review. Bone. 2023;172:116755.
125. Cooper R, Kuh D, Cooper C, et al. Objective measures of physical capability and subsequent health: a systematic review. Age Ageing. 2011;40:14-23.
126. Shimada H, Suzukawa M, Tiedemann A, et al. Which neuromuscular or cognitive test is the optimal screening tool to predict falls in frail community-dwelling older people? Gerontology. 2009;55:532-538.
127. Viccaro LJ, Perera S, Studenski SA. Is timed up and go better than gait speed in predicting health, function, and falls in older adults? J Am Geriatr Soc.
1 2011;59:887-892.
128. Wald P, Chocano-Bedoya PO, Meyer U, et al. Comparative Effectiveness of Functional Tests in Fall Prediction After Hip Fracture. J Am Med Dir Assoc. 2020;21:1327-1330.
129. Wang L, Song P, Cheng C, et al. The Added Value of Combined Timed Up and Go Test, Walking Speed, and Grip Strength on Predicting Recurrent Falls in Chinese Community-dwelling Elderly. Clin Interv Aging. 2021;16:1801-1812.
130. Guralnik JM, Simonsick EM, Ferrucci L, et al. A short physical performance battery assessing lower extremity function: association with self-reported disability and prediction of mortality and nursing home admission. J Gerontol. 1994;49:M85-94.
131. Muir-Hunter SW, Wittwer JE. Dual-task testing to predict falls in community-dwelling older adults: a systematic review. Physiotherapy. 2016;102:2940.
132. Koolen EH, van Hees HW, van Lummel RC, et al. “Can do” versus “do do”: A Novel Concept to Better Understand Physical Functioning in Patients with Chronic Obstructive Pulmonary Disease. J Clin Med. 2019;8:
133. Vaes AW, Spruit MA, Koolen EH, et al. “Can Do, Do Do” Quadrants and 6-Year All-Cause Mortality in Patients With COPD. Chest. 2022;1494-1504.
134. Sievi NA, Brack T, Brutsche MH, et al. “Can do, don’t do” are not the lazy ones: a longitudinal study on physical functioning in patients with COPD. Respir Res. 2020;21:27.
135. Janssen SMJ, Spruit MA, Antons JC, et al. “Can Do” Versus “Do Do” in Patients with Asthma at First Referral to a Pulmonologist. J Allergy Clin Immunol Pract. 2021;9:1278-1284.
136. Herrett E, Gallagher AM, Bhaskaran K, et al. Data Resource Profile: Clinical Practice Research Datalink (CPRD). Int J Epidemiol. 2015;44:827-836.
137. Mathur R, Bhaskaran K, Chaturvedi N, et al. Completeness and usability of ethnicity data in UK-based primary care and hospital databases. J Public Health (Oxf). 2014;36:684-692.
138. Van Staa TP, Abenhaim L, Cooper C, et al. The use of a large pharmacoepidemiological database to study exposure to oral corticosteroids and risk of fractures: validation of study population and results. Pharmacoepidemiol Drug Saf. 2000;9:359366.
139. Herrett E, Thomas SL, Schoonen WM, et al. Validation and validity of diagnoses in the General Practice Research Database: a systematic review. Br J Clin Pharmacol. 2010;69:4-14.
140. Khan NF, Harrison SE, Rose PW. Validity of diagnostic coding within the General Practice Research Database: a systematic review. Br J Gen Pract. 2010;60:e128-136.
M.R. Schene, C.E. Wyers, J.H.M. Driessen, P.C. Souverein, M. Gemmeke, J.P. van den Bergh, H.C. Willems
Age and Ageing 2023; 52: 1–9
Rationale: Adults with a recent fracture have a high imminent risk of a subsequent fracture. We hypothesise that, like subsequent fracture risk, fall risk is also highest immediately after a fracture. This study aims to assess if fall risk is time-dependent in subjects with a recent fracture compared to subjects without a fracture.
Methods: This retrospective matched cohort study used data from the UK Clinical Practice Research Datalink GOLD. All subjects ≥ 50 years with a fracture between 1993 and 2015 were identified and matched one-to-one to fracturefree controls based on year of birth, sex and practice. The cumulative incidence and relative risk (RR) of a first fall was calculated at various time intervals, with mortality as competing risk. Subsequently, analyses were stratified according to age, sex and type of index fracture.
Results: A total of 624,460 subjects were included; 312,230 subjects with an index fracture, matched to 312,230 fracture-free controls (71% females, mean age 70 ± 12, mean follow-up 6.5 ± 5 years). The RR of falls was highest in the first year after fracture compared to fracture-free controls; males had a 3-fold and females a 2-fold higher risk. This imminent fall risk was present in all age and fracture types and declined over time. A concurrent imminent fracture and mortality risk were confirmed.
Conclusion/Discussion: This study demonstrates an imminent fall risk in the first years after a fracture in all age and fracture types. This underlines the need for early fall risk assessment and prevention strategies in 50+ adults with a recent fracture.
Fractures and falls comprise an important health concern in our ageing population, causing significant morbidity and mortality and a decrease in quality of life.1 In the UK the total costs of incident fractures are €5.5 billion yearly.1 Subjects with a history of fracture have twice the risk to sustain subsequent fractures,2, 3 and this risk is the highest in the first 2 years after initial fracture.2, 4 This imminent subsequent fracture risk has been reported after fractures at all major fracture sites.5–7
Recent falls have been associated with the imminent subsequent fracture risk, amongst other factors such as cognitive and physical decline.7–10 Up to 90% of all fractures in older persons are caused by a fall and fracture patients have a high prevalence of fall risk factors.11–14 Recent findings of a fracture liaison service (FLS) cohort showed that falls were the main cause of subsequent fractures, and subjects with an incident fall after the initial fracture had an almost 9-fold risk of sustaining a subsequent fracture during 3 years of followup.11 Moreover, a higher fall rate was reported in the first year after fracture, compared to later years. Thus, the imminent subsequent fracture risk could probably, at least partially, be explained by an imminent fall risk after a fracture. Several studies reported fall incidence after different types of fractures, but comparability between the studies is low due to differences in fall- or fracture intervention strategies, population characteristics and length of follow-up.15–26 Importantly, most studies measure fall incidence at one time point, which does not allow to detect changes in fall risk over time. A study of Wong et al. reported a high short-term annual fall incidence rate after an initial fracture that declined steadily during the first 5 years after fracture.27 However, they did not account for mortality as a competing risk, which is important, especially in an older fracture population. This study aims to assess if fall risk is time-dependent in subjects ≥50 years with a recent fracture compared to fracture-free controls.
Methods
Data source
This descriptive, retrospective study cohort was conducted using the Clinical Practice Research Datalink (CPRD) GOLD database. CPRD collects routinely recorded computerised medical data from over 650 general practices in the United Kingdom (UK).28 The cohort encompasses data of ~7% of the UK population and has been shown to be largely representative of the UK population in terms of age, sex and ethnicity.28, 29 Clinical information of the CRPD is recorded using Read codes; a clinical classification system for registration of diseases and mortality.28, 30 Registrations in CPRD have been
proven to be fairly accurate for mortality.31, 32 and hip and vertebral fractures diagnosis showed a high validity.33 The CPRD has obtained ethics approval for purely observational research using anonymised data from the National Research Ethics Service Committee (IRAS ID 242149). The research protocol for this study (ID 22_002143) was approved by the Independent Scientific Advisory Committee for the Medicines and Healthcare Products Regulatory Agency Database Research.
The fracture cohort consisted of all subjects aged 50+, with an incident fracture between 1 January 1990 and 31 December 2015. The first 3 years of followup were excluded due to low numbers of included subjects, thus all further analysis were carried out between 1 January 1993 and 31 December 2015. All fracture types were included except for pathological fractures and fractures due to prosthetic failure. All subjects with an incident fracture were matched based on year of birth, sex and practice to a fracture-free control subject using incidence density sampling.34 The date of the fracture determined the index date for both fracture subjects and their matched controls. Follow-up started after a lead-in period of 30 days, to limit the possibility of including falls or fractures related to the index event twice. Subjects were followed from the index date until occurrence of the outcome of interest, the subjects moving out of the practice, registered death in the database, end of data collection of the practice, or the end of study period (31 December 2020), whichever came first.
The primary outcome of interest were ‘GP-reported falls’ and secondary outcome measures were ‘GP-reported fractures’ and all-cause mortality. A fall was defined as an event in which the GP recorded a diagnosis of the patient experiencing a ‘fall’. Falls and fractures were defined using Read codes, and were checked by individuals with expert knowledge (JB, HW, Appendix 1 and 2).35 ‘GP-reported fractures’ were defined as fractures during follow-up, excluding the index fracture location or a fracture of unspecified location, as differentiation between consultations regarding the follow-up of an index fracture or a new fracture of the same fracture site was not possible.30
We defined imminent fall risk in accordance with the definition of imminent fracture risk; a high short-term risk within 12–24 months after the index fracture, that declines over time.2, 4, 36
Population characteristics were described using means and standard deviations (SD) for normally distributed and medians and interquartile ranges (IQR) for non-normally distributed data. To adequately interpret fall data, first, secular trends of falls were explored; subjects in both the fracture and control cohort were followed from their index date until a fall or fracture, censoring or 1 year of follow-up, whichever came first. To calculate the 1-year fall incidence rates (IR), all first reported falls were divided by the total time at risk, expressed as falls/1,000 person years (PYs). Results were stratified by calendar year. Trends over time in IRs for both groups were described using Poisson regression, and were compared between groups using incidence rate ratios (IRRs). As a sensitivity analysis, all (not only first) falls during the 1- year follow-up were counted. Similarly, 1-year IR and IRR for first fracture and mortality were calculated.
For the assessment of imminent fall risk, the cumulative incidence of first falls (defined as first falls after the index date) was assessed at multiple time intervals using the cumulative incidence competing risk (CICR) method with mortality as competing risk.37, 38 Relative risks (RR) of falls were calculated between the fracture group and the fracture-free control group by dividing the cumulative incidence of the fracture group by the cumulative incidence of the control group at each time point. For the first 5 years of follow-up, proportions of subjects with a first fall were calculated by dividing all subjects with a first fall at a specific year of follow-up by all subjects with a first fall during followup. Lastly, the cumulative incidence and RR between groups was calculated for fractures and mortality.
Outcomes were stratified to index fracture type, sex and/or age categories. Fracture types were grouped according to Center et al.: (i) hip fractures, (ii) major fractures; vertebra, multiple rib, proximal humerus, pelvis, femur (nonhip) and proximal tibia and (iii) minor fractures; all remaining, except fingers and toes (which were excluded) or the International Osteoporosis Foundation (IOF) classification: (i) major osteoporotic fractures (MOF); hip, vertebra, proximal humerus and distal radius, (ii) non-major osteoporotic (non-MOF); all remaining.39
All analyses were carried out using SAS 9.4 (SAS Institute, Cary, NC), graphs were produced in GraphPad Prism 9.5 (GraphPad Software, San Diego, CA, USA).
Results
A total of 624,460 subjects were included between 1993 and 2015; 312,230 subjects were identified with an index fracture (Table 1) and matched to 312,230 fracture-free controls (flowchart for inclusion, Appendix 3). Of those,
71% were female and the median age at inclusion was 70 (60–80) years for females and 66 (57–77) years for males. The fracture and control cohort had a median follow-up of 5.7 (2.4–9.6) for and 6.0 (2.7–9.8) years and in 29.2% and 25.1% death was the reason for end of follow-up, respectively.
Table1. Population characteristics
in years n(%)
Reason of end of followup n(%)
Secular trends
From 1993 to 2015 the mean overall IRR of a first fall was 1.8 (95% CI 1.7–1.81) for females with a fracture and 2.4 (95% CI 2.2–2.5) for males with a fracture compared to their fracture-free controls (Appendix 4). The IRR of all reported falls was the same compared to the IRR of first falls. Appendix 5 shows IRs and IRRs of first falls over the inclusion period for the fracture cohort compared to the controls. The trend in fall IRs over time in the fracture cohort was slightly higher than in the control cohort (RR females: 1.01 (1.00–1.01), P-value 0.006, RR males: 1.02 (1.00–1.03), p-value 0.006).
One-year IRR of first falls, fractures and mortality
In Figure 1A–C the 1-year IRR of first falls, first fractures and mortality is displayed for all index fracture groups (Center and IOF classifications) and individual fracture types compared to their controls. The 1-year IR for a first fall was higher for all index fracture classification groups and for all individual fracture types compared to their controls (Figure 1A). For all index fracture groups the IRR was higher for males; ranging from 2.3 to 2.6, compared to females; IRR ranging from 1.7 to 1.9. Similarly, the 1-year IR for a subsequent fracture was higher in all fracture classification groups and for all individual
fracture types for both males and females (panel B). Panel C shows the 1-year mortality rate after fracture which was higher for all index fracture classification groups, except for females with a minor fracture. The IRR of mortality differed between individual fracture types.
Imminent fall risk
Cumulative incidences of first falls were time-dependent, were higher for females compared to males and were highest in the first years after index fracture (Appendix 6A–C). For both the fracture and control cohort the incidence of first falls was highest in the first years after index date. Of females in the fracture cohort, 41.3% had a first fall during follow- up versus 33.7% in the control cohort. Of the 41.3% fallers, 12.2% fell in year one (7.2% in month 2–6 and 4.9% in month 6–12) and 8.2%, 7.1%, 6.0% and 5.5% in year 2, 3, 4 and 5, respectively. For the 33.7% fallers in the female control cohort fall incidence was 8.9%, 7.5%, 6.4%, 5.9% and 5.4% in year 1, 2, 3, 4 and 5, respectively. Of males in the fracture cohort, 28.3% had a first fall during follow-up versus 23.8% in the control cohort. Of the 28.3% fallers, most males fell in year one 13.8% (8.3% in month 2–6 and 5.4% in month 6–12), and 8.4%, 6.8%, 5.8% and 5.0% in year 2, 3, 4 and 5, respectively. For the 23.8% fallers in the male control cohort, this was 7.4%, 5.7%, 5.6%, 5.0% and 5.0% in year 1, 2, 3, 4 and 5, respectively. The RR of first falls for the fracture cohort compared to their controls is displayed in Figure 2. In both males and females, the RR of falls was highest in the first years after fracture and declined over time. In females, the RR of first falls after fracture was 1.7 in the year 1 (2.2 in months 1–3, 1.9 in months 3–6 and 1.7 in months 6–12), and stabilised afterwards between year 2 (RR: 1.5) and 5 (RR 1.4). In males, the RR of first falls after fracture was 2.2 in the first year (3.1 in month 1–3, 2.6 in month 3–6) and 2.0, 1.8, 1.7 and 1.6 in year 2, 3, 4 and 5. Similar patterns of high imminent fall risk were present in all index fracture classification groups (Appendix 7A–E), and in all age groups (Appendix 8A and B).
The RR of subsequent fractures was also highest in the first few years after index fracture compared to controls and declined over time (Figure 2B). This imminent fracture risk was present for both females and males, but higher in males compared to females. A similar pattern was shown for the RR of mortality (Figure 2C).
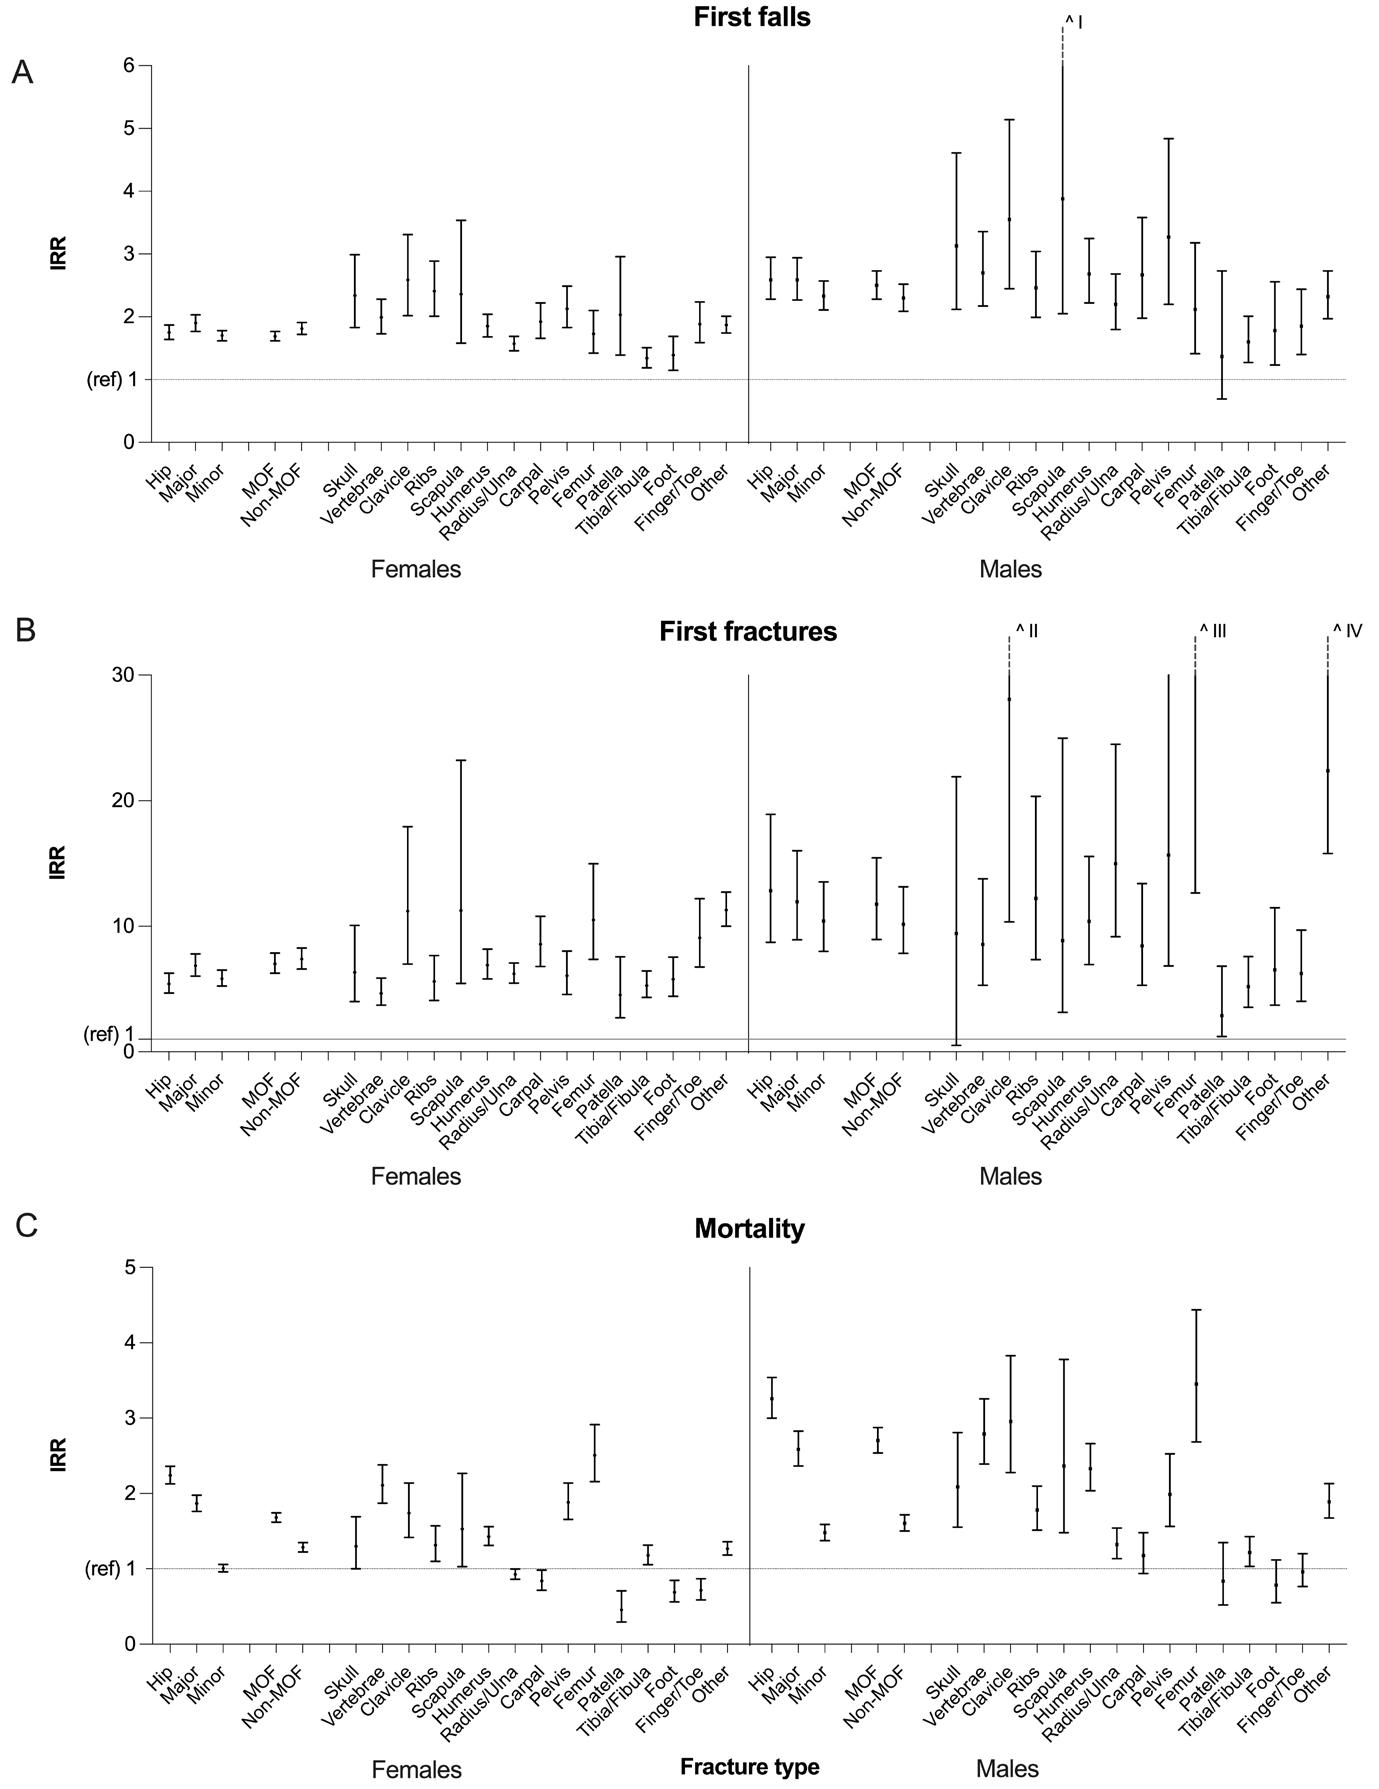
Figure 1. One-year incidence rate ratios of first falls (A), first fractures (B) and mortality (C) of subjects with fracture compared to fracture-free controls. IRR = incidence rate ratio; ref = reference point at IRR = 1. Figure 1 shows the IRR of the first year after fracture for first falls (A), first fractures (B) and mortality (C), stratified to fracture classification groups and individual fracture types. Major = vertebral, multiple rib, pelvis, distal femur and proximal humerus fractures (Center classification), Minor = all fractures not including hip or major fractures (Center classification), MOF = Hip, vertebral, distal radius and proximal humerus fractures (IOF classification), non-MOF = all fractures that are not included in MOF group (IOF classification). Results are presented as mean IRR ± 95% confidence interval (CI). ^I: upper limit 95% CI = 7.34, ˆII: upper limit 95% CI = 76.16, ˆIII: mean IRR = 51.36 and upper limit 95% CI = 208.61, ˆIV: upper limit 95% CI = 15.79.
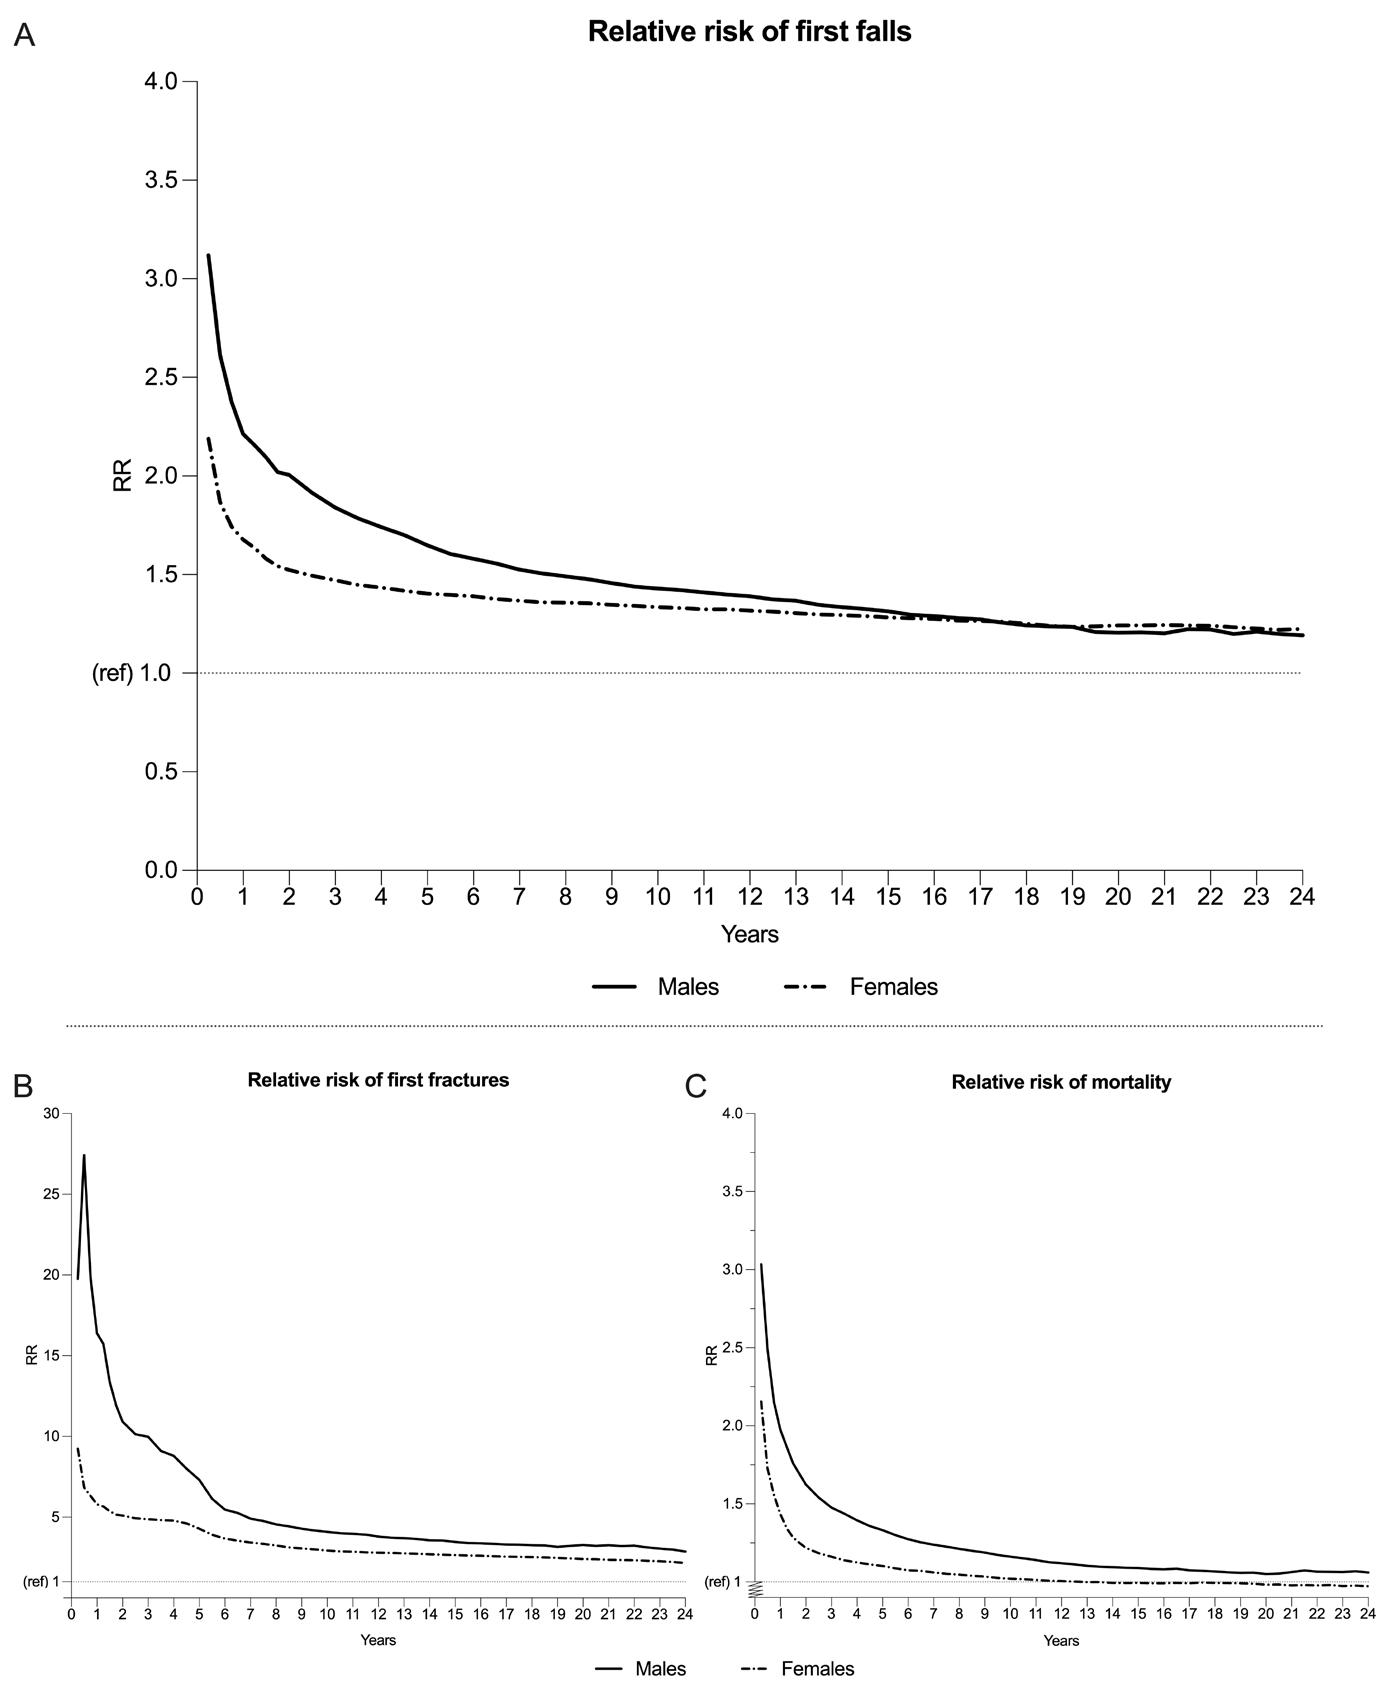
Figure 2. RR of first falls (A), first fractures (B) and mortality (C) of the fracture cohort compared to the control cohort. RR = relative risk, ref = reference point at RR = 1. Figure 2 shows the RR of first falls (A), first fractures (B) and mortality (C) of the fracture population compared to the control population, stratified by sex. The RR was calculated by dividing the cumulative incidence of first falls (A), first fractures (B) and mortality (C) of the fracture cohort by the cumulative incidence of first falls (A), first fractures (B) and mortality (C) of the control cohort, respectively.
This large population-based cohort study found an imminent fall risk for males and females after an index fracture compared to a matched control cohort. Males and females had a 3-fold and 2-fold higher risk of falls in the first year after index fracture, and a 2-fold and 1.5-fold risk in the second year after index fracture, respectively. This risk gradually declined during the years thereafter, but remained higher throughout the follow-up period. This imminent fall risk pattern was similar to the pattern of the concurrent imminent fracture and mortality risk and present in all age groups and for all individual fracture types and fracture type classifications groups (Center, IOF).
Several studies previously established the presence of an imminent subsequent fracture risk.2, 4, 7, 40 However, imminent fall risk is less frequently reported and has not yet been described in a large nationwide population study before. The finding of an imminent fall risk after an index fracture is in line with recent smaller cohort studies.11, 19 Vranken et al. assessed falls and fracture incidences prospectively during 3 years of follow-up in a population of 488 FLS patients (mean age 65, 71% females).11 Of females and males respectively, 38% and 41% fell in the first year, of which 25% and 29% occurred <6 months and 51% and 49% had experienced a fall at the end of the second year. Of all fall-related subsequent fractures, the majority occurred at the first fall.11 Additionally, Wong et al. reported the highest fall incidence in the first years after distal radius, proximal humerus or hip fracture in a 50+ Hong Kong population.27 Lastly, a randomised controlled trial studying a fall-intervention programme after femur fracture (mean age 82, 76% females), reported the highest fall incidence in the first 4 months after fracture.19 Although the fall incidences of our study and aforementioned studies are subject to differences in fall registration and characteristics of the population, the pattern of an imminent fall risk is clear in all studies, showing the highest risk of falls in the first year after fracture and a declining risk over time. As the majority of all fractures and subsequent fractures are caused by a fall, it is likely that the imminent risk of subsequent fractures can be explained to a great extent by an imminent fall risk.
Our study shows an imminent fall risk for all ages and different index fracture groups and this risk was higher for males compared to females, but females had a higher absolute risk. The yearly fall incidence of both the fracture and control cohort declined after the first years. This is inherent to the outcome ‘first falls’ and the censoring of the patients experiencing this outcome after their first fall during follow-up. Consequently, in the following years a ‘cohort’ remains that is less prone to falling. In our study the RR of falls and fractures remained > 1 during 24 years of follow-up. This is in line with studies assessing imminent fracture risk with long term follow-up.2, 40
Our results underline the need for early fall risk assessment and multiple component fall prevention interventions in fracture patients. These interventions,
including exercise and medication review have proven to be effective.41, 42 Fall risk assessment is only recently included in recommendations for FLS and post-fracture care and only a small number of fracture patients receive a fall assessment.1, 43, 44 As our study was descriptive, assessment of clinical characteristics was beyond our scope. However, it is likely that the fracture population has different clinical characteristics compared to their controls. Fracture patients often have a high proportion of fall risk factors, such as low physical performance, a high proportion with frailty and a history of falls.11, 14, 45–47
Possible determinants of imminent fall risk are age, sex, medication use, history of falls, ADL difficulties, physical performance and specific comorbidities.9, 48, 49
Future studies should focus on the identification of determinants of imminent fall risk. For now, emphasis should lay on immediate identification of those with high fall risk, using existing fall guidelines, to prevent future falls and fall-related fractures, as the time-window for prevention is small.11, 50
Strengths and limitations
This study has several strengths; the results are based on a large nationwide cohort of over 600,000 subjects and the risk of falls after fracture was assessed time-dependently, whilst accounting for mortality as a competing risk. Competing risks analysis is essential to prevent over-reporting of falls, especially in studies with older populations and high mortality rates, both inherent to fracture populations.37 Moreover, this study combined fall data with cumulative fracture and mortality incidence data. This study also has limitations; due to the retrospective design, causality could not be assessed. Thus, all findings should be further assessed in prospective studies. Second, the 1-month lead-in period could cause an underestimation of imminent fall and fracture risk as the highest fall incidence might be in the first months after fracture19 and institutionalisation after the initial fracture could increase fracture rates.51 Third, fall incidence was subject to large underreporting and lower compared to the yearly incidence reported in older general populations (30%) or fracture populations (31–55%).11
This was due to several causes; first, there was no systematic regular inquiry about fall incidence during follow-up by the GP or by use of fall diaries, leaving fall registration subject to recall bias.52 Moreover, underreporting could occur if a fall diagnosis was not recorded electronically, recorded in free text or solely the medical consequence of the fall (e.g. fracture, tissue injury), and not the fall itself was recorded. It is likely that patients mostly report injurious falls, not all falls to their GP53 and in case of an ER visit, some falls will only be reported at the hospital. Lastly, a fracture diagnosis might prompt the GP to do additional evaluations, such as a fall assessment, possibly increasing falls registration in fracture patients.
This study demonstrates an imminent fall risk after fracture, in a large population-based study, accounting for the competing risk of mortality. This imminent fall risk was demonstrated in all age groups and all index fracture types. Corresponding time-dependent risk patterns were found for subsequent fractures and mortality after fracture. This study underlines the need for fall risk assessment and fall-intervention strategies early after a fracture.
1. Willers C, Norton N, Harvey NC, et al. Osteoporosis in Europe: a compendium of country-specific reports. Arch Osteoporos. 2022;17:23.
2. van Geel TA, van Helden S, Geusens PP, et al. Clinical subsequent fractures cluster in time after first fractures. Ann Rheum Dis. 2009;68:99-102.
3. Kanis JA, Johnell O, De Laet C, et al. A metaanalysis of previous fracture and subsequent fracture risk. Bone. 2004;35:375-382.
4. Roux C, Briot K Imminent fracture risk. Osteoporos Int. 2017;28:1765-1769.
5. Roux C, Fechtenbaum J, Kolta S, et al. Mild prevalent and incident vertebral fractures are risk factors for new fractures. Osteoporos Int. 2007;18:1617-1624.
6. Huntjens KM, Kosar S, van Geel TA, et al. Risk of subsequent fracture and mortality within 5 years after a non-vertebral fracture. Osteoporos Int. 2010;21:2075-2082.
7. Balasubramanian A, Zhang J, Chen L, et al. Risk of subsequent fracture after prior fracture among older women. Osteoporos Int. 2019;30:79-92.
8. Barron RL, Oster G, Grauer A, et al. Determinants of imminent fracture risk in postmenopausal women with osteoporosis. Osteoporos Int. 2020;31:21032111.
9. Yusuf AA, Hu Y, Chandler D, et al. Predictors of imminent risk of fracture in Medicare-enrolled men and women. Arch Osteoporos. 2020;15:120.
10. Kim KM, Lui LY, Cummings SR Recent fall and high imminent risk of fracture in older men and women. Age Ageing. 2022;51:afac141.
11. Vranken L, Wyers CE, Van der Velde RY, et al. Association between incident falls and subsequent fractures in patients attending the fracture liaison service after an index fracture: a 3-year prospective observational cohort study. BMJ Open. 2022;12:e058983.
12. Van Helden S, van Geel AC, Geusens PP, et al. Bone and fall-related fracture risks in women and men with a recent clinical fracture. J Bone Joint Surg Am. 2008;90:241-248.
13. Morrison A, Fan T, Sen SS, et al. Epidemiology of falls and osteoporotic fractures: a systematic review. Clinicoecon Outcomes Res. 2013;5:9-18.
14. Vranken L, Wyers CE, van den Bergh JPW, et al. The Phenotype of Patients with a Recent Fracture: A Literature Survey of the Fracture Liaison Service. Calcif Tissue Int. 2017;101:248-258.
15. Galler M, Zellner M, Roll C, et al. A prospective study with ten years follow-up of two-hundred patients with proximal femoral fracture. Injury. 2018;49:841-845.
16. Pils K, Neumann F, Meisner W, et al. Predictors of falls in elderly people during rehabilitation after hip fracture--who is at risk of a second one? Z Gerontol Geriatr. 2003;36:16-22.
17. Stenvall M, Olofsson B, Lundström M, et al. Inpatient falls and injuries in older patients treated for femoral neck fracture. Arch Gerontol Geriatr. 2006;43:389-399.
18. Cheung WH, Shen WY, Dai DL, et al. Evaluation of a multidisciplinary rehabilitation programme for elderly patients with hip fracture: A prospective cohort study. J Rehabil Med. 2018;50:285-291.
19. Berggren M, Stenvall M, Olofsson B, et al. Evaluation of a fall-prevention program in older people after femoral neck fracture: a one-year follow-up. Osteoporos Int. 2008;19:801-809.
20. Miller RR, Ballew SH, Shardell MD, et al. Repeat falls and the recovery of social participation in the year post-hip fracture. Age Ageing. 2009;38:570-575.
21. Orwig DL, Hochberg M, Yu-Yahiro J, et al. Delivery and outcomes of a yearlong home exercise program after hip fracture: a randomized controlled trial. Arch Intern Med. 2011;171:323-331.
22. Dewan N, MacDermid JC, Grewal R, et al. Risk factors predicting subsequent falls and osteoporotic fractures at 4 years after distal radius fracture-a prospective cohort study. Arch Osteoporos. 2018;13:32.
23. Nagai T, Tanimoto K, Tomizuka Y, et al. Nutrition status and functional prognosis among elderly patients with distal radius fracture: a retrospective cohort study. J Orthop Surg Res. 2020;15:133.
24. Huang TT, Liang SH A randomized clinical trial of the effectiveness of a discharge planning intervention in hospitalized elders with hip fracture due to falling. J Clin Nurs. 2005;14:1193-1201.
25. Pils K, Meisner W, Haas W, et al. Risk assessment after hip fracture: check the "healthy" leg! Z Gerontol Geriatr. 2011;44:375-380.
26. Rucker D, Rowe BH, Johnson JA, et al. Educational intervention to reduce falls and fear of falling in patients after fragility fracture: results of a controlled pilot study. Prev Med. 2006;42:316-319.
27. Wong RMY, Ho WT, Wai LS, et al. Fragility fractures and imminent fracture risk in Hong Kong: one of the cities with longest life expectancies. Arch
2
Osteoporos. 2019;14:104.
28. Herrett E, Gallagher AM, Bhaskaran K, et al. Data Resource Profile: Clinical Practice Research Datalink (CPRD). Int J Epidemiol. 2015;44:827-836.
29. Mathur R, Bhaskaran K, Chaturvedi N, et al. Completeness and usability of ethnicity data in UK-based primary care and hospital databases. J Public Health (Oxf). 2014;36:684-692.
30. van der Velde RY, Wyers CE, Geusens P, et al. Incidence of subsequent fractures in the UK between 1990 and 2012 among individuals 50 years or older. Osteoporos Int. 2018;29:24692475.
31. Herrett E, Thomas SL, Schoonen WM, et al. Validation and validity of diagnoses in the General Practice Research Database: a systematic review. Br J Clin Pharmacol. 2010;69:4-14.
32. Khan NF, Harrison SE, Rose PW Validity of diagnostic coding within the General Practice Research Database: a systematic review. Br J Gen Pract. 2010;60:e128-136.
33. Van Staa TP, Abenhaim L, Cooper C, et al. The use of a large pharmacoepidemiological database to study exposure to oral corticosteroids and risk of fractures: validation of study population and results. Pharmacoepidemiol Drug Saf. 2000;9:359366.
34. Wacholder S, McLaughlin JK, Silverman DT, et al. Selection of controls in case-control studies. I. Principles. Am J Epidemiol. 1992;135:1019-1028.
35. Chisholm J The Read clinical classification. Bmj. 1990;300:1092.
36. Banefelt J, Åkesson KE, Spångéus A, et al. Risk of imminent fracture following a previous fracture in a Swedish database study. Osteoporos Int. 2019;30:601-609.
37. Verduijn M, Grootendorst DC, Dekker FW, et al. The analysis of competing events like cause-specific mortality--beware of the Kaplan-Meier method. Nephrol Dial Transplant. 2011;26:56-61.
38. Noordzij M, Leffondré K, van Stralen KJ, et al. When do we need competing risks methods for survival analysis in nephrology? Nephrol Dial Transplant. 2013;28:2670-2677.
39. Center JR, Nguyen TV, Schneider D, et al. Mortality after all major types of osteoporotic fracture in men and women: an observational study. Lancet. 1999;353:878-882.
40. Johansson H, Siggeirsdóttir K, Harvey NC, et al. Imminent risk of fracture after fracture. Osteoporos Int. 2017;28:775-780.
41. Dautzenberg L, Beglinger S, Tsokani S, et al.
Interventions for preventing falls and fall-related fractures in community-dwelling older adults: A systematic review and network meta-analysis. J Am Geriatr Soc. 2021;69:2973-2984.
42. Hopewell S, Adedire O, Copsey BJ, et al. Multifactorial and multiple component interventions for preventing falls in older people living in the community. Cochrane Database Syst Rev. 2018;7:Cd012221.
43. van den Berg P, Schweitzer DH, van Haard PM, et al. Meeting international standards of secondary fracture prevention: a survey on Fracture Liaison Services in the Netherlands. Osteoporos Int. 2015;26:2257-2263.
44. Javaid MK, Sami A, Lems W, et al. A patient-level key performance indicator set to measure the effectiveness of fracture liaison services and guide quality improvement: a position paper of the IOF Capture the Fracture Working Group, National Osteoporosis Foundation and Fragility Fracture Network. Osteoporos Int. 2020;31:1193-1204.
45. Schene MR, Meijer K, Cheung D, et al. Physical Functioning in Patients with a Recent Fracture: The "Can Do, Do Do" Framework Applied to Explore Physical Capacity, Physical Activity and Fall Risk Factors. Calcif Tissue Int. 2023;113:195–206.
46. Montero-Odasso M, van der Velde N, Martin FC, et al. World guidelines for falls prevention and management for older adults: a global initiative. Age Ageing. 2022;51:afac205.
47. Kojima G Frailty as a predictor of fractures among community-dwelling older people: A systematic review and meta-analysis. Bone. 2016;90:116-122.
48. van Helden S, Wyers CE, Dagnelie PC, et al. Risk of falling in patients with a recent fracture. BMC Musculoskeletal Disorders. 2007;8:1-7.
49. Hadji P, Schweikert B, Kloppmann E, et al. Osteoporotic fractures and subsequent fractures: imminent fracture risk from an analysis of German real-world claims data. Arch Gynecol Obstet. 2021;304:703-712.
50. Geusens P, Lems WF, Bours S, et al. Secondary fracture prevention: Drug treatment, fall prevention and nutrition requirements. Best Pract Res Clin Rheumatol. 2019;33:290-300.
51. Rapp K, Becker C, Lamb SE, et al. Hip fractures in institutionalized elderly people: incidence rates and excess mortality. J Bone Miner Res. 2008;23:1825-1831.
52. Sanders KM, Stuart AL, Scott D, et al. Validity of 12-Month Falls Recall in Community-Dwelling Older Women Participating in a Clinical Trial. Int J Endocrinol. 2015;2015:210527.
53. Ryan JM, Cameron MH, Liverani S, et al. Incidence of falls among adults with cerebral palsy: a cohort study using primary care data. Dev Med Child Neurol. 2020;62:477-482.
Chapter 2 Supplementary material
Supplementary material
Appendix 1. READ terms for exposure ‘Fracture’
Appendix 2. READ terms for outcome ‘Fall’
Online supplement (hyperlink):
aa-23-0770-file004_afad201.pdf
< 30 days of follow up
N=314,093
Appendix 3. Flowchart of inclusion
Cases
N=318,996
N=314,093
Controls
N=318,996
N=316,756
Matched cases and controls
N=312,230
<30 days of follow-up
N=314,093
Males (n=90,298)
Appendix 4. One-year fall incidence rates and incidence rate ratios (1993-2015)
Females (n=221,932)
CI= confidence interval, IR = incidence ratio, IRR = incidence rate ratio, PY= Person Years. Incidence rate ratios were calculated by dividing the incidence rate of the fracture population by the incidence rate of the control population.
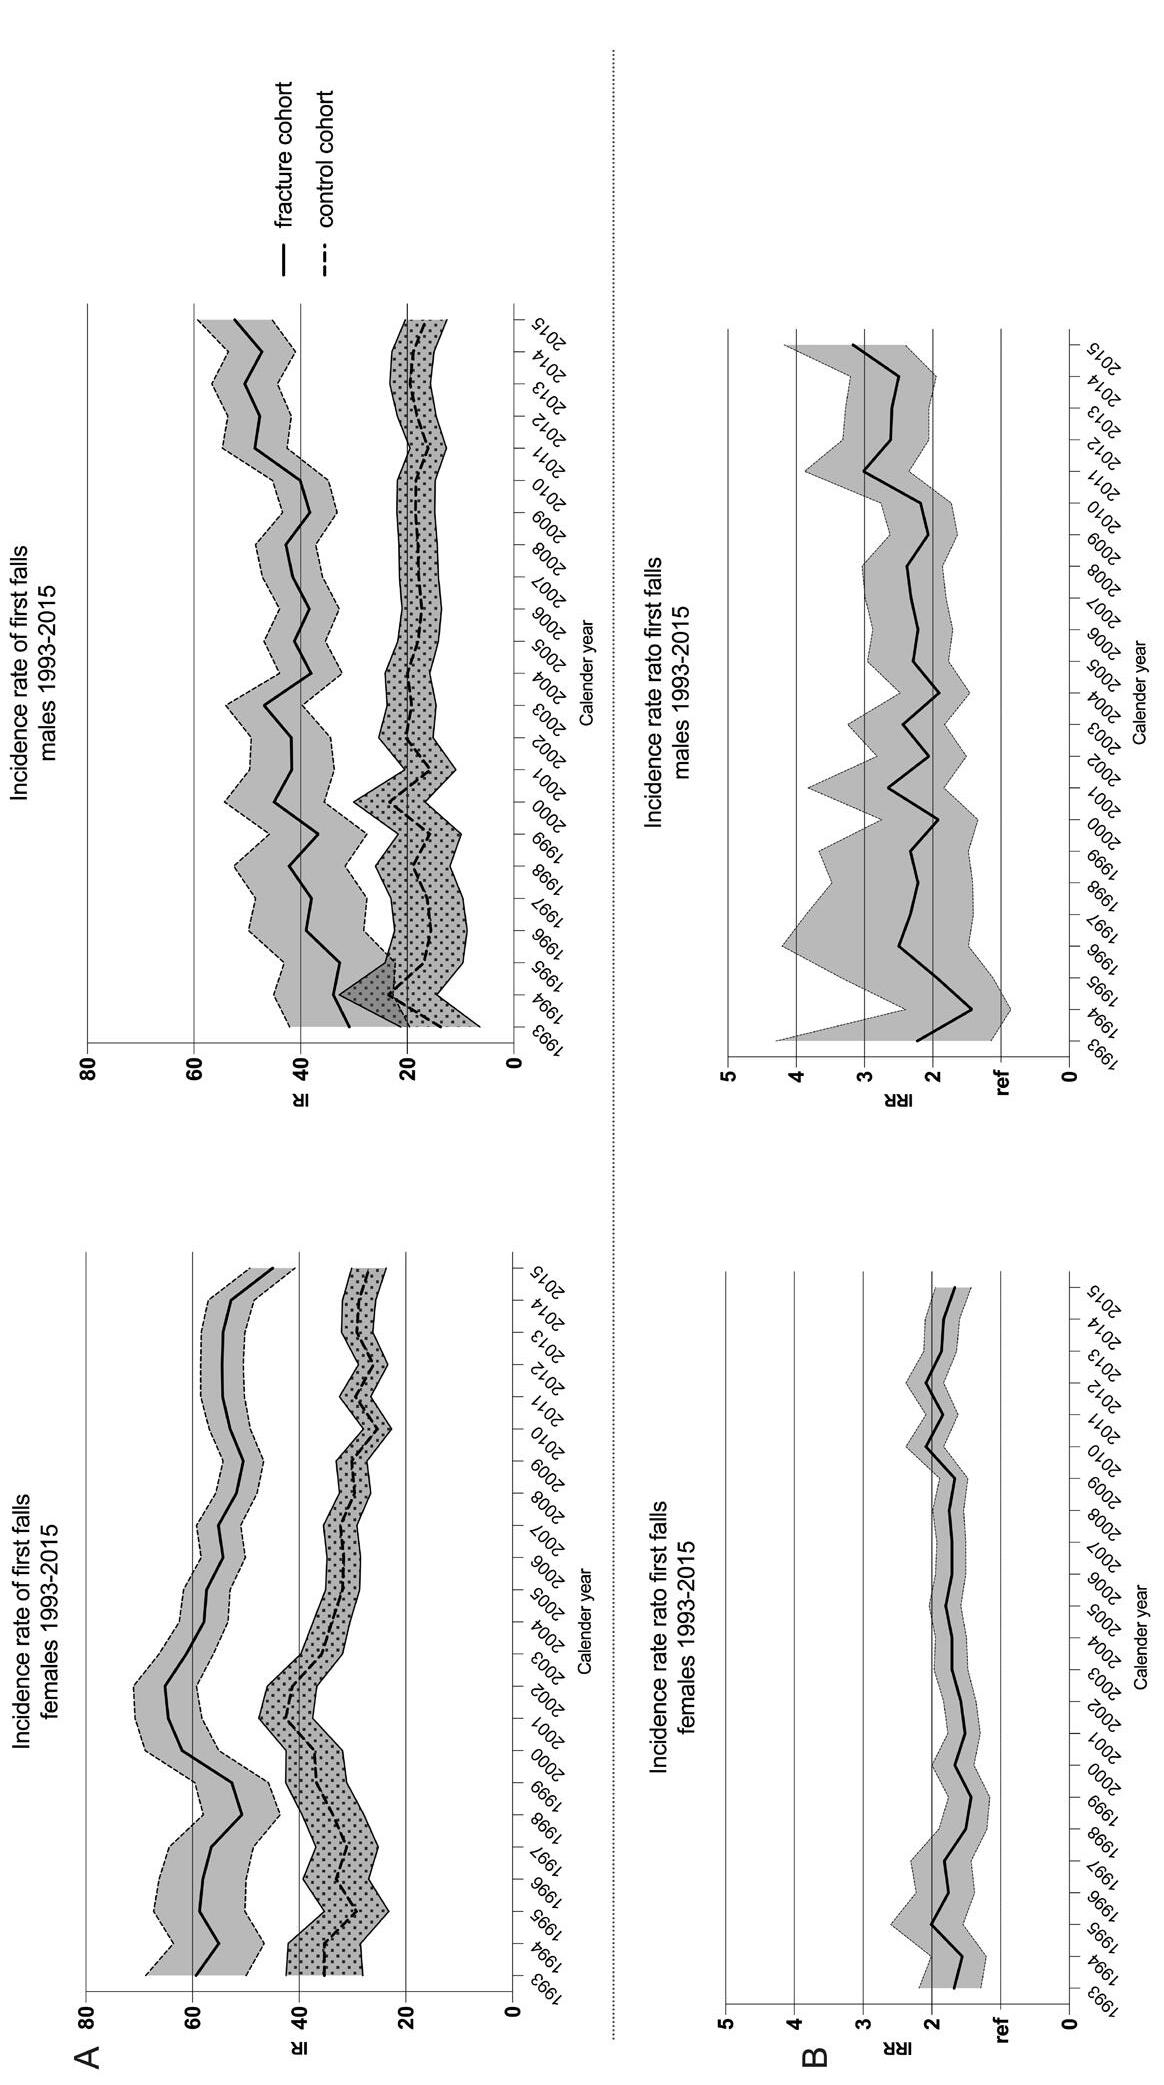
Appendix 5. Secular trends of first falls for each calender year (A) and one-year incidence rate ratio's of first falls for each calander year of the fracture cohort compared to the control cohort
IR = incidence ratio, IRR = incidence rate ratio. Ref = reference point at IRR=1. Appendix 5 panel A shows the incidence rate of first falls for the fracture and control population, stratified to sex.
Panel B shows the incidence rate ratio of first falls for the fracture compared to control population, stratified to sex. IRR was calculated by dividing the IR of first falls of the fracture cohort by the IR of the control cohort, for men and women separately. Results are presented as IR and IRR with corresponding 95% confidence intervals.
Imminent fall risk after fracture
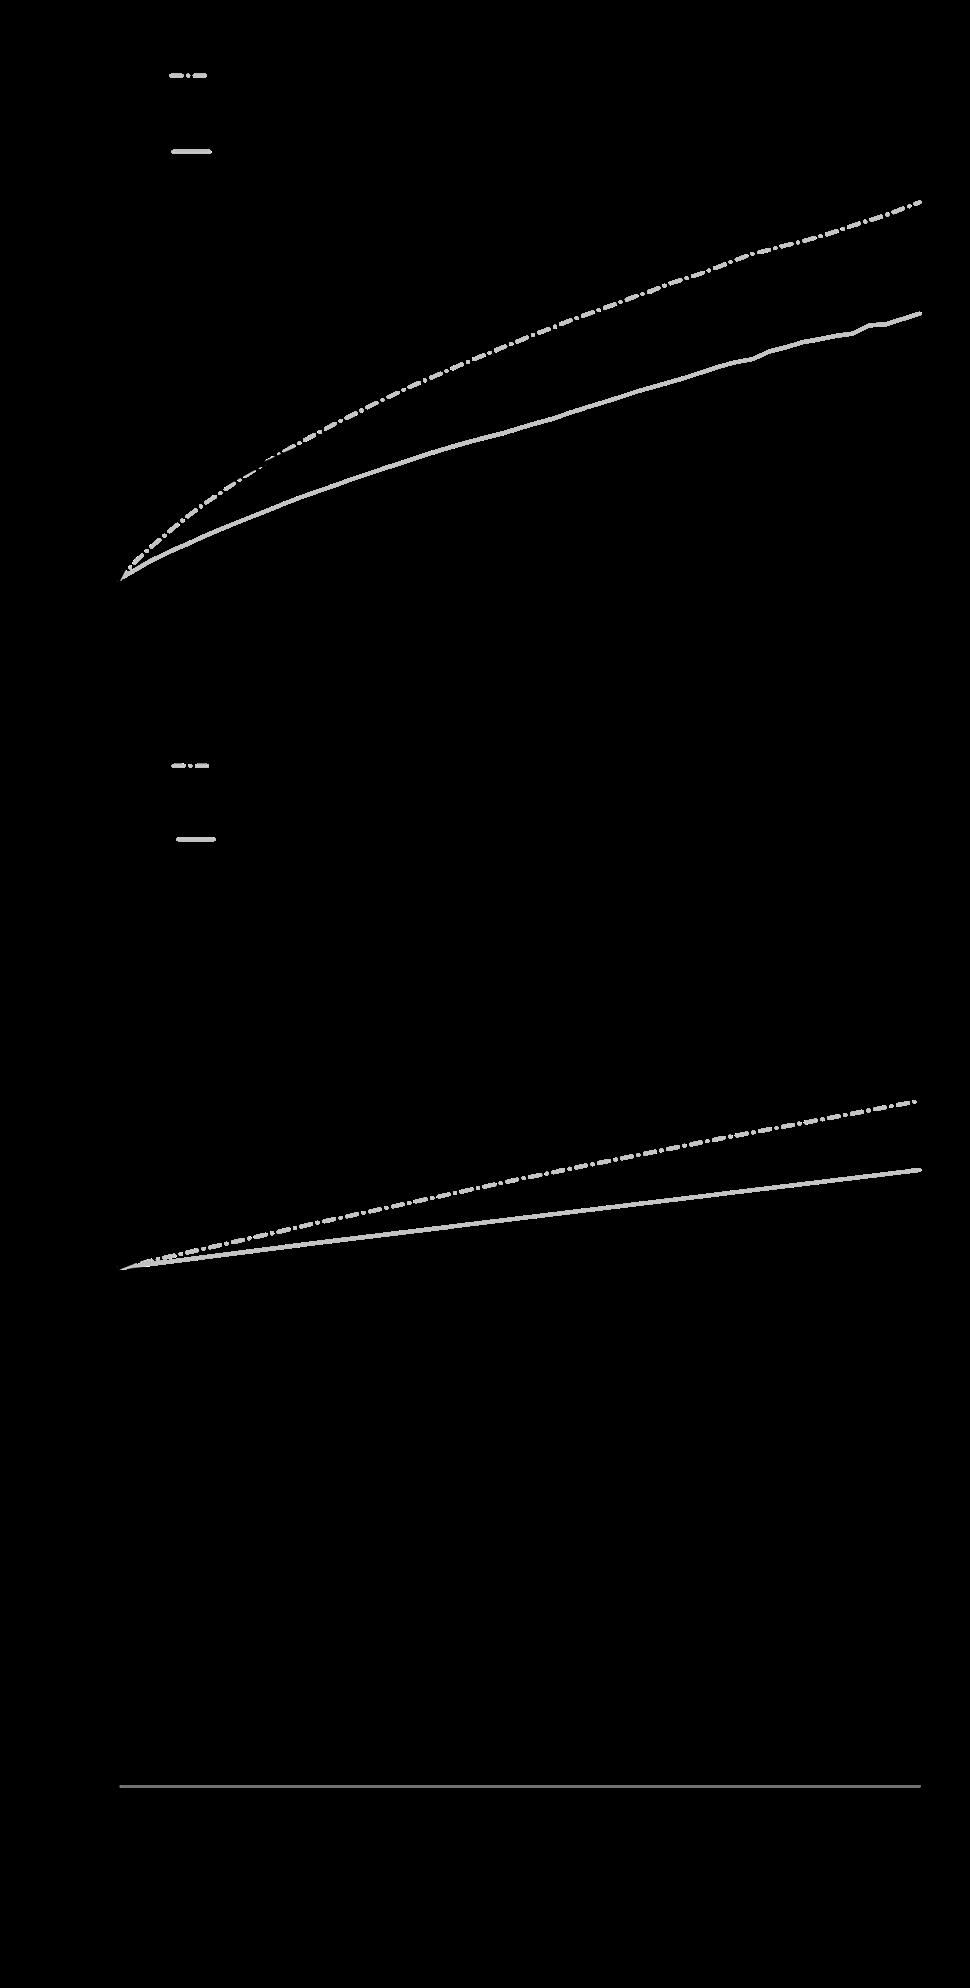
Appendix 6. Cumulative incidence of first falls of the fracture cohort and control cohort RR = relative risk, ref: reference point at RR =1. Appendix 6 Panel A; shows the cumulative incidence of first falls over 24 years of follow-up for the fracture and control population, stratified by sex. The cumulative incidence was calculated while controlling for mortality as a competing risk. Panel B; shows a detail of the first year cumulative incidence. Panel C; shows a detail of the first year relative risk for men and women.
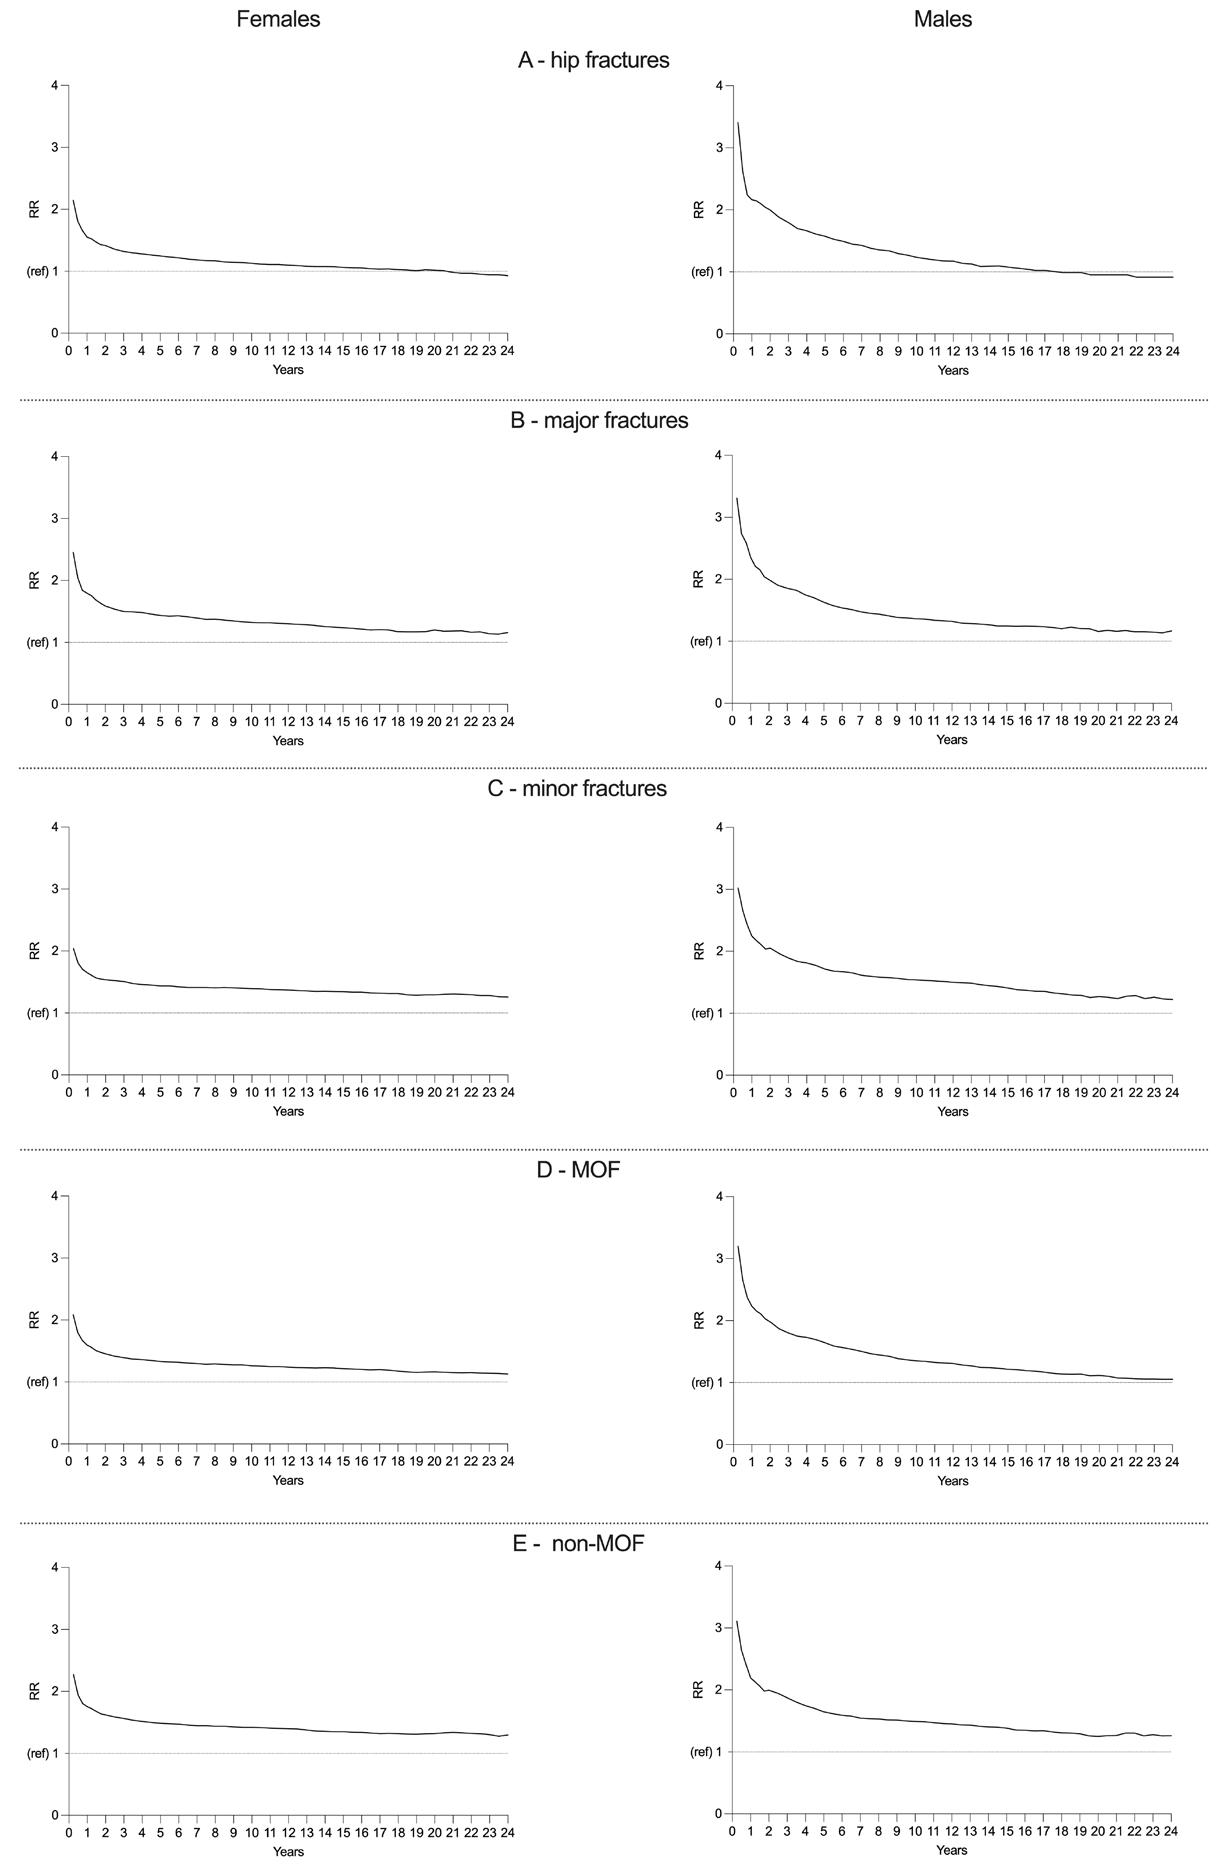
Appendix 7. Relative rist of first falls of fracture cohort compared to the control cohort stratified by sex and index fracture group
RR = relative risk, ref: reference point at RR =1. Appendix 7 shows the relative risk of first falls for all fracture classification groups of the Center and IOF classification. Panels; A: hip (all hip fractures, Center et al. 1999), B: major fractures = vertebral, multiple rib, pelvis, distal femur and proximal humerus fractures (Center et al. 1999), C: minor = all fractures not including hip or major fractures (Center et al. 1999), D: MOF= Hip, vertebral, distal radius and proximal humerus fractures (IOF classification), E: non-MOF = all fractures that are not included in MOF group (IOF classification). The RR was calculated by dividing the cumulative incidence of first falls of the fracture cohort by the cumulative incidence of first falls of the control cohort.
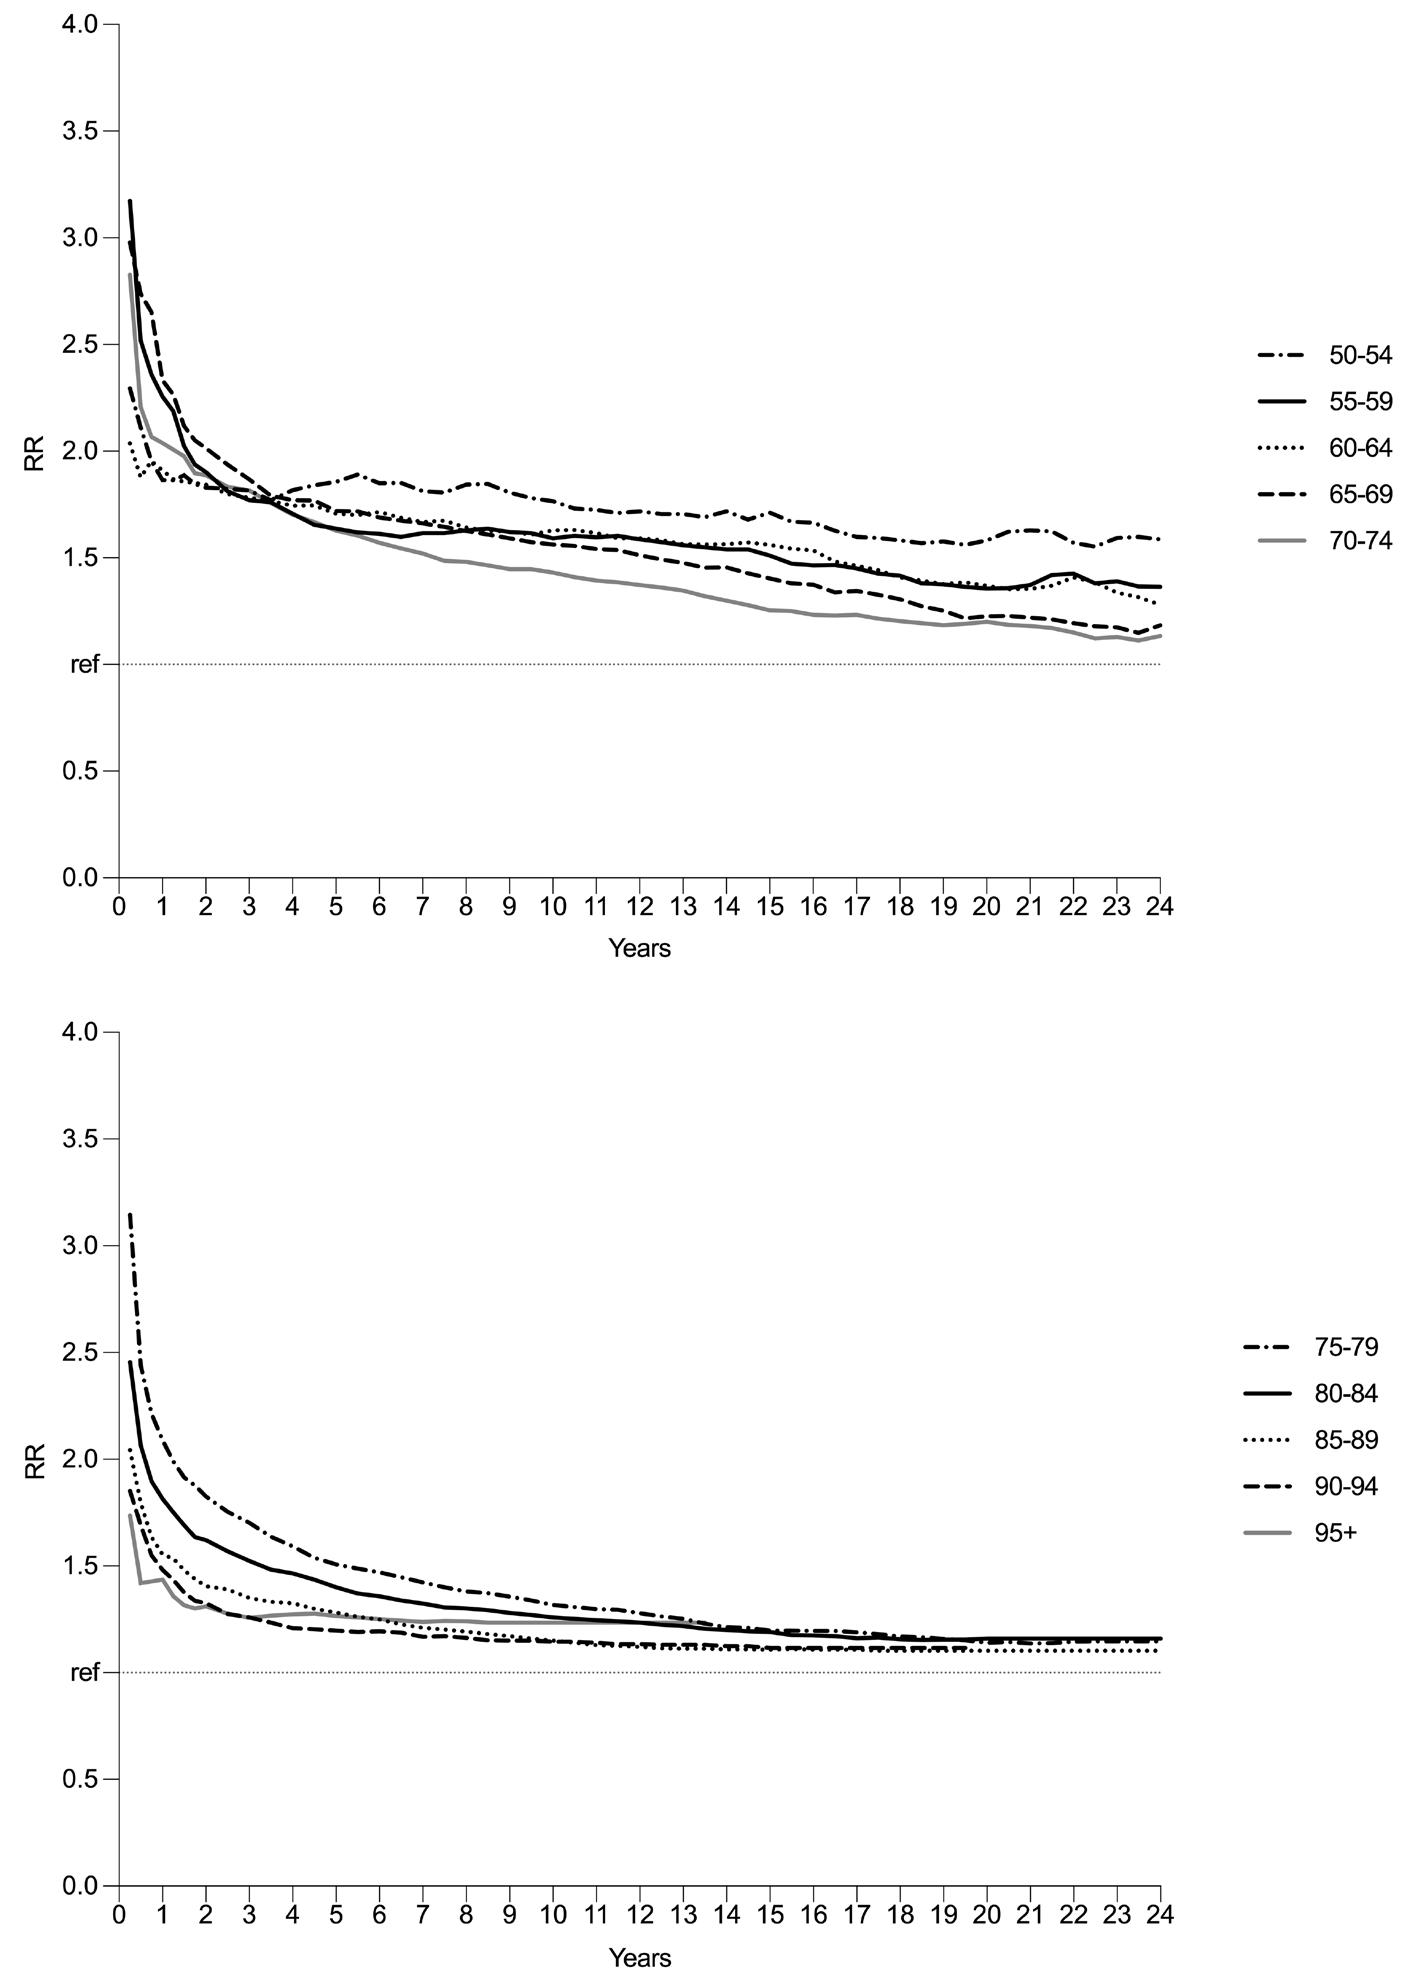
Appendix 8. Relative risk of first falls for fracture compared to control cohort stratified by age group RR = relative risk, ref: reference point at RR =1. Appendix 8 panel A and B show the relative risk of first falls for all age groups between 50 and 95 years old, stratified to age groups of 5 years. The RR was calculated by dividing the cumulative incidence of first falls of the fracture cohort by the cumulative incidence of first falls of the control cohort.
PPI use is not associated with bone microarchitecture and strength assessed with HR-pQCT after three-years follow-up in patients visiting the Fracture Liaison Service
M.R. Schene, M.S.A.M. Bevers, W.J.F. van der Vijgh, J.H.M. Driessen, L. Vranken, R.Y. van der Velde, H.C. Willems, C.E. Wyers, J.P. van den Bergh
Bone 2024, 182: 117066
Background: The use of proton pump inhibitors (PPIs) has been associated with an increased fracture risk in observational studies. However, the reported association between PPI use and bone mineral density (BMD), bone microarchitecture, and bone strength is inconsistent. This study aims to assess the association between PPI use and bone microarchitecture and strength using high-resolution peripheral quantitative CT (HR-pQCT) in a three-year follow-up study in patients with a recent fracture visiting the Fracture Liaison Service (FLS).
Methods: This three-year prospective cohort study included FLS patients aged ≥ 50 years with a recent fracture (median age 62 [IQR 56–69] years, 68.7% females) and without anti-osteoporosis treatment indication. HR-pQCT scans (distal radius and tibia) were obtained at baseline (T0) and three-year followup (T3). Volumetric bone mineral density and bone area, microarchitecture, and strength (micro-finite element analysis) were determined. The association between three-year continuous PPI use and the percentage change in HRpQCT parameters between T0 and T3 was assessed using sex-stratified multivariate linear regression analyses. Covariates included age, BMI, vitamin-D deficiency (< 50 nmol/l), glucocorticoid use, and cardiovascular comorbidity (males and females) fracture type (major/hip vs. all others, only males) and probable sarcopenia (only females).
Results: In total, 282 participants had available medication data throughout follow-up, of whom 20.6% were continuous PPI users. In both males and females with complete HR-pQCT follow-up data (males: N = 69 radius, N = 84 tibia; females: N = 147 radius, N = 168 tibia), PPI use was not associated with the percentage change of any of the bone microarchitecture or strength parameters between T0 and T3 at the radius and tibia as compared to non-use.
Conclusion: Compared to non-use, PPI use was not associated with the change of bone microarchitecture and strength in FLS patients at three years of followup. These results do not support that an altered bone micro-architecture or strength may contribute to the increased fracture risk associated with PPI use, as reported in observational studies.
PPI use is not associated with bone microarchitecture and strength
Proton pump inhibitors (PPIs) are one of the most widely prescribed groups of medication worldwide.1 Common indications for PPI use are acid-related gastrointestinal disorders such as peptic ulcer disease, reflux esophagitis, and H. pylori infection.2 PPIs are also used as a prophylactic agent to prevent gastric complications of non-steroidal anti-inflammatory drugs (NSAIDs) and antiplatelet therapy.1, 3 The occurrence of inappropriate PPI use is high: PPIs are often used longer than needed due to over-prescription and over-the-counter availability, and reevaluation of prescriptions after cessation of the indication is lacking.2, 3 While PPIs are generally considered safe to use,4, 5 they have been associated with side-effects in observational studies including an increased risk of gastro-intestinal infection, pneumonia, and decreased nutrient absorption.2, 6, 7 In recent years, observational studies and systematic reviews discussed the potential side-effects of PPI use on bone health including an increased risk of osteoporosis and fractures.7–11
The mechanisms that could underlie an association between PPI use and fracture risk are not fully elucidated, and the causality between PPI use and future fractures is unclear. Proposed biological mechanisms of PPI associated bone loss include a decrease in the absorption of calcium and vitamin B12 and hypergastrinemia, although results regarding the effect on calcium absorption are conflicting.12, 13 Low calcium absorption and hypergastrinemia could result in secondary hyperparathyroidism and subsequent bone loss, and low vitamin B12 blood levels could affect homocysteine levels that modulate bone turnover.7, 14,1 5
Moreover, PPIs might affect the functioning of osteoclasts and osteoblasts by inhibiting the vacuolar H + -ATPase of osteoclasts and thereby impede osteoclastic resorption and by inhibiting the osteoblastic ability to mineralize bone.7, 16, 17
Nevertheless, the association between PPI use and bone structure and strength is unclear. Associations between PPI use and areal bone mineral density (aBMD), measured with Dual-Energy X-ray Absorptiometry (DXA), are inconsistent: some studies showed an association with decreased BMD,18, 19 while others did not or showed conflicting results.10, 18, 20, 21 Previous studies investigated the association between PPI use and bone geometry, volumetric BMD (vBMD), and strength measured by peripheral quantitative computed tomography (pQCT) and also found no association,22, 23 except for an association with lower trabecular BMD in one study.22 More recently, a cross-sectional study in ambulatory community dwelling persons ≥ 65 years (130 PPI users) used high-resolution pQCT (HR-pQCT) to assess the association between PPI use and bone microarchitecture and strength.24 They concluded that there was no association in multivariable analyses. The association between PPI use and bone microarchitecture has not yet been investigated prospectively, nor has
it been studied in fracture patients, a group that is at high risk for subsequent fractures.25 The aim of this study was therefore to assess the association between PPI use and bone microarchitecture and strength using HR-pQCT in a three-year prospective cohort study of patients with a recent fracture visiting the FLS for fracture risk evaluation.
Methods
Study population
This three-year prospective observational study used data from the FX MoVie study of VieCuri Medical Center, Venlo, The Netherlands. Details of the study population have been published previously.26 Briefly, patients aged 50 years and older, visiting the emergency department of VieCuri Medical Center with a radiologically confirmed low-trauma fracture, were invited to the Fracture Liaison Service (FLS) for fracture risk evaluation. Not invited to the FLS were patients with a fracture due to high-energy trauma, bone metastasis, failure of pros- thesis, or osteomyelitis. Those willing and able to visit the FLS were evaluated at the FLS at 2–4 months after fracture. The evaluation at the FLS included a fracture risk assessment and corresponding personalized treatment according to the Dutch guidelines on osteoporosis and fracture prevention.27 At the FLS visit (T0), patients were asked to participate in the prospective study. Exclusion criteria for the prospective study were cognitive impairment and non-Caucasian race. Patients who were willing and able to participate in the study gave written informed consent prior to participation. The study protocol (registration number NL45707.072.13) was approved by an independent Medical Ethics Committee and complied with the Declaration of Helsinki. For the analyses in the current study, participants that received an antiosteoporotic medication (AOM) prescription were excluded in order to evaluate the effects of PPI on bone microarchitecture and strength without interference of the effects of AOMs. Two participants started using AOM during follow-up and were excluded from prospective evaluation, but included in all baseline analyses. Participants with prescriptions for supplementation of calcium and/or vitamin D were not excluded. One participant did not give consent for HR-pQCT measurements and was excluded. Participants with incomplete medication data during follow-up were excluded from the longitudinal analyses, but were included in the cross-sectional analysis at baseline.
collection
Baseline patient characteristics
Prior to the FLS visit, patients were asked to complete a detailed questionnaire, which included questions on the cause of the fracture, fracture risk factors, medical history, and medication use. At the FLS visit (T0), the questionnaire was evaluated by a trained nurse. The following covariates were collected through the questionnaire: age; sex; BMI (kg/m2); smoking status; alcohol use (> 3 units/day); type of fracture; time since fracture; fracture and fall history prior to the baseline fracture and fall risk factors including self-reported number of falls in the last 12 months; and the presence of fear of falling, dizziness or balance problems or the use of a walking aid (yes/no) and for women also the age of the last menstruation, from which was derived whether female participants experienced menopause ≥ 5 or < 5 years before. Type of fracture, time since fracture and comorbidities were collected from electronic patient records during baseline visits. Fractures were categorized into three groups according to Center et al.28: 1. hip fractures (all hip fractures), 2. major fractures (vertebra, multiple rib, humerus, pelvis, distal femur, and proximal tibia), and 3. minor fractures (including finger and toe fractures). Comorbidities were categorized according to ICD-10 standards29 and included: diabetes mellitus, cardiovascular diseases (CVD; all central and peripheral cardiovascular disease) and medical history of conditions requiring PPI, and gastro-esophageal reflux diseases, including peptic ulcers, gastritis, esophagitis, stomatitis, and diaphragmic hernia.3
Medication use
Medication use at T0 was collected by using medication lists in combination with verification of the actual medication use and the additional use of overthe-counter medication at the baseline visit. Medication use was coded according to the Anatomical Therapeutic Chemical (ATC) codes.30 All changes in medication use during follow-up, including PPI use, were evaluated by research personnel at the FLS during yearly follow-up study visits and were self-reported. During follow-up, dosage and number of daily doses were not available for all participants, and compliance was not explicitly asked. The exposure of interest was continuous PPI use throughout three years of followup. Supplementary Table 1 contains an overview of included ATC codes for PPI use. PPI use was categorized into three groups: 1. no use throughout the study period; 2. intermittent use; and 3. continuous use throughout the three-year study period. Glucocorticoid use was defined as any oral glucocorticoid use during follow-up. NSAID use and antiplatelet therapy was only defined at the baseline visit.
Clinical data and measurements at T0
At T0, the participants’ weight and height were measured, and a blood sample was collected for laboratory evaluation to detect contributors to secondary osteoporosis. It included measures on hyper(para) thyroidism, chronic kidney disease (grade 3 or 4), and vitamin D deficiency (serum 25-hydroxyvitamine D3 < 50 nmol/l).31 The estimated glomerular filtration rate (eGFR) was calculated using the modification of diet in renal disease study group equation. The stages of chronic kidney disease (CKD) were defined according to the KDOQI guidelines.32 CKD was diagnosed ≥ grade 3. Primary hyperparathyroidism (HPT) was diagnosed in case of hypercalcemia and inappropriately normal or elevated levels of iPTH. Secondary HPT was diagnosed in case of elevated plasma iPTH and 25(OH)D < 50 nmol/l and/or ≥ stage 3 CKD. Hyperthyroidism (HTh) was defined as follows; TSH < 0.40 mU/l plus elevated fT4 levels. SECOB was defined as having CKD, HPT, HTh, MGUS, hypogonadism (clinical diagnosis combined with testosterone < 8 nmol/l) and/or celiac disease.31
Physical performance was quantified by measuring the hand grip strength (HGS) and by using the Chair stand test (CST). Test procedures have been previously described.33 The European EWGSOP2 guidelines were used to diagnose probable sarcopenia (having a low HGS or a low score on CST).34 DXA scans (Hologic Inc., Bedford, MA, USA) were obtained at T0 at the total hip, femoral neck, and lumbar spine to assess aBMD, body composition, and prevalent vertebral fractures (VFs). Appendicular lean mass (ALM) was calculated by adding the lean mass of all extremities (kg) and was corrected for squared height.34, 35 Osteoporosis and osteopenia were defined as a aBMD T-score ≤ -2.5 and a T-score between -1.0 and -2.5, respectively, and a normal aBMD was defined as a T-score ≥ -1.0 at the hip, femoral neck, or lumbar spine.36 Vertebral fracture assessment was performed using the lateral spine DXA. VFs were classified according to Genant et al.: grade 1 (20–25% height loss), grade 2 (25–40% height loss), and grade 3 (> 40% height loss).37
HR-pQCT measurements
HR-pQCT scans (XtremeCT II, Scanco Medical AG, Switzerland) were taken at the distal radius and tibia at T0 and at three years follow-up (T3). Conform standard protocol, the non-dominant side was scanned unless prior fracture, surgery, or metal implants, in which case the contralateral side was scanned. At both visits, a 10.2-mm region of the distal radius and tibia was scanned using the scan protocol with fixed offset distance (i.e. scan region starting 9.5 mm and 22.5 mm proximally from the reference line at the radial and tibial endplate, respectively, and extending in proximal direction). This scan protocol was chosen as it has been most commonly used in literature thus far and at the time of the T0 measurements. During scan acquisition, the lower arm and lower leg were immobilized in a motion restraining holder. After acquisition, the quality of a scan was assessed by the operator based on a single low-resolution preview
PPI use is not associated with bone microarchitecture and strength
slice. In case of motion artefacts on the preview slice, the scan was repeated maximally twice. Effective radiation dose was approximately 5 μSv per scan. The quality of the reconstructed scans was assessed using the standard five-point grading system.38 Scans of grade 4–5 were excluded from analysis. The scans of grade 1–3 were analyzed. First, the distal radius and tibia were automatically contoured using software provided with the scanner. The periosteal contours were inspected, and large visual deviations from bone margins were adjusted. Subsequently, the contoured bones were evaluated conform standard analysis methods to quantify total, trabecular, and cortical cross- sectional area and BMD and trabecular and cortical microarchitecture.39 For the cross-sectional analysis of the T0 data, these parameters were determined from the entire HRpQCT scan region. For the longitudinal analysis of the changes at three-year follow-up, the HR-pQCT parameters were determined from the overlapping region of the T0 and T3 scan of each individual participant using slice matching. The median overlap was 95% for the radius scans and 97% for the tibia scans in both men and women. It ranged between 65% and 100%. Additionally, microfinite element (μFE-) analysis was performed to estimate bone strength.39, 40 For both the cross-sectional and longitudinal analysis, the μFE-analysis was performed on the entire scan region to prevent effects of variable scan heights on μFE-outcomes.
At T3, subsequent falls and fractures were assessed. A fall was defined as “an event which results in a person coming to rest inadvertently on the ground or floor or other lower level”.41 During follow-up, falls were recorded by participants in weekly fall diaries that were sent in by post. Research assistants verified and checked the diaries for completeness at 3 and 6 months by telephone and at 12, 24 and 36 months during the regular study visits. All subsequent fractures were confirmed at T3 by radiology reports from the electronic patients records and all fracture types were included.
Baseline characteristics between continuous PPI users and non-users were compared using Student’s t-tests for normally distributed continuous data, Mann-Whitney U Tests for not-normally distributed continuous data, and ChiSquare Tests or Fisher’s Exact Tests for categorical data. Normality of the distribution of continuous parameters was visually assessed. Descriptives of HR-pQCT values at T0 were calculated for both groups. The percentage change in HR-pQCT parameters between T0 and T3 was calculated as follows for each parameter: (T3-T0)/ T0 x 100%. The difference of the percentage changes from zero was assessed using two-sided one-sample Wilcoxon Signed Rank Tests, depending on the normality of the data distribution.
Uni- and multivariate linear regression analyses were performed to assess the association between three-year continuous PPI use and the percentage change in HR-pQCT parameters between T0 and T3. Intermittent PPI users and participants with missing data on follow-up were excluded from the analyses. Multivariate regression analyses were adjusted for the following covariates, based on baseline differences and evidence from literature42: age, BMI, vitamin D deficiency, cardiovascular comorbidity, any oral glucocorticoid use during follow-up, fracture types (major and hip vs minor) only in males and probable sarcopenia only in females. Additionally, sensitivity analyses were performed, including both intermittent and continuous PPI users in the group of PPI users who were compared with non-users using the same uni-and multivariate analysis. Furthermore, cross-sectional analyses were performed using uniand multivariate linear regression analyses to assess the association between PPI-use and HR-pQCT parameters at T0. Multivariate models of the crosssectional regression included age, BMI, vitamin D deficiency, cardiovascular co-morbidity in both males and females, and additionally fracture type (major and hip vs minor) only in males and probable sarcopenia only in females. Threeyear subsequent fracture and fall incidence were assessed for all participants with available HR-pQCT scan data at T0 and T3 of at least one scan location (radius or tibia) and compared between groups using Chi-Square Tests.
All analyses were stratified to sex. In all linear regression analyses, the following assumptions were checked: normality of standardized residuals, outliers, and heteroscedasticity were assessed visually, and multicollinearity was defined as VIF > 2. In case of outliers, authors MS and MB evaluated corresponding HR-pQCT scans, which resulted in the exclusion of data from one scan due to a difference in scan angle between T0 and T3. Analyses were performed in- and excluding outlying datapoint(s) and presented excluding outliers. All analyses were conducted using SPSS for Windows (version 26.0, IBM SPSS Statistics, USA). A p-value < 0.05 was considered statistically significant. We did not correct for multiple testing. Power calculation for the current study had not been performed at the design of the main prospective study as the current study comprises a sub-study of the main study. Yet, a post-hoc power calculation was performed for the current study using a medium effect size (Gpower, 3.1).
Results
Study population
The FX MoVie study included 500 FLS patients that were willing and able to participate (Figure 1-I). After exclusion of participants with AOM treatment, 323 participants were available for analysis. Of those, 19 participants had intermittent PPI use and 22 had incomplete medication data during follow-up.
HR-pQCT
IStudy participants
PPI use is not associated with bone microarchitecture and strength
Inclusion in FXMovie study N = 500
Non-AOM users N = 323
Complete medication data N=282
Continuous PPI users ♀ 39 ♂ 19
T0 radius scans ♀ 35 ♂ 18 T0 tibia scans ♀ 35 ♂ 19
T0+T3 radius scans
♀ 31 ♂ 14
T0+T3 tibia scans ♀ 32 ♂ 19
Non PPI users ♀ 154 ♂ 70 T0 radius scans
♀ 143 ♂ 67 T0 tibia scans ♀ 149 ♂ 69
T0+T3 radius scans
♀ 116 ♂ 55 T0+T3 tibia scans ♀ 136 ♂ 65
AOM users N = 176 No consent HR-pQCT scan N=1
Incomplete medication data during follow-up N = 22
Intermittent PPI users N = 19
Radius scans T0
Missing ♀ 4 ♂ 3
Poor quality ♀ 11 ♂ 1
Tibia scans T0
Missing ♀ 4 ♂ 0
Poor quality ♀ 5 ♂ 1
Start AOM during follow-up ♀ 2
Radius scans T3
Missing ♀ 3 ♂ 4
Poor quality ♀ 26 ♂ 12
Tibia scans T3
Missing ♀ 2 ♂ 1
Poor quality ♀ 12 ♂ 3
Figure 1. Flowchart for inclusion of patients with 3-year follow-up. AOM, anti-osteoporosis medication; PPI, proton-pump inhibitor; N, number of participants; T0, baseline; T3, 3 year follow-up
The other 282 participants had complete medication data during follow-up. Of these 282 participants, 39 females and 19 males were three-year continuous PPI users and 154 and 70 were non-PPI users, respectively. Baseline characteristics of continuous PPI users compared to non-users are presented in Table 1. At T0, female PPI users had a significantly higher BMI and more often probable sarcopenia. Moreover, self-reported fall risk factors, fear of falling, dizziness, and the use of walking aids were all significantly higher in female PPI users compared to non-users. No differences were found in age or duration of the menopause between groups. Male PPI users had more often a hip/major fracture as index fracture compared to non-users. In both males and females, PPI users had more cardiovascular comorbidities and self-reported balance problems. DXA measurements and fracture or fall history were comparable between PPI users and non-users. T0 values of HR-pQCT parameters at the distal radius and tibia of continuous PPI users versus non-users are displayed in Table 2, and no significant differences were found between groups.
Males ( N = 89)
3
Baseline characteristics of 3-year continuous PPI users versus non-users
Table 1.
Females ( N = 193)
Continues variables are described as mean ± SD or median (IQR). Categorical variables are described as number (%). ALM, appendicular lean mass; BMI, body mass index; BMD, bone mineral density; CKD, chronic kidney disease; GERD, gastro-oesophageal reflux disease; SECOB, secondary osteoporosis; VF, vertebral fracture; Vit. Vitamin.
a Any previous fracture other that the baseline fracture.
b SECOB included CKD (grade ≥3), primary or secondary hyperparathyroidism, hyperthyroidism, MGUS, celiac disease, and vitamin D deficiency (<50 nmol/l).
c Probable sarcopenia was defined according to the EWGSOP2 guideline as having either low handgrip strength or low score on the chair stand test.
¥ missing sample data for females; ALM N=8, menopause N=10. falls in the last 12 months N=2; fear of falling N=2; dizziness N=3; balance problems N=3; use of walking aid N=1, and males: probable sarcopenia N=4; falls in the last 12 months N=1; walking aid N=1.
*statistically significant difference between groups (p<0.05).
Table 2. Baseline (T0) values of HR-pQCT parameters at the distal radius and tibia of 3-year continuous PPI users versus non-users
3
Values are described as mean ± standard deviation or median (IQR).
Tb.Ar, trabecular area; Ct.Ar, cortical area; Tt.BMD, total bone mineral density; Tb.BMD, trabecular bone mineral density; Ct.BMD, cortical bone mineral density; Tb.N, trabecular number; Tb.Th, trabecular thickness; Tb.Sp, trabecular separation; Ct.Th, cortical thickness; Ct.Po, cortical porosity; FL, Failure load
The table for distal tablia is continued on the next page.
Table 2. Continued
Cortical microarchitecture
Bone strength
Stiffness (kN/mm)
Values are described as mean ± standard deviation or median (IQR).
Tb.Ar, trabecular area; Ct.Ar, cortical area; Tt.BMD, total bone mineral density; Tb.BMD, trabecular bone mineral density; Ct.BMD, cortical bone mineral density; Tb.N, trabecular number;
Tb.Th, trabecular thickness; Tb.Sp, trabecular separation; Ct.Th, cortical thickness; Ct.Po, cortical porosity; FL, Failure load
Supplementary Figure 1 provides a flowchart of the number of included scans in the cross-sectional analysis of PPI users at T0 compared to nonusers at T0. The analysis showed no association between PPI use and bone microarchitecture and strength parameters at T0 at the distal radius and tibia, in both females and males (Supplementary Tables 2 and 3, respectively), except for a lower stiffness (unstandardized Beta [B] = -23.41 95% confidence interval [CI]: -45.47, -1.35; p = 0.04) and lower failure load (B = 1.19, 95% CI: 0.07, 2.30, p = 0.04) with PPI use in males at the distal tibia in multivariate analyses.
The association between three-year PPI use and bone microarchitecture and strength
Figure 1 provides an overview of the number of available scans of sufficient quality at T0 and the number of available scans of sufficient quality at T0 and T3. For females, 147 (PPI = 31) and 170 (PPI = 32) scans were available for analysis at the distal radius and tibia, respectively, and for males 69 (PPI = 14) and 84 (PPI = 19) scans, respectively. The crude percentages change in the HR-pQCT parameters between T0 and T3 are shown in Supplementary Table 4. The uni- and multivariate analyses of the association between continuous PPI use and percentage change between T0 and T3 showed no significant associations between continuous PPI use and the percentage change in any of the bone microarchitecture and strength parameters at the distal radius and tibia, for both females and males (Tables 3, 4).
As a sensitivity analysis, intermittent PPI use was grouped with continuous PPI use and compared to non-use. For females, 157 (PPI = 41) and 180 (PPI = 44) scans were available for analysis at the distal radius and tibia, respectively, and for males 75 (PPI = 20) and 89 (PPI = 24) scans, respectively. No significant associations between PPI use and the percentage change in HRpQCT microarchitecture and bone strength parameters between T0 and T3 at the distal radius and tibia were found in both females and males, except for a significantly lower trabecular number (p = 0.015) and higher trabecular separation (p = 0.028) of PPI use in males at the distal tibia (data not shown).
The three-year fall incidence for female PPI users (N = 34) was 76.5% versus 69.3% in non-PPI users (N = 140), p = 0.41 (missing fall data N = 5). For male PPI users (N = 19), the fall incidence was 52.6% versus 56.1% in non-PPI users (N = 66), p = 0.79 (missing fall data N = 3). The three-year subsequent fracture incidence for female PPI users (N = 144) was 11.4% versus 8.3% in non-users (N = 35), p = 0.57. For male PPI users (N = 69), the subsequent fracture incidence was 10.5% versus 5.8% for non-PPI users (N = 19), p = 0.47.
Table 3. Uniand multivariate analysis of the association between continuous PPI use and percentage change between T0 and T3 in HR-pQCT parameters of female participants
Association between PPI use and % change in HR-pQCT parameter between T0 and T3 Distal Radius
N =32, non-PPI N =136
PPI use is not associated with bone microarchitecture and strength
N =31, non-PPI N =116
Trabecular microarchitecture
0.26
Tb.Th -0.44 -1.25, 0.37 0.28 -0.48 -1.32, 0.35 0.26 -0.24 -0.99, 0.52 0.54 -0.03 -0.82, 0.75 0.93 Tb.Sp
Cortical microarchitecture
Ct.Th -0.13 -1.70, 1.44 0.87 -0.65 -2.25, 0.95 0.42 -0.75 -2.32, 0.83 0.35 -0.93 -2.56, 0.70 0.26
3.40
0.90
0.94 0.27
Bone strength
0.99 0.31 -1.18
2.27
Tb.Ar, trabecular area; Ct.Ar, cortical area; Tt.BMD, Total bone mineral density; Tb.BMD, trabecular bone mineral density; Ct.BMD, cortical bone mineral density; Tb.N, trabecular number; Tb.Th, trabecular thickness; Tb.Sp, trabecular separation; Ct.Th, cortical thickness; Ct.Po, cortical porosity; FL, Failure load; CI, confidence interval; B, unstandardized Beta of % change.
No significant differences were found between PPI users and non-users at p<0.05.
Outcomes presented of data analysis excluding outliers. Number of outliers: distal radius: Tb.Ar. N =3; Ct.Ar N =2; Tot.BMD=1, Ct.BMD N =1; Tb.N =2, Tb.Sp N =4; Ct.Th N =1; Ct.Po N =4;
Stiffness N=2, FL N =2; distal tibia: Tb.Ar N =4, Tot.BMD N =2; Tb.BMD N=1, Tb.N N =1, Tb.Sp N= 1Ct.Po, N =1.
None of the analyses including outliers was statistically significant at p<0.05.
All multivariate analyses were adjusted for age, BMI, vitamin D deficiency <50 nmol/l, any glucocorticoid use, cardiovascular comorbidity and probable sarcopenia.
Table 4. Uniand multivariate analysis of the association between continuous PPI use and percentage change between T0 and T3 in HR-pQCT parameters of male participants
3
Association between PPI use and % change in HR-pQCT parameter between T0 and T3
Distal tibia PPI N =19, non-PPI N =65
Distal Radius PPI N =14, non-PPI N =55
Trabecular microarchitecture
Cortical microarchitecture
Tb.Ar, trabecular area; Ct.Ar, cortical area; Tt.BMD,total bone mineral density; Tb.BMD, trabecular bone mineral density; Ct.BMD, cortical bone mineral density; Tb.N, trabecular number; Tb.Th, trabecular thickness; Tb.Sp, trabecular separation; Ct.Th, cortical thickness; Ct.Po, cortical porosity; FL, failure load; CI, confidence interval; B, unstandardized Beta of % change.
No significant differences were found between PPI users and non-users at p<0.05.
Outcomes presented of data analysis excluding outliers. Number of outliers: distal radius: ; Ct.Po N=3; distal tibia: Ct.Ar N =1 Tt.BMD N =1, Tb BMD N =2 Tb.Th N =1, Tb.Sp N =1, Ct.Th N =2,
Stiffness N =1. (*) analysis including outlier was statistically significant at p<0.05.
All multivariate analyses were adjusted for age, BMI, any glucocorticoid use, vitamin D deficiency <50 nmol/l, cardiovascular comorbidity and baseline fracture type.
This study aimed to investigate the association between PPI use and microarchitecture and strength parameters measured by HR-pQCT in a threeyear prospective study in patients aged 50 years and older visiting the FLS after a recent fracture. No significant associations were found between continuous PPI use and the change in any HR-pQCT parameters over three years. Thus, the results of this study do not support that an altered bone microarchitecture or strength may contribute to the increased fracture risk associated with PPI use, as often reported in observational studies.
In a few analyses in males at the distal tibia, the comparison between PPI use and non-use yielded a p < 0.05 (lower stiffness and failure load in the T0 analyses, Supplementary Table 3; and lower trabecular number and higher separation in the longitudinal sensitivity analyses including intermittent PPI users, data not shown). However, these associations were not found in the comparison of mean and median T0 HR-pQCT values (Table 2), they were sexand site-specific (i.e., they were not found in females, or at the radius in males) and were not found in the longitudinal analyses of PPI use and percentage changes in HR-pQCT parameters over three years (Tables 3 and 4). Therefore, these associations shown in this study may more likely be the result of the large number of analyses performed than of a true association. The crude percentages of change were significantly different from zero for most HRpQCT parameters in both PPI users and non-users (Supplementary Table 4). However, they were smaller than the least-significant changes reported for second-generation HR-pQCT in literature for all parameters in all groups,43, 44 except for total and cortical BMD at the distal radius and tibia (female PPI users and non-users) and trabecular area at the distal radius (female PPI users and non-users). Lastly, in this study we did not find a significant difference in three-year subsequent fracture incidence between PPI users and non-PPI users, although the number of subsequent fractures was low.
Our results are in line with a recent cross-sectional study in community dwelling older adults of Kondapalli et al. who did not find a significant association between PPI use (N = 130 out of 601 subjects aged 65+) and HR-pQCT parameters in their multivariable analysis, except for a 4.2% lower cortical BMD at the tibia in males, which they interpreted as not relevant, as this difference was small and did not affect bone strength.24 In a cross-sectional pQCT-study based on data from the InCHIANTI study, Maggio et al. found no differences in cortical volumetric BMD and trabecular and cortical bone area at the tibia in PPI users (N = 36 out of 1038 subjects, aged 65+). They did find a significantly lower trabecular volumetric BMD at the tibia compared to non-users.22 However, they did not stratify their analyses to sex and the number of PPI users in their sample was small. Our results do not support this finding, as no association between PPI use and trabecular BMD was found.
Lastly, in a cross-sectional pQCT-study, Targownik et al. found no associations between PPI use (N = 52 out of 104) and volumetric BMD and cortical thickness at the femur or any of the bone strength measures including buckling ratio and section modulus.23 The lack of associations between PPI use and bone microarchitecture and strength in our baseline and longitudinal analyses, as well as in other studies using high and low resolution CT data, do not support previously proposed biological, cellular, and molecular mechanisms to explain an association of PPI use with fracture risk on the basis of on a deterioration of bone microarchitecture.7, 9, 10, 15, 17
Importantly, by using HR-pQCT, only the structural bone properties but not the material properties (e.g. matrix composition, collagen structure) can be assessed. Tissue mineral density could be evaluated using HR-pQCT, i.e. the density of the segmented bone with exclusion of pores and inter-trabecular spaces, to get insights into the mineralization of bone. However, this parameter is not a standard HR-pQCT measure and was therefore not evaluated. As such, we cannot exclude that PPI use may influence the bone material and thereby contribute to the possible association with fracture risk. Future research should therefore include study on the association between PPI use and bone material.
An alternative possible explanation for the association between PPI use and fractures, found in larger cohort studies, could be a higher fall risk in PPI users, as also previously proposed by Lespessailles et al. and Kondapalli et al.7,24 In population-based research, residual confounding (i.e. remaining confounding after correction for confounding variables in multivariable analysis) might play a role when evaluating the association between PPI use and bone parameters. PPI users have a higher comorbidity burden, frailty, and polypharmacy, and lower physical performance, which are all independent risk factors for falls and fractures.24, 45, 46 Several studies showed an increased fall risk in PPI users compared to non-users.46–48 PPI use has also been associated with a number of fall risk factors (e.g. dizziness, functional decline and visual problems in older adults46, 48). In our study we did not find a significant difference in three-year fall incidence between PPI users versus non-users, but we did find differences in patient characteristics related to fall risk of PPI users versus non-users (Table 1). However, further assessment of fall risk factors was beyond the scope of this study.
Strengths and limitations
Our study had several strengths. In contrast to previous studies in this field, our study has a longitudinal design. PPI use was assessed during follow-up, allowing for analysis of continuous use versus non- use. Second, we are the first to assess PPI use and bone micro-architecture and strength in a population with a recent fracture visiting the FLS, a population that has a high subsequent fracture risk, and thus a high need for adequate secondary fracture prevention.25 Moreover, our FLS population was relatively homogeneous, in contrast to the study of
PPI use is not associated with bone microarchitecture and strength
Kondapalli et al.,24 as we used a clearly defined population and only included Caucasians, and excluded patients with prescription of AOM at baseline to prevent influences of AOMs on bone micro-architecture and strength. There were also several limitations. First, while being a strength of our study, our selection of a homogeneous population is also a limitation as it reduces the generalizability of the results to other ethnicities or populations. By using an FLS population, our cohort is a selection of patients that were willing and able to attend the FLS after a recent fracture and willing and able to participate in the prospective study. This resulted in a relatively young population with less severe fractures as compared to non-attenders. The exclusion of AOM-users further limits the generalizability of the study, but was done in order to evaluate the effects of PPI on the bone without interference of the effects of AOMs. Second, we had no data on the dose and duration of PPI use before the start of the study, only on whether a PPI was used. Furthermore, the data on PPI-use between baseline and three-year follow-up visit were self-reported (allowing for recall bias) and did not include information on dosing. As a result, we could not examine the possible effects of PPI dose and duration in our study, while previous research has demonstrated a stronger likelihood of fractures with higher PPI doses or prolonged use.11 Third, the group of PPI users was small, especially in men. Correspondingly, a post-hoc performed power calculation showed that our study was powered to evaluate differences of a medium effect size between PPI-use and non-use in women, but not in men. Therefore, our results in men should be interpreted with caution, and study in a larger male cohort is needed before firm conclusions can be drawn on the effects of PPI use on bone microarchitecture and strength in men. Nevertheless, the results in women suggest no association between PPI use and changes in bone microarchitecture and strength.
Conclusion
Compared to non-use, PPI use was not associated with the change of bone microarchitecture and strength in a three-year prospective study in male and female FLS patients with a recent fracture. These results do not support that an altered bone microarchitecture or strength may contribute to the increased fracture risk associated with PPI use, as reported in observational studies. Future studies should focus on the exploration of fall risk factors and bone material properties and fracture risk in PPI users.
1. Farrell B, Lass E, Moayyedi P, et al. Reduce unnecessary use of proton pump inhibitors. Bmj. 2022;379:e069211.
2. Heidelbaugh JJ, Kim AH, Chang R, et al. Overutilization of proton-pump inhibitors: what the clinician needs to know. Therap Adv Gastroenterol. 2012;5:219-232.
3. Savarino V, Dulbecco P, de Bortoli N, et al. The appropriate use of proton pump inhibitors (PPIs): Need for a reappraisal. Eur J Intern Med. 2017;37:19-24.
4. Moayyedi P, Eikelboom JW, Bosch J, et al. Safety of Proton Pump Inhibitors Based on a Large, MultiYear, Randomized Trial of Patients Receiving Rivaroxaban or Aspirin. Gastroenterology. 2019;157:682-691.e682.
5. Attwood SE, Ell C, Galmiche JP, et al. Longterm safety of proton pump inhibitor therapy assessed under controlled, randomised clinical trial conditions: data from the SOPRAN and LOTUS studies. Aliment Pharmacol Ther. 2015;41:11621174.
6. Savarino V, Dulbecco P, Savarino E Are proton pump inhibitors really so dangerous? Dig Liver Dis. 2016;48:851-859.
7. Lespessailles E, Toumi H Proton Pump Inhibitors and Bone Health: An Update Narrative Review. Int J Mol Sci. 2022;23:10733.
8. Park DH, Seo SI, Lee KJ, et al. Long-term proton pump inhibitor use and risk of osteoporosis and hip fractures: A nationwide population-based and multicenter cohort study using a common data model. J Gastroenterol Hepatol. 2022;37:15341543.
9. Zhou B, Huang Y, Li H, et al. Proton-pump inhibitors and risk of fractures: an update meta-analysis. Osteoporos Int. 2016;27:339-347.
10. Nassar Y, Richter S Proton-pump Inhibitor Use and Fracture Risk: An Updated Systematic Review and Meta-analysis. J Bone Metab. 2018;25:141-151.
11. Poly TN, Islam MM, Yang HC, et al. Proton pump inhibitors and risk of hip fracture: a metaanalysis of observational studies. Osteoporos Int. 2019;30:103-114.
12. Hansen KE, Jones AN, Lindstrom MJ, et al. Do proton pump inhibitors decrease calcium absorption? J Bone Miner Res. 2010;25:2786-2795.
13. Wright MJ, Sullivan RR, Gaffney-Stomberg E, et al. Inhibiting gastric acid production does not affect intestinal calcium absorption in young, healthy
individuals: a randomized, crossover, controlled clinical trial. J Bone Miner Res. 2010;25:2205-2211.
14. O'Connell MB, Madden DM, Murray AM, et al. Effects of proton pump inhibitors on calcium carbonate absorption in women: a randomized crossover trial. Am J Med. 2005;118:778-781.
15. Fitzpatrick D, Lannon R, Laird E, et al. The association between proton pump inhibitors and hyperparathyroidism: a potential mechanism for increased fracture-results of a large observational cohort study. Osteoporos Int. 2023;34:1917–1926.
16. Briganti SI, Naciu AM, Tabacco G, et al. Proton Pump Inhibitors and Fractures in Adults: A Critical Appraisal and Review of the Literature. Int J Endocrinol. 2021;2021:8902367.
17. Costa-Rodrigues J, Reis S, Teixeira S, et al. Dosedependent inhibitory effects of proton pump inhibitors on human osteoclastic and osteoblastic cell activity. Febs j. 2013;280:5052-5064.
18. Aleraij S, Alhowti S, Ferwana M, et al. Effect of proton pump inhibitors on bone mineral density: A systematic review and meta-analysis of observational studies. Bone Rep. 2020;13:100732.
19. Shin YH, Gong HS, Baek GH Lower Trabecular Bone Score is Associated With the Use of Proton Pump Inhibitors. J Clin Densitom. 2019;22:236242.
20. Lau YT, Ahmed NN Fracture risk and bone mineral density reduction associated with proton pump inhibitors. Pharmacotherapy. 2012;32:67-79.
21. Amoako AO, Jafilan L, Nasiri P, et al. Correlation of Bone Mineral Density Scores and Proton Pump Inhibitors Use in the Elderly. Curr Rheumatol Rev. 2016;12:162-166.
22. Maggio M, Lauretani F, Ceda GP, et al. Use of proton pump inhibitors is associated with lower trabecular bone density in older individuals. Bone. 2013;57:437-442.
23. Targownik LE, Goertzen AL, Luo Y, et al. LongTerm Proton Pump Inhibitor Use Is Not Associated With Changes in Bone Strength and Structure. Am J Gastroenterol. 2017;112:95-101.
24. Kondapalli A, Agarwal S, Germosen C, et al. Bone microstructure in proton pump inhibitor users. Bone. 2023;168:116668.
25. van Geel TA, van Helden S, Geusens PP, et al. Clinical subsequent fractures cluster in time after first fractures. Ann Rheum Dis. 2009;68:99-102.
26. Vranken L, Wyers CE, Van der Velde RY, et al.
PPI use is not associated with bone microarchitecture and strength
Association between incident falls and subsequent fractures in patients attending the fracture liaison service after an index fracture: a 3-year prospective observational cohort study. BMJ Open. 2022;12:e058983.
27. Dutch Institute for Healthcare Improvement CBO. Richtlijn Osteoporose en Fractuurpreventie, Derde Herziening [Dutch] Dutch Institute for Healthcare Improvement CBO, Utrecht, The Netherlands 2011.
28. Center JR, Nguyen TV, Schneider D, et al. Mortality after all major types of osteoporotic fracture in men and women: an observational study. Lancet. 1999;353:878-882.
29. World Health Organisation. ICD-10: international statistical classification of diseases and related health problems, Tenth revision. World Health Organisation, Geneva, Switzerland. 2004
30. WHO Collaborating Centre for Drug Statistics Methodology. ATC/DDD Index 2023. Norwegian Institute of Public Health. 2023 https://www. whocc.no/atc_ddd_index/ Accessed 15-6-2023
31. Bours SP, van Geel TA, Geusens PP, et al. Contributors to secondary osteoporosis and metabolic bone diseases in patients presenting with a clinical fracture. J Clin Endocrinol Metab. 2011;96:1360-1367.
32. Kidney Disease: Improving Global Outcomes (KDIGO) CKD-MBD Update Work Group Clinical Practice Guideline Update for the Diagnosis, Evaluation, Prevention, and Treatment of Chronic Kidney Disease-Mineral and Bone Disorder (CKDMBD). Kidney Int Suppl. 2017;7:1-59.
33. Schene MR, Meijer K, Cheung D, et al. Physical Functioning in Patients with a Recent Fracture: The "Can Do, Do Do" Framework Applied to Explore Physical Capacity, Physical Activity and Fall Risk Factors. Calcif Tissue Int. 2023;113:195–206.
34. Cruz-Jentoft AJ, Bahat G, Bauer J, et al. Sarcopenia: revised European consensus on definition and diagnosis. Age Ageing. 2019;48:16-31.
35. Cawthon PM Assessment of Lean Mass and Physical Performance in Sarcopenia. J Clin Densitom. 2015;18:467-471.
36. World Health Organisation. Prevention and management of osteoporosis. World Health Organization, World Health Organization Technical Report Series 2003.
37. Genant HK, Wu CY, van Kuijk C, et al. Vertebral fracture assessment using a semiquantitative technique. J Bone Miner Res. 1993;8:1137-1148.
38. Pialat JB, Burghardt AJ, Sode M, et al. Visual grading of motion induced image degradation in high resolution peripheral computed tomography:
impact of image quality on measures of bone density and micro-architecture. Bone. 2012;50:111118.
39. Whittier DE, Boyd SK, Burghardt AJ, et al. Guidelines for the assessment of bone density and microarchitecture in vivo using high-resolution peripheral quantitative computed tomography. Osteoporos Int. 2020;31:1607-1627.
40. Pistoia W, van Rietbergen B, Lochmüller EM, et al. Estimation of distal radius failure load with microfinite element analysis models based on threedimensional peripheral quantitative computed tomography images. Bone. 2002;30:842-848.
41. World Health Organization. Step safely: strategies for preventing and managing falls across the lifecourse. World Health Organization, World Health Organization 2021.
42. van den Bergh JP, Szulc P, Cheung AM, et al. The clinical application of high-resolution peripheral computed tomography (HR-pQCT) in adults: state of the art and future directions. Osteoporos Int. 2021;32:1465-1485.
43. Kemp TD, de Bakker CMJ, Gabel L, et al. Longitudinal bone microarchitectural changes are best detected using image registration. Osteoporos Int. 2020;31:1995-2005.
44. Chiba K, Okazaki N, Isobe Y, et al. Precision of 3D Registration Analysis for Longitudinal Study of Second-Generation HR-pQCT. J Clin Densitom. 2021;24:319-329.
45. Corsonello A, Maggio M, Fusco S, et al. Proton pump inhibitors and functional decline in older adults discharged from acute care hospitals. J Am Geriatr Soc. 2014;62:1110-1115.
46. Lewis JR, Barre D, Zhu K, et al. Long-term proton pump inhibitor therapy and falls and fractures in elderly women: a prospective cohort study. J Bone Miner Res. 2014;29:2489-2497.
47. Seppala LJ, van de Glind EMM, Daams JG, et al. Fall-Risk-Increasing Drugs: A Systematic Review and Meta-analysis: III. Others. J Am Med Dir Assoc. 2018;19:372.e371-372.e378.
48. Lapumnuaypol K, Thongprayoon C, Wijarnpreecha K, et al. Risk of fall in patients taking proton pump inhibitors: a meta-analysis. Qjm. 2019;112:115-121.
Chapter 3 Supplementary material
Inclusion in FXMovie study
N = 500
Study participants
Non-AOM users
N = 322
Baseline PPI users
♀ 42 ♂ 20
HR-pQCT availability
T0 radius scans
♀ 38 ♂ 18
T0 tibia scans
♀ 38 ♂ 20
Non PPI users
♀ 179 ♂ 81
T0 radius scans
♀ 167 ♂ 67
T0 tibia scans
♀ 174 ♂ 80
No HR-pQCT measurement N = 1
AOM users N = 176
Intermittent PPI
prescription N=1
Radius scans
Missing: ♀ 5 ♂ 1
Poor quality: ♀ 11 ♂ 4
Tibia scans
Missing: ♀ 4
Poor quality: ♀ 5 ♂ 1
Supplementary figure 1. Flowchart for inclusion for the analysis of the cross-sectional association of PPI use at T0 and HR-pQCT parameters at T0
AOM, anti-osteoporosis medication
PPI, proton-pump inhibitor
N, number of participants
T0 = baseline
PPI use is not associated with bone microarchitecture and strength
Supplementary table 1. ATC codes PPI use
ATC code Medication name
A02BC Proton pump inhibitors
A02BC05 esomeprazole
A02BC01 omeprazole
A02BC02 pantoprazole
A02BC03 lansoprazole
A02BC04 rabeprazole
A02BC06 dexlansoprazole
A02BC07 dexrabeprazole
A02BC53 lansoprazole, combinations
A02BC54 rabeprazole, combinations
A02BD Combinations for eradication of Helicobacter pylori
A02BD01 omeprazole, amoxicillin and metronidazole
A02BD02 lansoprazole, tetracycline and metronidazole
A02BD03 lansoprazole, amoxicillin and metronidazole
A02BD04 pantoprazole, amoxicillin and clarithromycin
A02BD05 omeprazole, amoxicillin and clarithromycin
A02BD06 esomeprazole, amoxicillin and clarithromycin
A02BD07 lansoprazole, amoxicillin and clarithromycin
A02BD09 lansoprazole, clarithromycin and tinidazole
A02BD10 lansoprazole, amoxicillin and levofloxacin
A02BD11 pantoprazole, amoxicillin, clarithromycin and metronidazole
A02BD12 rabeprazole, amoxicillin and clarithromycin
A02BD13 rabeprazole, amoxicillin and metronidazole
A02BD16 omeprazole, amoxicillin and rifabutin
M01AE52 combinations with NSAIDs
M01AE52 naproxen and esomeprazole
Supplementary table 2. Uniand multivariate analysis of the cross-sectional association between PPI use and HR-pQCT outcomes of female participants at T0
Baseline measures
Baseline measures
radius
PPI=18.5%
(mg HA/cm 3 )
Trabecular microarchitecture Tb.N (mm -1 )
Cortical microarchitecture
Ct.Th (mm)
Ct.Po (%)
Bone strength
Stiffness (kN/mm) -0.35 -4.77, 4.07 0.88 -0.46 -4.72, 3.80 0.83 3.03 -7.24, 13.31 0.56 2.08 -7.69, 11.86 0.68 FL (kN) 0.00 -0.25, 0.25 0.99 0.02 -0.22, 0.26 0.90 -0.16 -0.68, 0.37 0.56 -0.11 -0.60, 3.92 0.68
Tb.Ar, trabecular area; Ct.Ar, cortical area; Tt.BMD, total bone mineral density; Tb.BMD, trabecular bone mineral density; Ct.BMD, cortical bone mineral density; Tb.N, trabecular number; Tb.Th, trabecular thickness; Tb.Sp, trabecular separation; Ct.Th, cortical thickness; Ct.Po, cortical porosity; FL, Failure load; CI, confidence interval; B, unstandardized Beta; PPI, proton pump inhibitor * Statistically significant at p<0.05 Number of outliers: distal radius Ct.Po N=1; distal tibia Tb. Sp N=2. No analysis including outlier was statistically significant at p<0.05.
All multivariate analyses were adjusted for age, BMI, vitamin D deficiency < 50 nmol/l, cardiovascular comorbidity and probable sarcopenia
Supplementary Table 3. Uniand multivariate analysis of the cross-sectional association between PPI use and HR-pQCT outcomes of male participants at baseline
Baseline HR-pQCT measures
Baseline HR-pQCT measures
Distal radius N=96, PPI=18.8% Distal tibia N=100, PPI=20%
PPI use is not associated with bone microarchitecture and strength
2 )
Volumetric BMD Tt.BMD (mg HA/cm 3 )
(mg HA/cm 3 )
(mg HA/cm 3 )
Trabecular microarchitecture Tb.N (mm -1 )
(mm)
(mm)
Cortical microarchitecture
(mm)
Ct.Po (%) 0.08 -0.18, 0.35 0.55 0.08
Bone strength
(kN/mm)
(kN)
Tb.Ar, trabecular area; Ct.Ar, cortical area; Tt.BMD, total bone mineral density; Tb.BMD, trabecular bone mineral density; Ct.BMD, cortical bone mineral density; Tb.N, trabecular number; Tb.Th, trabecular thickness; Tb.Sp, trabecular separation; Ct.Th, cortical thickness; Ct.Po, cortical porosity; FL, Failure load; CI, confidence interval; B, unstandardized Beta; PPI, proton pump inhibitor
* Statistically significant at p<0.05 Number of outliers: distal radius Tb. Sp N=2; distal tibia Tb. Sp N=2. No analysis including outlier was statistically significant at p<0.05.
All multivariate analyses were adjusted for age, BMI, vitamin D deficiency < 50 nmol/l, cardiovascular comorbidity and fracture type (hip/major vs minor, finger or toe)
Supplementary table 4. Percentage change between T0 and T3 in HR-pQCT parameters at the distal radius and tibia of three-year continuous PPI users versus non-users
Males
Females
Distal radius N = 31 N = 116 N = 14 N = 55
Bone area
(-0.17, 0.82) 0.28 (-0.34, 0.62)*
Tb.Ar 0.92 (-0.04, 1.49)* 0.80 (0.17, 1.34)*
Ct.Ar -3.51 (-6.18, 0.27)* -3.01 (-5.58, -0.72)* -0.56 (-3.01, 0.51) -0.78 (-3.16, 0.98)*
Volumetric BMD
(-2.02, 0.85) -0.40 (-2.41, 0.33)*
Tt.BMD -3.20 (-5.40, -0.87)* -3.17 (-4.83, -1.44)*
Tb.BMD -0.44 (-2.57, 3.22) 0.03 (-1.78, 3.06) -0.32 (-0.95, 1.25) 0.25 (-0.58, 1.78)
Ct.BMD -1.80 (-3.38, -0.20)* -2.38 (-3.39, -1.19)* -0.41 (-1.66, 0.17) -1.15 (-2.21, 0.06)*
Trabecular microarchitecture
Tb.N -0.95 (-2.13, 0.75) -1.49 (-4.06, 0.71)* -2.51 (-6.70, -0.32)* -0.89 (-4.67, 1.94)
Tb.Th 0.46 (-0.86, 1.72) 0.49 (-0.45, 1.78)* -0.77 (-0.99, 0.95) 0.00 (-0.45, 1.23)
Tb.Sp 0.73 (-0.15, 2.08) 1.67 (-0.33, 3.60)* 1.41 (0.23, 5.32)* 0.77 (-1.25, 3.00)
Cortical microarchitecture
Ct.Th -2.60 (-5.63, -0.23)* -2.16 (-4.69, -0.50)* -0.61 (-2.59, 0.48) -0.76 (-2.80, 0.76)*
Ct.Po 11.1 (-14.3, 28.6)* 18.3 (-8.33, 44.1)* 14.1 (-1.19, 33.3)* 11.1 (0.00, 29.4)*
Bone strength Stiffness -2.96 (-7.34, 0.59)* -2.15 (-6.06, 2.23)* 3.74 (-1.78, 7.16) -0.58 (-4.38, 4.79)
FL -3.34 (-7.80, 1.24)* -2.79 (-6.53, 2.33)* 3.80 (-2.25, 6.38) -0.34 (-4.43, 5.19)
N = 65
N = 19
N = 136
N = 32
Distal tibia
Bone area
Tb.Ar 0.49 (-0.04, 0.98)* 0.30 (-0.03, 0.87)* 0.07 (-0.12, 0.28) 0.09 (-0.24, 0.46)
Ct.Ar -2.12 (-5.61, 0.16)* -1.77 (-4.85, 0.29)* -0.36 (-1.28, 0.92) -0.42 (-1.83, 1.14)
Volumetric BMD
Tt.BMD -2.67 (-4.75, -0.53)* -1.65 (-3.47, -0.05)* -0.53 (-1.73, 0.31) -0.39 (-1.57, 0.23)*
Tb.BMD 0.96 (-1.31, 2.26) 0.44 (-0.90, 2.40)* 0.00 (-2.19, 1.13) 0.68 (-0.33, 1.76)*
Ct.BMD -2.17 (-4.38, -1.21)* -2.38 (-3.77, -1.03)* -1.25 (-2.63, -0.82)* -1.46 (-2.29, -0.54)*
Trabecular microarchitecture
Tb.N 0.27 (-3.35, 2.78) -1.06 (-3.84, 1.31)* -2.11 (-5.89, 0.69) -0.57 (-5.53, 2.60)
Tb.Th 0.83 (-0.65, 2.63)* 1.13 (0.00, 2.30)* 0.00 (-0.75, 2.54) 0.39 (-0.38, 1.75)*
Tb.Sp -0.06 (-1.58, 2.70) 1.17 (-0.85, 3.37)* 1.94 (-0.66, 4.86) 0.27 (-1.37, 3.86)*
Cortical microarchitecture
Ct.Th -1.45 (-4.22, 0.58)* -1.54 (-3.97, 0.65)* 0.07 (-1.06, 0.67) 0.13 (-1.67, 1.32)
Ct.Po 0.00 (-11.1, 16.8) 5.76 (-8.17, 20.5)* 9.38 (-6.25, 23.8) 4.76 (-4.08, 17.2)*
-3.00 (-6.67, -0.57)* -1.96 (-5.95, 0.36)* 0.60 (-2.82, 2.20) -0.08 (-2.21, 1.93)
Bone strength Stiffness
FL -2.55 (-6.46, -0.51)* -1.99 (-6.02, 0.17)* 0.24 (-3.06, 1.79) -0.37 (-1.87, 1.51)
Values are described as median (IQR).
Tb.Ar, trabecular area; Ct.Ar, cortical area; Tt.BMD, total bone mineral density; Tb.BMD, trabecular bone mineral density; Ct.BMD, cortical bone mineral density; Tb.N, trabecular number;
Tb.Th, trabecular thickness; Tb.Sp, trabecular separation; Ct.Th, cortical thickness; Ct.Po, cortical porosity; FL, Failure load
*Significantly different from 0 (p<0.05, two-sided).
PPI use is not associated with bone microarchitecture and strength
M.R. Schene, H.C. Willems, J.H.M. Driessen, L. Vranken, F.O. Lambers
Heersprink, H.M.J. Janzing, R.Y. van der Velde, J.P. van den Bergh, C.E. Wyers
Osteoporosis International 2024, 35: 851–862
Abstract
Summary: Impaired physical performance is associated with increased fracture risk. Performance on four physical functioning tests and prevalence of sarcopenia were assessed for 1789 fracture patients and compared to reference data. Performance was low on all tests, especially for patients with a hip, major or ≥ 1 prevalent vertebral fracture.
Introduction: Impaired physical performance and sarcopenia are associated with increased fracture risk. This study aims to assess physical performance and the prevalence of sarcopenia in patients with a recent clinical fracture attending the Fracture Liaison Service (FLS) compared to population means.
Methods: In this cross-sectional study, chair stand test (CST), handgrip strength (HGS), timed-up-and-go (TUG), 6-min walking-test (6MWT), and sarcopenia (following EWGSOP2) were assessed. The proportion of patients with impaired/ poor performance compared to reference data was calculated (Z-score: ≥ -2 SD to < -1 (impaired) and < -2 SD (poor)). Associations of fracture type, sex, age, and time since fracture with Z-scores were assessed using linear regression analyses.
Results: A total of 1789 consecutive FLS patients were included (median age (IQR): 66 (59–74), 70.7% females, mean 3.9 SD 1.6 months after fracture). The prevalence of impaired/poor performance for CST, HGS, TUG, and 6MWT was 39.2%, 30.4%, 21.9%, and 71.5%, respectively (expected proportion of 16%) and 2.8% had sarcopenia. Lower Z-scores (P < 0.001) were found for hip, major, and ≥ 1 prevalent vertebral fracture (VF) in CST (major: regression coefficient (B) (95%CI) = -0.25 [-0.34, -0.16]; hip: B = -0.32 [-0.47, -0.17], VF: B = -0.22 [-0.34, -0.11]), TUG; (major: B = -0.54 [-0.75, -0.33]; hip: B = -1.72 [-2.08, -1.35], VF: B = -0.61 [-0.88, -0.57]), 6MWT (major: B = -0.34 [-0.47, -0.21]; hip: B = -0.99 [-1,22, -0.77], VF: B = -0.36 [-0.53, -0.19]).
Conclusions: Physical performance is significantly lower in FLS patients compared to healthy peers, especially in patients with hip, major or prevalent VF. These findings underline the need to assess and improve the physical performance of FLS patients, despite a low prevalence of sarcopenia.
Fractures are most common in older persons and comprise an increasing health concern with substantial costs, a lower quality of life, and an increased risk of subsequent fractures and mortality in our aging population.1, 2 The risk of subsequent fractures is the highest immediately after the index fracture.3 However, a large treatment gap still remains in secondary fracture prevention including fracture risk evaluation and treatment. Consequently, recommendations to optimize post-fracture care were made by several international societies including the International Osteoporosis Foundation (IOF).4, 5 These recommendations include the implementation and optimisation of specialised Fracture Liaison Services (FLSs). At the FLS, a standardized evaluation of secondary fracture risk and personalized treatment based on these risks is offered.6, 7 FLS care has shown to effectively reduce the risk of subsequent fractures and mortality.7 Fall risk evaluation is advised, but often not yet routinely implemented in FLS care, and has only recently been named as a key performance indicator by the Capture the Fracture network.6 However, the importance of fall risk evaluation at the FLS is evident; up to 90% of fractures are caused by a fall and patients attending the FLS have a high prevalence of fall risk factors ranging from 60 to 84%.8, 9 Recently, a prospective study of FLS patients reported a subsequent 3-year fracture incidence of 11%, even though patients were treated according to current fracture prevention guidelines, with extensive fracture risk evaluation and according treatment, e.g., by antiosteoporotic medication.10 While evaluating these subsequent fractures, 78% were found to be fall related, half of which was sustained at the first fall and suffering a fall after the initial fracture resulted in a ninefold higher risk of a subsequent fracture.10 A recent large population-based study found similar patterns of imminent fall and fracture risk after incident fracture, suggesting that the imminent fracture risk might very well be attributable to an imminent fall risk.11 Fall risk is caused by a variety of risk factors, of which a decline in muscle strength and physical performance are amongst the most important.12, 13 Muscle strength and physical performance can be quantified by several performance tests, that are also used in the revised algorithm of the European Working Group on Sarcopenia in Older People (EWGSOP2) to assess sarcopenia in clinical practice.14 Recent efforts in older populations have shown sarcopenia and decreased performance on several tests be associated with a higher future fracture risk.15, 16 Also, in fracture populations, many studies report on lower functional performance after incident fracture, as summarized in a review by Szulc.17
However, in this review, large heterogeneity was present among the included studies, e.g., in terms of fracture type, ages (mostly older patients, not including ages 50–65 year olds), and sex of the populations that were studied and interventions such as exercise training that were performed after the fracture. Thus, clinicians lack a comprehensive overview of the physical performance of patients at the time of FLS evaluation, including the ‘younger’ fracture patients, and patients with a broad range of fracture types.
In this study, we present measurements of four physical performance tests the chair stand test (CST), hand grip strength (HGS), the timed up and go (TUG), and the 6-min walking test (6MWT) in patients attending the FLS after a recent clinical fracture. While poor performance on these tests is often defined using cut-off scores, we aim to give a comprehensive overview of physical performance of FLS patients by comparing these measures to age- and sexrelated reference data (mean and SD) using Z-scores.
Study population
A cross-sectional study was conducted in patients with a clinical vertebral or non-vertebral fracture attending the Fracture Liaison Service (FLS) in VieCuri Medical Center located in the south of the Netherlands from November 2013 to June 2016. Subsequent fracture risk evaluation includes clinical evaluation, laboratory tests, medication review, vertebral fracture assessment (VFA), bone mineral density (BMD) measurement using DXA, and ideally also a fall risk assessment.6, 18 All adults aged 50–90 that visited the emergency department with a radiologically confirmed fracture were screened for fracture risk evaluation by trained nurses. Those eligible for fracture risk evaluation were invited to attend the FLS as part of usual care. Ineligible patients were persons living outside of the region, with a low life expectancy (less than a year), or already under care for osteoporotic or oncological care. Further, patients with facial and skull fractures, prosthetic failure, pathological fracture, or osteomyelitis were not invited. For this study, patients with missing values on weight and height, or missing values on all functional performance tests (CST, HGS, TUG, and 6MWT) due to logistical issues (e.g., issues around availability of equipment, appointment scheduling, or lack of time or personnel) or unknown causes were excluded. Patients who were unable to perform these tests due to physical inability were included. Patients were evaluated and treated according to the Dutch guidelines for osteoporosis and fracture prevention.19
Age at the time of fracture, weight (kg), height (cm), and BMI (kg/m2) were measured during the FLS visit. During the FLS visit, the patients were asked to complete a questionnaire containing information about medical history and medication use, residential status, cause of the fracture, and information on previous fractures. Furthermore, medical history was extracted from medical records of the emergency department visit. Comorbidities were classified according to the tenth revision of International Classification of Disease (ICD10). Dual-energy X-ray absorptiometry (DXA, Hologic Inc, Bedford, MA, USA), was used to measure bone mineral density (BMD) and measurements of body composition. Osteoporosis was defined as bone mineral density T-score ≤ -2.5, osteopenia as T-score between -1.0 and -2.5, and a normal BMD as a T-score ≥ -1.0 at the hip, femoral neck, or lumbar spine.20 Prevalent vertebral fractures (VFs) were assessed on lateral spine images acquired with DXA. The grading of VFs was done morphometrically using the classification of Genant,21 based on percentage height loss and were categorized according to the most severe VF, as follows; grade 1 (20 to 25%), grade 2 (> 25 to 40%), or grade 3 (height loss > 40%). Appendicular lean mass (ALM) was calculated as the sum of lean tissue in the arms and legs (kg)22 and was corrected for squared height.14
Physical functioning tests at baseline included CST, HGS, TUG, and 6MWT. All tests have a good to excellent inter-rater reliability in older populations with and without comorbidities (supplemental Table 1). All tests were conducted by trained nurses. Lower body strength was assessed by 30-s CST.23 Participants were instructed to start in seated position, to not use the armrests, cross the arms over the chest, stand up, and fully sit back down in-between stands. The measured outcome was the number of times a person can fully stand up from a chair in 30 s time. HGS was measured by handheld dynamometer (JAMAR, Sammons Preston, Bolingbrook, Illinois). HGS testing was performed in seated position, with the elbows flexed at 90°. The maximum handgrip strength from three attempts for the left hand and three attempts for the right hand was used for analysis and was defined as the best score out the six attempts. TUG was used to measure balance, walking ability and overall mobility.24 Participants were asked to rise from a chair with armrests, walk for three meters, turn, walk back to the chair, and sit down. The use of walking aids was permitted. The measured outcome was time to perform TUG in seconds. The TUG was performed three times and the mean score was calculated. If patients could only perform the test one or two times, the mean of those scores was used. Lastly, 6MWT was used to measure walking ability and functional exercise capacity.25 Patients were asked to walk up and down between the safety cones on either end of a 10 m level linoleum hallway, at a comfortable speed, while covering as much distance as possible. Use of walking aid was permitted and patients were
allowed to rest or stop when needed. No encouragements were given during the test. Patients performed the test one time, and walking distance in meters (6MWD) was scored. Confirmed sarcopenia was defined according to the EWGSOP2 criteria, as having either low HGS or low CST scores, and low ALM, e.g., “confirmed sarcopenia”.14 “Probable sarcopenia” was defined as having either low CST or low HGS scores. The guideline’s cut-off scores for HGS are < 16 kg for females and < 27 kg for males and of CST > 15 s for five rises. As the 30-s CST was performed in this study, the cut-off score for low performance on CST was adapted to < 10 stands in 30 s. The guideline defines low ALM as < 7.0 kg/m2 for males and < 5.5 kg/m2 for females. Osteosarcopenia was defined as having “confirmed sarcopenia,” combined with having osteoporosis or osteopenia.26
Fracture classification
Fractures were grouped in three ways; first, according to the Center classification into four different fracture categories: 1. hip fractures, 2. major fractures (vertebra, multiple rib, humerus, pelvis, distal femur, and proximal tibia), 3. minor fractures; all remaining except fingers and toes which were grouped separately in group 4.2 Multiple fractures were allocated according to the most severe fracture. The Center classification groups’ fractures based on mortality risk after the fracture. Second, fractures were grouped according to the most important osteoporotic fractures of the IOF classification: major osteoporotic fracture (MOF) including lower arm, hip, humerus, clinical vertebrae fractures, and non-MOF fractures (all other fractures). The third grouping covered all lower extremity fractures (any fracture from the pelvis down) versus all upper body fractures (all other fractures) and was chosen to differentiate if proximity of the fracture is of influence on the physical performance.
Reference data selection
To adequately assess physical performance of the FLS patients, a comparison to a healthy age- and sex-related reference population using Z-scores was chosen, comparable with the use of T-scores in osteoporosis measurements. While many test cut-off points for poor physical performance are proposed in the literature, some methodological issues could lead, when used, to a biased overview of poor physical performance in a population. First, a wide variety of different cut-off scores exist for all tests without established consensus on the optimal cut-off point. Cut-off scores are developed based on different outcomes for poor performance (e.g., the TUG cut-off score for is falls 15 s, for fractures 13.5 s, and sarcopenia 20 s.14, 15, 27 Last, most are a “one-size fits all” cut-off score and not stratified to age and sex,14, 15, 27 which could lead to over- or underestimation of test results in specific groups. To secure optimal reference data of the general population, we carried out a semi-structured literature
Physical performance and sarcopenia assessment in FLS patients
search in March 2022. The search strategy incorporated a combination of “Medical Subject Headings” or “Title/ Abstract” terms describing “reference values” and physical performance test, e.g., “TUG, 6MWT, CST or HGS.” The search strategy, outcome and rationale of the literature search is presented in Supplementary Table 1 and 2. For the TUG we applied the reference data from Svinøy et al.,28 a large (N = 5400) Norwegian cross-sectional study including community-dwelling older persons aged 60–84 and published mean and SD’s that were comparable to other study in a Western population of Kenny et al. [29]. Results of Kenny et al. for the age categories 50–60 were studied and it was decided that the reference values of Svinøy et al. for 60 year olds could be extrapolated to 50–60 year olds. For 30CST and 6MWT, reference data was provided by Rikli and Jones et al. including 7183 community dwelling adults from the United States aged 60–94.30 The reference data from Rikli and Jones dates from 1999. However, reference data for the 30 s CST were particularly scarce and the testing method of Rikli and Jones was completely identical to ours as they were the first to develop this test. CST outcome of Rikli and Jones were compared to a more recent German cohort study of Albrecht et al. that did not meet inclusion criteria of the age range and results between the two studies were largely comparable.31 Based on a comparison with other literature,32 it was decided that the reference values of Rikli and Jones et al. for 60 year olds could be extrapolated to 50–60 year olds. For the 6WMT, not all inclusion criteria were met; no study had identical testing methods except for Beekman et al.;33 however, they did not present results stratified to age and sex groups. Means and SD of Rikli and Jones were used and their sexstratified outcomes were compared to Beekman et al. and Casanova et al.34 both of the latter reported higher means in both sexes. Thus, possible low performance of the FLS population might be even higher if other reference populations were used.30 Finally, for the HGS, the reference data were derived from the meta-analysis of Dodds et al. which included data on HGS of 49,964 persons from 12 general population studies from across the United Kingdom,35 with similar testing methods and high comparability with reference data from other developed countries.
In the descriptive analysis mean and SD were calculated for normal distributed data. For non-normally distributed data medians and interquartile ranges were presented. Normality was visually assessed, and due to the large sample size approximately normal distributions were accepted. Patient specific Z-scores were calculated for each test, using the age- and sex-specific means and SD derived from the literature. The mean Z-scores were tested against the theoretical expected value of 0 of the reference population (the healthy age- and sex-related peers) using one-sample T-tests. Fracture group-specific boxplots
of the Z-scores were created, according to center classification, stratified to sex and age. All categories shown have >5 persons included in the analysis. Impaired and poor performance were defined as scoring 1SD and 2SD below age and gender norms, respectively, and proportions of impaired and poor performance were calculated. Patients who were physically unable to perform these tests were included in the poor performance group (> 2SD deviance from normative expectations). Uni- and multivariate linear regression models were used to investigate the association between the different fracture groupings and the Z-scores of the different performance tests. Following groups were tested: center major and hip fractures (with Center Minor as reference group), IOF MOF (non-MOF as reference group), lower extremity (upper extremity fractures as reference group), prevalent VF, excluding all patients with a clinical vertebral fracture (no prevalent VF as reference group). Multivariable analyses were adjusted for age, sex, and time since fracture. As a sensitivity analysis the descriptive analysis of the performance tests, comparison of Z-scores using T-tests and the proportions of impaired and poor performance were also calculated for the population excluding finger and toe fractures, as these fractures are often not included in FLS populations. A P value of < 0.05 was considered statistically significant. Statistical analyses were run in SPSS (IBM SPSS Statistics 28).
Between November 2013 and June 2016, a total of 1947 patients attended the FLS, of whom 92% (N=1789, 70.7% females) were included in this study (flowchart presented in Supplementary Figure 1). Population characteristics are presented in Table 1. Median age (IQR) was 64 (57–74) and 66 (59–74) for males and females, respectively, with 10% of the patients aged 80 years or older. The FLS visit took place at a mean of 3.9±1.6 months after fracture and 92.6% of patients were evaluated at the FLS within 6 months after fracture. Osteoporosis was diagnosed in 20.4% of males and 30.7% of females and 16.9% and 14.2% had at least one prevalent grade 2–3 vertebral fracture, respectively. Results of physical performance tests were available for 1759 (90.9%), 1781 (92.0%), 1733 (89.5%), and 1725 (89.1%) of the participants for CST, HGS, TUG, and 6MWT, respectively (supplemental Figure 1). The characteristics of patients with missing functional performance measures were similar to the total population. Results stratified by sex are shown in Table 2. Based on the EWGSOP2 criteria, 3.3% of males and 2.5% of the females had sarcopenia. The proportion of patients with probable sarcopenia was 30.9% for males and 42.8% for females. Percentages of osteosarcopenia were 3.1% for males and 2.3% for females.
Table 1. Population characteristics
Physical performance and sarcopenia assessment in FLS patients
BMD = bone mineral density; BMI = Body Mass Index; COPD = Chronic Obstructive Pulmonary Disease. Prevalent vertebral fracture = Grade 2-3 vertebral fractures of the Genant classification. a count(%); b median (IQR); c mean ±SD.
Table 2. Overview of physical performance measures of FLS population
Outcome
tests
Sarcopenia
Comparison of mean Z-scores to reference population Total Cohort
Test N Mean difference of Z-score 95% CI of mean difference One sided t-test
6MWT Z-Score 1725 -1.71 -1.76 to -1.65 P<0.0001
ALM = appendicular lean mass; CST = chair stand test; HGS = handgrip strength; TUG = timed up and go; 6MWD = 6 minute walking distance, 6MWT = 6 minute walking test. Sarcopenia was determined according to EWGSOP2 guidelines
As shown in Table 2, the mean Z-score in our FLS population was significantly lower compared to the reference population (P < 0.0001) for CST -0.72 (95% CI -0.76, -0.69), HGS -0.54 (95% CI -0.58, -0.48), TUG -0.34 (95% CI -0.43, -0.25) and 6MWT -1.71 (95%CI -1.76 to -1.65). Of the FLS patients, 32.6%, 18.9%, 8.5% and 36.4% had an impaired performance (Z-score between -1 to -2 SD) on CST, HGS, TUG, and 6MWT, compared to an expected proportion of 13.6% in the reference population, respectively (Table 3). Further, a poor performance (< -2SD) was shown in 6.6%, 11.4%, and 13.1% and 35.2% on CST, HGS, TUG, and 6MWT respectively, compared to 2.3% in the reference population. Proportions of impaired and poor performance were similar between males and females. Proportions of poor and impaired performance were higher compared to expected proportions throughout all age groups, except for TUG scores of 50–59 year olds in both males and females (data not shown).
As presented in Figure 1, for CST, 6MWT, and HGS, a lower performance was shown for all age groups and fracture types (hip, major, minor, and finger and toe) in both males and females. For CST and 6MWT, the interquartile range of all ages and fracture types was below the theoretical population mean of 0. For TUG, low performance was most pronounced in hip fracture patients and patients aged 80+ with a major fracture.
Table 3. Proportion of patients with impaired and poor performance
Impaired a and poor b performance
CST = chair stand test; HGS = handgrip strength; TUG = timed up and go; 6MWT = 6 minute walking test a Impaired performance includes persons with test Z-score between -1SD to -2SD b Poor performance includes patients with test Z-score <-2SD, and include persons who were unable to perform physical function tests due to physical inability
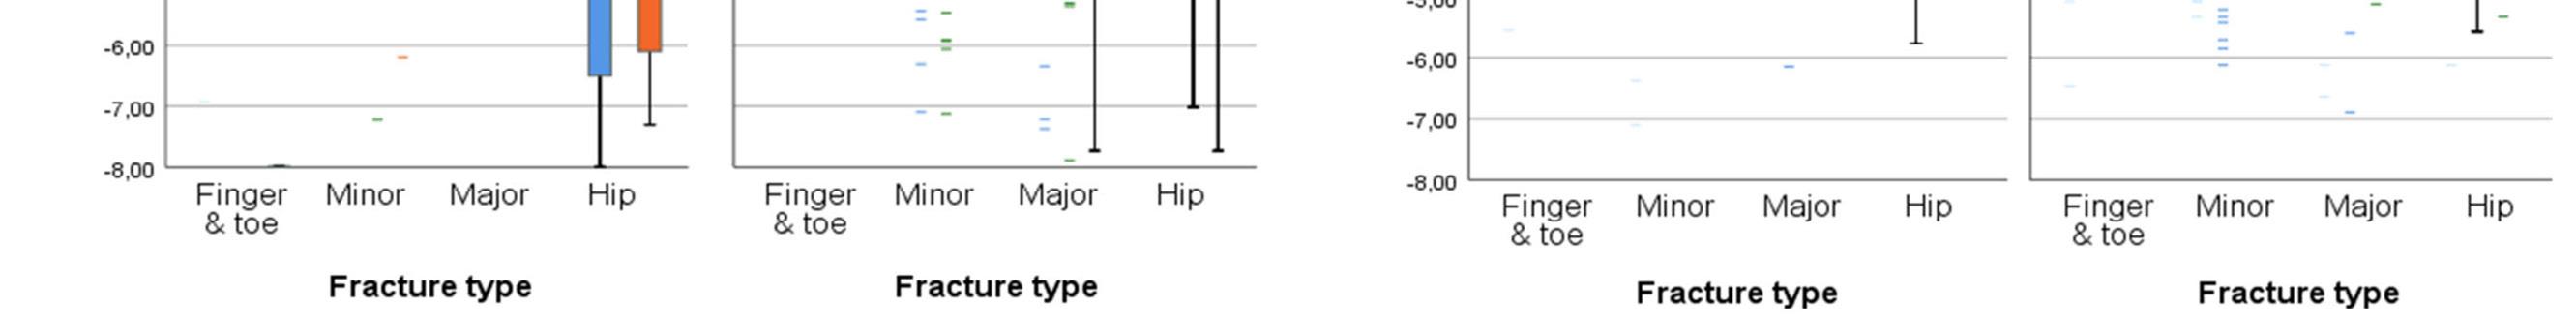
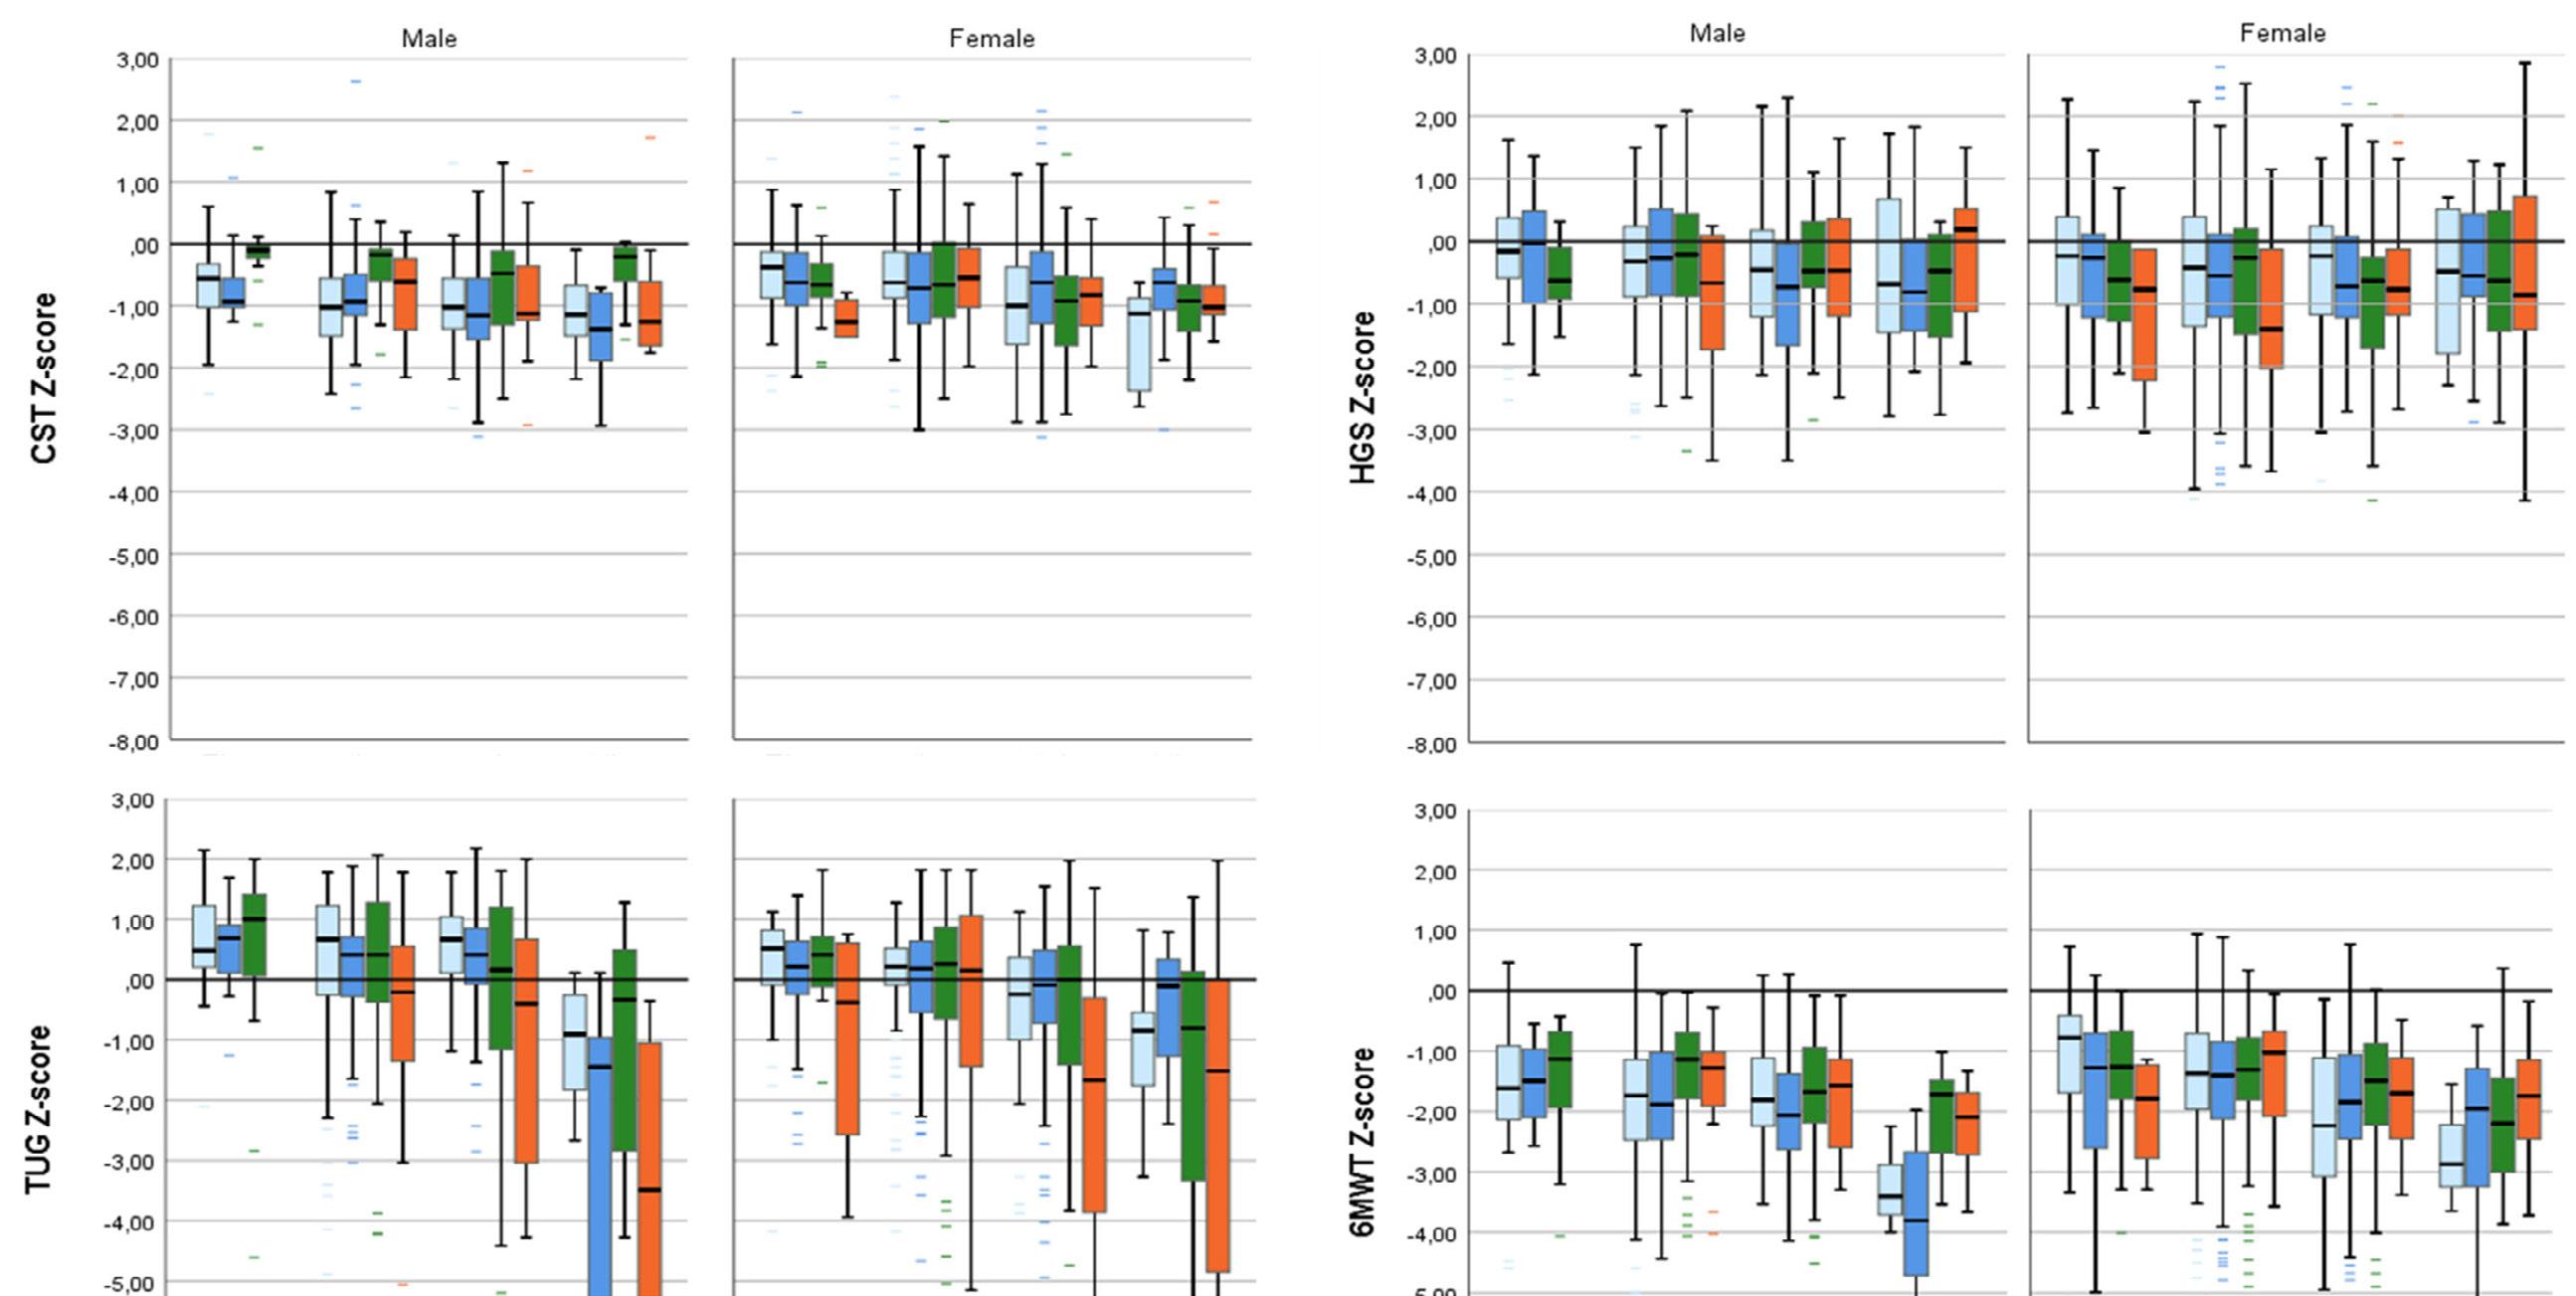

Legend figure 1 - Z-scores for males and females stratified to fracture type and age
Boxplots of Z-scores of FLS patients stratified to age, sex and fracture type. Panel A = CST, B=HGS, C= TUG, D= 6MWT. Fracture types are grouped according to the Cent er classification; hip fractures, major fractures (vertebra, multiple rib, humerus, pelvis, distal femur and proximal tibia), minor fractures; all remaining except
Figure 1 A-D. Z-scores for males and females stratified to fracture type and age
Boxplots of Z-scores of FLS patients stratified to age, sex and fracture type. Panel A = CST, B=HGS, C= TUG, D= 6MWT. Fracture types are grouped according to the Center classification; hip fractures, major fractures (vertebra, multiple rib, humerus, pelvis, distal femur and proximal tibia), minor fractures; all remaining except fingers and toes which were grouped separately. Multiple fractures were allocated according to the most severe fracture type. CST = chair stand test; HGS = handgrip strength; TUG = timed up and go; 6MWT = 6 minute walking test. All groups include >5 patients. Reference line represents theoretical population mean.
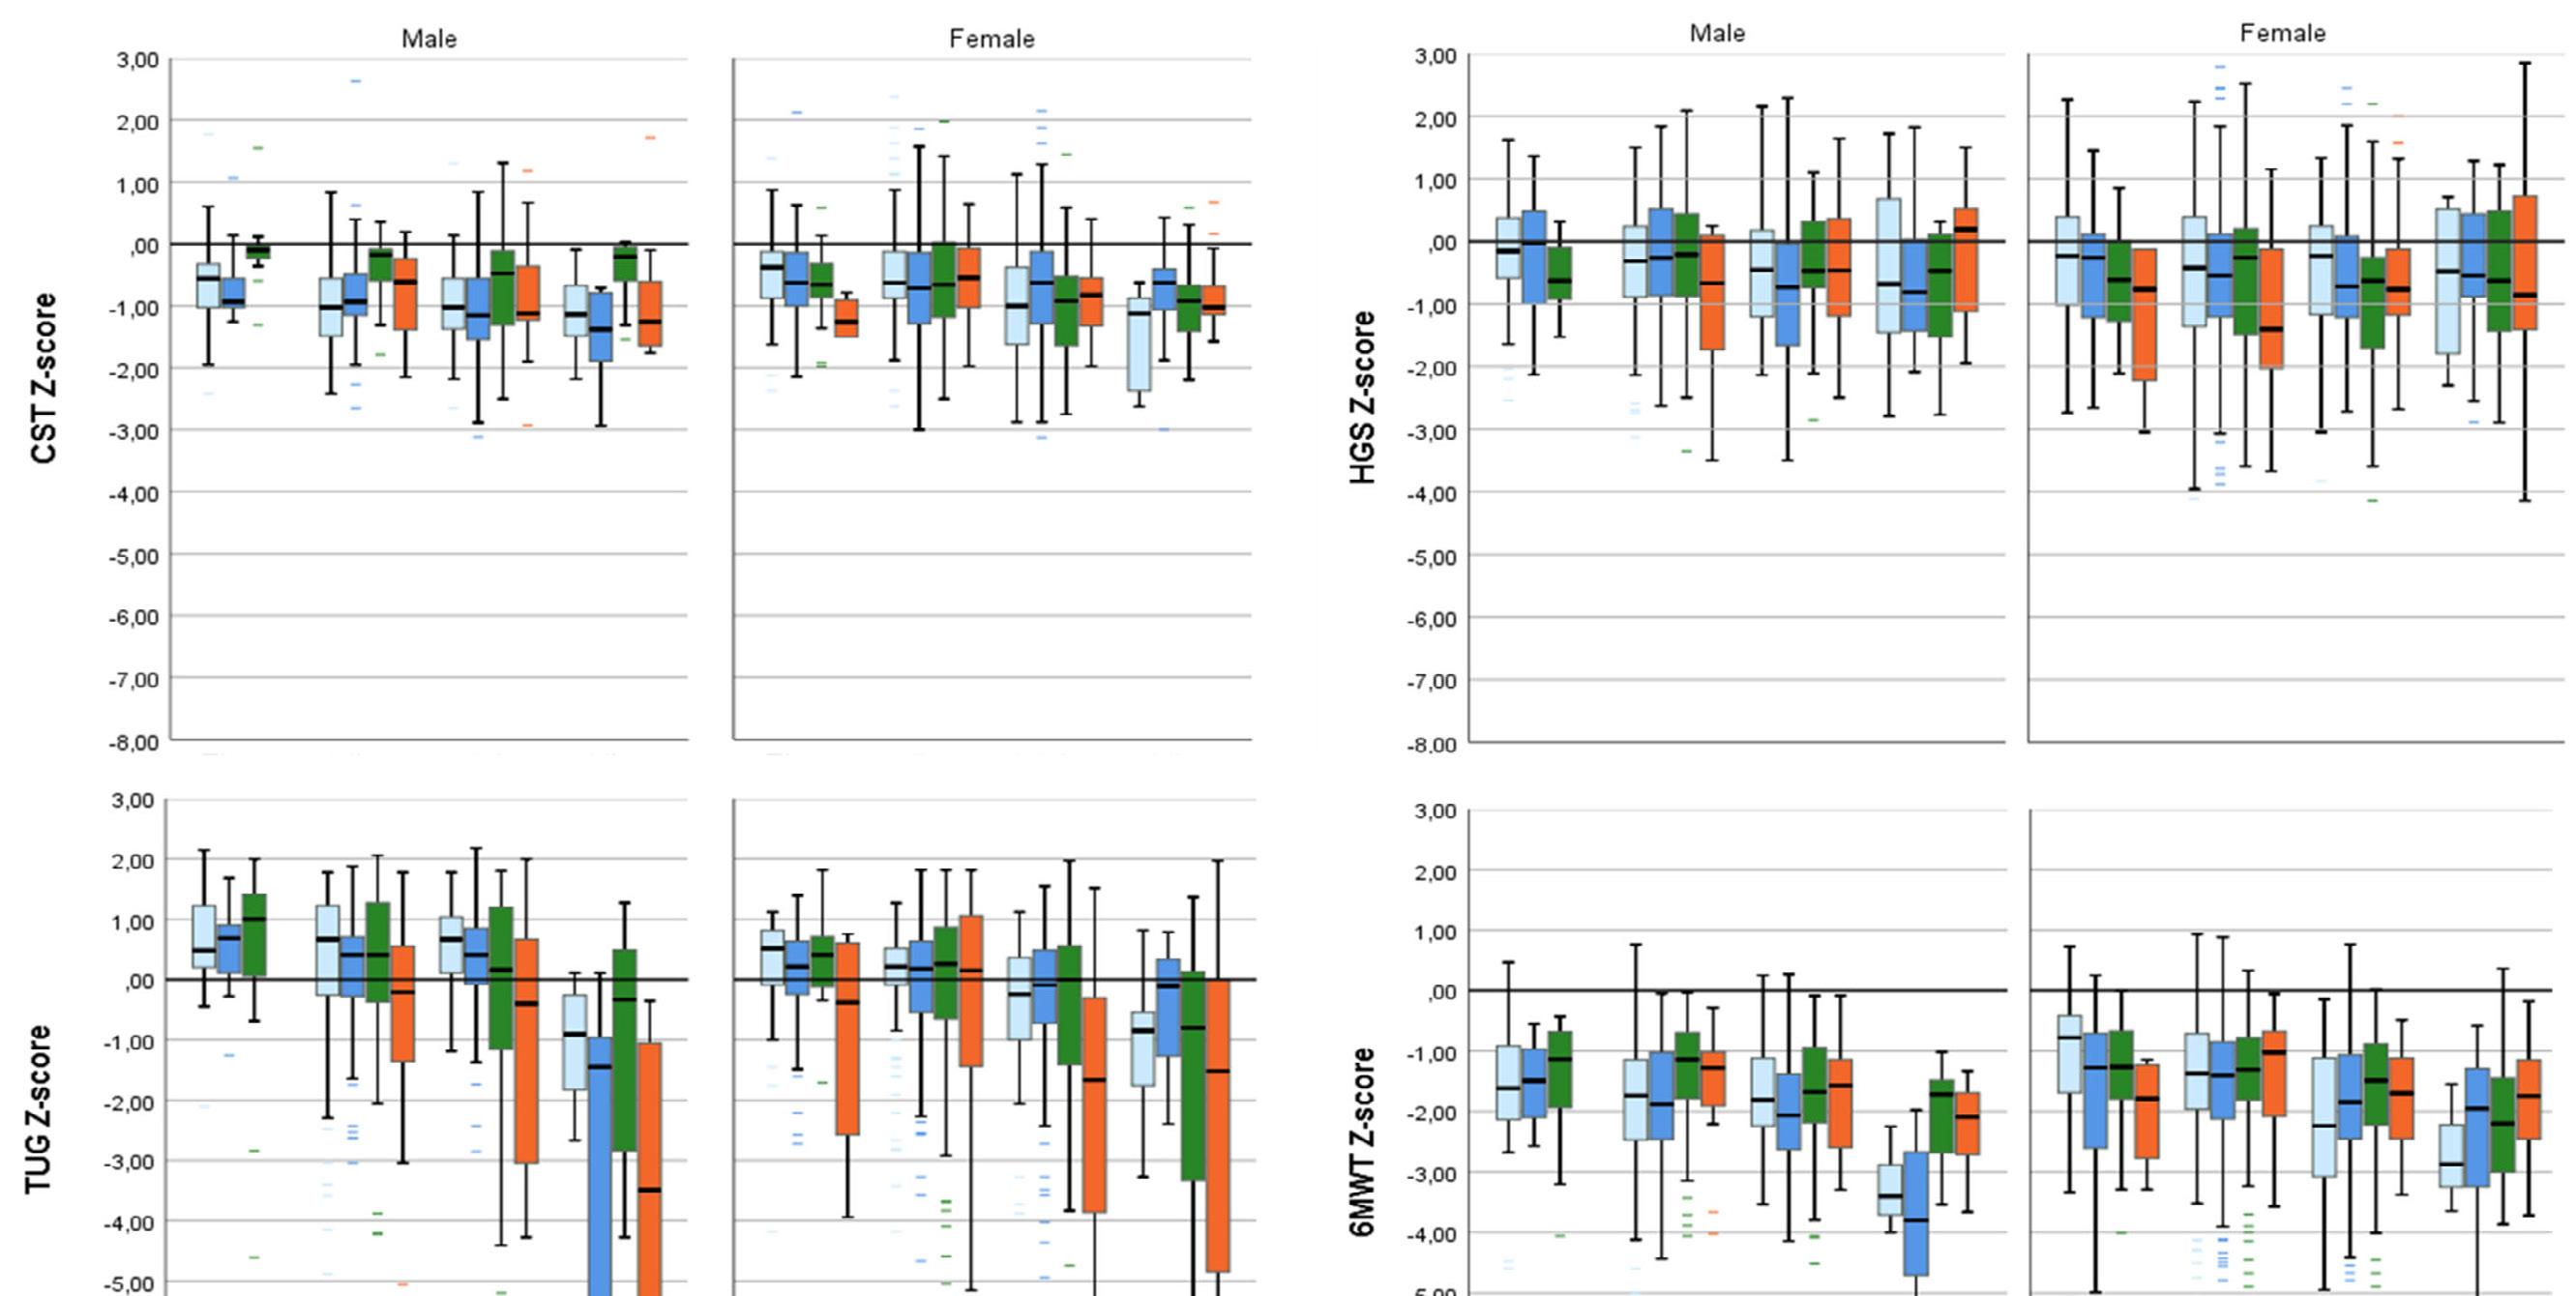
When compared to minor fractures, hip and major fractures were significantly associated (P < 0.001) with lower Z-scores for CST; (major: regression coefficient (B) [95%CI] = -0.25 [-0.34 to -0.16]; hip: B = -0.32 [-0.47 to -0.17]), TUG (major: B = -0.54 [-0.75 to -0.33]; hip: B = -1.72 [-2.08 to -1.35]) and 6MWT (major: B = -0.34 [-0.47 to -0.21]; hip: B = -0.99 [-1.22 to -0.77]), but not for HGS (model 1, outcome adjusted for age, sex and time since fracture) (Table 4). According to the IOF classification, MOF showed significant lower Z-scores compared to non-MOF, but with smaller effect sizes ranging between -0.09 and -0.20). Lower extremity fractures have significantly lower Z-scores on TUG, CST and 6MWT, but are especially lower in TUG (B = -0.66 [-0.84 to -0.47]) and 6MWT (B = -0.41 [-0.52 to -0.30]). Participants with at least one prevalent VF grade 2 or 3, in addition to the index, fracture had significantly lower Z-scores compared to the participants without prevalent VF on CST (B = -0.22 [-0.34 to -0.11]), TUG (B = -0.61 [-0.88 to -0.34]), and 6MWT (B = -0.36 [-0.53 to -0.19]).
Sensitivity analysis
Supplementary Table 3 and 4 show the results of the study population excluding finger and toe fractures of overall physical performance, comparisons to the reference population, and proportions of impaired and poor performance. Results were largely similar compared to the main analysis, with a small increase in the mean differences compared to the reference population (Supplementary Table 3), and a small increase of the proportion of patients with impaired and poor performance (Supplementary Table 4).
Discussion
Reporting on strength (HGS, CST, and TUG), balance (TUG and 6MWT), and cardiorespiratory fitness (CST and 6MWT) measures, this study provides a comprehensive evaluation on physical performance of patients with a recent fracture attending the FLS for fracture risk evaluation. This study shows that physical performance of FLS patients four months after fracture was significantly lower compared to their healthy peers, while the prevalence of confirmed sarcopenia was very low. Importantly, stratified analysis showed a high proportion of patients with impaired or poor performance in all age groups and in both sexes, especially on the 6MWT, HGS, and CST measures. Low performance on the TUG was mainly present in patients with hip fractures. Major and hip fractures and the presence of a prevalent VF were associated with lower performance scores for CST, TUG, and 6MWT, but not for HGS.
Table 4. Association between fracture groups and physical performance tests
CI
0.04)
-0.01)
(-0.52, -0.30)
(-0.53, -0.31)
(-0.38, -0.00)ˆ
-0.10)*
CI
CI
-0.02)
Location of fracture
Lower extremity -0.09 (-0.17, -0.02)ˆ -0.09 (-0.17, -0.01)ˆ 0.18 (0.08, 0.29)ˆ 0.17 (0.06, 0.27)ˆ -0.59 (-0.78, -0.41) * -0.66 (-0.84, -0.47)
Prevalent vertebral fractures
-0.25 (-0.36, -0.13) * -0.22 (-0.34, -0.11) * -0.06 (-0.22, 0.11) -0.06 (-0.22, 0.12) -0.84 (-1.10, -0.57)* -0.61 (-0.88, -0.34) * -0.36 (-0.53, -0.19) * -0.36 (-0.53, -0.19) *
prevalent VF**
Prevalent VF
Associations between fracture groups and patient Z-scores were tested with linear regression models. Model 1 was corrected for age, sex and time since fracture.
6MWT = 6 minute walking test; B = unadjusted Beta, CI= confindence interval; CST = chair stand test; HGS = handgrip strength; ref = reference group; TUG = timed up and go; VF =
Vertebral Fracture. * significantly different compared to the reference group p<0.001, ^ significantly different compared to the reference group p<0.05, # significantly different compared to finger and toe fractures p<0.001, $ significantly different compared to major fractures p<0.001. ** excluded from analysis were all participants that presented with clinical vertebral fractures, as to assess solely the effect of prevalent vertebral fractures
Physical performance of the FLS patients in our study was low in several domains. These findings are in line with previous research reporting on physical performance tests after fracture, summarized by a recent review of Szulc et al.17 However, comparability between the studies included in this review is low as the study populations included in this review are heterogeneous with respect to age, gender, and time since fracture. Our study is unique in its approach to assess physical performance for a wide range of fractures, ages and both sexes, and in its comparison of FLS patients to a predefined reference population of age- and sex-related peers. The results of the stratified Z-scores (Figure 1) clearly indicate that the physical performance of FLS patients is affected in both males and females and in all age groups for CST, HGS, and 6MWT. As stated, decreased physical performance is often defined using cut-off scores. A wide variety of cut-off scores on muscle strength and physical performance tests for increased fall- and fracture risk are reported in the literature.15, 27 Cut-off scores for low performance are often based on statistical parameters within the studied population (e.g., by using quartiles or SD deviations from the mean) and are often not stratified to age and sex.15, 27 However, it is widely established that physical performance declines with age and varies between sexes.28, 30, 35 Using a one-size fits all cut-off score might lead to an underestimation of physical performance in older ages or females and an overestimation of younger persons and males, and does not give an unbiased overview of physical performance in a population. Our study provides clinicians with insights how to assess physical performance in fracture patients that could be of value to comply with the recommendations of the recent Capture the Fracture network key performance indicators, which recommends fall risk assessment, e.g., based on performance on physical function tests, and appropriate recommendations or referral to falls clinics for all fracture patients.6 These recommendations are in line with the world guidelines for falls prevention that recommend a multifactorial falls risk assessment, including mobility testing, for all patients with an injurious fall, such as fracture patients.12 However, consensus on which test is preferred to assess falls and fracture risk remains difficult. The umbrella review on physical performance tests on behalf of the world falls guidelines reports gait speed testing as a possible useful measure to predict falls, but shows inconsistencies in the predictive ability of individual physical performance tests for falls, including the TUG and CST.27 However, they underline the clinical value of mobility assessment and identification of appropriate targeted interventions, as well as the need to assess their fall predictive ability in subpopulations in the future.
Several approaches to cluster fractures are reported in literature, of which the center classification, the IOF classification and grouping based on fracture location are the most commonly used. When comparing the results of these different fracture classifications, the center classification seems to be the most distinctive in terms of physical performance; it showed the
largest differences in effect sizes in the association between fracture site and physical performance. This might be explained by the fact that the center classification groups patients based on mortality risk after a fracture, with a higher risk of death after a major or hip fracture types.2 Correspondingly, lower physical performance measures have previously been associated with a higher mortality after fracture in osteoporotic males and females.36, 37 In the center classification, distal radius fractures are classified as minor fractures, while these are classified as MOFs according the to the IOF classification. This might result in a lower performance on the HGS in patients with a MOF, as well as in a relatively weaker association of MOF with all other tests Z-scores. Moreover, our results show that the presence of prevalent vertebral fractures was associated with low physical performance, which is in line with previous findings.17 These findings imply that assessment of physical performance should have extra emphasis in FLS patients with a major or hip fractures and in patients with prevalent vertebral fractures. Although evidence regarding the optimal intervention for regaining functional fitness and the prevention of future falls after a fracture is still scarce, personalized and multifactorial interventions show some promising results, especially in hip fracture patients.38
It is known that sarcopenia is associated with falls and Vranken et al. have recently reported that patients with a fracture attending the FLS have a high risk of sustaining new falls and subsequent fractures.10 Despite the high proportion of poor performance on individual tests, the proportion of FLS patients with confirmed sarcopenia as well as osteosarcopenia is low compared to the literature. A recent global review an meta-analysis on the prevalence of sarcopenia reported a wide ranging prevalence of sarcopenia, varying from 0.2 to 86.6% depending on used classification and population. However, only three studies included in the meta-analysis used the EWGSOP2 (n = 5720, all older persons without a fracture), and an estimated prevalence of 10% (95% CI: 2.0–17.0%) was reported.39 In a recent study in older fracture patients visiting a fall and fracture evaluation, a prevalence of osteosarcopenia of 25% was reported, while in our study the prevalence was only 3.1% for males and 2.3% for females.40 This difference could partly be explained by the higher mean age of that study (77.9 ± 0.42). The ALM of our study population is comparable to healthy populations,41 with only 4.2% of males and 4.0% of females having an ALM below the sex-specific cut-off values. Possibly, the high BMI of our study population could impose bias as patients with higher fat tend to have higher ALM, resulting in a lower proportion of sarcopenia in our cohort.14, 42 Interestingly, when using the definition of “probable sarcopenia,” proportions in our study are much higher compared to large older community dwelling population studies reporting ranges between 23.5% (mean age 75.9 ± 4.0) and 33.1% (mean age 70.1 ± 7.7).43, 44 Several studies describes muscle strength as a stronger predictor for mobility impairment and fractures compared to muscle mass;15, 45 for persons with low strength, McLean et al. reported similar odds of
mobility impairment for those with high or low muscle mass.45 This is in line with EWGSOP2 guidelines that propose the diagnosis of “probable sarcopenia” is enough to trigger further assessment and start interventions.14 The evaluation of individual physical performance measures using single domains testing has shown to be promising in predicting incident fractures and mortality in several populations.15, 36, 46, 47 However, more prospective studies are needed, in fracture populations specifically, to test associations between impaired physical performance with clinical outcome measures, such as subsequent fractures and mortality.
Strengths and limitations
We have included a large study population of males and females with a wide range of fracture types and ages, assessing physical performance at the FLS. Our study population seems to be representative for the general FLS population and 92% of patients were able to perform the physical evaluation. However, it is important to note that our study might not be representative for all fracture patients as the FLS population is inherently a selection of all fracture patients; FLS non-attenders are known to be older with a higher proportion of hip fractures.10 Second, the physical performance reported in our study is subject to the mean time since fracture of four months, in which the rehabilitation after fracture is not always fully completed. We did not have information on the type, length, or intensity of the rehabilitation. It is likely that a large difference in rehabilitation programs was present among FLS patients due to differences in fracture type and fracture treatment that might have influenced the results on physical performance tests. Inevitably, while using reference data from population studies, the outcome depends on the reference values that are used. Determining optimal reference data for the 6MWT was especially challenging, due to high variability in execution of the test as well as in the reported outcomes (i.e., reference equations). However, recent reference studies have reported similar or higher means per age and sex stratification compared to the reference data of Rikli et al. which we have used in our study.30, 33, 34 Finally, the large proportion of poor performers on 6MWT would be similar, or even higher, when using these more recently published reference values.
Patients with a recent fracture attending the FLS four months after fracture had a significantly lower performance on CST, HGS, TUG, and 6MWT as compared to peers. There is a low prevalence of sarcopenia as defined by the EWGSOP2. These findings underline the need for the assessment of physical performance during the FLS visit, and personalized physical therapy to regain their physical performance should be considered for all FLS patients.
Physical performance and sarcopenia assessment in FLS patients
1. Willers C, Norton N, Harvey NC, et al. Osteoporosis in Europe: a compendium of country-specific reports. Arch Osteoporos. 2022;17:23.
2. Center JR, Nguyen TV, Schneider D, et al. Mortality after all major types of osteoporotic fracture in men and women: an observational study. Lancet. 1999;353:878-882.
3. van Geel TA, van Helden S, Geusens PP, et al. Clinical subsequent fractures cluster in time after first fractures. Ann Rheum Dis. 2009;68:99-102.
4. Akesson K, Marsh D, Mitchell PJ, et al. Capture the Fracture: a Best Practice Framework and global campaign to break the fragility fracture cycle. Osteoporos Int. 2013;24:2135-2152.
5. Geusens P, Bours SPG, Wyers CE, et al. Fracture liaison programs. Best Pract Res Clin Rheumatol. 2019;33:278-289.
6. Javaid MK, Sami A, Lems W, et al. A patient-level key performance indicator set to measure the effectiveness of fracture liaison services and guide quality improvement: a position paper of the IOF Capture the Fracture Working Group, National Osteoporosis Foundation and Fragility Fracture Network. Osteoporos Int. 2020;31:1193-1204.
7. Li N, Hiligsmann M, Boonen A, et al. The impact of fracture liaison services on subsequent fractures and mortality: a systematic literature review and meta-analysis. Osteoporos Int. 2021;32:1517-1530.
8. Vranken L, Wyers CE, van den Bergh JPW, et al. The Phenotype of Patients with a Recent Fracture: A Literature Survey of the Fracture Liaison Service. Calcif Tissue Int. 2017;101:248-258.
9. Van Helden S, van Geel AC, Geusens PP, et al. Bone and fall-related fracture risks in women and men with a recent clinical fracture. J Bone Joint Surg Am. 2008;90:241-248.
10. Vranken L, Wyers CE, Van der Velde RY, et al. Association between incident falls and subsequent fractures in patients attending the fracture liaison service after an index fracture: a 3-year prospective observational cohort study. BMJ Open. 2022;12:e058983.
11. Schene MR, Wyers CE, Driessen AMH, et al. Imminent fall risk after fracture. Age Ageing. 2023;52:afad201.
12. Montero-Odasso M, van der Velde N, Martin FC, et al. World guidelines for falls prevention and management for older adults: a global initiative. Age Ageing. 2022;51:afac205.
13. Lusardi MM, Fritz S, Middleton A, et al. Determining
Risk of Falls in Community Dwelling Older Adults: A Systematic Review and Meta-analysis Using Posttest Probability. J Geriatr Phys Ther. 2017;40:1-36.
14. Cruz-Jentoft AJ, Bahat G, Bauer J, et al. Sarcopenia: revised European consensus on definition and diagnosis. Age Ageing. 2019;48:16-31.
15. Alajlouni DA, Bliuc D, Tran TS, et al. Muscle strength and physical performance contribute to and improve fracture risk prediction in older people: A narrative review. Bone. 2023;172:116755.
16. Harvey NC, Orwoll E, Kwok T, et al. Sarcopenia Definitions as Predictors of Fracture Risk Independent of FRAX(®) , Falls, and BMD in the Osteoporotic Fractures in Men (MrOS) Study: A Meta-Analysis. J Bone Miner Res. 2021;36(7):12351244.
17. Szulc P. Impact of Bone Fracture on Muscle Strength and Physical Performance-Narrative Review. Curr Osteoporos Rep. 2020;18:633-645.
18. van den Bergh JP, van Geel TA, Geusens PP. Osteoporosis, frailty and fracture: implications for case finding and therapy. Nat Rev Rheumatol. 2012;8:163-172.
19. Dutch Institute for Healthcare Improvement CBO. Richtlijn Osteoporose en Fractuurpreventie, Derde Herziening [Dutch] Dutch Institute for Healthcare Improvement CBO, Utrecht, The Netherlands 2011.
20. World Health Organisation. Prevention and management of osteoporosis. World Health Organization, World Health Organization Technical Report Series 2003.
21. Genant HK, Wu CY, van Kuijk C, et al. Vertebral fracture assessment using a semiquantitative technique. J Bone Miner Res. 1993;8:1137-1148.
22. Cawthon PM. Assessment of Lean Mass and Physical Performance in Sarcopenia. J Clin Densitom. 2015;18:467-471.
23. Jones CJ, Rikli RE, Beam WC. A 30-s chair-stand test as a measure of lower body strength in community-residing older adults. Res Q Exerc Sport. 1999;70:113-119.
24. Podsiadlo D, Richardson S. The timed "Up & Go": a test of basic functional mobility for frail elderly persons. J Am Geriatr Soc. 1991;39:142-148.
25. Rikli RE, Jones CJ. The reliability and validity of a 6-minute walk test as a measure of physical endurance in older adults. Journal of aging and physical activity. 1998;6:363-375.
26. Hirschfeld HP, Kinsella R, Duque G. Osteosarcopenia: where bone, muscle, and fat collide. Osteoporos Int. 2017;28:2781-2790.
27. Beck Jepsen D, Robinson K, Ogliari G, et al. Predicting falls in older adults: an umbrella review of instruments assessing gait, balance, and functional mobility. BMC Geriatr. 2022;22:615.
28. Svinøy OE, Hilde G, Bergland A, et al. Timed Up and Go: Reference Values for Community-Dwelling Older Adults with and without Arthritis and NonCommunicable Diseases: The Tromsø Study. Clin Interv Aging. 2021;16:335-343.
29. Kenny RA, Coen RF, Frewen J, et al. Normative values of cognitive and physical function in older adults: findings from the Irish Longitudinal Study on Ageing. J Am Geriatr Soc. 2013;61 Suppl 2:S279290.
30. Rikli RE, Jones CJ. Functional Fitness Normative Scores for Community-Residing Older Adults, Ages 60-94. Journal of Aging and Physical Activity. 1999;7:162.
31. Albrecht BM, Stalling I, Bammann K. Sex- and agespecific normative values for handgrip strength and components of the Senior Fitness Test in community-dwelling older adults aged 65-75 years in Germany: results from the OUTDOOR ACTIVE study. BMC Geriatr. 2021;21:273.
32. Warden SJ, Liu Z, Moe SM. Sex- and Age-Specific Centile Curves and Downloadable Calculator for Clinical Muscle Strength Tests to Identify Probable Sarcopenia. Phys Ther. 2021;102:pzab299.
33. Beekman E, Mesters I, Gosselink R, et al. The first reference equations for the 6-minute walk distance over a 10 m course. Thorax. 2014;69:867-868.
34. Casanova C, Celli BR, Barria P, et al. The 6-min walk distance in healthy subjects: reference standards from seven countries. Eur Respir J. 2011;37:150-156.
35. Dodds RM, Syddall HE, Cooper R, et al. Grip strength across the life course: normative data from twelve British studies. PLoS One. 2014;9:e113637.
36. Alajlouni DA, Bliuc D, Tran TS, et al. Muscle Strength and Physical Performance Are Associated With Risk of Postfracture Mortality But Not Subsequent Fracture in Men. J Bone Miner Res. 2022;37:15711579.
37. Pham HM, Nguyen SC, Ho-Le TP, et al. Association of Muscle Weakness With Post-Fracture Mortality in Older Men and Women: A 25-Year Prospective Study. J Bone Miner Res. 2017;32:698-707.
38. Wilson N, Hurkmans E, Adams J, et al. Prevention and management of osteoporotic fractures by non-physician health professionals: a systematic
literature review to inform EULAR points to consider. RMD Open. 2020;6:e001143.
39. Petermann-Rocha F, Balntzi V, Gray SR, et al. Global prevalence of sarcopenia and severe sarcopenia: a systematic review and meta-analysis. J Cachexia Sarcopenia Muscle. 2022;13:86-99.
40. Sepúlveda-Loyola W, Phu S, Bani Hassan E, et al. The Joint Occurrence of Osteoporosis and Sarcopenia (Osteosarcopenia): Definitions and Characteristics. J Am Med Dir Assoc. 2020;21:220225.
41. Kirk B, Bani Hassan E, Brennan-Olsen S, et al. Body composition reference ranges in communitydwelling adults using dual-energy X-ray absorptiometry: the Australian Body Composition (ABC) Study. J Cachexia Sarcopenia Muscle. 2021;12:880-890.
42. Schautz B, Later W, Heller M, et al. Total and regional relationship between lean and fat mass with increasing adiposity--impact for the diagnosis of sarcopenic obesity. Eur J Clin Nutr. 2012;66:1356-1361.
43. Swan L, Warters A, O'Sullivan M. Socioeconomic Disadvantage is Associated with Probable Sarcopenia in Community-Dwelling Older Adults: Findings from the English Longitudinal Study of Ageing. J Frailty Aging. 2022;11:398-406.
44. Kim M, Won CW. Prevalence of sarcopenia in community-dwelling older adults using the definition of the European Working Group on Sarcopenia in Older People 2: findings from the Korean Frailty and Aging Cohort Study. Age Ageing. 2019;48:910-916.
45. McLean RR, Shardell MD, Alley DE, et al. Criteria for clinically relevant weakness and low lean mass and their longitudinal association with incident mobility impairment and mortality: the foundation for the National Institutes of Health (FNIH) sarcopenia project. J Gerontol A Biol Sci Med Sci. 2014;69:576-583.
46. Alajlouni D, Tran T, Bliuc D, et al. Muscle Strength and Physical Performance Improve Fracture Risk Prediction Beyond Garvan and FRAX: The Osteoporotic Fractures in Men (MrOS) Study. J Bone Miner Res. 2021;
47. Larsson BAM, Johansson L, Johansson H, et al. The timed up and go test predicts fracture risk in older women independently of clinical risk factors and bone mineral density. Osteoporos Int. 2021;32:75-84.
Physical performance and sarcopenia assessment in FLS patients
Supplemental table 1. Search strategy reference population
Test* Search
TUG (“TUG” [tiab] OR “TUGT” [tiab] OR “Timed Up and Go” [Tiab] OR “Timed-Up-and-Go” [Tiab] OR “Timed Up-and-Go” [Tiab] OR “Timed-Up and go” [tiab]) AND (“Reference Values” [Mesh] OR “normative measures” [tiab] OR “normal values” [tiab] OR “normative values” [tiab] OR “normative data” [tiab] OR “reference measures” [tiab] OR “reference values” [tiab] OR “reference data” [tiab])
Number of screened articles
129 articles
6MWT (“6MWT” [tiab] OR “6-MWT” [tiab] OR “6 minute walking” [tiab] OR “6-minute walking” [tiab] OR “6 minute walk” [tiab] OR “6-minute walk” [tiab] OR “6-min walk” [tiab] OR “6 min walk” [tiab] OR “6-min walking” [tiab] OR “6 min walking” [tiab] OR “six minute walking” [tiab] OR “six-minute walking” [tiab] OR “six minute walk” [tiab] OR “six-minute walk” [tiab] OR “six-min walk” [tiab] OR “six min walk” [tiab] OR “six-min walking” [tiab] OR “six min walking” [tiab]) AND (“Reference Values” [Mesh] OR “normative measures” [tiab] OR “normal values” [tiab] OR “normative values” [tiab] OR “normative data” [tiab] OR “reference measures” [tiab] OR “reference value*” [tiab] OR “reference data” [tiab])
CST (“30 second chair stand” [tiab] OR “CST30” [tiab] OR “CS-30” [tiab] OR “CS30” [tiab] OR “30CST” [tiab] OR CST [tiab] OR “chair stand test” [tiab] OR “30STS” [tiab] OR “30-STS” [tiab] OR “30 seconds sit to stand” [tiab] OR “30-seconds sit to stand” [tiab] OR “30-seconds sit-to-stand” [tiab] OR “30-seconds-sit-to-stand” [tiab]) AND (“Reference Values” [Mesh] OR “normative measures” [tiab] OR “normal values” [tiab] OR “normative values” [tiab] OR “normative data” [tiab] OR “reference measures” [tiab] OR “reference values” [tiab] OR “reference data” [tiab])
313 articles
Additional search and discussion of reviews
Two systematic reviews and meta-analysis reported on relevant reference values of the TUG; Bohannon [1] and Long [2]. These articles provided reference values that did not meet our requirements due to lack of stratification. Included articles of both reviews were checked for eligibility. Furthermore, we compared search terms of both reviews to our search strategy an added additional search terms if applicable. Contrary to Long et al., search terms restricting the search to specific age groups (e.g. “older persons”) were not used as our population included persons of 50 years and older.
One systematic review by Salbach [3] reported on reference values of 6MWT in community dwelling older persons. Included original articles were checked for eligibility. We compared their search terms to our search and added additional search terms (in tiab) if needed. Moreover, we repeated their search, with all terms restricted to tiab and restricted to systematic reviews and meta-analysis for all years between 2015 and 2022 (400 articles). Another systematic review of Bohannon reported on 6MWD outcome of older persons. Their included original articles were checked for eligibility [4].
69 articles No meta-analysis was found that reported reference values. However, the systematic review of Mehmet 2020 on the optimal protocol for the CTS measurement was retrieved [5]. References were checked for eligibility. Furthermore, we compared search terms of both reviews to our search and added additional search terms if needed.
Chapter 4 Supplementary material
Grip strength (“Grip strength” [tiab] OR “handgrip strength” [tiab] OR “hand grip strength” [tiab] OR “HGS” [tiab] OR “grip dynamometer” [tiab]) AND (“Reference Values” [Mesh] OR “normative measures” [tiab] OR “normal values” [tiab] OR “normative values” [tiab] OR “normative data” [tiab] OR “reference measures” [tiab] OR “reference values” [tiab] OR “reference data” [tiab])
609 articles Two systematic reviews and metaanalysis reported on relevant reference values of the TUG; Bohannon [6] and Dodds 2016 [7]. Bohannon et al. provided numerical reference values that did not meet our requirements on age inclusions and stratification. Included articles of both reviews were checked for eligibility. Furthermore, we compared search terms of both reviews to our search and added additional search terms if applicable.
*All tests have a good to excellent inter-rater reliability in older populations with and without comorbidities [8-16]. We manually checked reference lists from relevant research articles and consulted two guidelines 1. Sraleb.org and 2. meetinstrumentenindezorg.info. We included articles with a large-scale community-dwelling population, representative for the Dutch population (e.g. North-European, US, Canada or Australia). Studies were considered for inclusion if they used similar tests methods, reported sex- and age stratified data on males and females (mean and SD), with 5-10 year age intervals. Articles were excluded if they reported only on a specific sub-population (e.g. COPD or heart failure patients), or had low numbers of inclusions, preferably above >120 included persons [36] . Full texts were screened by MS and if multiple studies were possibly eligible, consensus on inclusion was reached by MS and HW. If reference values were presented for specific ages (e.g. 60) and not age groups (e.g. 60-64), we constructed age groups around the specific age by 5 years: ( e.g. 57-62).
Supplemental table 2. Characteristics of eligible studies for reference data and rationale of selection
Selected yes/no and rationale
Outcome: Percentiles CI
Outcome: Mean SD
Other stratification
Outcome stratified to age and sex with 5 year intervals
Test instruction + performance similar
Population characteristics
Population Origin
Population size
Study design
Test Study
Yes: High number of inclusions of a western community dwelling population. 5 year age interval of outcome and preferred outcome measures (mean SD) available. Socio-economic demographic best comparable to the Dutch population. A healthy responder bias should be kept in mind. Outcome is similar to that of Kenny et al. We compared reference values of Kenny for ages 50-60 to the values of age 60 from Svinøy and concluded it to be appropriate to extrapolate Svinøy’s value for 60 year olds to all ages 50-60.
No, low number of participants in older age groups resulting in very wide SD, not usable for comparison. Reference values of younger age groups were comparable to Svinøy.
Yes
Yes, but SD very broad in older age groups
Arthritis NCD
Sex: Yes Age: yes 5 year interval
Start seated in a chair that was 43 cm high with armrests, stand up, walk 3 meters at their regular pace, turn, walk back again, and sit down. The participant’s TUG score in seconds was timed with a stopwatch from the command “Go” to when the participant was seated again. Outcome: first try, no an average of 3.
Community dwelling older persons. 60-84 years old
Norway
N=5400 Female Male
Cross- sectional
Svinøy 2021 [17]
Inclusion based on acceptance of invitation.
No
Sex: yes Age: yes 5 year interval
Similar test methods, but only first try reported, not mean of 3 tries
Ireland Community dwelling, older persons. Aged 50-85
N=5791
Cross- sectional
Kenny 2013 [18]
Severe cognitive/ physical impairment excluded
Yes No, only very old persons included. Mediterranean population. Moreover, test method slightly different.
No, lower number of inclusions too low to account for good reference data. Much lower compared to Svinoy. Ages 5060 not available.
Sex: Yes Age Yes 5 year interval 75-99 years old No
Similar test methods, but chair with no arms, and the test instructions: as quickly as possible.
Spain Community dwelling 70-99 years old
N=308
Sex: yes Age: yes 10 year interval 60+ population No
Similar test methods, although a practice trial was performed and then followed by 2 recorded trials. Data obtained during the 2 recorded trials were averaged for use in data analysis.
Canada Community dwelling. 60+ years old Recruited through advertisement. Healthy subjects. Severe comorbidities were excluded.
No, however it was best suited based on comparability of population and test method. Only reference values that were retrieved for 10 meter long walkway. However, no age and sex stratified mean and SD’s were available upon request
Age: Yes Sex: Yes BMI No, Reference equation No
Similar test methods: Course: 10 m walkway, However, some differences were notable. instructions: use of standardized encouragements. They validated the outcome in a second test. (learning effect.) And used best try.
The Nether- lands Community dwelling and some nursery home healthy older subjects. They describe inviting persons from nursery homes, however excluded anyone with any restricting comorbidities. So the influence of nursing home participants will be small.
Supplemental table 2. Continued Pondal 2008 [19]
N=79
Cross- sectional
Cross- sectional
Steffen 2002 [20]
N=183
Cross- sectional
Beekman 2014 [21]
6MWT
Yes: large scale community dwelling Wester population. However, testing methods were not similar. Reference 6MWD might be higher as they have less turns in their pathway and might experience a group effect. Mean outcome stratified to sex were compared to Beekman (much higher mean) and Casanova (higher mean). Thus, the low performance of the FLS population might be even higher if other reference populations were used.
No, number of inclusions too low to use as reference values. Mean outcomes most comparable to meta-analysis means of Bohannon[4]. Ages 50-60 not available.
No, no stratification for sex and age together. Population is not very similar to Dutch population. Moreover, smaller cohort compared to Rikli.
Yes
Yes, of yards walked.
No
Sex: Yes Age: yes 5 year interval
Course: Square outside with 45 meters walking distance. Walk in group. No specialized nurse for testing. Instructions: Fast but comfortable pace Encouragement every 30 s.
United States Community dwelling, Ages 60-94
Cross- sectional N=7183
Rikli & Jones 1999 [22]
Ambulatory and functionally independent. No physical or cognitive impairments to interfere with tests
Sex: yes Age: yes 10 year interval
Course: 30-m hallway Instructions: as far as possible Encouragement: standardized Trials: 2 Measurement used: second trial
Canada Community dwelling. 60+ years old. Recruited through advertisement. Healthy subjects. Severe comorbidities were excluded.
Cross- sectional N= 79
Steffen 2002 [20]
Age, yes Sex: no
Course: Straight 30m course. Instructions: Following ATC guidelines Maximum of 2 trials.
Combined set of 7 countries; Brazil, Chile, Colombia, Uruguay, USA Venezuela Spain. Recruited community dwelling, healthy older persons. No chronic diseases
Cross- sectional N=444
Casanova 2011[23]
Supplemental table. Continued
No, inclusion numbers too low. Test method not the same.
Age: no Sex: yes
Course: 45 m long straight course Tested three times separated by 20 min rest intervals. Instructions: “walk as quickly as you can for six minutes so that you cover as much ground as possible.” Rest and stopping permitted.
Healthy older Caucasian adults recruited from a research volunteer database
Australia
N = 70
Camarri 2006 [24] Cross- sectional
No, large heterogeneity in testing methods and populations. No SD available in stratified outcome.
Age: yes Sex: yes
Large heterogeneity between methods used in included studies. In short, walking distances ranged from 30-80m
Included 13 studies from north America and European popu- lations. Larger heterogeneity between study population in terms of ethnicity and age.
N=4809
Bohannon 2007 [4] Meta- analysis
Yes: Original test method. However this is an US population. As Albrecht [25] is the most comparable population to our Dutch population and does correspond to Rikli and Jones, we chose to use Rikli and Jones for ages 60-94. However, for the ages 50-60 this article provided no data
We compared reference values of Warden for ages 50-60 to the values of age 60 from Rikli and Jones and concluded it to be appropriate to extrapolate Rikli and Jones value for 60 year olds to all ages 50-60.
No, there is no availability of data of very old persons and they use a 10 year age stratification. Does correspond well to original ref data from Rikli and Jones
No: only ages 65-75 German population most comparable to Dutch population. Outcome does correspond well to Rikli and Jones.
Yes
Sex: Yes Age: yes 5 year age interval no
Using folding chair without arms, with a seat height of (43.2 cm). Patient was seated in the middle of the chair, back straight arms were crossed at the wrists and held against the chest. At the signal “go,” the participant rose to a full stand and then returned back to the initial seated position. Instructions: complete as many full stands as possible within a 3008 time limit. Be fully seated between each stand. Incorrectly executed stands were not counted.
USA Community dwelling, Ages 60-94
N=7183
Cross- sectional
Rikli & Jones 1999 [22]
Ambulatory and functionally independent no physical or cognitive impairments to interfere with tests
Sex: yes Age Yes 10 year age interval No
Similar to Rikli & Jones
USA Community dwelling, 18-80 years old Recruited and self-referral
N=2301
Cross- sectional
Warden 2021 [26]
Sex: yes Age: yes 1 year age interval
Similar to Rikli & Jones
Germany Community dwelling 65-75 years old
N=880
Cross- sectional
Albrecht 2021 [25]
Sex: yes Age: yes 10 year interval No Yes No No, stratification not sufficient. Does not correspond well to Rikli and Jones as the scores are much higher.
Similar to Rikli & Jones
Denmark Community dwelling selection of population.
Cross- sectional N=1305
Supplemental table 2. Continued Suetta 2019 [27]
Sex: Yes Age: yes 5 year interval up until 95+ no Yes Yes Yes, very large study with the right stratification. Metaanalysis of Dodds from 2016 reports on comparability of grip strength across ‘developed’ countries [7], arguing their data would be useful for developed countries such as the Netherlands. Another study reported on comparable grip strength across norther European countries, when compared to Southern European countries, however the UK was not part of this comparison [29]. The data from Dodds corresponds well with Peters (only Dutch study), except for old ages (however Peters includes nursing home residents and uses mean of 3 tries.)
Different HHD were used in some sub studies, some were seated, some were standing. However, the majority used Jamar HDD in seated position. All outcome were maximum HGS from 4-6 tries. Most studies used both hands, some only dominant hand.
United Kingdom General population, some sub selections within original studies, however, overall, a large representation of “normal” population of UK.
Cross sectional Combined data from 12 UK studies N=49964 F=26687
Dodds 2014 [28]
HGS
Smaller population compared to Dodds 2014, however, outcome corresponds well with outcome of Dodds.
Sex: yes Age: yes No Yes yes
HDD similar methods as our study
JAMAR
Swiss General Swiss population, no healthy selection.
Cross- sectional N=1023
Werle 2009 [30]
No, small sample sized in older age groups, SD very broad in older age groups, thus not usable for comparison using Z scores.
No, small sample size in comparison to included study of Dodds. Moreover includes nursing home residents.
No, too little inclusions for persons 75 years and older. And mean (not max) of tries. Mean of tries is not the outcome according to recent standards of Roberts et al. [16]
Sex: yes Age: yes 5 year interval
Baseline hydraulic Hand dynamo meter, max of 4 (2x2 each hand) tries
Community dwelling All ages until 85 Severe cognitive/ physical impairment excluded
Ireland
N=5791
Cross- sectional
Kenny 2013 [18]
Sex: yes Age yes 5 year interval
Yes: sex Yes Age: 5 year intervals, but low number of older people, oldest age group is 75+ years.
HDD
Jamar
Community dwelling + 4% nursing home residents, representative for Polish population.
Poland
N=405
Cross- sectional
Wiśnio- wska - Szurlej 2021 [31]
HHD
Jamar
Outcome: Mean of trials
Convenience, community dwelling or random samples
Multi- national
Meta- analysis Combined data from 12 studies N=3317
Bohannon 2006 [32]
Missing all anthropomorphic measures N=11
N=1947 N=1936
6MWT Available N=1725 (89.1%) Missing N=162 (8.4%) Physically unable N=49 (2.5%)
HGS Available N=1781 (92%) Missing N=147 (7.6%) Physically unable N=8 (0.4%)
CST Available N=1759 (90.9%) Missing N=149 (7.7%) Physically unable N=28 (1.4%)
TUG Available N=1733 (89.5%) Missing N=153 (7.9%) Physically unable N=50 (2.6%)
All tests missing N=147
At least one test available N= 1789
Supplementary figure 1. Flowchart of study inclusion
Physical performance and sarcopenia assessment in FLS patients
Supplementary table 3. Overview of physical performance measures of FLS population (excluding finger and toe fractures)
Outcome on physical performance tests
Comparison of mean Z-scores to reference population
ALM = appendicular lean mass; CST = chair stand test; HGS = handgrip strength; TUG = timed up and go; 6MWD = 6 minute walking distance, 6MWT = 6 minute walking test. Sarcopenia was determined according to EWGSOP2 guidelines
Supplementary table 4. Proportion of patients with impaired and poor performance (excluding finger and toe fractures) Impaired a and poor b performance Males Females
CST = chair stand test; HGS = handgrip strength; TUG = timed up and go; 6MWT = 6 minute walking test
a Impaired performance includes persons with test Z-score between -1SD to -2SD
b Poor performance includes patients with test Z-score <-2SD, and includes persons who were unable to perform physical function tests due to physical inability
1. Bohannon RW. Reference values for the timed up and go test: a descriptive meta-analysis. J Geriatr Phys Ther. 2006;29:64-68.
2. Long J, Cai T, Huang X, et al. Reference value for the TUGT in healthy older people: A systematic review and meta-analysis. Geriatr Nurs. 2020;41:325-330.
3. Salbach NM, O'Brien KK, Brooks D, et al. Reference values for standardized tests of walking speed and distance: a systematic review. Gait Posture. 2015;41:341-360.
4. Bohannon RW. Six-minute walk test: a metaanalysis of data from apparently healthy elders. Topics in Geriatric Rehabilitation. 2007;23:155-160.
5. Mehmet H, Yang AWH, Robinson SR. What is the optimal chair stand test protocol for older adults? A systematic review. Disabil Rehabil. 2020;42:28282835.
6. Bohannon RW, Bear-Lehman J, Desrosiers J, et al. Average grip strength: a meta-analysis of data obtained with a Jamar dynamometer from individuals 75 years or more of age. J Geriatr Phys Ther. 2007;30:28-30.
7. Dodds RM, Syddall HE, Cooper R, et al. Global variation in grip strength: a systematic review and meta-analysis of normative data. Age Ageing. 2016;45:209-216.
8. Overgaard JA, Larsen CM, Holtze S, et al. Interrater Reliability of the 6-Minute Walk Test in Women With Hip Fracture. J Geriatr Phys Ther. 2017;40:158-166.
9. Podsiadlo D, Richardson S. The timed "Up & Go": a test of basic functional mobility for frail elderly persons. J Am Geriatr Soc. 1991;39:142-148.
10. Rikli RE, Jones CJ. The reliability and validity of a 6-minute walk test as a measure of physical endurance in older adults. Journal of aging and physical activity. 1998;6:363-375.
11. Jones CJ, Rikli RE, Beam WC. A 30-s chair-stand test as a measure of lower body strength in community-residing older adults. Res Q Exerc Sport. 1999;70:113-119.
12. Ozcan Kahraman B, Ozsoy I, Akdeniz B, et al. Testretest reliability and validity of the timed up and go test and 30-second sit to stand test in patients with pulmonary hypertension. Int J Cardiol. 2020;304:159-163.
13. Holland AE, Spruit MA, Troosters T, et al. An official European Respiratory Society/American Thoracic Society technical standard: field walking tests in chronic respiratory disease. Eur Respir J. 2014;44:1428-1446.
14. Gill SD, de Morton NA, Mc Burney H. An investigation of the validity of six measures of physical function in people awaiting joint replacement surgery of the hip or knee. Clin Rehabil. 2012;26:945-951.
15. Abizanda P, Navarro JL, García-Tomás MI, et al. Validity and usefulness of hand-held dynamometry for measuring muscle strength in communitydwelling older persons. Arch Gerontol Geriatr. 2012;54:21-27.
16. Roberts HC, Denison HJ, Martin HJ, et al. A review of the measurement of grip strength in clinical and epidemiological studies: towards a standardised approach. Age Ageing. 2011;40:423-429.
17. Svinøy OE, Hilde G, Bergland A, et al. Timed Up and Go: Reference Values for Community-Dwelling Older Adults with and without Arthritis and NonCommunicable Diseases: The Tromsø Study. Clin Interv Aging. 2021;16:335-343.
18. Kenny RA, Coen RF, Frewen J, et al. Normative values of cognitive and physical function in older adults: findings from the Irish Longitudinal Study on Ageing. J Am Geriatr Soc. 2013;61 Suppl 2:S279290.
19. Pondal M, del Ser T. Normative data and determinants for the timed "up and go" test in a population-based sample of elderly individuals without gait disturbances. J Geriatr Phys Ther. 2008;31:57-63.
20. Steffen TM, Hacker TA, Mollinger L. Age- and gender-related test performance in communitydwelling elderly people: Six-Minute Walk Test, Berg Balance Scale, Timed Up & Go Test, and gait speeds. Phys Ther. 2002;82:128-137.
21. Beekman E, Mesters I, Gosselink R, et al. The first reference equations for the 6-minute walk distance over a 10 m course. Thorax. 2014;69:867-868.
22. Rikli RE, Jones CJ. Functional Fitness Normative Scores for Community-Residing Older Adults, Ages 60-94. Journal of Aging and Physical Activity. 1999;7:162.
23. Casanova C, Celli BR, Barria P, et al. The 6-min walk distance in healthy subjects: reference standards from seven countries. Eur Respir J. 2011;37:150-156.
24. Camarri B, Eastwood PR, Cecins NM, et al. Six minute walk distance in healthy subjects aged 5575 years. Respir Med. 2006;100:658-665.
25. Albrecht BM, Stalling I, Bammann K. Sex- and agespecific normative values for handgrip strength and components of the Senior Fitness Test in community-dwelling older adults aged 65-75 years
Chapter 4 Supplementary material in Germany: results from the OUTDOOR ACTIVE study. BMC Geriatr. 2021;21:273.
26. Warden SJ, Liu Z, Moe SM. Sex- and Age-Specific Centile Curves and Downloadable Calculator for Clinical Muscle Strength Tests to Identify Probable Sarcopenia. Phys Ther. 2021;102:pzab299.
27. Suetta C, Haddock B, Alcazar J, et al. The Copenhagen Sarcopenia Study: lean mass, strength, power, and physical function in a Danish cohort aged 20-93 years. J Cachexia Sarcopenia Muscle. 2019;10:1316-1329.
28. Dodds RM, Syddall HE, Cooper R, et al. Grip strength across the life course: normative data from twelve British studies. PLoS One. 2014;9:e113637.
29. Andersen-Ranberg K, Petersen I, Frederiksen H, et al. Cross-national differences in grip strength among 50+ year-old Europeans: results from the SHARE study. Eur J Ageing. 2009;6:227-236.
30. Werle S, Goldhahn J, Drerup S, et al. Age- and gender-specific normative data of grip and pinch strength in a healthy adult Swiss population. J Hand Surg Eur Vol. 2009;34:76-84.
31. Wiśniowska-Szurlej A, Ćwirlej-Sozańska A, Kilian J, et al. Reference values and factors associated with hand grip strength among older adults living in southeastern Poland. Sci Rep. 2021;11:9950.
32. Bohannon RW, Peolsson A, Massy-Westropp N, et al. Reference values for adult grip strength measured with a Jamar dynamometer: a descriptive meta-analysis. Physiotherapy. 2006;92:11-15.
Physical functioning in patients with a recent fracture: The “can do, do do” framework applied to explore physical capacity, physical activity and fall risk factors
M.R. Schene, K. Meijer, D. Cheung, H.C. Willems, J.H.M Driessen, L. Vranken, J.P van den Bergh, C.E. Wyers
Calcified Tissue International 2023, 113: 195–206
Background: Physical capacity (PC) and physical activity (PA) are associated physical performance measures, and combined, PC and PA are used to categorize physical performance in the “can do, do do” framework. We aimed to explore physical performance of patients attending the fracture liaison service (FLS).
Methods: In this cross-sectional study, PC was measured by 6-minutewalking-test (can’t do/can do) and PA by accelerometer (don’t do/do do). Following quadrants were defined based on predefined cut-off scores for poor performance: 1.“can’t do, don’t do”; 2.“can do, don’t do”; 3.“can’t do, do do”; 4.“can do, do do”. Odds ratios (OR) were calculated and fall and fracture risk factors were assessed between quadrants.
Results: Physical performance of 400 fracture patients was assessed (mean age 64; female 70.8%). Patients performed as follows: 8.3% “can’t do, don’t do”; 3.0% “can do, don’t do”; 19.3% “can’t do, do do”; 69.5% “can do, do do”. For the “can’t do” group the OR for low PA was 9.76 (95%CI: 4.82-19.80). Both the “can’t do, don’t do” and “can’t do, do do” group differed significantly compared to the “can do, do do” group on several fall and fracture risk factors and had lower physical performance.
Conclusion: The “can do, do do” framework is able to identify fracture patients with an impaired physical performance. Of all FLS patients 20% “can’t do, but “do do” while having a high prevalence of fall risk factors compared to persons that “can do, do do”, which may indicate this group is prone to fall.
Approximately 30% of people aged 65 and older fall at least once a year.1 The health burden of falls is considerable, as 40-60% of falls result in injury.2 About 5% percent of all falls result in a fracture. Conversely, 70% to 90% of all fractures are caused by a fall.3 Patients with a previous fracture have an increased risk of sustaining a subsequent fracture.4 Fracture Liaison Services (FLSs) have been implemented to identify, evaluate and treat patients with an increased risk of subsequent fractures.5 FLS evaluation includes assessment of comorbidities and medication use, screening for osteoporosis (including bone mineral density and imaging of the spine) and underlying contributors for secondary osteoporosis and other metabolic bone disease.6 Although, in a recent meta-analyses it was shown that the FLS approach results in a significant lower probability of 30% for subsequent fracture risk within two years followup,7 still, approximately 8% of fracture patients sustain a subsequent fracture, indicating need for additional preventative measures.7 Ideally, FLS screening also includes a fall risk assessment.5 The prevalence of fall risk factors in FLS patients is high8, 9 and as fall risk is potentially modifiable, optimizing strategies for early fall prevention in FLS patients is essential.5
An important part of fall risk evaluation is the assessment of physical functioning. Physical capacity (PC) and physical activity (PA) are two associated, but distinctly separate domains of physical functioning.10 PC is objectively measured physical functioning with specific tests such as the sixminute walking test (6MWT),11 while PA is ‘any bodily movement produced by skeletal muscles that results in energy expenditure above resting level’ and is measured during daily life.12 PA is recommended by the WHO because of its benefits on a wide range of health outcomes.13 Both PC and PA measures have been associated with falls. Poor performance on physical capacity tests is associated with an increased fall risk.14, 15 Importantly, low PC is potentially modifiable; exercise intervention to improve strength and balance reduce the rate of falls among older persons by approximately 25%.16 The association between physical activity and falls is not yet fully comprehended. Some studies report an association between an increased PA and fewer falls.16-18 Others report that higher physical activity is related to a higher rate of falls, possibly due to a higher exposure of risks,16, 19 as about 40-60% of falls in older persons occur during walking.20 Lu et al. hypothesize that the association between PA and falls is U-shaped, implying that both inactive and highly active older adults have higher fall rates.21 Combined evaluation of performance on PC and PA measures might provide additional insight on physical functioning and fall risk in fracture patients.
In a recent study, Koolen et al. developed a PC (can’t do or can do) and PA (don’t do or do do) quadrant framework to understand impaired physical function in COPD patients.22 This framework can be applied to FLS patients;
patients who have fallen in the past and are prone to sustain falls in the future.3 This concept allows for an integrated assessment of physical functioning as well as for the identification of quadrant subgroups with specific clinical characteristics such as modifiable fall risk factors in fracture patients. The aim of this study is to categorize physical performance of patients with a recent clinical fracture attending the FLS using the “can do, do do” framework and to assess the distribution of patients over the PC-PA quadrants and correlation between PC and PA measures. Further, we aim to explore the clinical characteristics and outcome on functional performance tests between quadrant groups.
This study is designed as a cross-sectional study including baseline data from the FX MoVie study, a prospective cohort study (N=500) conducted at FLS of VieCuri Medical Centre in Venlo, the Netherlands. Included were all patients aged 50-90 years with a recent radiographically confirmed fracture who attended the FLS for fracture risk evaluation and who were able and willing to participate. Excluded were non-Caucasian patients, patients with cognitive impairments, patients who were currently being treated for malignancy, patients with fractures due to a bone metastasis or osteomyelitis, or peri-prosthetic fractures, or fractures due to a high energetic trauma. At the FLS, all patients were evaluated and treated according to Dutch guidelines on osteoporosis and fracture prevention.23 Patients received information on the study through oral and written communication and gave written informed consent prior to participation. The study protocols were approved by an independent medical ethical committee (NL45707.072.13). Patients with missing 6MWT scores or physical activity data were excluded from the analyses.
Data collection
Baseline data include age, sex, height, weight, and body mass index (BMI) measured by trained nurse during clinic visit. Further, at the time of fracture risk evaluation, patients were asked to fill out a detailed questionnaire for evaluation of cause of the fracture, risk factors for falls, fractures, and osteoporosis, medication use, and included self-reported variables such as living situation, smoking and alcohol use, dizziness and balance problems, urinary incontinence, vision impairment, use of walking aids, fear of falling, dizziness or balance problems and number of falls in the past 12 months. Comorbidities and fractures were derived from the electronic patient files and categorized according to ICD-10 standards.24 Fracture location was grouped into hip, major and minor fractures according to Center et al.25: I. hip fractures,
The "can do, do do" framework applied to explore PC, PA and fall risk factors.
II. major fractures; vertebra, multiple rib, humerus, pelvis, distal femur and proximal tibia, and III. minor fractures; all other fractures (including finger and toe fractures). Functional assessments were performed during (PC measures), or just after (PA) the baseline visit and was overseen by trained nurses.
Measurements of the quadrant concept
Physical capacity
The main outcome measure of physical capacity was the six-minute walking distance (6MWD) measured by the 6MWT. 6MWT is a valid test with excellent test-retest and inter-rater reliability11, 26 and was assessed in a linoleum hallway using standardized instructions.27 Patients were asked to walk around two safety cones placed 10 meters from each other at a comfortable speed while covering as much distance as possible. No encouragements were given during the test. Use of walking aids was permitted. Patients were allowed to rest or stop when needed. 6MWD was calculated by multiplying the number of rounds with 20 meter and additionally adding the meters of final lap.
Physical activity
The physical activity of the participants was measured during eight consecutive days of free living using the triaxial accelerometer MOX (Maastricht Instruments B.V., The Netherlands). Details of the processing of raw accelerometer data and activity classification is explained in more detail elsewhere.28, 29 In short, MOX is a small waterproof device with the dimensions 4.5 x 4.0 x 1.4 cm, a sampling frequency of 25 Hz, sensor range of +/- 6 G.29 The MOXBW software (Maastricht Instruments B.V., The Netherlands) was used to calibrate the device. It was attached to every subject on the right thigh ten centimeters above the knee, by the same researcher. The participants were instructed to follow their normal daily routines, while keeping an activity log. Data of the MOX and activity log of at least six consecutive days, including at least one weekend day, was used for analysis. The raw acceleration data was processed using MATLAB R2012a software (The MathWorks Inc., Natick, MA, USA). Using the signal magnitude area, a measure of the intensity of physical activity, static and dynamic activity (DA) were determined. DA is expressed as average minutes per day and was further categorized as low physical activity (LPA), moderate to vigorous physical activity (MVPA), and vigorous physical activity (VPA), respectively corresponding to intensities below 3 metabolic equivalents (METS), between 3 and 6 METS, and above 6 METS, respectively.29
Quadrant concept and threshold for poor performance
Patients were divided in mutually exclusive categories using the quadrant concept for PC and PA presented by Koolen et al.22 (1) Low PC, low PA (can’t do, don’t do); (2) preserved PC, low PA (can do, don’t do); (3) low PC, preserved
PA (can’t do, do do); and (4) preserved PC, preserved PA (can do, do do). The threshold for low PC was defined as -2SD below sex specific means of the 6MWD, using reference values of Beekman et al;30 625 ± 120 meter for men and 554 ± 94 meter for women. Thus, the threshold for low PC was 385m for men and 366m for women, respectively. The threshold of low PA was defined as < 150 minutes of MVPA/VPA per week (21.4 min/day), as this is the recommended minimum intensity adults and older adults (65+) should exercise for general health benefits by the WHO.13
In addition to the main PC measure, three other functional performance tests were performed; timed up-and-go (TUG), handgrip strength (HGS) and chair stand test (CST). All tests have proven validity and good to excellent test-retest and inter-rater reliability in elderly populations with and without comorbidities.31-35 TUG measures balance and overall mobility.31 Participants were observed and timed while they rise from a chair with armrests, walk for three meters, turn, walk back to the chair and sit down again. Use of walking aids was permitted. Of a total of three attempts, the mean time in seconds was used as TUG score. HGS measures upper extremity strength and was measured by handheld dynamometer (Jamar, Sammons Preston, Bolingbrook, Illinois).35 The participant was seated with the elbows flexed at 90 degrees and was asked to squeeze as hard as possible with their left and right hand. The maximum HGS in kg was the highest score out of three attempts for their left hand and right hand and was used for analysis. Lower body muscle strength was assessed by the timed CST.32 This test measured the number of times a person can fully stand up from a chair in 30 seconds time. Patients were instructed to start in seated position, cross arms over the chest, fully sit back down in between stands, and not to use the armrests, unless unavoidable. Appendicular Lean Mass (ALM) was measured as the sum of lean mass of arms and legs and corrected for squared height. Sarcopenia was defined following European Working Group on Sarcopenia in Older People (EWGSOP2) guidelines as having low ALM (< 5.5 kg/m2 for women or < 7.0 kg/m2 for men), combined with having either low scores on the 30CST (< 10 stands), and/or low HGS (< 16kg for women and < 27kg for men).36 Measurement of bone mineral density (BMD) and vertebral fracture assessment (VFA) were carried out. The BMD of the participants was measured with a total body dual energy X-ray absorptiometry (DXA) using the Hologic Discovery DXA system (Hologic Inc, Bedford, MA, USA). A trained radiology technologist scanned the lumbar spine vertebra L1 to L4, total hip, and femoral neck of the left leg. The lowest T-score score of the three measurements was used and normal BMD was defined as a T-score ≥ -1SD, osteopenia was defined as T score < -1.0 SD and osteoporosis < -2.5 SD, in accordance with WHO criteria.37 Diagnosis of osteosarcopenia was given in case of osteopenia or osteoporosis diagnosis combined with a
The "can do, do do" framework applied to explore PC, PA and fall risk factors.
diagnosis of sarcopenia (EWGSOP2).38 Prevalent vertebral fractures (VFs) were assessed on lateral spine images acquired with DXA. Grading of VFs was done morphometrically using the VF classification of Genant.39 VFs were graded based on % height loss as follows; grade 1 (20 to 25%), grade 2 (25 to 40%), or grade 3 (height loss > 40%). Patients were classified according to the most severe VF.
Statistical analysis
Baseline characteristics were described using frequencies (proportions) for categorical variables and means ± SD or medians (interquartile ranges) for continuous data. To examine the relationship between PC and PA measures a Pearson’s correlation coefficient (PCC) was calculated. Strength of correlation was defined as follows; PCC 0.0 to 0.3 negligible; 0.3 to 0.5 low; 0.5 to 0.7 moderate; 0.7 to 0.9 high and 0.9 to 1 very high correlation.40 Furthermore, we calculated an OR between the PC and PA categories. Analyses were stratified by sex due to the sex specific cut-off scores of the 6MWT. Assessment of differences between quadrants was carried out for all measured variables. Comparison between groups for categorical variables was performed using ChiSquare test or Fisher exact tests (in case of small sample sizes) with post-hoc testing using pairwise Z-test with Bonferroni correction. One-way ANOVA was used for normally distributed continuous variables. Equality of variances was checked and overall tests and post-hoc tests (Bonferroni, or Games-Howell) were performed accordingly. In case of non-normal data, a Kruskall-Wallis test was performed. P-values < 0.05 were considered statistically significant. All statistical analyses were conducted using SPSS version 20 (IBM Corp., USA).
Results
Study population
A total of 500 participants out of 1011 consecutive FLS attendees consented to participate in the FX MoVie cohort. One hundred participants were excluded due to missing data on PA or PC measures, resulting in 400 participants available for analysis. Participants attended the FLS on average 3.5 ± 1.0 months after fracture. Mean age was 64.5 ± 8.1 years for women and 64.8 ± 9.7 years for men, and 70.8% of the patients were female. Fracture types for men and women respectively were as follows; 74% and 75% minor fracture, 21% and 20% major fractures and 5% hip fractures in both groups. In men, 83.8% of fractures were caused by a fall, in women 86.5%, respectively. At least 2 falls in the past 12 months, excluding the fall that caused the fracture, were reported by 12% of women and 14.5% of men. Osteoporosis was diagnosed in 24.7% of women and 15.2% of men. In both men and women, at least one prevalent VF grade 2 or 3 was present in 12.0% of participants.
Overall, 72.3% of the participants performed in the “can do” group (PC [6MWD] > 385 meters for men and > 366 meters for women), and 88.8% of the participants were categorized in the “do do” group (PA > 21.4min/day). This was 74.4% (PC) and 86.9% (PA) in women and 74.4% (PC) and 94.9% (PA), in men, respectively. Of all participants in the “can do” group, 95.8% was categorized in the “do do” group. Of the participants in the “can’t do group” 70.3% was categorized in the “do do” group.
The average physical performance measures for women were 406.6 ± 87.3 meter on the 6MWD, 8.4 ± 2.6 seconds for TUG, 11.6 ± 3.0 number of stands for CST, 21.4 ± 7.1 kg for HGS, and a median of 51.0 (31.0, 77.0) minutes in MVPA or VPA per day. The average physical performance measures for men were a median of 458.0 (383.0, 516.0) meter on the 6MWD, 7.3 (6.3, 8.3) seconds for TUG, 12.0 (11.0, 13.8) number of stands for CST, 38.0 (32.5, 44.0) kg for HGS, and a median of 78.0 (48.0, 111.0) minutes in MVPA or VPA per day. For men and women, the prevalence of sarcopenia was 0% and 0.3%, and of osteosarcopenia 0% and 0.3%, respectively.
Our data showed a significant correlation between PA and PC for the total study population (r = 0.46; p < 0.01), as well for women and men separately (r = 0.475 [p < 0.01]; r = 0.337 [p < 0.05], resp.). Further, our data showed significant correlation between PA and other measures of physical capacity for the total study population (r = -0.39 for TUG [p < 0.01], r = 0.40 for CST [p < 0.01], and r = 0.28 for HGS [p < 0.01]).
As shown in Figure 1A and 1B, distribution of participants in quadrant groups for women and men, respectively, was as follows; 9.5% and 5.1% in the “can’t do, don’t do” group; 4.2% and 0% in the “can do, don’t do”; 18.7% and 20.5% in the “can’t do, do do” and 67.5% and 74.4% in the “can do, do do”. Supplementary figure 1A-C and 2A-C show the distribution over quadrant groups for minor, major and hip fractures, for women and men, respectively. For men and women together, the distribution over the quadrants was as follows; 8.3% can’t do, don’t do”; 3.0% “can do, don’t do”; 19.3% “can’t do, do do”; 69.5% “can do, do do”. The odds of having poor PA was 9.76 (95%CI: 4.82-19.80) in participants with a poor PC as compared to preserved PC (total cohort).
The "can do, do do" framework applied to explore PC, PA and fall risk factors.
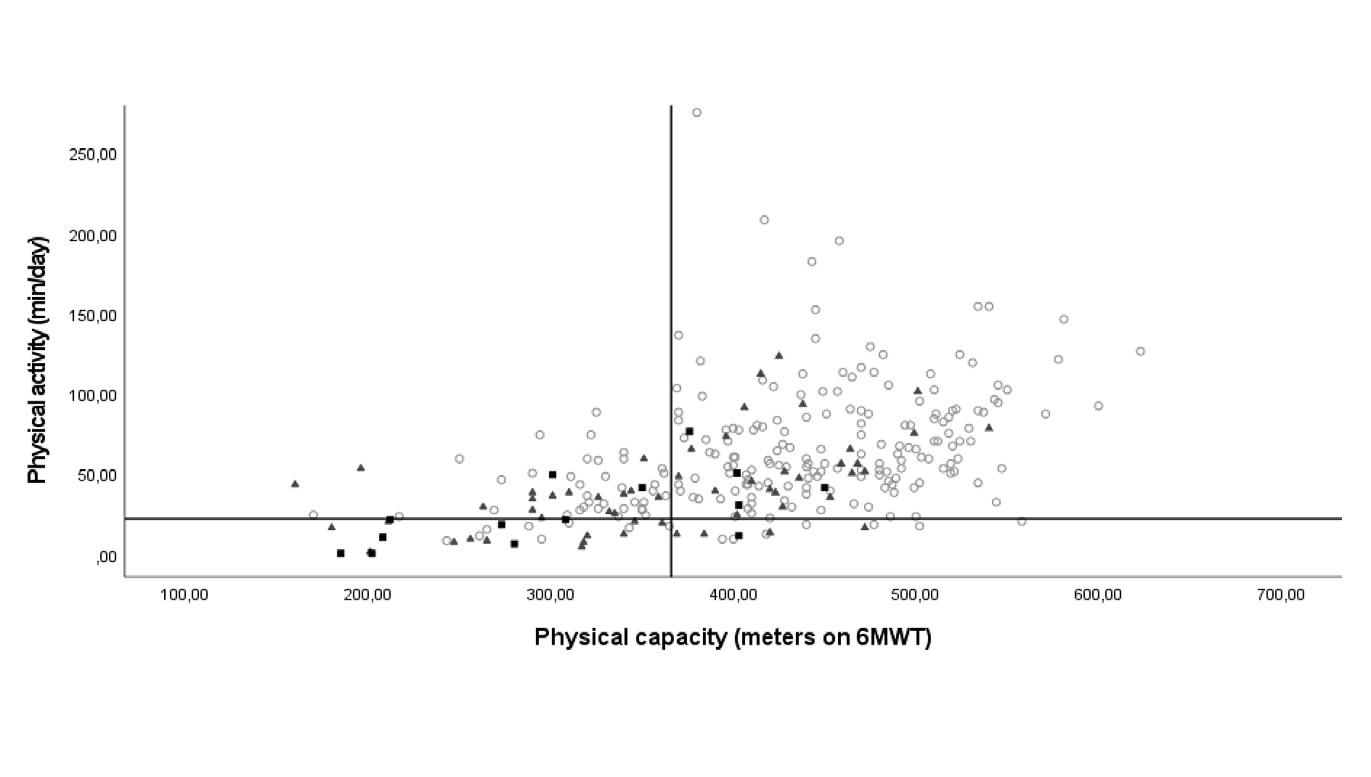
Can’t do, do do (18.7%)
PCC r=0.475 (p<0.05)
Can’t do, don’t do (9.5 %)
Can’t do, do do (20.5%)
PCC r=0.337 (p<0.05)
Can’t do, don’t do (5.1%)

Can do, do do (67.5%)
Can do, don’t do (4.2%)
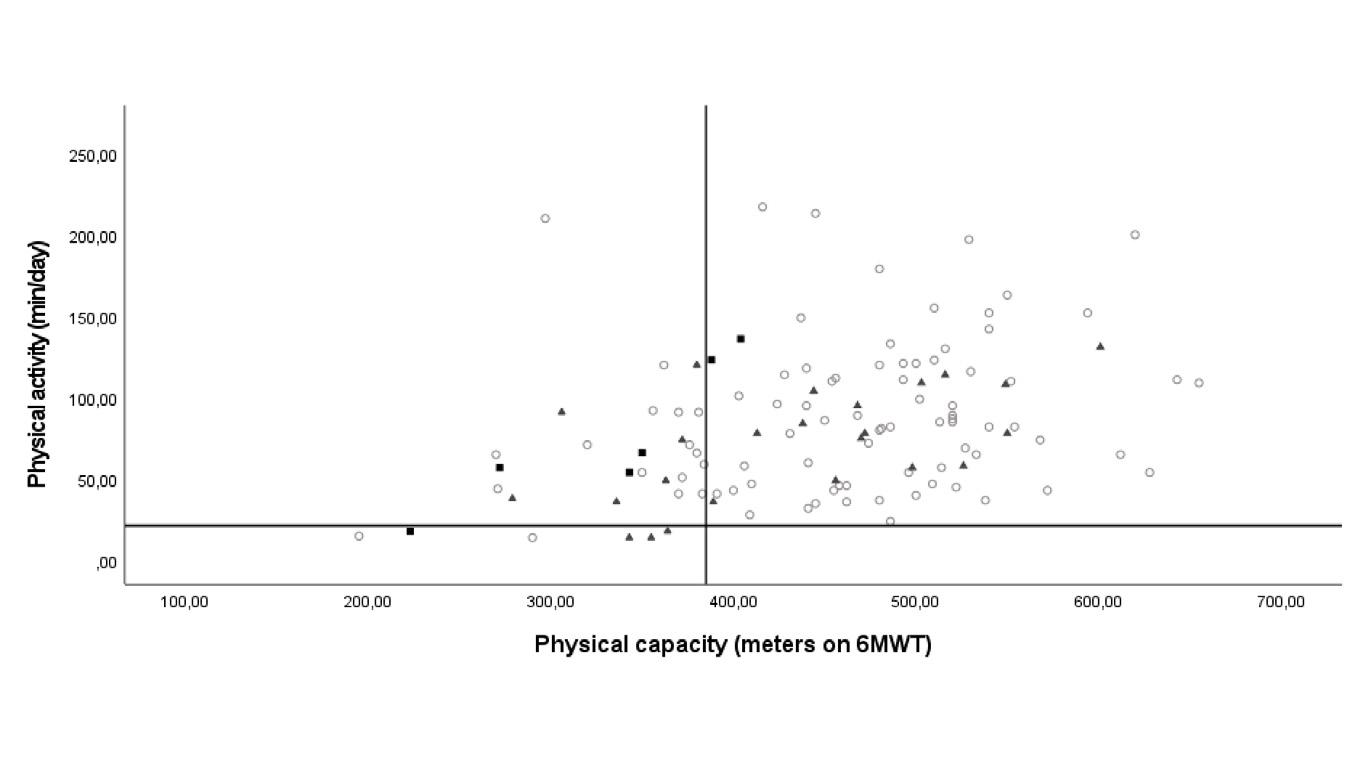
Can do, do do (74.4%)
Can do, don’t do (0.0 %)
Figure 1. Overview of PC-PA quadrant framework for women (A) and men (B) 6MWT, 6 Minute walking test; PCC, Pearson correlation coefficient. Fracture groups according to Center et al.25 Figure 1A displays the scatterplot of physical activity (measured by MOX accelerometer) and physical capacity (measured by 6-minute walking test) of the female participants. The cut-off for low PC is 366 meter (can’t do), the cut-off for low PA is 21 min/day (don’t do). The distribution over the four quadrant groups is as follows; 9.5% in the “can’t do, don’t do” group; 4.2% in the “can do, don’t do”; 18.7% in the “can’t do, do do” and 67.5% in the “can do, do do”. Pearson correlation coefficient is 0.475, p<0.05. Figure 1B displays the scatterplot of physical activity and physical capacity for the male participants. The cut-off for low PC is 385 meter (can’t do), the cut-off for low PA is 21 min/day (don’t do). Distribution over quadrants is as follows: 5.1% in the “can’t do, don’t do” group; 0% in the “can do, don’t do”; 20.5% in the “can’t do, do do” and 74.4% in the “can do, do do”. Pearson correlation coefficient is 0.337, p<0.05.
5 Table 1. Patient characteristics of female quadrant groups
(31.0, 77.0) 11 (7.0, 18.0) †‡ 12 (11.3, 17.8) †‡ 36.0 (28.0, 48.5) ‡ 63.0 (47.0, 89.0) p<0.05*
Missing sample data per category: living alone n= 282; TH score n= 276; LS score n=281; FN score n=276; urinary incontinence n= 281; vision impairment n= 268; dizziness/balance problems n= 371; fear of falling n=280; falling last year n= 282. In case of missing data valid percentages are reported. a continuous variable: mean ± SD, median (IQR); b categorical variable: number (%). BMI: body mass index, BMD: bone mineral density, TUG: Timed up and go, CST: 30 seconds chair stand test, HGS: hand grip strength, 6MWD: six minute walking distance, MVPA: moderate-to-vigorous physical activity, VPA: vigorous physical activity, Av.: Average. *p < 0.05 vs can do, don’t do, † p < 0.05 vs can’t do, do do, ‡ p < 0.05 vs can do, do do
Table 2. Patient characteristics of male quadrant groups
Femoral neck T-Score a -1.20 ± 0.73 -1.6 (-2.7,-1.4)-0.4 (-2.5 -0.4) -1.1 (-1.7, -0.6) P=0.07
Prevalent Vertebral fracture Gr.2-3 b 14 (12.0) 2 (33.3)5 (20.8) 7 (8.0) p<0.05*
(8.8, 15.9) ‡
8.3)
(8.3, 10.9) ‡ 7.0 (6.0, 7.7) p<0.05* 30CST, no of stands a 12.0 (11.0, 13.8) 8.5 (7.5, 11.0) ‡
10.5 (9.3, 11.8) ‡ 13 (11.8, 14.0) p<0.05* HGS, kg a 38.0 (32.5, 44.0) 25.0 (24.0, 33.5) ‡38.0 (30.0, 40.0) ‡ 40.0 (34.0, 44.0) p<0.05*
6MWD, meters a 458.0 (383.0, 516.0) 316.5 (216.0, 357.3) ‡359.0 (309.0, 375.0) ‡ 486.0 (445.0, 527.0) p<0.05*
MVPA/VPA, av. min/day a 78.0 (48.0, 111.0) 14.5 (14.0, 18.0) †‡65.5 (49.5, 91.0) ‡ 85 (57.0, 116.0) p<0.05*
Sample data per category in case of missing data: living alone n=115; hip/vertebral/femoral neck T-score n=116; dizziness/balance problems n=106; urinary incontinence n=116; fear of falling n=116; vision impairment n=108. In case of missing data valid percentages are reported. a continuous variable: mean ± SD, median (IQR); b categorical variable: number (%). BMI: body mass index, BMD: bone mineral density, TUG: Timed up and go, CST: 30 seconds chair stand test, HGS: hand grip strength, 6MWD: six minute walking distance, MVPA: moderate-to-vigorous physical activity, VPA: vigorous physical activity, Av.: Average. † p<0.05 vs can’t do, do do, ‡ p<0.05 vs can do, do do
Characteristics of quadrant groups
As shown in Table 1, women in the “can’t do, don’t do” versus the “can do, do do” group were older, used alcohol less often, presented more often with hip or major fractures, were diagnosed more frequently with osteoporosis. Further, walking aids were used more frequently and women reported a higher of fear of falling and fall incidents in the past 12 months. Moreover, they performed worse on all physical performance tests. Comparable results were shown for the “can’t do, do do” group versus the “can do, do do” group, except for BMD measures and prevalent VF. The “can’t do, don’t do” compared to the “can’t do, do do” group presented with more hip fractures, and less minor fractures, more osteoporosis and a worse performance on TUG and PA measures. As shown in Table 2, men in the “can’t do, don’t do” group compared to the “can do, do do” group respectively, used less often alcohol, had less minor fractures, were diagnosed more frequently with osteoporosis, used walking aids more frequently, and performed worse on all functional performance tests. Similar results were seen for the “can’t do, do do” group versus the “can do, do do”, except for alcohol use and minor fractures.
This is the first study to implement the “can do, do do” framework in patients with a recent fracture attending the FLS for fracture risk evaluation. The framework offers additional insight on impaired physical function of FLS patients by categorizing them into subgroups of physical activity and capacity measures. It enables identification of FLS patients with definable treatment traits and, thus, might be useful in stratification for targeted interventions in the future.
“Can Do, Do Do” framework in FLS patients
Correlation between PC measures (6MWT, TUG, CST and HGS) and PA was significant, but low. This is in line with findings of Van Lummel et al. and Koolen et al., who concluded that these measures are related but separate domains of physical functioning.10, 22 The low proportion of participants with poor PA (less than 21,4 minutes/day) in our study population is surprising, especially since approximately 50% of the Dutch general population of 50 years and older do not meet the WHO recommendations of a minimal of 150 minutes (M) VPA per week.41 Remarkably, the inhabitants of the region of the Netherlands in which the hospital is located (North-Limburg) have a poorer health status defined as the total number of chronic diseases including COPD, smoking, BMI compared to the general Dutch population.42 A possible explanation for the high proportion of preserved PA is that participants were aware of the recording during accelerometer measurement and consequently could increase activity
The "can do, do do" framework applied to explore PC, PA and fall risk factors.
during the test period. Also, physical activity of the Dutch population was not measured by accelerometer, but with the SQUASH questionnaire making results less comparable. Furthermore, this population might be subject to a healthy cohort bias; first, only 60% of all consecutive patients with a clinical fracture attended the FLS for fracture risk evaluation. FLS attenders are less frail, and have less hip fractures compared to patients that do not respond to the FLS invitation.43, 44 Second, participation in the FX MoVie study was voluntary, and compared to the FLS attenders who did not participate, FX MoVie participants were younger, had less severe fracture types and less prevalent VFs.3 This healthy complier bias is also reflected in the low percentage of sarcopenia in our population. The prevalence of (osteo)sarcopenia in this study is very low. This was mostly due to the prevalence of low ALM/m2 in our total population of only 0.8%, as opposed to the proportion of patients that scored below their cutoff points on HGS and/or CST of 17.6% and 18.5%, respectively. Furthermore, compared to many other guidelines, the EWGSOP2 identifies sarcopenia less often, pointing to a possible underestimation of sarcopenia.45, 46
The application of the “can do, do do” concept strongly relies on the predetermined cut-off scores. The cut-off for low physical activity (21.4 min MVPA/ day) was derived from the lower end of amount of 150-300 minutes MVPA/ week recommended by the WHO guidelines13 and was, among others, based on a review that showed a maximal risk reduction for mortality at MVPA >24 min/day.47 A study of Buchner et al. revealed a higher falls rate for women with a MVPA of less than 25.1 min/day (lowest compared with highest quartile of MVPA).48 However, changing our cut-off value from 21.4 to 25 min/day, merely increased the proportion of patients with low PA from 11% to 15%. Furthermore, we did not take into account if MVPA was performed in bouts of at least 10 minutes uninterrupted PA, which might lead to an overestimation of MVPA of the participants. However, physical activity of any bout duration is associated with improved health outcomes and the WHO no longer recommends it.13 Lastly, the MOX accelerometer cut-off points to categorize dynamic activity were validated in a younger population.29 However, this would have resulted in an underestimation instead of an overestimation of MVPA.
The six-minute walking showed that participants who “can’t do” had an almost 10-fold higher odds to be categorized in the “don’t do” group, compared to the “can do” group. Only 3% of all the “don’t do” participants were categorized in the “can do, don’t do” group, meaning they were able to be physical active, but did not undertake physical activity. This group encompassed only 4% of all “can do” participants. These results indicate that if the FLS population “can do”, they most often “do do”.
About 20% of FLS participants “can’t do” but “do do” anyway, indicating that this group might exhibits risky behavior that could result in a higher rate of falls. This “can’t do, do do” group had significantly lower measures on all functional capacity tests, compared to those in the “can do, do do” group. They
were relatively older, had higher fear of falling and a higher proportion used a walking aids. These are all known fall risk factors.15 Older adults with poor gait and balance might be less equipped to prevent falls against more severe perturbations of balance during PA,15 and have been proven to have higher rate of falls during habitual walking.19 Combining this with a high exposure to mishaps during PA, this “can’t do, do do” group might be prone to future falls.15, 19 However, this group might also benefit from their preserved daily activity in several ways; first, physical activity can improve bone strength and offers benefit in the management of osteoporosis.49 In line with the literature, the “can’t do, do do” group had lower levels of osteoporosis and hip fractures compared to the “can’t do, don’t do” group. Second, low physical activity can lead to a decline in (instrumental) activities of daily living, balance and strength causing a vicious circle of declined physical functioning.50, 51 This is in line with a study of Delbaere et al. used an approach similar to the “Can do, do do” framework to assess physiological fall risk (estimated using the physiological profile assessment) and perceived fall risk (measured by the falls efficacy scale international) in older community dwelling adults.52 Both measures were associated with future falls. However, the group with high physiological, but low perceived fall risk had a fall incidence of 30% during follow-up, which was lower compared to those with also a high perceived fall risk (41%). A possible explanation for this lower risk was that a positive outlook on life, community participation and preserved PA might be protective of future falls. Interestingly, Delbaere et al. did not find excessive risk-taking behavior based on the psychological profile in this group. However, the “can’t do, do do” group might be prone to reduce PA in the future, as falls and increased fear of falling have shown to be important factors to restrict PA, resulting in a vicious cycle of functional decline.15 Attention to physical functioning to preserve PA and increase PC in this group at the FLS is therefore essential. Only 8% of all participants were categorized in the “can’t do, don’t do” group. As expected, the largest differences in fall risk factors were seen between this group and the “can do, do do group”; the first had lower functional capacity measures and higher use of walking aid (men and women) and fear of falling (women). For women the group was older and had higher proportion of hip, major and prevalent vertebral fracture, both men and women had higher proportion of osteoporosis. These findings are consistent with literature that describes a decrease of functional performance with higher age and after major and hip fractures53 and suggest that this group might be suitable for exercise interventions.16 These interventions have shown positive effect on fall rate16 and on prevention of fall-related injuries, specifically in patients at high risk for falling and patients with osteoporosis.54 Moreover, the higher proportion of osteoporosis and VF (women) suggests that this subgroup could benefit from additional physical activity training in a controlled setting to increase bone strength, in addition to anti-osteoporotic treatment.49 Current
The "can do, do do" framework applied to explore PC, PA and fall risk factors.
WHO recommendations state that the benefits of PA outweighed the potential harms, and stated that possible harms can be managed by a gradual increase in the amount and intensity of physical activity.13
Strengths and limitations
Our study has several strengths. This is a large, real-life sample of patients with a recent fracture attending the FLS, including a wide range of fracture types, with and without osteoporosis. Participants were comprehensively assessed allowing for comparison of multiple fall risk variables and extensive physical functioning measures between quadrant groups. However, several limitations must be addressed. As stated before, selection bias is present resulting in a relatively healthy study population. Further, due to the cross-sectional design of our study causality between clinical characteristics, quadrant group and fall or fracture risk cannot be evaluated. It is therefore essential that future research on this framework should focus on prospective falls and fall related injury in these quartiles. Furthermore, these future studies should include more falls specific PC measures such as reactive balance, as this might contribute to the discrimination between fallers and non-fallers.55 Moreover, PA and PC measurements could be affected by the type of fracture the participant sustained four months before the FLS visit and measurements. However it is also plausible that PC and PA contributed to the fall and fracture incident itself. Lastly, as stated before, cut-off scores are of large influence and application of the concept should always be considered within their limitations.
The “can do, do do” framework offers a new approach to understanding PC a PA measures in fracture patients. Moreover, it can be used to categorize patients into subgroups with distinct clinical characteristics among which fall and fracture risk factors. Results of this FLS population showed that patients that “can do”, “do do”, reducing the population eligible for behavioral interventions. Nevertheless, 20% of the FLS patients “can’t do” but “do do” while they have a high prevalence of fall risk factors compared to persons that “can do” and “ do do”, which may indicate this group is prone to fall. Prospective studies are needed to assess the relationship between quartile categorization and prospective fall and fracture events.
1. Rubenstein LZ, Josephson KR. The epidemiology of falls and syncope. Clin Geriatr Med. 2002;18:141158.
2. Schwenk M, Lauenroth A, Stock C, et al. Definitions and methods of measuring and reporting on injurious falls in randomised controlled fall prevention trials: a systematic review. BMC Med Res Methodol. 2012;12:50.
3. Vranken L, Wyers CE, Van der Velde RY, et al. Association between incident falls and subsequent fractures in patients attending the fracture liaison service after an index fracture: a 3-year prospective observational cohort study. BMJ Open. 2022;12:e058983.
4. van Geel TA, van Helden S, Geusens PP, et al. Clinical subsequent fractures cluster in time after first fractures. Ann Rheum Dis. 2009;68:99-102.
5. Lems WF, Dreinhöfer KE, Bischoff-Ferrari H, et al. EULAR/EFORT recommendations for management of patients older than 50 years with a fragility fracture and prevention of subsequent fractures. Ann Rheum Dis. 2017;76:802-810.
6. van den Bergh JP, van Geel TA, Geusens PP. Osteoporosis, frailty and fracture: implications for case finding and therapy. Nat Rev Rheumatol. 2012;8:163-172.
7. Li N, Hiligsmann M, Boonen A, et al. The impact of fracture liaison services on subsequent fractures and mortality: a systematic literature review and meta-analysis. Osteoporos Int. 2021;32:1517-1530.
8. Vranken L, Wyers CE, Van der Velde RY, et al. Comorbidities and medication use in patients with a recent clinical fracture at the Fracture Liaison Service. Osteoporos Int. 2018;29:397-407.
9. Van Helden S, van Geel AC, Geusens PP, et al. Bone and fall-related fracture risks in women and men with a recent clinical fracture. J Bone Joint Surg Am. 2008;90:241-248.
10. van Lummel RC, Walgaard S, Pijnappels M, et al. Physical Performance and Physical Activity in Older Adults: Associated but Separate Domains of Physical Function in Old Age. PLoS One. 2015;10:e0144048.
11. Rikli RE, Jones CJ. The reliability and validity of a 6-minute walk test as a measure of physical endurance in older adults. Journal of aging and physical activity. 1998;6:363-375.
12. Caspersen CJ, Powell KE, Christenson GM. Physical activity, exercise, and physical fitness: definitions and distinctions for health-related research. Public
Health Rep. 1985;100:126-131.
13. World Health Organization. WHO guidelines on physical activity and sedentary behaviour. World Health Organization, Geneva 2020.
14. Cöster ME, Karlsson M, Ohlsson C, et al. Physical function tests predict incident falls: A prospective study of 2969 men in the Swedish Osteoporotic Fractures in Men study. Scand J Public Health. 2020;48:436-441.
15. Ambrose AF, Paul G, Hausdorff JM. Risk factors for falls among older adults: a review of the literature. Maturitas. 2013;75:51-61.
16. Sherrington C, Fairhall N, Kwok W, et al. Evidence on physical activity and falls prevention for people aged 65+ years: systematic review to inform the WHO guidelines on physical activity and sedentary behaviour. Int J Behav Nutr Phys Act. 2020;17:144.
17. Heesch KC, Byles JE, Brown WJ. Prospective association between physical activity and falls in community-dwelling older women. J Epidemiol Community Health. 2008;62:421-426.
18. Klenk J, Kerse N, Rapp K, et al. Physical Activity and Different Concepts of Fall Risk Estimation in Older People--Results of the ActiFE-Ulm Study. PLoS One. 2015;10:e0129098.
19. Okubo Y, Seino S, Yabushita N, et al. Longitudinal association between habitual walking and fall occurrences among community-dwelling older adults: analyzing the different risks of falling. Arch Gerontol Geriatr. 2015;60:45-51.
20. Boyé ND, Mattace-Raso FU, Van der Velde N, et al. Circumstances leading to injurious falls in older men and women in the Netherlands. Injury. 2014;45:1224-1230.
21. Lu Z, Lam FMH, Leung JCS, et al. The U-Shaped Relationship Between Levels of Bouted Activity and Fall Incidence in Community-Dwelling Older Adults: A Prospective Cohort Study. J Gerontol A Biol Sci Med Sci. 2020;75:e145-e151.
22. Koolen EH, van Hees HW, van Lummel RC, et al. “Can do” versus “do do”: A Novel Concept to Better Understand Physical Functioning in Patients with Chronic Obstructive Pulmonary Disease. J Clin Med. 2019;8:
23. Dutch Institute for Healthcare Improvement CBO. Richtlijn Osteoporose en Fractuurpreventie, Derde Herziening [Dutch] Dutch Institute for Healthcare Improvement CBO, Utrecht, The Netherlands 2011.
24. World Health Organisation. ICD-10: international statistical classification of diseases and related
The "can do, do do" framework applied to explore PC, PA and fall risk factors.
health problems, Tenth revision. World Health Organisation, Geneva, Switzerland. 2004
25. Center JR, Nguyen TV, Schneider D, et al. Mortality after all major types of osteoporotic fracture in men and women: an observational study. Lancet. 1999;353:878-882.
26. Overgaard JA, Larsen CM, Holtze S, et al. Interrater Reliability of the 6-Minute Walk Test in Women With Hip Fracture. J Geriatr Phys Ther. 2017;40:158-166.
27. Singh SJ, Puhan MA, Andrianopoulos V, et al. An official systematic review of the European Respiratory Society/American Thoracic Society: measurement properties of field walking tests in chronic respiratory disease. Eur Respir J. 2014;44:1447-1478.
28. Bijnens W, Aarts J, Stevens A, et al. Optimization and Validation of an Adjustable Activity Classification Algorithm for Assessment of Physical Behavior in Elderly. Sensors (Basel). 2019;19:5344.
29. van der Weegen S, Essers H, Spreeuwenberg M, et al. Concurrent validity of the MOX activity monitor compared to the ActiGraph GT3X. Telemed J E Health. 2015;21:259-266.
30. Beekman E, Mesters I, Gosselink R, et al. The first reference equations for the 6-minute walk distance over a 10 m course. Thorax. 2014;69:867-868.
31. Podsiadlo D, Richardson S. The timed “Up & Go”: a test of basic functional mobility for frail elderly persons. J Am Geriatr Soc. 1991;39:142-148.
32. Jones CJ, Rikli RE, Beam WC. A 30-s chair-stand test as a measure of lower body strength in community-residing older adults. Res Q Exerc Sport. 1999;70:113-119.
33. Ozcan Kahraman B, Ozsoy I, Akdeniz B, et al. Testretest reliability and validity of the timed up and go test and 30-second sit to stand test in patients with pulmonary hypertension. Int J Cardiol. 2020;304:159-163.
34. Gill SD, de Morton NA, Mc Burney H. An investigation of the validity of six measures of physical function in people awaiting joint replacement surgery of the hip or knee. Clin Rehabil. 2012;26:945-951.
35. Roberts HC, Denison HJ, Martin HJ, et al. A review of the measurement of grip strength in clinical and epidemiological studies: towards a standardised approach. Age Ageing. 2011;40:423-429.
36. Cruz-Jentoft AJ, Bahat G, Bauer J, et al. Sarcopenia: revised European consensus on definition and diagnosis. Age Ageing. 2019;48:16-31.
37. World Health Organisation. Prevention and management of osteoporosis. World Health Organization Technical Report Series. 2003 pp
pp. 1–164.
38. Hirschfeld HP, Kinsella R, Duque G. Osteosarcopenia: where bone, muscle, and fat collide. Osteoporos Int. 2017;28:2781-2790.
39. Genant HK, Wu CY, van Kuijk C, et al. Vertebral fracture assessment using a semiquantitative technique. J Bone Miner Res. 1993;8:1137-1148.
40. Hinkle DE, Wiersma W, Jurs SG. Applied statistics for the behavioral sciences. Houghton Mifflin College Division, 2003.
41. Centraal Bureau voor de Statistiek (CBS). Leefstijl en (preventief) gezondheidsonderzoek; persoonskenmerken (2021). Accessed June 15th 2022.
42. GGD’en CBS en RIVM. Gezondheidsmonitor Volwassenen en Ouderen. 2020 Accessed July 6th 2022.
43. van den Berg P, van Haard PMM, Geusens PP, et al. Challenges and opportunities to improve fracture liaison service attendance: fracture registration and patient characteristics and motivations. Osteoporos Int. 2019;30:1597-1606.
44. Eekman DA, van Helden SH, Huisman AM, et al. Optimizing fracture prevention: the fracture liaison service, an observational study. Osteoporos Int. 2014;25:701-709.
45. Stuck AK, Mäder NC, Bertschi D, et al. Performance of the EWGSOP2 Cut-Points of Low Grip Strength for Identifying Sarcopenia and Frailty Phenotype: A Cross-Sectional Study in Older Inpatients. Int J Environ Res Public Health. 2021;18:
46. Harvey NC, Orwoll E, Kwok T, et al. Sarcopenia Definitions as Predictors of Fracture Risk Independent of FRAX(®) , Falls, and BMD in the Osteoporotic Fractures in Men (MrOS) Study: A Meta-Analysis. J Bone Miner Res. 2021;36(7):12351244.
47. Ekelund U, Tarp J, Steene-Johannessen J, et al. Dose-response associations between accelerometry measured physical activity and sedentary time and all cause mortality: systematic review and harmonised meta-analysis. Bmj. 2019;366:l4570.
48. Buchner DM, Rillamas-Sun E, Di C, et al. Accelerometer-Measured Moderate to Vigorous Physical Activity and Incidence Rates of Falls in Older Women. J Am Geriatr Soc. 2017;65:24802487.
49. Brooke-Wavell K, Skelton DA, Barker KL, et al. Strong, steady and straight: UK consensus statement on physical activity and exercise for osteoporosis. Br J Sports Med. 2022;
50. Deshpande N, Metter EJ, Lauretani F, et al. Activity restriction induced by fear of falling and objective and subjective measures of physical function: a prospective cohort study. J Am Geriatr Soc. 2008;56:615-620.
51. Ambrose AF, Cruz L, Paul G. Falls and Fractures: A systematic approach to screening and prevention. Maturitas. 2015;82:85-93.
52. Delbaere K, Close JC, Brodaty H, et al. Determinants of disparities between perceived and physiological risk of falling among elderly people: cohort study. Bmj. 2010;341:c4165.
53. Szulc P. Impact of Bone Fracture on Muscle Strength and Physical Performance-Narrative Review. Curr Osteoporos Rep. 2020;18:633-645.
54. Zhao R, Bu W, Chen X. The efficacy and safety of exercise for prevention of fall-related injuries in older people with different health conditions, and differing intervention protocols: a meta-analysis of randomized controlled trials. BMC Geriatr. 2019;19:341.
55. McCrum C. Fall Prevention in Community-Dwelling Older Adults. N Engl J Med. 2020;382:2579-2580.
The "can do, do do" framework applied to explore PC, PA and fall risk factors.
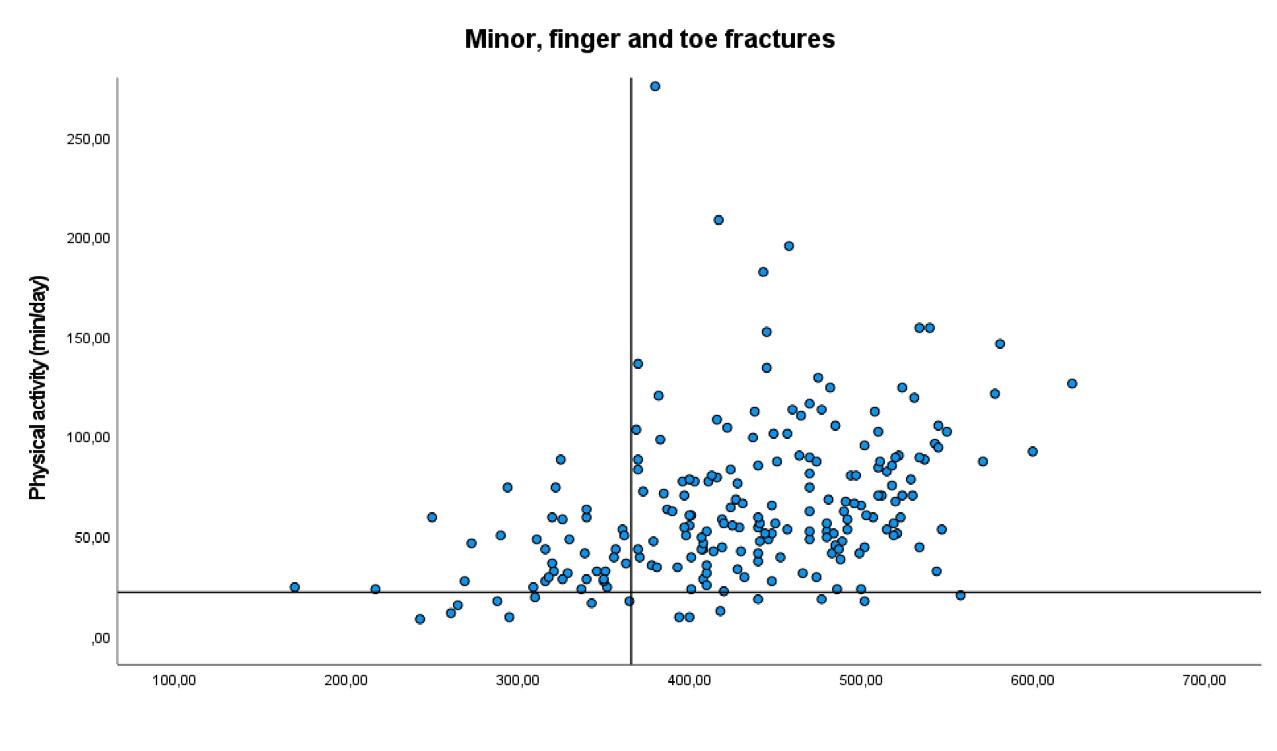
Can’t do, do do (16.4%)
Can’t do, don’t do (3.8%)
Can do, don’t do (3.3%)
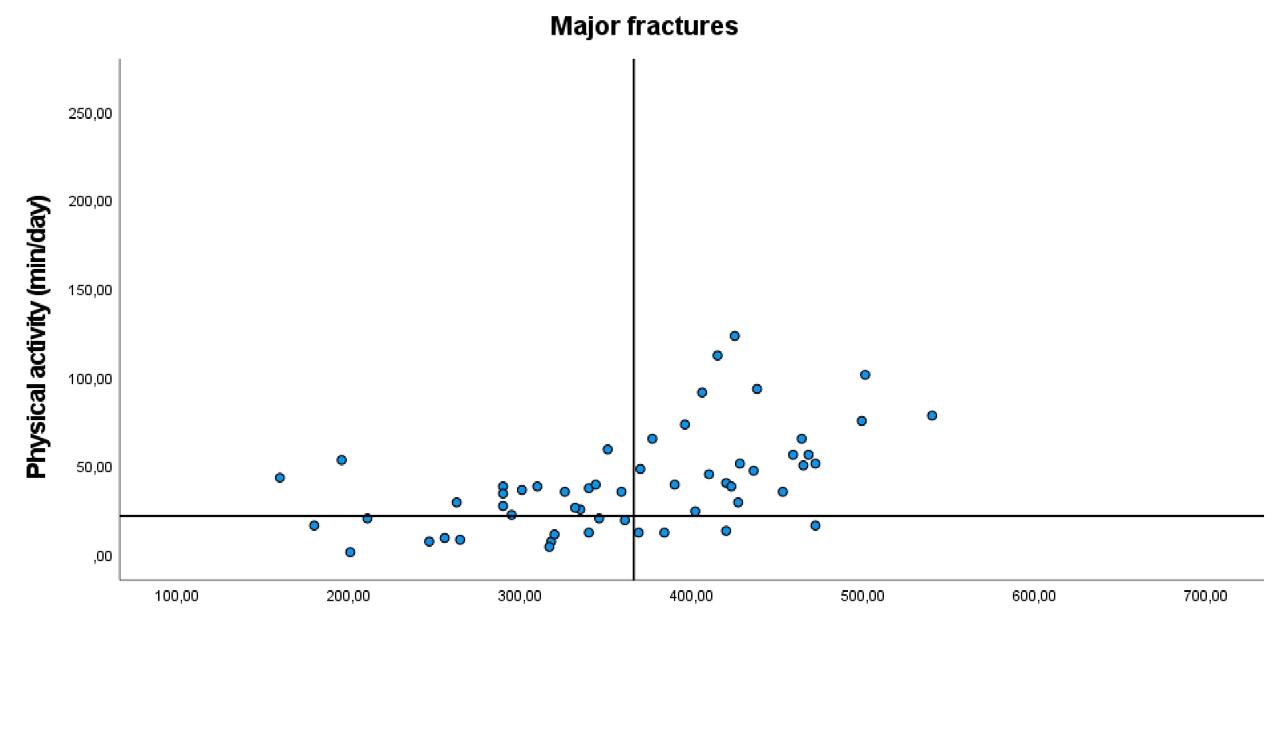
Can’t do, do do (28.6%) Can do, do do (42.9%)
Can’t do, don’t do ( 21.4%)
Can do, don’t do (7.1%)
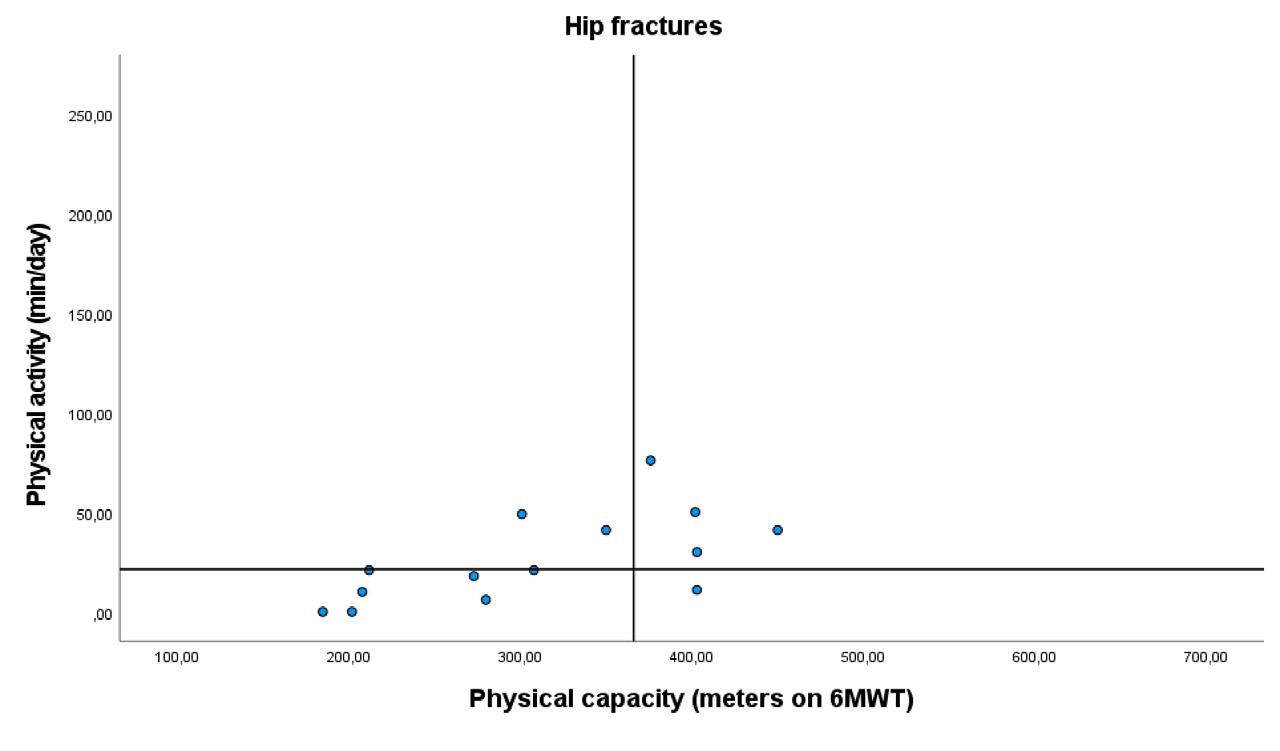
Can’t do, do do (14.3%) Can do, do do (28.6%)
Can’t do, don’t do (50%) Can do, don’t do (7.1%) Can do, do do (76.5%)
Supplemental figure 1A-C. Overview of PC-PA quadrant framework for women stratified by fracture type
Chapter 5 Supplementary material
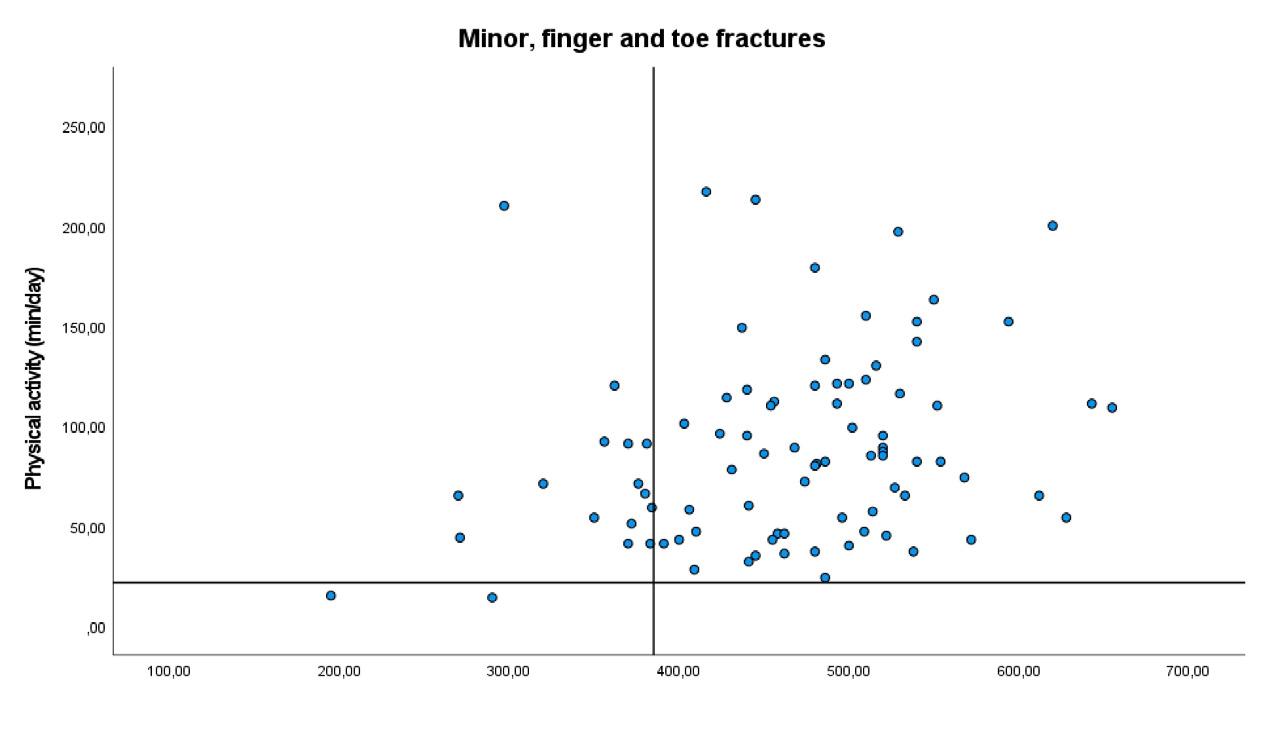
Can’t do, do do (17.2%)
Can do, do do (80.5%)
Can’t do, don’t do (2.3%)
Can’t do, do do (25%)
Can do, don’t do (0%)
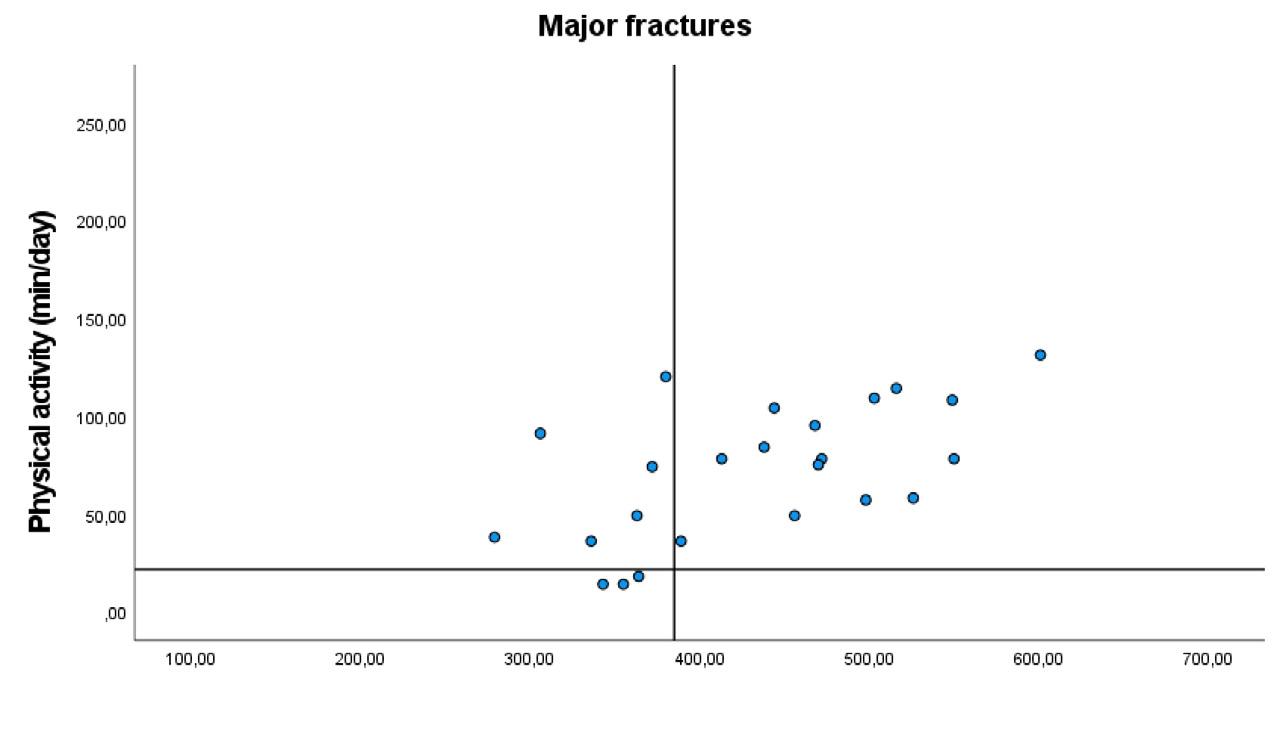
Can’t do, don’t do (12.5%)
Can’t do, do do (50.0%)
Can do, do do (62.5%)
Can do, don’t do (0%)
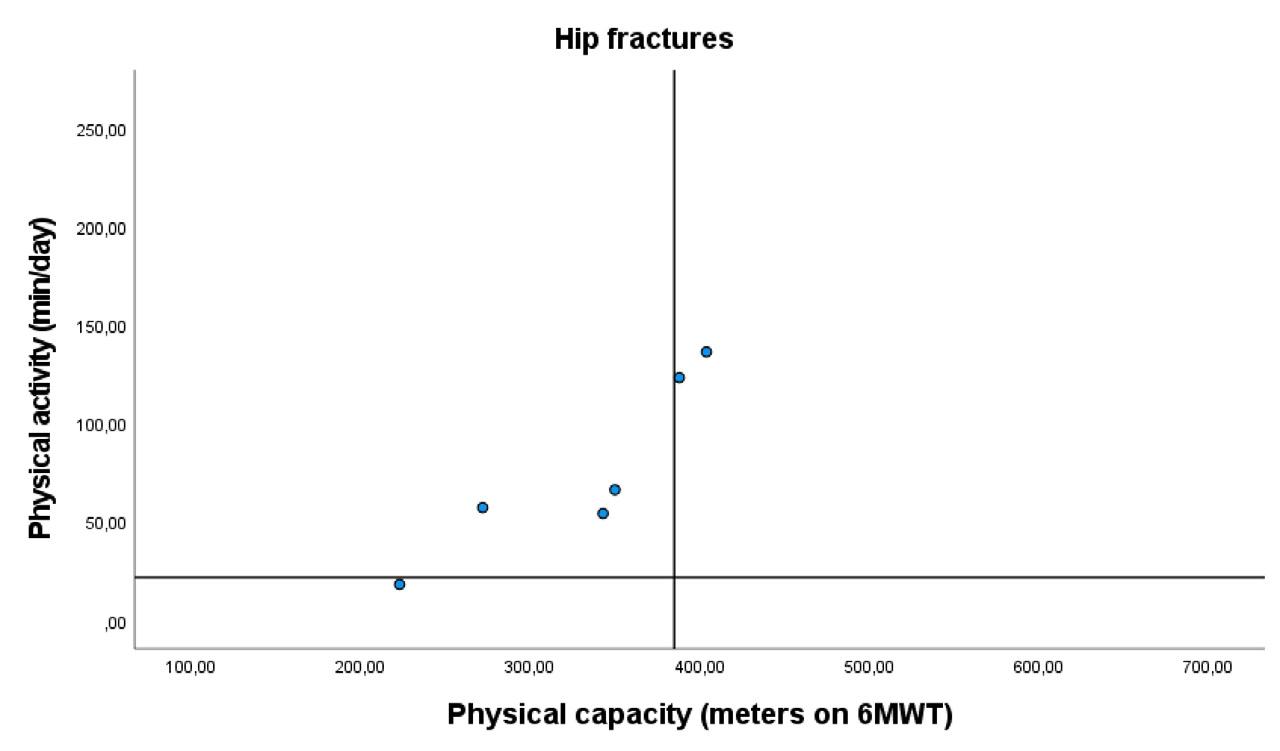
Can’t do, don’t do (16.7%)
Can do, do do (33.3%)
Can do, don’t do (0%)
Supplemental figure 2A-C. Overview of PC-PA quadrant framework for men stratified by fracture type
The “can do, do do” framework applied to assess the association between physical capacity, physical activity and prospective falls, subsequent fractures, and mortality in patients visiting the fracture Liaison service
M.R. Schene, C.E. Wyers, J.H. M. Driessen, L. Vranken, K. Meijer, J.P. van den Bergh and H.C. Willems
Journal of Personalized Medicine 2024, 14, 337
The “can do, do do” framework combines measures of poor and normal physical capacity (PC, measured by a 6 min walking test, can do/can’t do) and physical activity (PA, measured by accelerometer, do do/don’t do) into four domains and is able to categorize patient subgroups with distinct clinical characteristics, including fall and fracture risk factors. This study aims to explore the association between domain categorization and prospective fall, fracture, and mortality outcomes. This 6-year prospective study included patients visiting a Fracture Liaison Service with a recent fracture. Outcomes were first fall (at 3 years of follow-up, measured by fall diaries), first subsequent fracture, and mortality (at 6 years). Cumulative incidences of all three outcomes were calculated. The association between domain categorization and time to the three outcomes was assessed by uni- and multivariate Cox proportional hazard analysis with the “can do, do do” group as reference. The physical performance of 400 patients with a recent fracture was assessed (mean age: 64 years; 70.8% female), of whom 61.5%, 20.3%, and 4.9% sustained a first fall, sustained a subsequent fracture, or had died. Domain categorization using the “can do, do do” framework was not associated with time to first fall, subsequent fracture, or mortality in the multivariate Cox regression analysis for all groups. “Can’t do, don’t do” group: hazard ratio [HR] for first fall: 0.75 (95% confidence interval [CI]: 0.45–1.23), first fracture HR: 0.58 (95% CI: 0.24–1.41), and mortality HR: 1.19 (95% CI: 0.54–6.95). Categorizing patients into a two-dimensional framework seems inadequate to study complex, multifactorial outcomes. A personalized approach based on known fall and fracture risk factors might be preferable.
The “can do, do do” framework and prospective falls, subsequent fractures, and mortality
The global burden of disease of fractures is high. About 50% of females and 20% of males are estimated to sustain a fracture after their 50th life year.1 In the European Union, the number of fragility fractures alone (e.g., fractures due to osteoporosis) was estimated to be 4.3 million in 2019, resulting in a total cost of EUR 56.9 billion, and it is expected to rise in the future.2 Fractures are associated with short- and long-term disability and a decrease in quality of life.2 Fracture patients have a high imminent risk of falls, subsequent fractures, and mortality.3 Therefore, adequate and early secondary fall and fracture prevention is essential to lower the risk of subsequent falls, fractures, and mortality post-fracture.4, 5 The Fracture Liaison Service (FLS) is the recommended organizational approach for fracture prevention in terms of (cost-)effectiveness.6–8 At the FLS, personal risk factors are evaluated, including causes of osteoporosis, comorbidities, and medication use. FLS care ideally includes a fall assessment.4 In FLS patients, approximately 80% of subsequent fractures are fallrelated.9 The majority of falls in older persons occur during mobility tasks, such as walking, and most falls are caused by slips and trips.10, 11 An evaluation of physical performance including mobility tasks is therefore an essential part of fall risk evaluation.12 The “can do, do do” framework is a recent approach for an integrated assessment of physical performance. It combines two distinct, yet related, domains of physical performance: physical capacity (PC; can do, can’t do) and physical activity (PA; do, do, don’t do) into four quadrant groups.13, 14 PC is objectively measured physical performance; in the “can do, do do” framework, the 6 min walking test (6MWT) is used to test walking ability.13, 15 Impaired walking ability (e.g., abnormalities in gait or balance) has been associated with future falls12, 16–19 and fractures and post-fracture mortality (in males).20, 21 PA is defined as “any bodily movement produced by skeletal muscles that results in energy expenditure”, and is measured by an accelerometer.13, 22 PA might protect or expose (due to higher exposure to risk) persons to falls.23–26 In fact, some studies found a U-shaped association with both inactive and highly active adults at increased fall risk.26 The “can do, do do” framework has proven to be a useful and practical tool to identify patient subgroups with distinct clinical characteristics.13, 15, 27, 28 In patients with COPD, a preserved PC was found to be associated with a lower 6-year mortality risk compared to decreased PC, regardless of PA level.29 A recent study in patients with a fracture showed that the framework was able to categorize patient groups in terms of fall and fracture risk factors, such as fall history, fear of falling, type of fracture, and osteoporosis.15
Thus, for fracture patients the “can do, do do” framework could possibly be of value to test physical performance in the context of future falls in order to guide personalized exercise interventions. However, the prospective application of the “can do, do do” framework to assess associated clinical outcomes is
scarce. The aim of our study was to explore the association between domain categorization and future falls, subsequent fractures, and all-cause mortality in patients visiting an FLS.
Materials and methods
Study population
This study used data from the FX MoVie study, a 3-year prospective cohort study of patients visiting the FLS of VieCuri Medical Center in the south of the Netherlands. The cohort was established as follows: 1. All patients who visited the emergency room with a recent clinical fracture were invited to the FLS by a nurse specialized in osteoporosis, according to the Dutch guidelines for osteoporosis and fracture prevention.30 Patients with a radiologically confirmed fracture, aged 50–90 years old, and living in the referral area of the hospital were invited. Patients with fractures due to high-energy trauma, osteomyelitis, or bone metastasis and patients concurrently treated for a malignancy were not invited. 2. All patients attending the FLS for fracture risk evaluation between July 2014 and June 2016 were asked to participate in the FXMoVie study. Patients with cognitive impairment, patients with peri-prosthetic fractures, and non-Caucasians were excluded from participation in the prospective study cohort (FXMoVie). Prior to participation, patients were given study information through oral and written communication, and all participants gave written informed consent. The study protocols were approved by a medical ethical committee (NL45707.072.13 and 2022-3319). For this study, patients with missing scores in the PC or PA data were excluded from the analyses.
During the FLS visit, sex and demographics were collected for all patients. Cause of the fracture and risk factors for fractures and falls were evaluated by a detailed questionnaire according to the Dutch guidelines for osteoporosis and fracture prevention.30 This included self-reported measures on smoking and alcohol use, fall history, dizziness and balance problems, fear of falling, and use of walking aids. Information on comorbidities was derived from the electronic patient files and labeled according to ICD-10 (international classification of disease) standards.31 Index fracture location was grouped into: I. hip fractures; II. major fractures: vertebra, multiple rib, humerus, pelvis, distal femur, and proximal tibia; and III. minor fractures: all other fractures (including finger and toe fractures), according to Center et al.32 Measurements included height, weight, body mass index (BMI), and bone mineral density (BMD) measurement at the lumbar spine, total hip, and femoral neck, and vertebral fracture assessment was performed using dual-energy X-ray absorptiometry
The “can do, do do” framework and prospective falls, subsequent fractures, and mortality
(DEXA). Anti-osteoporotic treatment (AOM; e.g., bisphosphonates, denosumab, or teriparatide) was started according to the Dutch guidelines for osteoporosis and fracture prevention - in summary: in case of T score ≤ −2.5, or in case of osteopenia with at least one Grade 2 or 3 prevalent vertebral fracture according to Genant et al.33
The “can do, do do” framework and our methods of testing PC and PA have been previously described elsewhere in detail.15 In short, the framework combines a measure of PC with a measure of PA to form four quadrant groups: 1. preserved PC, preserved PA (can do, do do); 2. low PC, preserved PA (can’t do, do do); 3. preserved PC, low PA (can do, don’t do); 4. low PC, low PA (can’t do, don’t do). PC was measured by a trained nurse at the baseline study visit with the 6MWT. The 6MWT assesses walking ability and overall physical performance and has excellent inter-rater and test–retest reliability.34, 35 Patients were asked to walk as far as possible, up and down a 10 m walkway, rest when needed, and the use of walking aids was permitted. No encouragements were given during the test. Sex-stratified cutoff scores for poor or normal performance were based on Beekman et al. and amounted to a cutoff at 385 m for males and 366 m for females.36 PA was measured by the MOX activity monitor (Maastricht Instruments B.V., The Netherlands). The MOX is a small, waterproof device that was attached to the right thigh. PA was measured during eight consecutive days in which patients were asked to follow normal daily activity routines. Details on the properties, processing of data, activity classification, calibration, and validity are described in detail elsewhere.15, 37, 38 Static and dynamic activity (DA) were determined using the signal magnitude area: a measure of the intensity of physical activity. DA (average minutes per day) was further categorized as low physical activity (LPA, < 3 metabolic equivalents [METS]), moderate-tovigorous physical activity (MVPA, 3-6 METS), and vigorous physical activity (VPA, > 6 METS),38 and the threshold for poor or normal PA was defined according to WHO recommendations on minimum weekly exercise for general health benefits at < 150 min of MVPA/VPA per week.39
The outcomes were time to fall, time to first subsequent fracture, and time to death (by any cause). Registration of falls, subsequent fractures, and mortality started after inclusion in the study (baseline), a mean ± SD 3.5 of ± 0.99 months after the index fracture. Initial prospective follow-up of participants was three years. A fall was defined according to the WHO definition as “an event which results in a person coming to rest inadvertently on the ground or floor or other lower level”.40 Falls were recorded by participants in weekly fall diaries, which were returned by postal service. Research assistants verified and checked
the diaries for completeness at three and six months by telephone and during the regular study visits at one, two, and three years of follow-up. Subsequent fracture incidence and mortality were evaluated at the yearly study visits at one, two, and three years of follow-up. All subsequent fractures were radiologically confirmed by radiology reports. All reported vertebral fractures were clinical vertebral fractures, as throughout follow-up no routine imaging of the spine was performed. The follow-up period for the outcomes of subsequent fractures and mortality was extended until 6 years after index fracture for all patients. Fall data were not available for the period between 3 and 6 years of follow-up.
Descriptive analyses were performed for the whole population and predefined quadrant groups separately. Continuous data are presented as mean and SD for normally distributed data and median and IQR for non-normally distributed data. Categorical data are presented as frequencies and percentages. Cumulative incidences of first fractures, first falls, and mortality were assessed at 1, 2, 3 (fractures, mortality, falls), and 6 years (only fractures and mortality) of follow-up for the total population and the different “can do, do do” quadrants. Outcomes were also stratified by sex and compared using chi-square or Fisher exact tests in cases of low expected counts. Cox proportional hazard regression models were used to calculate crude and adjusted hazard ratios and 95% CIs for first subsequent fractures, first falls, and mortality for the different “can do, do do” quadrants. The “can do, do do” group was used as the main reference category, but all other between-group comparisons were also carried out. Patients were followed from baseline to censoring: outcome of interest (i.e., first fall, first fracture, or death), or end of data collection, whichever came first. For the outcome “fall” and “fracture”, patients were censored in case of death during follow-up. For the outcome “fall”, censoring was also applied if the patient was lost to follow-up (defined as the moment when >1 week of fall data were missing). Multivariate models were adjusted for a predefined set of variables based on the literature, including age, sex (all outcomes), BMI, lowest BMD, and vertebral fractures (only for fracture outcome). Proportional hazards assumption was checked by visual assessment of LML plots and by performing time program functions with all quadrants and all covariables independently. Additional analyses included Cox proportional hazards regression in which PC and PA were entered as continuous variables, as well as their interaction term. As a sensitivity analysis, a competing risk analysis was performed using the cumulative incidence competing risk method, according to Fine and Grey,41 in which death was considered a competing risk for the outcome of first fall or fracture. However, only one death occurred during the first 3 years of followup, which was censored due to incomplete fall data of the patient. Composite endpoints at 3 years (all outcomes) and 6 years (fractures and mortality) were explored visually and compared between the poor and normal PC and PA groups
The “can do, do do” framework and prospective falls, subsequent fractures, and mortality
and for the patients in the 1st quartile of PC and PA compared to the highest three quartiles. A p-value of < 0.05 was considered statistically significant. The competing risk analysis for the outcome of first fracture was carried out in R statistical software (version 4.2.1, R Core Team, 2022, R Foundation for Statistical Computing, Vienna, Austria), and R studio (RStudio Team, 2020, RStudio: Integrated Development for R. RStudio, PBC, Boston, MA) using the “cprsk” package. All other statistical analyses were performed in SPSS (version 28, 2021, IBM SPSS Statistics for Windows, Armonk, NY: IBM Corp.)
Results
Baseline characteristics
Baseline characteristics are presented in Table 1. Participants were unequally divided into groups, with the largest proportion of 69.5% of the participants included in the “can do, do do” group, and smaller proportions in the other groups: 19.3% in the “can’t do, do do”, 3.0% in the “can do, don’t do”, and 8.3% in the “can’t do don’t do” group (p < 0.001).
Participants in the “can do, do do” group were younger, had less severe fracture types, had less often osteoporosis or a prevalent vertebral fracture and had a treatment indication for AOM less often, had fewer comorbidities and fewer fall risk factors including fear of falling, and higher scores on the physical performance tests.
A total of five male patients and seven female patients had > 1% missing fall data and were excluded from the cumulative incidence analyses. Table 2 shows the cumulative incidence of first fractures, first falls, and mortality during follow-up, stratified by year of follow-up and sex.
Time to first fall
In total, 61.5% of the participants with sufficient fall data (N = 388) experienced at least one fall during follow-up of 3 years (Table 2). No significant association was found between quadrant groups and time to first fall during the 3 years of follow-up in the uni- and multivariate analysis (Table 3). Between-group comparison using alternative reference groups also did not show significant associations. A sensitivity analysis using dichotomous outcomes - “can do” vs. “can’t do” and “do do” vs. “don’t do” - did not show significant associations of low PC or low PA with time to first fall.
Table 1. Baseline characteristics
(Av. min/day)
6MWD (m) a
(364.3–489.8)
(420–510)
a Continuous variable: mean ± SD, median (IQR); b categorical variable: number (%). AOM: anti-osteoporotic medication, BMI: body mass index, BMD: bone mineral density, 6MWD: six-minute walking distance, MVPA: moderate-to-vigorous physical activity, VF: vertebral fracture, VPA: vigorous physical activity, Av.: average. The cutoff for low physical capacity is 366 m for females and 385 for males (can’t do), the cutoff for low physical activity is an average 21 min/day (don’t do). * statistically significant difference between groups.
The “can do, do do” framework and prospective falls, subsequent fractures, and mortality
Table 2. Cumulative incidence of first fractures, first falls, and mortality.
All cumulative incidences are presented as numbers (%). The cutoff for low physical capacity is 366 m for females and 385 for males (can’t do), the cutoff for low physical activity is an average of 21 min/day (don’t do). † Twelve participants were excluded due to >1% missing fall data. * Statistically significant at p < 0.05.
Table 3. Association of “can do, do do” groups with falls, subsequent fractures, and mortality. Time to First Fall Time to First Subsequent Fracture
Can do, do do (ref)
Can’t do, do do
Can do, don’t do
(0.71, 1.38)
(0.41, 1.88)
(0.70, 1.39)
(0.39, 1.78)
Can’t do, don’t do 0.76 (0.47, 1.24) 0.75 (0.45, 1.23)
(0.48, 1.53)
(0.05, 2.48)
(0.37, 2.04)
(0.43, 1.48)
(0.04, 1.84)
(0.24, 1.41)
(1.19, 9.07) *
(0.53. 4.56)
(1.33, 4.62) *
(0.54, 6.95)
Time to first fall was assessed during 3 years of follow-up; time to first subsequent fracture and death was assessed during 6 years of follow-up. HR: hazard ratio. 95% CI: 95% confidence interval. Multivariate models included the following covariates: First falls: age and sex. First subsequent fractures: age, sex, BMI, prevalent VFs, and lowest BMD. Mortality: age and sex. * Statistically significant compared to reference group “can do, do do” at p < 0.05. Between-group comparisons with different reference groups did not yield significant results.
Time to first subsequent fracture
In total, 20.3% of the participants had sustained a first subsequent fracture at 6-year follow-up (Table 2). No significant association was found between each of the quadrant groups and time to first subsequent fracture during the 6 years of follow-up (Table 3), nor in the between-group analyses. The sensitivity analyses with death considered as a competing risk did not show a significant association. Sensitivity analysis using the dichotomous outcomes “can do” vs. “can’t do” and “do do” vs. “don’t do” and continuous outcomes of PC and PA measures did not show a significant association with time to first fracture.
to death
During 6 years of follow-up, 4.8% of the participants had died. The proportion of participants that died was significantly different between quadrant groups at six years of follow-up: “can do, do do”: 2.9%, “can’t do, do do”: 9.1%, “can do, don’t do”: 0%, and “can’t do, don’t do”: 12.1% (p = 0.019, Table 2). Compared to the reference group, the “can’t do, do do” quadrant group was also significantly associated with time to death during 6 years of follow-up in the univariate analysis for the “can’t do, do do” group: HR = 3.29 (95% CI 1.19–9.07) and the “can’t do, don’t do” group: HR = 4.40 (95% CI 1.33–14.62). However, this association did not remain significant in the multivariate analysis (Table 3), nor did any of the between-group analyses yield significant results. A sensitivity analysis using the dichotomous outcomes “can do” vs. “can’t do” and “do do” vs. “don’t do” showed a significant association between the “can’t do” group: HR = 3.73 (95%CI 1.50–9.28) with time to first fracture compared to the “can do” group in univariate analysis, but this association did not remain significant in the multivariate analysis adjusted for age and sex: HR = 1.75, (95% CI 0.65–4.70).
The visualization of composite endpoints are presented in Figures 1A–D and 2A–D. Figure 1A–D displays the outcome of the composite endpoints falls, fractures, and mortality at 3 years of follow-up for the “can do” and the “can’t do” groups and the “do do “and “don’t do” groups, respectively. Figure 2A–D displays the outcome of the composite endpoints of fractures and mortality at 6 years of follow-up for the “can do” and the “can’t do” groups and the “do do “and “don’t do” groups, respectively. For both endpoints, the composite outcomes did not differ between groups. Quadrant group categorization based on quartile distribution of PC and PA measures instead of categorization based on predefined thresholds did not show differences in composite endpoint visualization.
The “can do, do do” framework and prospective falls, subsequent fractures, and mortality
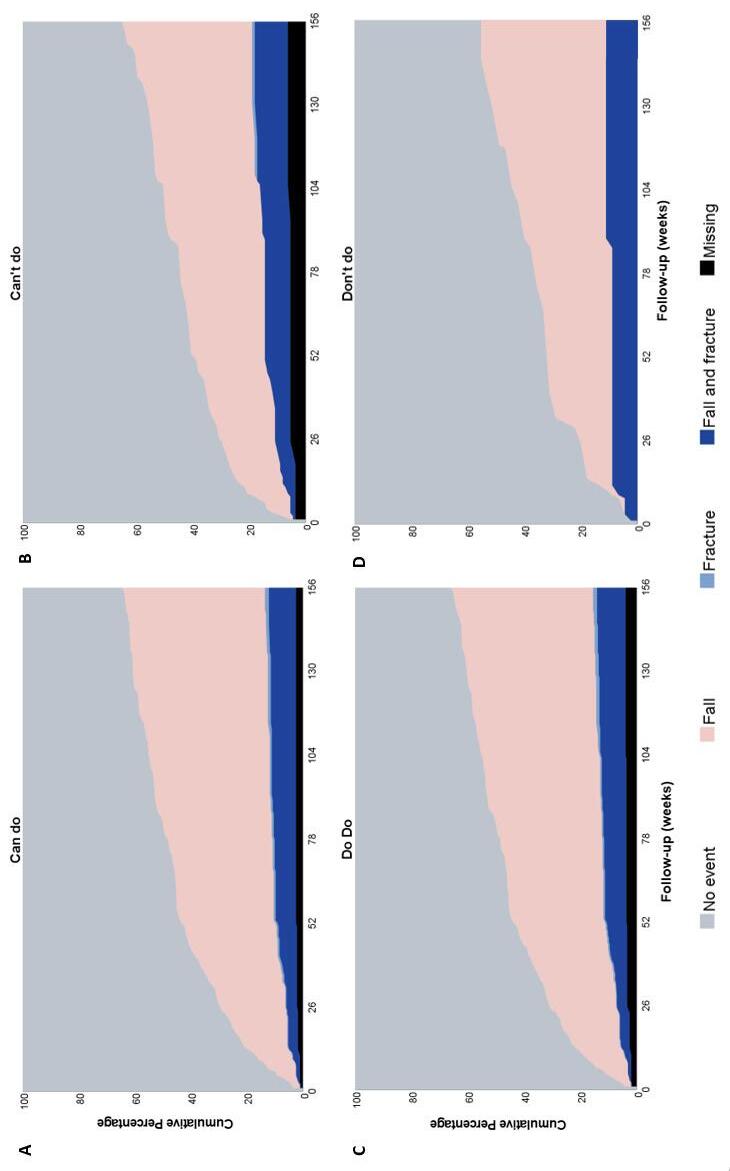
Figure 1. Composite endpoints during three years of follow-up. (A–D) Visualization of composite endpoints falls and fractures during 3 years of follow-up (in weeks) for normal and poor physical capacity and activity groups. The cutoff for low physical capacity is 366 m for females and 385 for males (can’t do); the cutoff for low physical activity is an average of 21 min/day (don’t do).
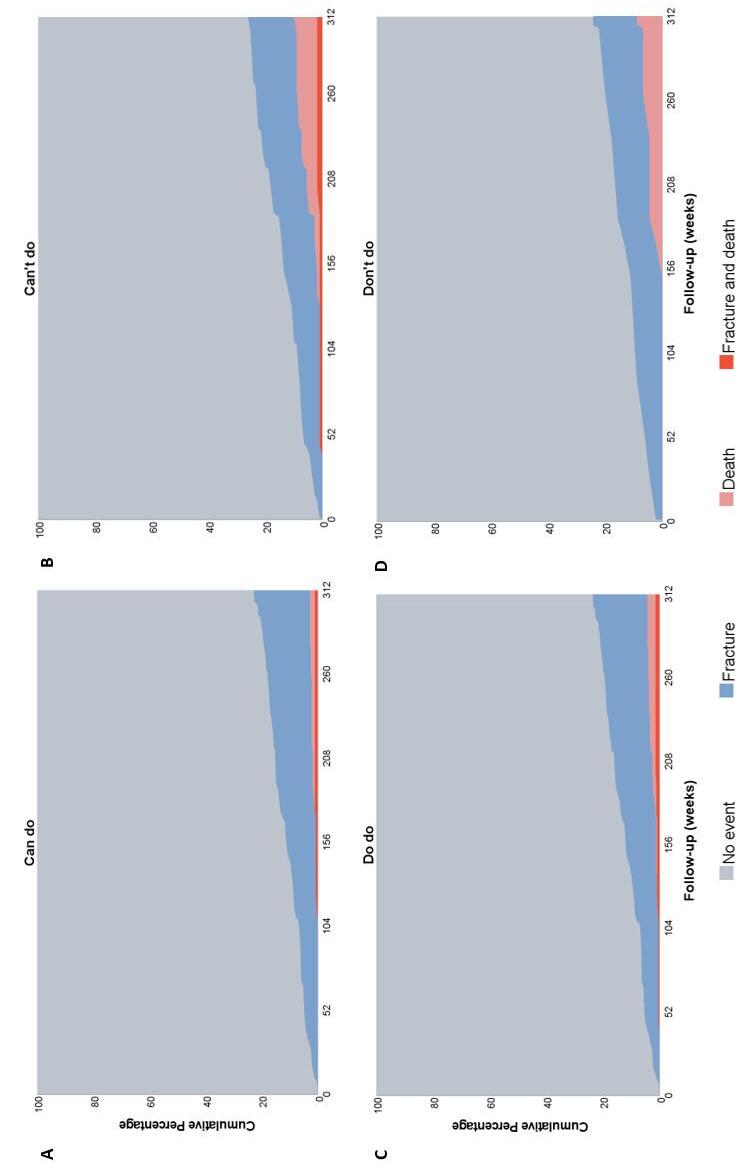
Figure 2. Composite endpoints during six years of follow-up. (A–D) Visualization of composite endpoints fractures and mortality during 6 years of follow-up (in weeks) for normal and poor physical capacity and activity groups. The cutoff for low physical capacity is 366 m for females and 385 for males (can’t do), the cutoff for low physical activity is an average of 21 min/day (don’t do).
The “can do, do do” framework and prospective falls, subsequent fractures, and mortality
In this prospective study of 400 patients visiting a FLS with a recent fracture, we did not find a significant association between physical performance at 3, 5 months after fracture, assessed with the “can do, do do” framework, and time to first fall, first fracture, or death. A previous cross-sectional assessment of the “can do, do do” framework showed differences in fall and fracture risk factors between the quadrant groups; patients in the can’t do, don’t do” group were older; presented with more major index fractures; more often had osteoporosis, prevalent vertebral fractures, and comorbidities; scored lower on all physical performance tests; and more often used a walking aid.15 Contrarily, our study did not show an association with the clinically relevant outcomes of first fall (at three years), first fracture, and mortality (at six years). Our results are also in contrast with studies in the general older population associating poor physical performance (including both PC and PA measures) with future falls,12, 25 subsequent fractures,42–44 and mortality.39, 45–48 Studies in fracture populations are fewer in number, but several involving older individuals with hip, radius, or any low-trauma fracture have reported associations between poor PC (using balance and gait measures) and falls49–52 and post-fracture mortality in older males.52 Poor PA has been associated with subsequent fractures in older males,53, 54 but not females,55 after fracture. Interestingly, one study reported that males with a recent fracture who sustained a subsequent fracture had higher PA and gait speed measures compared to those who did not sustain a subsequent fracture.52 This suggests that they may be more likely to engage in risky behavior. However, comparability between the studies in fracture patients is low, as they differ in terms of the age and sex of the included population, index fracture type, timing of the measurement before or after fracture, and measurement method of PC (different performance tests were evaluated) and PA (mostly self-reported with questionnaire).52, 54 Only one study previously explored the “can do, do do” framework prospectively. Vaes et al. explored mortality risk in the different quadrant groups in patients with COPD29 and found that patients with preserved PC had significantly lower 6-year mortality risk than those with poor PC (HR = 0.36, 95% CI; 0.14–0.93). In our study, PC (can do vs. can’t do) was associated with mortality in the univariate but not multivariate analysis. However, in the study by Vaes et al. the threshold values were study population driven and not based on pre-determined cutoff scores for poor or normal PC and PA. The lack of association with mortality outcomes in our study might be explained by the low mortality incidence during follow-up. The survival of 95.5% was the same as the 6-year survival of 65-year-olds in the general Dutch population (95.8%),56 indicating a healthy subset of fracture patients, who generally have an increased mortality risk.3 The absence of associations in our study might also be attributed to the unequal distribution of participants in the framework that resulted in a small
number of participants included in the “can do, don’t do” and “can’t do, don’t do” groups. This was partly due to the low proportion of patients with low PA. The use of predefined cutoff scores for poor and normal PA (<150 min/week and 21/min per day MVPA/VPA) was based on the WHO recommendation to prevent adverse health outcomes, such as falls and fall-related injuries and all-cause and cause-specific mortality.39, 57 These are in line with other cutoff scores: < 25.1 min MVPA/day was associated with a higher fall risk in older (70+) females58; and in community-dwelling older males, those with a history of >2 falls had an average of 24 min MVPA/day compared to 40 min/day in non-fallers.59 In our study, the assessment of composite endpoints using the quartile distribution (instead of predefined cutoff scores) did not show superior discrimination between groups. Thus, the chosen cutoff scores do not seem to have had a great influence on the absence of an association.
More likely, our study population is too homogeneous, as it consists primarily of individuals who have sustained a fracture and are nearly all “previous fallers”. In 86.5% of our study population, the fracture that led to FLS evaluation was caused by a fall, and this did not vary between quadrant groups. Patients with a recent fracture are at a high risk for subsequent falls and fractures, with 38% of our participants experiencing a fall in the first year and 60% in the first three years, and 21% sustaining a subsequent fracture during six years of followup, despite evaluation and treatment according to best practice standards. These incidences did not differ between quadrant groups. Therefore, our study suggests that measures of PC and PA, measured during the FLS visit, do not differentiate enough between patients with a recent fracture to show any association with the clinical outcomes of falls, fractures, and mortalitya conclusion that was also suggested in a previous study assessing physical performance and subsequent fracture risk.52
To effectively evaluate the likelihood of future fractures, it is crucial to assess fall risk factors, as falls are a significant predictor. A comprehensive review of the World Falls Guidelines emphasized the multifactorial nature of fall prediction and concluded that no single measurement can guarantee a high level of confidence in fall risk assessment for older adults. The review recommended both balance and gait assessments in fall prediction.12,17 They further underlined that mobility assessment is only one part of fall prediction, and many other factors (e.g., fall-risk-increasing drugs, cardiovascular management, and cognitive function and sensory function decline) are also important.12 Consequently, fall prediction and prevention is highly personalized. Interventions, including physical performance interventions, need to target multiple domains and need to be tailored to the patients’ needs.12, 60, 61 Our study underlines this; even though the “can do, don’t do” framework offers a more complex approach compared to single physical function tests, this framework remains on one hand too “simplistic” to capture the multifactorial causes of falls and fractures. On the other hand, in testing and constructing combined
The “can do, do do” framework and prospective falls, subsequent fractures, and mortality
measures, we lose information for a tailor-made, individual evaluation of different physical performance domains and corresponding treatment options. Thus, the categorization into a two-dimensional framework is inadequate to study complex clinical outcomes such as falls, fractures, and death, and a personalized approach based on existing fall and fracture risk factors from international guidelines4, 12 seems preferable.
One of the key strengths of our study is the inclusion of a sizable cohort of patients who had recently experienced a fracture, along with the examination of three clinically relevant outcomes. Secondly, this study is one of the first to assess physical performance in fracture patients in terms of clinical outcomes. Another strength is that we used a competing risk analysis to check the robustness of our results. Failure to adjust for the competing risk of death would result in an overestimation of the risk of outcome.41 However, several limitations apply to this study. First, this was an explorative study and results will have to be confirmed in other prospective studies. Second, as stated, our cohort is relatively healthy compared to the wider range of fracture patients presenting at the Emergency Room, which might be reflected in the low number of patients with poor PA. The fracture patients that visit the FLS are only 60% of all consecutive patients with a clinical fracture,15 and previous studies showed that those who visit the FLS are more often female, younger, less frail, and less likely to have a hip fracture compared to those who do not attend.62, 63 Moreover, the participation in this prospective study was voluntary, and mostly younger patients with less severe types of fracture were willing and able to participate. The low incidence of mortality results in a lower reliability for this outcome, limited options of covariables in the multivariable models, and limited added benefit of the competing risk analysis. Lastly, we did not account for changes in physical performance parameters and patients’ exercise and rehabilitation activities during follow-up. Some studies suggest that the patients’ change in physical performance over time is equally, if not more, important to predict falls, fractures, and mortality as single test values.42, 52 Future studies should assess the association between physical performance measures and fall, subsequent fracture, and mortality risk in larger cohorts of fracture patients, and assess changes in performance over time.
The “can do, do do” framework was not associated with time to fracture, time to fall, or time to death in a 6-year prospective study. This study suggests that categorizing patients into a two-dimensional framework is inadequate to study complex, multifactorial outcomes and that a personalized approach
based on individual assessment of existing fall and fracture risk factors might be preferable.
The “can do, do do” framework and prospective falls, subsequent fractures, and mortality
1. van Staa TP, Dennison EM, Leufkens HG, et al. Epidemiology of fractures in England and Wales. Bone. 2001;29:517-522.
2. Kanis JA, Norton N, Harvey NC, et al. SCOPE 2021: a new scorecard for osteoporosis in Europe. Arch Osteoporos. 2021;16:82.
3. Schene MR, Wyers CE, Driessen AMH, et al. Imminent fall risk after fracture. Age Ageing. 2023;52:afad201.
4. Javaid MK, Sami A, Lems W, et al. A patient-level key performance indicator set to measure the effectiveness of fracture liaison services and guide quality improvement: a position paper of the IOF Capture the Fracture Working Group, National Osteoporosis Foundation and Fragility Fracture Network. Osteoporos Int. 2020;31:1193-1204.
5. Li N, Hiligsmann M, Boonen A, et al. The impact of fracture liaison services on subsequent fractures and mortality: a systematic literature review and meta-analysis. Osteoporos Int. 2021;32:1517-1530.
6. Geusens P, Bours SPG, Wyers CE, et al. Fracture liaison programs. Best Pract Res Clin Rheumatol. 2019;33:278-289.
7. Ganda K. Fracture liaison services: past, present and future : Editorial relating to: The impact of Fracture Liaison Services on subsequent fractures and mortality: a systematic literature review and meta-analysis. Osteoporos Int. 2021;32:1461-1464.
8. Lems WF, Dreinhöfer KE, Bischoff-Ferrari H, et al. EULAR/EFORT recommendations for management of patients older than 50 years with a fragility fracture and prevention of subsequent fractures. Ann Rheum Dis. 2017;76:802-810.
9. Vranken L, Wyers CE, Van der Velde RY, et al. Association between incident falls and subsequent fractures in patients attending the fracture liaison service after an index fracture: a 3-year prospective observational cohort study. BMJ Open. 2022;12:e058983.
10. Boyé ND, Mattace-Raso FU, Van der Velde N, et al. Circumstances leading to injurious falls in older men and women in the Netherlands. Injury. 2014;45:1224-1230.
11. Berg WP, Alessio HM, Mills EM, et al. Circumstances and consequences of falls in independent community-dwelling older adults. Age Ageing. 1997;26:261-268.
12. Montero-Odasso M, van der Velde N, Martin FC, et al. World guidelines for falls prevention and management for older adults: a global initiative.
Age Ageing. 2022;51:afac205.
13. Koolen EH, van Hees HW, van Lummel RC, et al. "Can do" versus "do do": A Novel Concept to Better Understand Physical Functioning in Patients with Chronic Obstructive Pulmonary Disease. J Clin Med. 2019;8:
14. van Lummel RC, Walgaard S, Pijnappels M, et al. Physical Performance and Physical Activity in Older Adults: Associated but Separate Domains of Physical Function in Old Age. PLoS One. 2015;10:e0144048.
15. Schene MR, Meijer K, Cheung D, et al. Physical Functioning in Patients with a Recent Fracture: The "Can Do, Do Do" Framework Applied to Explore Physical Capacity, Physical Activity and Fall Risk Factors. Calcif Tissue Int. 2023;113:195–206.
16. Lusardi MM, Fritz S, Middleton A, et al. Determining Risk of Falls in Community Dwelling Older Adults: A Systematic Review and Meta-analysis Using Posttest Probability. J Geriatr Phys Ther. 2017;40:1-36.
17. Beck Jepsen D, Robinson K, Ogliari G, et al. Predicting falls in older adults: an umbrella review of instruments assessing gait, balance, and functional mobility. BMC Geriatr. 2022;22:615.
18. Ganz DA, Bao Y, Shekelle PG, et al. Will my patient fall? Jama. 2007;297:77-86.
19. Cöster ME, Karlsson M, Ohlsson C, et al. Physical function tests predict incident falls: A prospective study of 2969 men in the Swedish Osteoporotic Fractures in Men study. Scand J Public Health. 2020;48:436-441.
20. Alajlouni DA, Bliuc D, Tran TS, et al. Muscle strength and physical performance contribute to and improve fracture risk prediction in older people: A narrative review. Bone. 2023;172:116755.
21. Alajlouni D, Tran T, Bliuc D, et al. Muscle Strength and Physical Performance Improve Fracture Risk Prediction Beyond Garvan and FRAX: The Osteoporotic Fractures in Men (MrOS) Study. J Bone Miner Res. 2021;
22. Caspersen CJ, Powell KE, Christenson GM. Physical activity, exercise, and physical fitness: definitions and distinctions for health-related research. Public Health Rep. 1985;100:126-131.
23. Heesch KC, Byles JE, Brown WJ. Prospective association between physical activity and falls in community-dwelling older women. J Epidemiol Community Health. 2008;62:421-426.
24. Klenk J, Kerse N, Rapp K, et al. Physical Activity
6 and Different Concepts of Fall Risk Estimation in Older People--Results of the ActiFE-Ulm Study. PLoS One. 2015;10:e0129098.
25. Sherrington C, Fairhall N, Kwok W, et al. Evidence on physical activity and falls prevention for people aged 65+ years: systematic review to inform the WHO guidelines on physical activity and sedentary behaviour. Int J Behav Nutr Phys Act. 2020;17:144.
26. Lu Z, Lam FMH, Leung JCS, et al. The U-Shaped Relationship Between Levels of Bouted Activity and Fall Incidence in Community-Dwelling Older Adults: A Prospective Cohort Study. J Gerontol A Biol Sci Med Sci. 2020;75:e145-e151.
27. Carl J, Schultz K, Janssens T, et al. The "can do, do do" concept in individuals with chronic obstructive pulmonary disease: an exploration of psychological mechanisms. Respir Res. 2021;22:260.
28. Janssen SMJ, Spruit MA, Antons JC, et al. "Can Do" Versus "Do Do" in Patients with Asthma at First Referral to a Pulmonologist. J Allergy Clin Immunol Pract. 2021;9:1278-1284.
29. Vaes AW, Spruit MA, Koolen EH, et al. "Can Do, Do Do" Quadrants and 6-Year All-Cause Mortality in Patients With COPD. Chest. 2022;1494-1504.
30. Dutch Institute for Healthcare Improvement CBO. Richtlijn Osteoporose en Fractuurpreventie, Derde Herziening [Dutch] Dutch Institute for Healthcare Improvement CBO, Utrecht, The Netherlands 2011.
31. World Health Organisation. ICD-10: international statistical classification of diseases and related health problems, Tenth revision. World Health Organisation, Geneva, Switzerland. 2004
32. Center JR, Nguyen TV, Schneider D, et al. Mortality after all major types of osteoporotic fracture in men and women: an observational study. Lancet. 1999;353:878-882.
33. Genant HK, Wu CY, van Kuijk C, et al. Vertebral fracture assessment using a semiquantitative technique. J Bone Miner Res. 1993;8:1137-1148.
34. Rikli RE, Jones CJ. The reliability and validity of a 6-minute walk test as a measure of physical endurance in older adults. Journal of aging and physical activity. 1998;6:363-375.
35. Overgaard JA, Larsen CM, Holtze S, et al. Interrater Reliability of the 6-Minute Walk Test in Women With Hip Fracture. J Geriatr Phys Ther. 2017;40:158-166.
36. Beekman E, Mesters I, Gosselink R, et al. The first reference equations for the 6-minute walk distance over a 10 m course. Thorax. 2014;69:867-868.
37. Bijnens W, Aarts J, Stevens A, et al. Optimization and Validation of an Adjustable Activity Classification Algorithm for Assessment of Physical
Behavior in Elderly. Sensors (Basel). 2019;19:5344.
38. van der Weegen S, Essers H, Spreeuwenberg M, et al. Concurrent validity of the MOX activity monitor compared to the ActiGraph GT3X. Telemed J E Health. 2015;21:259-266.
39. World Health Organization. WHO guidelines on physical activity and sedentary behaviour. World Health Organization, Geneva 2020.
40. World Health Organisation. Factsheet Falls. 2021 https://www.who.int/news-room/fact-sheets/ detail/falls Accessed may 17th 2021
41. Verduijn M, Grootendorst DC, Dekker FW, et al. The analysis of competing events like cause-specific mortality--beware of the Kaplan-Meier method. Nephrol Dial Transplant. 2011;26:56-61.
42. Barbour KE, Lui LY, McCulloch CE, et al. Trajectories of Lower Extremity Physical Performance: Effects on Fractures and Mortality in Older Women. J Gerontol A Biol Sci Med Sci. 2016;71:1609-1615.
43. Cawthon PM, Fullman RL, Marshall L, et al. Physical performance and risk of hip fractures in older men. J Bone Miner Res. 2008;23:1037-1044.
44. Harvey NC, Odén A, Orwoll E, et al. Measures of Physical Performance and Muscle Strength as Predictors of Fracture Risk Independent of FRAX, Falls, and aBMD: A Meta-Analysis of the Osteoporotic Fractures in Men (MrOS) Study. J Bone Miner Res. 2018;33:2150-2157.
45. Studenski S, Perera S, Patel K, et al. Gait speed and survival in older adults. Jama. 2011;305:50-58.
46. Yazdanyar A, Aziz MM, Enright PL, et al. Association Between 6-Minute Walk Test and AllCause Mortality, Coronary Heart Disease-Specific Mortality, and Incident Coronary Heart Disease. J Aging Health. 2014;26:583-599.
47. Veronese N, Stubbs B, Fontana L, et al. A Comparison of Objective Physical Performance Tests and Future Mortality in the Elderly People. J Gerontol A Biol Sci Med Sci. 2017;72:362-368.
48. Hirsch CH, Buzková P, Robbins JA, et al. Predicting late-life disability and death by the rate of decline in physical performance measures. Age Ageing. 2012;41:155-161.
49. Lloyd BD, Williamson DA, Singh NA, et al. Recurrent and injurious falls in the year following hip fracture: a prospective study of incidence and risk factors from the Sarcopenia and Hip Fracture study. J Gerontol A Biol Sci Med Sci. 2009;64:599-609.
50. Kristensen MT, Foss NB, Kehlet H. Timed "up & go" test as a predictor of falls within 6 months after hip fracture surgery. Phys Ther. 2007;87:24-30.
51. Dewan N, MacDermid JC, Grewal R, et al.
The “can do, do do” framework and prospective falls, subsequent fractures, and mortality
Risk factors predicting subsequent falls and osteoporotic fractures at 4 years after distal radius fracture-a prospective cohort study. Arch Osteoporos. 2018;13:32.
52. Alajlouni DA, Bliuc D, Tran TS, et al. Muscle Strength and Physical Performance Are Associated With Risk of Postfracture Mortality But Not Subsequent Fracture in Men. J Bone Miner Res. 2022;37:15711579.
53. Center JR, Bliuc D, Nguyen TV, et al. Risk of subsequent fracture after low-trauma fracture in men and women. Jama. 2007;297:387-394.
54. Bliuc D, Nguyen ND, Milch VE, et al. Mortality risk associated with low-trauma osteoporotic fracture and subsequent fracture in men and women. Jama. 2009;301:513-521.
55. Iconaru L, Moreau M, Baleanu F, et al. Risk factors for imminent fractures: a substudy of the FRISBEE cohort. Osteoporos Int. 2021;32:1093-1101.
56. CBS statline. Overlevingskansen; geslacht, leeftijd (Dutch). 2022 https://opendata.cbs.nl/statline/#/ CBS/nl/dataset/70701ned/table?fromstatwebdate Accessed February 12 2024.
57. Ekelund U, Tarp J, Steene-Johannessen J, et al. Dose-response associations between accelerometry measured physical activity and sedentary time and all cause mortality: systematic review and harmonised meta-analysis. Bmj.
2019;366:l4570.
58. Buchner DM, Rillamas-Sun E, Di C, et al. Accelerometer-Measured Moderate to Vigorous Physical Activity and Incidence Rates of Falls in Older Women. J Am Geriatr Soc. 2017;65:24802487.
59. Jefferis BJ, Iliffe S, Kendrick D, et al. How are falls and fear of falling associated with objectively measured physical activity in a cohort of community-dwelling older men? BMC Geriatr. 2014;14:114.
60. Tricco AC, Thomas SM, Veroniki AA, et al. Comparisons of Interventions for Preventing Falls in Older Adults: A Systematic Review and Metaanalysis. Jama. 2017;318:1687-1699.
61. Sherrington C, Fairhall NJ, Wallbank GK, et al. Exercise for preventing falls in older people living in the community. Cochrane Database Syst Rev. 2019;1:Cd012424.
62. van den Berg P, van Haard PMM, Geusens PP, et al. Challenges and opportunities to improve fracture liaison service attendance: fracture registration and patient characteristics and motivations. Osteoporos Int. 2019;30:1597-1606.
63. Eekman DA, van Helden SH, Huisman AM, et al. Optimizing fracture prevention: the fracture liaison service, an observational study. Osteoporos Int. 2014;25:701-709.
Secondary fracture prevention has seen much improvement in the past few decades, both clinically and in organizational approaches. However, a large care gap remains in post-fracture care, for example in The Netherlands only 30% of fracture patients are evaluated at the Fracture Liaison Service (FLS).1 Although the implementation of FLS care has been shown to be associated with a decreased subsequent fracture and mortality risk, still a large proportion of patients experiences a subsequent fracture.2 To further improve postfracture care, risk factors for subsequent fractures must be further explored. The majority of fractures, including subsequent fractures, are caused by a fall.3 While fall risk assessment and treatment is not standardized, and often not routinely implemented in FLS care, it is considered to be an important factor in secondary fracture prevention.4, 5 FLS caregivers frequently lack essential knowledge and organizational structures regarding the optimal timing and methods for conducting a fall risk assessment, or when to refer to specialized clinics, and initiate intervention strategies. In this thesis, we aimed to further explore fall and fracture risk factors in patients with a recent fracture. First, we explored whether fall risk is time-dependent after a recent fracture. Second, we provided an overview of physical performance measures for FLS patients. Using the “can do, do do” concept we explored physical capacity and physical activity and its association with clinical outcomes. Lastly, we explored other fracture risk factors, including the association between PPI use and bone microarchitecture and strength.
Falls and fractures in the general population and at the FLS
To adequately review the results of this thesis, several population characteristics should be kept in mind regarding fall, fracture and FLS populations. First, as stated in the introduction of this thesis, fall and fracture studies are conducted in a wide range of populations; the majority of the fall literature describes general older populations aged 65 years or older.6 As approximately 5-15% of falls result in a fracture, fracture patients are only a small part of this group.7, 8 Conversely, most literature and guidelines regarding secondary fracture prevention and FLS care describe populations aged 50 years or older with a recent fracture.5, 9-11 This is a wider selection of persons than only the 65-yearolds with a recent fall resulting in fracture. Importantly, it also encompasses patients that did not sustain a fracture due to a fall, but due to other fracture mechanisms such as crush injuries. The FLS population comprises only fracture patients who attended the FLS. Studies with FLS patients often show a “healthy” subpopulation of the total 50+ group with a fracture;12, 13 fracture patients that attend the FLS are younger, more often female, less frail, have higher education and are less likely to have a hip fracture compared to the non-attenders.12, 13 Partly, these discrepancies are enlarged by selection
bias in prospective study populations of patients that are willing and able to participate in these studies.3 For instance, the proportion of patients with a major or hip fracture in our population of consecutive FLS patients in chapter 4 is higher compared to that in our prospective study cohort using FX MoVie data in chapter 5 and 6, that comprised FLS attenders that consented to participate in this prospective study. Therefore, the results obtained in FLS populations are subject to selection bias and can not automatically be extrapolated to general fracture populations and vice versa. Moreover, comparisons with the general older or osteoporotic populations should always be considered in light of these population differences.
Although the FLS population has one common denominator: having sustained an incident fracture, it is still a heterogeneous population. The organizational structure of the FLS contributes to this heterogeneity; for instance, a wide range of ages are invited to the FLS, and at different ages certain bone and fall related fracture risk factors are more or less important.14 Additionally, FLS patients exhibit a considerable degree of variability in their lifestyle and activity levels (working versus retired, physical active versus immobile), resulting in inconsistencies in concurrent co-morbidities and frailty, which could cause a fall or fracture. Moreover,the organizational structures of the FLS differ in 1. patient identification and selection, and proportion of FLS attendance (ranging from 30%-70% in different studies)5, 15 and 2. risk evaluation that is performed in FLS patients. Therefore, a large variability is found between different FLSs in patient characteristics, e.g. in terms of osteoporosis, prevalent VFs, causes of secondary osteoporosis and metabolic bone disease and fall risk factors.15 Consequently, the modifiability of the fall and fracture risk factors also differs between patients. This means that a stereotype “FLS patient” does not exist, complicating the interpretation and comparability of research and organization of care.
The terminology of imminent fracture risk, imminent subsequent fracture risk and imminent fall risk is not without difficulty as discussed in the introduction of this thesis. Typically, imminent fracture risk is assessed in fracture populations and takes into account the time-dependent factors that contribute to subsequent fracture incidence,16-24 effectively studying “imminent subsequent fracture risk”. However, some studies use the term “imminent fracture risk” to assess short-term fracture risk in general or osteoporotic populations,25-32 effectively assessing short-term fracture risk in non-fracture patients. This distinction is essential because the predictors of subsequent fractures may not be the same as the predictors of (first) fractures in general populations. A high imminent subsequent fracture risk after an incident fracture is well
established.16, 17, 19, 33-35 In chapter 2 we found an imminent fall risk in individuals with a recent fracture, when compared to subjects without a recent fracture. Fall risk was highest in the first years after fracture, declined gradually afterwards, but remained higher than in the fracture-free population during long term follow-up. This finding is in line with studies in older and smaller fracture populations.3, 36, 37 In our study, men had a 3-times and women a 2-times higher relative risk in the first year after fracture compared to fracture-free controls, while the absolute risk for women was higher than that of men. Importantly, the time-dependent pattern of fall risk was similar to the pattern of imminent subsequent fracture and mortality risk. It is likely that the imminent subsequent fracture risk can be explained by an imminent fall risk after fracture, as most subsequent fractures are caused by a fall.3 The imminent fall risk was found for individuals with almost all fracture types and all age groups. This is in line with studies that report a high imminent subsequent fracture risk in different types of fractures.17, 26
Our findings suggest that strategies for secondary fracture prevention should (at least partly) shift towards evaluation and management of risk factors that may lead to imminent falls. Imminent fall and fracture risks have two important clinical implications for post-fracture care. Step one is for clinical practice at the FLS to perform fracture risk assessments immediately after an incident fracture to address these imminent risks; an approach that has already been implemented in guidelines such as the 5-step approach and Key Performance Indicators (Figure 1 of introduction section of this thesis).5, 38 The determinants of imminent (subsequent) fracture risk have been a topic of interest in recent years and continue to be explored. However, the integration of standardized evaluation of imminent fracture risk predictors into clinical practice remains gradual. Current recommendations for tackling imminent fracture risk primarily focus on prescribing effective, rapid-acting anti-osteoporotic medications (AOMs) to achieve short-term fracture reduction.20 Conversely, according to Dutch data, only about 40-50% of patients attending the FLS require AOM.39 Thus, there is an urgent need for alternative methods to mitigate the risk of imminent fractures beyond the use of AOM. Step two would be to further explore and eventually clinically evaluate determinants of imminent fall risk.
Establishing a causal relationship between imminent falls and fractures or identifying predictors of fall risk was beyond the scope of this study. A few studies have identified predictors of post-operative falls in hip fracture patients, including older age,40, 41 poor nutritional status,40 weak muscle strength and endurance,40, 41 lower post discharge ADL40, 41 and depressive symptoms.41, 42 Importantly, a study on first- and second year post-operative fall incidence in 188 Taiwanese hip fracture patients, showed different fall predictors for falls in the first, compared to the second year of follow-up;41 in the first year, the risk of a single fall was mostly enlarged by a lower quadratic muscle endurance, and age and depressive symptoms were the strongest predictors for multiple
falls. In the second year, post-discharge ADL was the strongest predictor of single and multiple falls. However, these were only studies in older hip fracture patients and imminence of fall risk was not assessed. Studies on predictors of imminent subsequent fracture risk have also identified several fall-related fracture predictors including a history of falls,26, 43 advanced age,19, 21, 43 female sex,43, 44 impaired motor skills or physical performance,26, 43, 44 the use of fallrisk-increasing drugs (FRIDs),19 and a significant comorbidity burden,19, 21, 43 amongst others. These factors highlight the complex interplay of fall and fracture risk factors in imminent fall and fracture risk, emphasizing the need for comprehensive patient evaluations on both facets, independent of treatment indication and regardless of age and type of fracture.
Imminent fracture risk in general older populations – As 90% of fractures in the general population are caused by a fall, fractures can be regarded as proxy for (injurious) falls. In this regard, our results are also in line with a recent large meta-analysis in general populations showing an imminent fracture risk after a recent fall.45, 46 In the prediction of imminent fractures, they observed an interaction between previous falls and follow-up time, with the risk diminishing over time.46 The predictive values of a recent fall were higher for men than for women, and with each additional fall, the subsequent risk for a MOF increased. Similar findings were obtained in a study of Kim et al. that showed that a fall within the past 4 months gives a similarly high fracture risk in the following year as a recent fracture did,30 and a higher risk compared to a fall that happened 5-12 months ago. Moreover, a large population-based study in Taiwanese patients admitted to the trauma department with an injurious fall, showed a time-dependent incidence of subsequent injurious falls, with higher incidence density in the first 3 months after discharge, compared to the one-year incidence.47 While these studies were not specifically performed in fracture populations, the results suggest a similar imminent fall risk pattern.
As for the role of short-term falls and fracture risk in current widely used fracture prediction tools; the FRAX does not account for recency of a previous fracture and has therefore been proven to underestimate short-term subsequent fracture risk, especially in patients younger than 65 years old.48 Recent developments have offered an updated version of FRAX; FRAXplus®,49 , in which algorithms are used to take either a recent previous fracture or a history of falls into account to estimate fracture risk.45 However, there is uncertainty about the reliability and applicability of these algorithms, especially since the algorithms are not openly available.
Decreased physical performance is a well-known risk factor for falls and fractures in general older populations.50-53 As stated, physical performance might be one of the key domains for predicting imminent fall and fracture risk. In chapter 4, we provided a comprehensive overview of measurements of four physical performance tests of consecutive FLS patients, as compared to a healthy reference population (e.g. 6-minute walking test (6MWT), timed up and go (TUG), 30 second chair stand test (30CST) and handgrip strength (HGS)). Furthermore, the study provides insight into the prevalence of sarcopenia at the time of the FLS visit. This is the first study to explore physical performance of FLS patients at the time of the first FLS visit approximately 3.5 months after fracture. Data on physical performance in populations with a recent fracture (not FLS specific) is mostly available for older (e.g. 65+) patients and hip fracture patients,54 but otherwise heterogeneous and fragmented.10, 55 Our study showed a high proportion of impaired or poor performance on all tests. As expected, test performance was lower in patients with hip, major and prevalent vertebral fractures. Poor performance was not limited to older patients, as patients aged 50-65 years also performed worse as compared to their ageand sex matched healthy peers. Our study suggests that the measurement of muscle mass at the FLS (to diagnose severe sarcopenia) has limited additional value as the prevalence is low. Previous studies have also shown that ALM measurements of muscle mass shows limited additional potential in fracture prediction compared to muscle strength.53 Our study underlines the relevance of physical performance assessment in all fracture patients. In line with the findings of chapter 2, this evaluation should be extended also to younger patients and to those with minor fracture types. The insights from chapter 4 are of relevance to both the treating physician as the patient and provides a frame of reference of the average FLS patient.
“can do,
In chapter 5 and 6, we aimed to quantify fall and fracture risk, using two combined measures of physical performance (physical capacity [PC], measured by 6MWT, and physical activity [PA], measured by accelerometer) in the “can do, do do” framework. In chapter 5 we were able to categorize physical performance of FLS patients and identified groups with distinct clinical characteristics including fall and fracture risk factors. In our prospective FLS cohort, 70% of the participants had adequate PC and in total, 90% of the participants PA levels were above the threshold minimally recommended by the WHO (150 min moderate to vigorous physical activity [MVPA]/week).56 This indicates that the FLS patients (and even more so, the FX MoVie population)
have adequate PC and PA and should be regarded as a sub-population of fracture patients. We found that 20% of FLS patients had low PC (can’t do), but high PA (do, do). This subgroup had significantly higher proportions of fall risk factors, such as low physical performance on other physical performance tests. This insight is valuable in clinical care at the FLS, as these patients may be at a higher risk for falls as they “can’t do”, but “do do”, and thus present risky behavior.
Even though subgroups were significantly different on a wide range of fall and fracture risk factors, in chapter 6 we found no association between domain categorization following the “can do, do do” framework and prospective fall, fracture, and mortality outcomes. Nor did we find an association between separate PC and PA measures and the primary and composite endpoints. While our study showed no association between 6MWT and PA measurement with clinical endpoints, it was exploratory in nature, with a low incidence of mortality during follow-up. The number of patients and number of outcomes did not allow for stratified assessments, and differences between sexes were not assessed, while a review of previous studies in general older and osteoporotic populations suggests that the predictive ability might be higher in men compared to women.53, 57
For efficient subsequent fall and fracture prevention, it is important to predict which FLS patients will sustain an injurious fall, and thus might benefit from falls prevention, such as exercise training, besides treatment for fracture prevention. However, little is known about the predictive ability of physical performance measures in the FLS population, at the time of FLS evaluation for clinical outcomes, such as falls and subsequent fractures. One study in male fracture patients (non-FLS specific) assessed physical performance and the risk of subsequent fracture and mortality in a cohort of 830 men with a recent fracture included in the MrOS study.57 They found that a decreased physical capacity, measured by gait speed and muscle strength, was associated with higher mortality risk after fracture, but not with subsequent fracture risk. However, they did find an association between failure to perform a test and an increased subsequent fracture risk (HR: 2.03; 95% CI: 0.95-4.35). These findings indicate that physical performance might be useful in assessing subsequent fracture risk and mortality risk, especially if ‘failure to perform a test’ is considered in the analysis, which we did not. However, they also acknowledge that PC measures within fracture populations might not discriminate enough between patients to associate with relevant clinical endpoints.
With the high proportion of normal PA in our population, the discriminatory ability of the framework diminished. Possibly, our measurement of PA by accelerometer have had an influence on this high proportion. The WHO guidelines are based on association studies of PA and adverse health outcomes that apply a wide variety of measurement methods, including self-reported
measurement and device-based measurement.56 The validity and threshold definition of the MOX accelerometer was established in comparison to the ActiGraph accelerometer,58 and has not been associated with important adverse health events considered by the WHO. The comparison between self-reported measures and accelerometer-derived measures remains complicated.56 Thus, the threshold of 150 min MVPA/week could be inadequate (too low) in case of PA measurement using the MOX. However, our sensitivity analysis in chapter 6, using the lowest versus the highest three performing quartiles of PA, effectively using a threshold of 184 minutes MVPA/week did not alter our conclusions.
The value of physical performance tests to predict falls remains difficult even in general (non-fracture) older populations.50 Keeping this in mind, 6MWT and PA might also not be the best tests to examine the association of physical functioning with clinical outcomes, such as falls and fractures in fracture patients. Gait speed over a shorter distance seems to have the highest potential in predictive value for falls in general populations aged 60 years or older and alternatively the TUG is advised.50, 59 Furthermore, the practical applicability of the tests that are performed in the can do, do do” framework is low compared to other testing methods. The 6MWT is time- and energy consuming for both patient and caregiver, especially compared to other measures of walking ability. PA assessment using accelerometers, with increasing burden on health care professionals, might shift towards less costly and time-consuming strategies by using readily available data, such as step count from a telephone of smartwatch.60, 61
Importantly, already over 60 different measurement methods, batteries and scorecards for physical performance exist.50, 62 For each test, a large heterogeneity exists in testing methods, and in the availability of validation studies in sub-populations and established associations with clinical outcomes. In light of these conclusions, we can regard that the additional value of “can do, do do” framework is limited in fracture patients, especially in the prediction of subsequent injurious falls and fractures.
This thesis did not provide an answer to the question: “Which FLS patient will benefit from falls assessment the most, to prevent subsequent (injurious) falls?” As stated, a previous study showed that over 3-years of follow-up, 60% of FLS patients became fallers and 11% sustained a subsequent fracture.3 However, only 4.9% of all falls during follow-up resulted in a subsequent fracture. Similarly in the study of van Helden et al., 15% of the Dutch consecutive FLS patients became fallers during 3 months of follow-up, while only 1% sustained a subsequent fracture.63 Lastly, in a 2-year follow-up study of 600 Taiwanese FLS patients 14.2% died, 33.2% experienced at least 1 fall and 6% sustained a
subsequent clinical fracture.64
With time and resources lacking in clinical practice, a method for selection of patients at high risk for specifically these injurious falls is needed, to efficiently implement falls assessment and intervention strategies to prevent future events. All three aforementioned studies compared FLS patients that sustained a fall during follow-up, to non-fallers. The first study showed no differences in clinical characteristics including age, sex, BMI, index fracture type, DXA and VFA outcomes between fallers and non-fallers.3 The study of van Helden et al. identified female sex, polypharmacy, and ADL difficulties in multivariable analysis as risk factors for a fall after fracture. However, fallers and non-fallers did not differ significantly on a wide range of other factors.63 The last study did manage to find determinants of fall risk after fracture; older age, higher BMI, cancer and osteoarthritis were associated with a higher fall risk.64
Based on these studies and the results of this thesis, we can conclude that a difficulty exists in finding clinical characteristics with a discriminatory ability to predict clinical endpoints in FLS patients. This has also been the case for fracture risk factors that do have an established predictive ability in general or osteoporotic populations. For example, in previous FLS studies no differences were shown in prevalence of secondary osteoporosis and metabolic bone disease or vertebral fractures between patients with or without osteoporosis,39, 65, 66 and no differences were found in incidence of subsequent fractures and mortality between groups of patients with either a bone related risk factor, a fall related factor or both.67 Possibly, since the FLS population is a distinct subpopulation that already has a history of falls and fractures, selection of these patients might render previous predictors no longer discriminative to predict clinical outcomes.
The Dutch guidelines on osteoporosis and fracture prevention (2022) currently advises a multifactorial fall risk assessment in all 65+ fracture patients.10 For all 50+ fracture patients, a modified, shortened falls assessment is advised, including five key points: assessment of 1. alcohol use, 2. use of FRIDs, 3. orthostatic hypotension 4. vision loss and use of glasses 5. gait, strength and balance. This is in line with the recommendations of the World Falls Guidelines (2022),6, 10 which state that anyone over 65 years old, with an injurious fall resulting in fracture, should undergo a fall risk assessment. The results of this thesis support these recommendations for falls evaluation in younger fracture patients and emphasize the need for gait, strength and balance assessment as physical performance on these tests is generally low (even though their predictive ability has not been established).
However, only approximately 30% of the fracture patients visits an
FLS in the Netherlands.1 Of those who visit an FLS, only a part undergoes a falls assessment.68 In the Netherlands in 2015, 17 out of the 24 FLSs that were evaluated performed any form of falls assessment. Fourteen of them adhered to national guidelines in falls prevention.68 Only three FLSs reported systematic referral to a falls prevention clinic. Several contributors for the falls assessment gap can be identified. First, a fall risk assessment is not carried out for all patients with a recent fracture either at the FLS or after referral to a specialized falls clinic. Second, not all patients that need falls treatment are actually referred. Third, initiation of treatment by patients is low, and lastly, patient adherence to intervention programs is low.68-70 Also internationally, falls assessment during FLS visit is lacking; to illustrate; in the 2017 FLS facilities audit in the United kingdom, 40% of patients visiting the FLS received a fall assessment and only 20% of FLSs were able to provide falls assessment in over 80% of their patients.4 Importantly, only 4% of patients aged over 75 (3% of all patients who were due to be monitored) received strength and balance training at their first moment of follow-up. In 2021-2023 these numbers increased to a fall risk assessment for 58% of FLS patients, but still only 5-6% of started strength and balance training.69 Further, in France an observational study of 256 FLS patients reported that of all patients with ≥2 falls (12.9%) 69.7% was referred to a Fall Prevention Clinic.70 The proportion of evaluated patients was not reported.
Several barriers in falls assessment and intervention can be identified. First, FLS-caregivers face significant time-limitations.71 Secondly, patient motivation and risk perception are generally low when it comes to falls assessments and interventions. The focus should be on motivating patients and efficiently communicating risks.72 Lastly, the financial barrier; in the Netherlands, for rehabilitation of a fracture, a total of 6 to 12 months of physiotherapy is granted. However, without a full coverage additional insurance policy, the costs of at least a few first therapy sessions are borne by the patient, and this therapy is mostly fracture oriented.73 Since January 2024 exercise interventions for falls prevention are covered by the insurance, but only for people of 65 years or older.74
To conclude, FLS care could benefit of a standardized falls assessment. Currently, the approach and treatment options are left to national guidelines, local availability of care and expertise.38, 75 As inevitable as this is, the common lack of evaluation and treatment of fall risks is undeniable. Moreover, from an organizational approach, little evidence is available about the feasibility of falls assessment integrated in FLS care versus the referral to external falls clinics.76
Population based studies have found an association between PPI use and an increased fracture risk,77-79 but the underlying pathophysiological mechanisms remain unclear and therefore causality between PPI use and poor bone health has not yet been established.80-82 In chapter 3 we assessed the association between PPI use and change in bone microarchitecture and strength prospectively using HR-pQCT measurements. Our results did not show a significant difference in change in bone microarchitecture and strength between 3-year continuous PPI users versus non-users. Thus, our study does not support the hypothesis that the association between PPI use and fracture risk can be attributed to changes bone microarchitecture or strength. Our study was exploratory, especially in men our study had insufficient power. In observational studies, residual confounding (confounding that remains after correcting for the most important confounders) might play a role. This may also be the case when assessing the association between PPI use and fracture incidence.81 Possibly, PPI users were a more frail population and therefore more prone to falls and fractures.80, 81 In general populations, PPI use has previously been associated with an increased fall risk.83-85 In our study, we did not find a significant difference in fall and fracture incidence between PPI users and non-users. However, this was assessed in an FLS cohort of which the majority already sustained a fall and fracture and all patients were treated according to the Dutch guidelines standards.86 Currently, a medication review is part of standardized FLS treatment.5 Part of this evaluation is based on FRIDS and drugs associated with increased fracture risk. Previous evaluation of the medication use of FLS and upper limb fracture patients showed a high proportion of FRIDS use14, 87 and polypharmacy,14 indicating FRIDs evaluation is an essential part of fall risk evaluation at the FLS as FRIDs are potentially modifiable fall risk factors.
This thesis contributed to the current evidence about timing of falls and physical performance related fall and fracture risk factors in a population with recent fracture. Strengths of our studies included that we were the first to assess imminent fall risk after fracture in a large population-based cohort, while simultaneously assessing imminent subsequent fracture and imminent mortality risk. Moreover, our studies in the FLS population have a follow-up of 3 years and we were able to extend this to 6 years for fracture and mortality outcomes in chapter 6. A relatively long follow-up, compared to other studies in FLS patients.2 In all our studies, we provide data on age groups 50-65 year old. A group of fracture patients of which we have very limited evidence, especially in terms of physical performance and fall risks. Another strength of
our study is that we evaluated the outcomes of various groups of fractures by using different classifications (MOF, Center) in chapter 4, 5 and 6
This thesis has also several limitations. First, due to our study design, we were unable to assess imminent fall risk in the first 30 days after fracture. Secondly, the studies that were performed using data from the larger FLS cohort and the FX MoVie cohort should be considered within the limitations of the population of these cohorts as described in the second paragraph of this chapter. Furthermore, all physical performance testing in these cohorts is subject to the timepoint of testing, 3.5 to 4 months after fracture, currently the timing for falls evaluation and treatment at the FLS. Consequently, this is also the moment for baseline evaluations in order to be associated with clinical outcomes. While inevitable, this also means that not all patients will be fully rehabilitated at the time of evaluation. Moreover, we do not provide data on physical performance in the first weeks to two months after fracture, a period with possibly the highest imminent fall risk after fracture. In clinical practice, the variability of rehabilitation duration should be kept in mind. Consequently, our FLS studies need to be repeated in a wider range of fracture populations at different evaluation times to extrapolate the findings to, for instance, clinical settings during hospital admission.
Several future perspectives can be derived from this thesis. First, future studies on imminent fall risk should evaluate if this imminent risk is also present on the very short-term e.g. in the first weeks to months after fracture. Moreover, to guide the clinical identification of those fracture patients with a high imminent fall risk, focus on identification of modifiable predictors of imminent fall risk is needed. In this regard, studies should discriminate between predicting short-term and long term- fall risk, as determinants might not be the same. Finally, to optimally guide secondary fracture prevention, specific assessment of predictors of imminent fall risk of falls that result in a subsequent fracture is needed. Future studies on imminent risk should clearly specify whether this risk is evaluated in a population with or without a recent fall or fracture.
Second, this thesis did not manage to answer the question “who falls and who will fracture again?” However, the findings in chapter 3 (for men) and 6 are exploratory in nature and need to be assessed in larger study cohorts. In this, further exploration of physical performance measures other that the 6MWT and physical activity measured by accelerometer should be done. Inability to perform a test should be added to this prediction, and populations should be large enough to allow for stratification, at least for age and sex. Of note, it should be added that, as predictive ability is lacking, physical performance measures should not be assessed in relation to fall history, but with future fall events.
Third, from a broader perspective than physical performance, it would
be interesting to explore if we are currently assessing the right indicators of (imminent) fall risk. Future studies should continue the search of other determinants of (injurious) falls after fracture (despite proper AOM treatment). Moreover, current methods of identifying predictors using regression analysis might not be the optimal approach. Possibly, the development of prediction models using AI technology might be able to overcome fixed patterns of thinking and explore a more wide-ranging set of clinical determinants. Alternatively, the question might be whether everyone should undergo a multifactorial falls assessment at the FLS and engage in balance and strength training? The specific patient characteristics of the FLS population imply that for optimal post-fracture evaluation and treatment, at the least a personalized approach is warranted. While falls assessments are complex and time-consuming, clinical practice does not currently provide enough time and expertise for fall risk assessment at the FLS for all patients. To address this, effectiveness studies are needed to support the implementation of an integrated fall risk assessment at the FLS. Moreover, other interventions next to balance and strength training could be considered.
Regarding our PPI study, our results should be confirmed in larger studies, ideally with time-varying PPI use and time-varying HR-pQCT measurement. Moreover, evaluation of PPI use should be extended toward use before study inclusion and medication use should be confirmed by pharmacy dispensary records instead of self-reported medication use during yearly study visits. Future studies should assess fall risk in PPI users with a recent fracture, as PPIuse might be one example of a (currently understood) fracture risk factor, that might actually cause this fracture risk due to a higher fall incidence in the PPI user population. If so, it should be treated as such.
In conclusion, this thesis demonstrated an imminent fall risk in the first years after a fracture in all age and fracture types compared to persons with the same age and sex of the fracture-free population. This fall risk followed the same time pattern as the imminent fracture and mortality risk after fracture. Furthermore, it was shown that the physical performance of FLS patients is lower compared to the general population on several domains including muscle strength and walking ability. However, their level of physical activity remains preserved. The “can do, do do” framework is valuable tool for identifying groups with specific fall and fracture related characteristics, but it was not associated with falls, subsequent fractures or mortality.
We did not find any association between PPI use and HR-pQCT measured bone strength and quality. Possibly the association found between PPI use and fractures in large population studies is due to residual confounding and other
pathways such as a difference in fall risk between PPI users and non-users might be of importance.
Currently, the FLS is widely regarded as the most effective organizational approach to secondary fracture prevention. Despite this, patients who have recently experienced a fracture continue to have a high risk of falling and sustaining additional fractures. This thesis supports the importance of a multifactorial fall risk assessment and physical performance evaluation at the FLS, also in patients younger than 65 years old. Future research should further focus on identifying fracture patients who are at the highest risk of falling and sustaining subsequent fractures, as this will enable targeted treatment for those in greatest need. It is crucial to determine whether selecting FLS patients with high versus low fall risk related subsequent fracture risk is possible, feasible and cost-effective in terms of reducing subsequent fractures. Until then, a fall risk assessment should be considered for all FLS patients.
1. Zorginstituut Nederland. Zinnige Zorg - Verbetersignalement Osteoporose. Zorginstituut Nederland. 2020 https:// www.zorginstituutnederland.nl/publicaties/ rapport/2020/08/11/zinnige-zorgverbetersignalement-osteoporose Accessed May 5th 2024.
2. Li N, Hiligsmann M, Boonen A, et al. The impact of fracture liaison services on subsequent fractures and mortality: a systematic literature review and meta-analysis. Osteoporos Int. 2021;32:1517-1530.
3. Vranken L, Wyers CE, Van der Velde RY, et al. Association between incident falls and subsequent fractures in patients attending the fracture liaison service after an index fracture: a 3-year prospective observational cohort study. BMJ Open. 2022;12:e058983.
4. Royal College of Physicians. Fracture Liaison Service Database Leading FLS improvement: secondary fracture prevention in the NHS. Falls and Fragility Fracture Audit programme,2017
5. van den Bergh JP, van Geel TA, Geusens PP. Osteoporosis, frailty and fracture: implications for case finding and therapy. Nat Rev Rheumatol. 2012;8:163-172.
6. Montero-Odasso M, van der Velde N, Martin FC, et al. World guidelines for falls prevention and management for older adults: a global initiative. Age Ageing. 2022;51:afac205.
7. Tinetti ME, Speechley M, Ginter SF. Risk factors for falls among elderly persons living in the community. N Engl J Med. 1988;319:1701-1707.
8. Schwenk M, Lauenroth A, Stock C, et al. Definitions and methods of measuring and reporting on injurious falls in randomised controlled fall prevention trials: a systematic review. BMC Med Res Methodol. 2012;12:50.
9. Lems WF, Dreinhöfer KE, Bischoff-Ferrari H, et al. EULAR/EFORT recommendations for management of patients older than 50 years with a fragility fracture and prevention of subsequent fractures. Ann Rheum Dis. 2017;76:802-810.
10. Federatie Medisch Specialisten. Richtlijn Osteoporose en fractuurpreventie. 2022 https:// richtlijnendatabase.nl/richtlijn/osteoporose_en_ fractuurpreventie/startpagina_-_osteoporose_en_ fractuurpreventie.html
11. Eisman JA, Bogoch ER, Dell R, et al. Making the first fracture the last fracture: ASBMR task force report on secondary fracture prevention. J Bone Miner Res. 2012;27:2039-2046.
12. Eekman DA, van Helden SH, Huisman AM, et al. Optimizing fracture prevention: the fracture liaison service, an observational study. Osteoporos Int. 2014;25:701-709.
13. van den Berg P, van Haard PMM, Geusens PP, et al. Challenges and opportunities to improve fracture liaison service attendance: fracture registration and patient characteristics and motivations. Osteoporos Int. 2019;30:1597-1606.
14. Vranken L, Wyers CE, Van der Velde RY, et al. Comorbidities and medication use in patients with a recent clinical fracture at the Fracture Liaison Service. Osteoporos Int. 2018;29:397-407.
15. Vranken L, Wyers CE, van den Bergh JPW, et al. The Phenotype of Patients with a Recent Fracture: A Literature Survey of the Fracture Liaison Service. Calcif Tissue Int. 2017;101:248-258.
16. Johansson H, Siggeirsdóttir K, Harvey NC, et al. Imminent risk of fracture after fracture. Osteoporos Int. 2017;28:775-780.
17. Balasubramanian A, Zhang J, Chen L, et al. Risk of subsequent fracture after prior fracture among older women. Osteoporos Int. 2019;30:79-92.
18. Wong RMY, Ho WT, Wai LS, et al. Fragility fractures and imminent fracture risk in Hong Kong: one of the cities with longest life expectancies. Arch Osteoporos. 2019;14:104.
19. Banefelt J, Åkesson KE, Spångéus A, et al. Risk of imminent fracture following a previous fracture in a Swedish database study. Osteoporos Int. 2019;30:601-609.
20. Pinedo-Villanueva R, Charokopou M, Toth E, et al. Imminent fracture risk assessments in the UK FLS setting: implications and challenges. Arch Osteoporos. 2019;14:12.
21. Iconaru L, Moreau M, Baleanu F, et al. Risk factors for imminent fractures: a substudy of the FRISBEE cohort. Osteoporos Int. 2021;32:1093-1101.
22. Iconaru L, Charles A, Baleanu F, et al. Prediction of an Imminent Fracture After an Index FractureModels Derived From the Frisbee Cohort. J Bone Miner Res. 2022;37:59-67.
23. Leslie WD, Yan L, Lix LM, et al. Time dependency in early major osteoporotic and hip re-fractures in women and men aged 50 years and older: a population-based observational study. Osteoporos Int. 2022;33:39-46.
24. Deloumeau A, Moltó A, Roux C, et al. Determinants of short term fracture risk in patients with a recent history of low-trauma non-vertebral fracture. Bone.
2017;105:287-291.
25. Bonafede M, Shi N, Barron R, et al. Predicting imminent risk for fracture in patients aged 50 or older with osteoporosis using US claims data. Arch Osteoporos. 2016;11:26.
26. Adachi JD, Berger C, Barron R, et al. Predictors of imminent non-vertebral fracture in elderly women with osteoporosis, low bone mass, or a history of fracture, based on data from the populationbased Canadian Multicentre Osteoporosis Study (CaMos). Arch Osteoporos. 2019;14:53.
27. Barron RL, Oster G, Grauer A, et al. Determinants of imminent fracture risk in postmenopausal women with osteoporosis. Osteoporos Int. 2020;31:21032111.
28. Yusuf AA, Hu Y, Chandler D, et al. Predictors of imminent risk of fracture in Medicare-enrolled men and women. Arch Osteoporos. 2020;15:120.
29. Papaioannou A, Adachi JD, Berger C, et al. Testing a theoretical model of imminent fracture risk in elderly women: an observational cohort analysis of the Canadian Multicentre Osteoporosis Study. Osteoporos Int. 2020;31:1145-1153.
30. Kim KM, Lui LY, Cummings SR. Recent fall and high imminent risk of fracture in older men and women. Age Ageing. 2022;51:afac141.
31. Hannan MT, Weycker D, McLean RR, et al. Predictors of Imminent Risk of Nonvertebral Fracture in Older, High-Risk Women: The Framingham Osteoporosis Study. JBMR Plus. 2019;3:e10129.
32. Sheer RL, Barron RL, Sudharshan L, et al. Validated prediction of imminent risk of fracture for older adults. Am J Manag Care. 2020;26:e91-e97.
33. van Geel TA, van Helden S, Geusens PP, et al. Clinical subsequent fractures cluster in time after first fractures. Ann Rheum Dis. 2009;68:99-102.
34. Roux C, Briot K. Imminent fracture risk. Osteoporos Int. 2017;28:1765-1769.
35. van Helden S, Cals J, Kessels F, et al. Risk of new clinical fractures within 2 years following a fracture. Osteoporos Int. 2006;17:348-354.
36. Berggren M, Stenvall M, Olofsson B, et al. Evaluation of a fall-prevention program in older people after femoral neck fracture: a one-year follow-up. Osteoporos Int. 2008;19:801-809.
37. Wong RMY, Wong PY, Liu C, et al. The imminent risk of a fracture-existing worldwide data: a systematic review and meta-analysis. Osteoporos Int. 2022;33:2453-2466.
38. Javaid MK, Sami A, Lems W, et al. A patient-level key performance indicator set to measure the effectiveness of fracture liaison services and guide
quality improvement: a position paper of the IOF Capture the Fracture Working Group, National Osteoporosis Foundation and Fragility Fracture Network. Osteoporos Int. 2020;31:1193-1204.
39. van der Velde RY, Bours SPG, Wyers CE, et al. Effect of implementation of guidelines on assessment and diagnosis of vertebral fractures in patients older than 50 years with a recent nonvertebral fracture. Osteoporos Int. 2017;28:30173022.
40. Lloyd BD, Williamson DA, Singh NA, et al. Recurrent and injurious falls in the year following hip fracture: a prospective study of incidence and risk factors from the Sarcopenia and Hip Fracture study. J Gerontol A Biol Sci Med Sci. 2009;64:599-609.
41. Yeh HF, Shao JH, Li CL, et al. Predictors of postoperative falls in the first and second postoperative years among older hip fracture patients. J Clin Nurs. 2017;26:3710-3723.
42. van den Berg M, Verdijk NA, Leusink GL, et al. Depression after low-energy fracture in older women predicts future falls: a prospective observational study. BMC Geriatr. 2011;11:73.
43. Williams SA, Greenspan SL, Bancroft T, et al. Development and validation of a one year predictive model for secondary fractures in osteoporosis. PLoS One. 2021;16:e0257246.
44. Ruan WD, Wang P, Ma XL, et al. Analysis on the risk factors of second fracture in osteoporosis-related fractures. Chin J Traumatol. 2011;14:74-78.
45. Kanis JA, Johansson H, Harvey NC, et al. Adjusting conventional FRAX estimates of fracture probability according to the number of prior falls in the preceding year. Osteoporos Int. 2023;34:479487.
46. Vandenput L, Johansson H, McCloskey EV, et al. A meta-analysis of previous falls and subsequent fracture risk in cohort studies. Osteoporos Int. 2024;35:469-494.
47. Lam C, Kang JH, Lin HY, et al. First Fall-Related Injuries Requiring Hospitalization Increase the Risk of Recurrent Injurious Falls: A Nationwide Cohort Study in Taiwan. PLoS One. 2016;11:e0149887.
48. Roux S, Cabana F, Carrier N, et al. The World Health Organization Fracture Risk Assessment Tool (FRAX) underestimates incident and recurrent fractures in consecutive patients with fragility fractures. J Clin Endocrinol Metab. 2014;99:24002408.
49. FRAX. Discover the advantages of FRAXplus. 2024 https://www.fraxplus.org/frax-plus Accessed April 15th 2024.
50. Beck Jepsen D, Robinson K, Ogliari G, et al.
Predicting falls in older adults: an umbrella review of instruments assessing gait, balance, and functional mobility. BMC Geriatr. 2022;22:615.
51. Alajlouni D, Tran T, Bliuc D, et al. Muscle Strength and Physical Performance Improve Fracture Risk Prediction Beyond Garvan and FRAX: The Osteoporotic Fractures in Men (MrOS) Study. J Bone Miner Res. 2021;
52. Harvey NC, Odén A, Orwoll E, et al. Measures of Physical Performance and Muscle Strength as Predictors of Fracture Risk Independent of FRAX, Falls, and aBMD: A Meta-Analysis of the Osteoporotic Fractures in Men (MrOS) Study. J Bone Miner Res. 2018;33:2150-2157.
53. Alajlouni DA, Bliuc D, Tran TS, et al. Muscle strength and physical performance contribute to and improve fracture risk prediction in older people: A narrative review. Bone. 2023;172:116755.
54. Talevski J, Sanders KM, Duque G, et al. Effect of Clinical Care Pathways on Quality of Life and Physical Function After Fragility Fracture: A Metaanalysis. J Am Med Dir Assoc. 2019;20:926.e921926.e911.
55. Szulc P. Impact of Bone Fracture on Muscle Strength and Physical Performance-Narrative Review. Curr Osteoporos Rep. 2020;18:633-645.
56. World Health Organization. WHO guidelines on physical activity and sedentary behaviour. World Health Organization, Geneva 2020.
57. Alajlouni DA, Bliuc D, Tran TS, et al. Muscle Strength and Physical Performance Are Associated With Risk of Postfracture Mortality But Not Subsequent Fracture in Men. J Bone Miner Res. 2022;37:15711579.
58. van der Weegen S, Essers H, Spreeuwenberg M, et al. Concurrent validity of the MOX activity monitor compared to the ActiGraph GT3X. Telemed J E Health. 2015;21:259-266.
59. Abellan van Kan G, Rolland Y, Andrieu S, et al. Gait speed at usual pace as a predictor of adverse outcomes in community-dwelling older people an International Academy on Nutrition and Aging (IANA) Task Force. J Nutr Health Aging. 2009;13:881-889.
60. Bort-Roig J, Gilson ND, Puig-Ribera A, et al. Measuring and influencing physical activity with smartphone technology: a systematic review. Sports Med. 2014;44:671-686.
61. Silva AG, Simões P, Queirós A, et al. Mobile Apps to Quantify Aspects of Physical Activity: a Systematic Review on its Reliability and Validity. J Med Syst. 2020;44:51.
62. Soubra R, Chkeir A, Novella JL. A Systematic
Review of Thirty-One Assessment Tests to Evaluate Mobility in Older Adults. Biomed Res Int. 2019;2019:1354362.
63. van Helden S, Wyers CE, Dagnelie PC, et al. Risk of falling in patients with a recent fracture. BMC Musculoskeletal Disorders. 2007;8:1-7.
64. Chao CT, Yang RS, Huang WJ, et al. Risk Factors for Poor Functional Recovery, Mortality, Recurrent Fractures, and Falls Among Patients Participating in a Fracture Liaison Service Program. J Am Med Dir Assoc. 2019;20:1129-1136.e1121.
65. Bours SP, van Geel TA, Geusens PP, et al. Contributors to secondary osteoporosis and metabolic bone diseases in patients presenting with a clinical fracture. J Clin Endocrinol Metab. 2011;96:1360-1367.
66. Malgo F, Appelman-Dijkstra NM, Termaat MF, et al. High prevalence of secondary factors for bone fragility in patients with a recent fracture independently of BMD. Arch Osteoporos. 2016;11:12.
67. Huntjens KM, van Geel TA, van Helden S, et al. The role of the combination of bone and fall related risk factors on short-term subsequent fracture risk and mortality. BMC Musculoskelet Disord. 2013;14:121.
68. van den Berg P, Schweitzer DH, van Haard PM, et al. Meeting international standards of secondary fracture prevention: a survey on Fracture Liaison Services in the Netherlands. Osteoporos Int. 2015;26:2257-2263.
69. Royal college of Physicians. Fracture Liaison Service Database. Annual report: Improved FLS identification with gaps in monitoring: a call to action for national and regional planners. In Royal College of Physicians (ed)2024
70. Pflimlin A, Gournay A, Delabrière I, et al. Secondary prevention of osteoporotic fractures: evaluation of the Lille University Hospital’s Fracture Liaison Service between January 2016 and January 2018. Osteoporos Int. 2019;30:1779-1788.
71. van der Velde N, Seppala L, Petrovic M, et al. Sustainable fall prevention across Europe: challenges and opportunities. Aging Clin Exp Res. 2022;
72. Lawson AA, Mensher JH, Meischke HW, et al. Personalized fall prevention. 2017;3:034.
73. Overheid Wettenbank. Besluit zorgverzekering 2024 https://wetten.overheid.nl/ BWBR0018492/2024-01-01 Accessed May 16th 2024.
74. Zorginstituut Nederland. Valpreventie. 2024 https://www.zorginstituutnederland.nl/ Verzekerde+zorg/valpreventie-zvw Accessed May
20th 2024.
75. Capture the fracture. Development of patient level outcomes: KPIs for FLSs for the IOF. In M.K. Javaid SF (ed)International Osteoporosis Foundation. 2020
76. Ruggiero C, Baroni M, Talesa GR, et al. The interdisciplinary fracture liaison service improves health-related outcomes and survival of older adults after hip fracture surgical repair. Arch Osteoporos. 2022;17:135.
77. Zhou B, Huang Y, Li H, et al. Proton-pump inhibitors and risk of fractures: an update meta-analysis. Osteoporos Int. 2016;27:339-347.
78. Park DH, Seo SI, Lee KJ, et al. Long-term proton pump inhibitor use and risk of osteoporosis and hip fractures: A nationwide population-based and multicenter cohort study using a common data model. J Gastroenterol Hepatol. 2022;37:15341543.
79. Nassar Y, Richter S. Proton-pump Inhibitor Use and Fracture Risk: An Updated Systematic Review and Meta-analysis. J Bone Metab. 2018;25:141-151.
80. Kondapalli A, Agarwal S, Germosen C, et al. Bone microstructure in proton pump inhibitor users. Bone. 2023;168:116668.
81. Lespessailles E, Toumi H. Proton Pump Inhibitors and Bone Health: An Update Narrative Review. Int J Mol Sci. 2022;23:10733.
82. Targownik LE, Goertzen AL, Luo Y, et al. LongTerm Proton Pump Inhibitor Use Is Not Associated With Changes in Bone Strength and Structure. Am J Gastroenterol. 2017;112:95-101.
83. Lewis JR, Barre D, Zhu K, et al. Long-term proton pump inhibitor therapy and falls and fractures in elderly women: a prospective cohort study. J Bone Miner Res. 2014;29:2489-2497.
84. Seppala LJ, van de Glind EMM, Daams JG, et al. Fall-Risk-Increasing Drugs: A Systematic Review and Meta-analysis: III. Others. J Am Med Dir Assoc. 2018;19:372.e371-372.e378.
85. Lapumnuaypol K, Thongprayoon C, Wijarnpreecha K, et al. Risk of fall in patients taking proton pump inhibitors: a meta-analysis. Qjm. 2019;112:115-121.
86. Dutch Institute for Healthcare Improvement CBO. Richtlijn Osteoporose en Fractuurpreventie, Derde Herziening [Dutch] Dutch Institute for Healthcare Improvement CBO, Utrecht, The Netherlands 2011.
87. Cox N, Ilyas I, Roberts HC, et al. Exploring the prevalence and types of fall-risk-increasing drugs among older people with upper limb fractures. Int J Pharm Pract. 2023;31:106-112.
Fractures comprise a major health concern. Patients with a recent fracture have a high risk of subsequent fracture and mortality. Therefore, secondary fracture prevention is an important aspect in the evaluation and treatment of fracture patients. In this thesis, we studied the timing and determinants of falls after a recent fracture, with a specific focus on physical performance measures. Additionally we assessed the association between the use of proton pump inhibitors (PPI) and bone quality and strength.
Chapter 1 provides a general background on the topics studied in this thesis.
A high short-term, or ‘imminent’ risk of subsequent fracture in the first 2 years after a fracture in patients over 50 years old is well established and subjects with a recent fracture have a high fall risk. We hypothesized that, similar to the subsequent fracture risk, fall risk is also highest immediately after fracture. In Chapter 2, we studied whether an imminent fall risk is present in patients with a recent fracture and whether the pattern aligns with subsequent fracture and mortality risk patterns. This study used primary care electronic health records from the UK Clinical Practice Research Datalink (CPRD) GOLD. We compared all subjects aged ≥ 50 years with a fracture between 1993-2015 to fracture-free controls matched on year of birth, sex, and practice. First, we assessed the one-year incidence rate ratios of first falls, fractures and mortality. Second, the cumulative incidence and relative risk (RR) of a first fall were calculated at various time intervals, with mortality considered as a competing risk. Additionally, the cumulative incidence of first fractures (with mortality as a competing risk) and mortality were calculated. Analyses were stratified according to age, sex and type of index fracture. In total, we included 624,460 subjects; 312,230 subjects with an index fracture, matched to 312,230 fracture-free controls. Of them, 71% was female, the mean age was 70 ± 12 and the mean follow-up 6.5 ± 5 years. We found that the risk of falls was highest in the first 2 years after fracture compared to fracture-free controls; men had a 3-fold and women had a 2-fold higher risk in the first year. This risk declined over time, but remained higher compared to the fracture-free controls. This imminent fall risk pattern was present in all groups stratified according to age and fracture type, and subsequent fracture and mortality risk followed the same patterns. We concluded that an imminent fall, fracture and mortality risk was present in the first years after a fracture in all age groups and in all fracture types. As most fall risk prevention strategies are targeted at persons over 65 years of age, this is an important finding, and our study underlines the need for early fall risk assessment and prevention strategies in all 50+ individuals with a recent fracture.
In chapter 3-7 we used data from patients from the Fracture Liaison Service (FLS) of VieCuri Medical Center in Venlo, The Netherlands. We used two datasets. In Chapter 4, we used a dataset of 1954 consecutive patients between 50-90 years visiting the FLS between November 2013 and June 2016 after a radiologically confirmed fracture. In Chapter 3, 5 and 6, we used data from 500 individuals who participated in a 3-year prospective study (FX MoVie study).
In Chapter 3, we assessed the association between PPI use and changes in bone microarchitecture and strength using high-resolution peripheral quantitative CT (HR-pQCT) over three-years of follow-up. The use of PPIs has been associated with an increased fracture risk in observational studies. However, the reported associations between PPI use and bone mineral density (BMD), bone microarchitecture, and bone strength in the literature were inconsistent. This study included FLS patients of the FX MoVie cohort, without anti-osteoporosis treatment indication (median age 62 [IQR 56-69] years, 68.7 % females). HR-pQCT scans of the distal radius and tibia were obtained at baseline (T0) and three-year follow-up (T3), and measures of volumetric bone mineral density and bone area, microarchitecture, and strength (microfinite element analysis) were assessed. The association between three-year continuous PPI use and the percentage change in these HR-pQCT parameters between T0 and T3 was assessed using sex-stratified multivariate linear regression analyses. A total of 282 participants had available medication data throughout the follow-up period and 20.6% were continuous PPI users. Complete HR-pQCT follow-up data were available for N = 69 at the distal radius and N = 84 at the distal tibia for males and for N = 147 at the distal radius and N = 168 at the distal tibia for females. PPI use, as compared to non-use, was not associated with the percentage change in any of the bone microarchitecture or strength parameters between T0 and T3 at the radius and tibia. PPI use was also not associated with the change of bone microarchitecture and strength in a cross-sectional sensitivity analysis of baseline data. Our results do not support that an altered bone microarchitecture or strength may contribute to the increased fracture risk associated with PPI use, as reported in observational studies.
An important part of fall risk assessment includes the evaluation of physical performance and mobility. Impaired physical performance and sarcopenia are associated with increased fracture risk and are widely used in clinical practice for fall risk evaluation in the older people. Fall risk evaluation in FLS patients has been a topic of interest in recent years. However, a comprehensive overview of physical performance measures specifically in FLS patients, at the time of FLS evaluation, was lacking in literature. In Chapter 4 we assessed physical performance and the prevalence of sarcopenia in FLS patients compared to a healthy reference population with the same age and sex. The physical
performance was assessed using following tests: the Chair Stand Test (CST), Handgrip Strength (HGS), Timed-Up-and-Go (TUG), 6-minute-walkingtest (6MWT) and the proportion of patients with sarcopenia was calculated following EWGSOP2 guidelines; 1. Probable sarcopenia: a low CST or HGS and 2. severe sarcopenia: probable sarcopenia plus a low appendicular lean mass (ALM/m2). Population reference data were obtained by conducting a literature search. The proportion of patients with impaired or poor performance on the performance tests compared to reference data was calculated using Z scores. We defined a Z-score ≥ -2SD to < -1SD as impaired performance, and under -2 SD as poor performance. Based on a normal distribution, the expected proportion of impaired and poor performance was 16%. Associations of fracture type, sex, age, and time since fracture with performance Z-scores were assessed. In total, 1789 subjects were included with a median age (IQR) of 66 (59-74), 70.7% females, evaluation at the FLS took place a mean (SD) 3.9 (±1.6) months after fracture. The prevalence of impaired or poor performance for CST, HGS, TUG and 6MWT was 39.2%, 30.4%, 21.9% and 71.5%, respectively. Severe sarcopenia was found in 3.3% of the males and 2.5% of the females. The proportion of patients with probable sarcopenia was 30.9% and 42.8%, respectively. Lower CST, TUG, and 6MWT test scores, but not HGS, were found in patients with a hip, major, or ≥1 prevalent vertebral fracture than in those with other fractures. Stratified analysis showed a high proportion of patients with impaired or poor performance in all age groups and both sexes. We concluded that the physical performance of FLS patients from both sexes and all ages was significantly lower on several different physical performance domains compared to a healthy, sex-, and age-related reference population. These findings underline the need to assess and improve physical performance in FLS patients. The low prevalence of severe sarcopenia was remarkable, and it is in line accordance with the EWGSOP2 guidelines that probable sarcopenia might be preferable to assess sarcopenia, as the additional benefit of ALM measurement appears to be of lesser importance.
Physical capacity (PC) and physical activity (PA) are associated physical performance measures. PC measures objectively physical performance using specific tests such as the CST, the TUG or the 6MWT and PA is defined as any bodily movement produced by skeletal muscles that results in energy expenditure and combined, PC and PA are used to categorize physical performance in the previously published “can do, do do” framework. In the last two chapters of this thesis, we aimed to explore the physical performance of patients attending the FLS using this framework. PC was measured by 6-minute-walking-test (can’t do/can do) and PA by MOX accelerometer (don’t do/do do). The following quadrants were defined based on predefined cutoff scores for poor performance: 1. “can’t do, don’t do”; 2.“can do, don’t do”; 3.“can’t do, do do”; 4.“can do, do do”. In Chapter 5 and 6 we explored the
usability and application of this framework in FLS patients.
First, in Chapter 5, we assessed whether the framework was useful to categorize FLS patients into different groups with specific patient characteristics, specifically fall and fracture risk factors. PC and PA of 400 FLS patients with available 6MWT and MOX data were assessed. The mean age of the patients was 64 years, and 70.8% was female. Patients performed as follows: 8.3% “can’t do, don’t do”; 3.0% “can do, don’t do”; 19.3% “can’t do, do do”; 69.5% “can do, do do”. PC and PA measures showed that participants who “can’t do” had an almost tenfold higher odds to be categorized in the “don’t do” group, compared to the “can do” group OR 9.76 (95% CI: 4.82-19.80). Of all the “don’t do” participants, only 3% were categorized in the “can do, don’t do” group, meaning they were able to be physically active but did not undertake physical activity. However, only 4% of all “can do” participants were categorized in this group, indicating that if the FLS population “can do”, they most often “do do”. A wide range of patient characteristics were explored between the groups. Both the “can’t do, don’t do” and “can’t do, do do” group differed significantly compared to the “can do, do do” group on several fall and fracture risk factors (e.g. had lower functional capacity measures on all tests and higher use of walking aid, and had higher proportion of osteoporosis (men and women) among others. Thus, we concluded that the “can do, do do” framework is able to identify fracture patients with specific patient characteristics. Of all FLS patients 20% “can’t do, but “do do” while having a high prevalence of fall risk factors, compared to persons that “can do, do do”, which may indicate this group is prone to fall.
Next, In Chapter 6 the “can do, do do” framework was used to assess the association between domain categorization and prospective fall, fracture and mortality outcomes in the same FLS population of 400 subjects. The outcomes of interest were first fall (at 3 years of follow-up, measured by fall diaries), first subsequent fractures, and mortality (derived from electronic patient records at 6 years with an extended follow-up period). Of the 400 included patients 61.5%, 20.3% and 4.9% sustained a first fall, subsequent fracture or had died. Domain categorization using the “can do, do do” framework was not associated with time to first fall, first subsequent fracture or mortality in multivariate cox regression analysis. Additionally, individual PA and PC measures were not associated with the three outcomes in multivariate analysis. We concluded that the categorization of patients into a two-dimensional framework seems inadequate to study complex, multifactorial outcomes. A personalized approach based on the known risk factors for falls and fractures may be preferable.
Chapter 7 discusses the overall findings of this thesis and provides future perspectives.
Nederlandse samenvatting
Nederlandse samenvatting
Fracturen vormen een belangrijk gezondheidsprobleem. Patiënten met een recent doorgemaakte fractuur hebben een hoog risico op een volgende fractuur en een hoger risico op overlijden. Daarom is secundaire fractuurpreventie een belangrijk aspect bij de evaluatie en behandeling van patiënten met een recente fractuur. In dit proefschrift hebben we de timing en determinanten van vallen na een recente fractuur onderzocht, met speciale focus op fysiek functioneren. Daarnaast hebben we de associatie tussen het gebruik van protonpompremmers (PPI) en botkwaliteit en botsterkte onderzocht.
Hoofdstuk 1 geeft een algemene introductie van de onderwerpen die in dit proefschrift zijn bestudeerd.
Patiënten ouder dan 50 jaar met een recente fractuur hebben een hoog korte termijn- of 'imminent' risico op een volgende fractuur in de eerste twee jaar na een fractuur en hebben ook een hoog valrisico. We hypothetiseren dat, vergelijkbaar met het risico op een volgende fractuur, ook het valrisico het hoogst is kort na de fractuur. In Hoofdstuk 2 onderzochten we of er een imminent valrisico aanwezig is bij patiënten met een recente fractuur en of het patroon overeenkomt met het imminente risicopatroon op volgende fracturen en mortaliteit. In deze studie werd gebruik gemaakt van de gegevens uit elektronische patiëntendossiers uit de eerstelijnszorg van de UK Clinical Practice Research Datalink (CPRD) GOLD. We vergeleken alle personen van 50 jaar en ouder met een fractuur tussen 1993-2015 met fractuurvrije controles gematcht op geboortejaar, geslacht en huisartsenpraktijk. Eerst beoordeelden we de eenjaars-incidentie van een eerste val, fracturen en mortaliteit. Vervolgens werden de cumulatieve incidentie en het relatieve risico (RR) van een eerste val berekend op verschillende tijdsintervallen na de indexdatum, waarbij mortaliteit als concurrerend risico werd beschouwd. Daarnaast werd de cumulatieve incidentie van eerste fracturen (met mortaliteit als concurrerend risico) en van mortaliteit berekend. Analyses werden uitgesplitst naar leeftijd, geslacht en type indexfractuur. In totaal werden 624.460 personen geïncludeerd; 312.230 personen met een indexfractuur, gematcht met 312.230 fractuurvrije controles. Van hen was 71% vrouw, de gemiddelde leeftijd was 70±12 jaar en de gemiddelde follow-up 6,5±5 jaar. We ontdekten dat het risico op vallen het hoogst was in de eerste twee jaar na de fractuur vergeleken met fractuurvrije controles; mannen hadden een 3-voudig en vrouwen een 2-voudig hoger risico in het eerste jaar. Dit risico nam in de loop van de tijd af, maar bleef hoger in vergelijking met de controlegroep. Dit patroon van imminent valrisico was aanwezig in alle leeftijds- en fractuurgroepen. Het risico op volgende fracturen en mortaliteit volgde hetzelfde imminente risicopatroon. We concludeerden dat er een imminent val-, fractuur- en mortaliteitsrisico aanwezig was in de
eerste jaren na een fractuur bij alle leeftijdsgroepen en bij alle fractuurtypes. Aangezien de meeste valpreventiestrategieën gericht zijn op personen ouder dan 65 jaar, is dit een belangrijke bevinding. Onze studie benadrukt het belang van vroege valrisicobeoordeling en preventiestrategieën bij alle 50-plussers met een recente fractuur.
In hoofdstuk 3-7 gebruikten we gegevens van patiënten van de Fracture Liaison Service (FLS) van het VieCuri Medisch Centrum in Venlo, Nederland. We gebruikten twee datasets; in Hoofdstuk 4 gebruikten we een dataset van 1954 opeenvolgende patiënten tussen 50-90 jaar die de FLS bezochten tussen november 2013 en juni 2016 na een radiologisch bevestigde fractuur. In Hoofdstuk 3, 5 en 6 gebruikten we de gegevens van 500 personen die deelnamen aan een 3-jarig prospectief observationeel onderzoek (FX MoViestudie).
In Hoofdstuk 3 bestudeerden we de associatie tussen PPI-gebruik en veranderingen in botmicroarchitectuur en botsterkte met behulp van highresolution perifere kwantitatieve CT (HR-pQCT) gedurende drie jaar follow-up. In observationele studies is het gebruik van PPI's geassocieerd met een verhoogd risico op fracturen. Echter, de in de literatuur gerapporteerde associaties tussen PPI-gebruik en boteigenschappen, zoals botmineraaldichtheid (BMD), botmicroarchitectuur en botsterkte, waren inconsistent. Onze studie omvatte FLS-patiënten van het FX MoVie-cohort, zonder indicatie voor anti-osteoporosebehandeling (mediane leeftijd 62 [IQR 56-69] jaar, 68,7% vrouwen). HR-pQCT-scans van de distale radius en tibia werden verkregen bij start van de studie (T0) en drie jaar follow-up (T3), en metingen van volumetrische botmineraaldichtheid, botoppervlakte, en microarchitectuur en sterkte (middels micro-finite elementenanalyse) werden beoordeeld. De associatie tussen drie jaar continu PPI-gebruik en het procentuele verschil in deze HR-pQCT-parameters tussen T0 en T3 werd beoordeeld met geslacht gestratificeerde multivariate lineaire regressieanalyses. In totaal waren van 282 deelnemers gedurende de gehele follow-up periode medicatiegegevens beschikbaar en 20,6% waren continue PPI-gebruikers. Volledige HR-pQCT follow-up gegevens waren beschikbaar voor mannen met N=69 voor de distale radius en N=84 voor de distale tibia, en voor vrouwen met N=147 voor de distale radius en N=168 voor de distale tibia. PPI-gebruik was, in vergelijking met nietgebruik, niet geassocieerd met een procentueel verschil in de parameters voor botmicroarchitectuur of -sterkte tussen T0 en T3. PPI-gebruik bleek ook niet geassocieerd met veranderingen in botmicroarchitectuur en -sterkte in een cross-sectionele analyse van de baseline HR-pQCT gegevens. Onze resultaten toonden aan dat veranderingen in botmicroarchitectuur of -sterkte waarschijnlijk niet bijdragen aan het verhoogde fractuurrisico dat gepaard gaat met PPI-gebruik, zoals eerder gerapporteerd in observationele studies.
Nederlandse samenvatting
Een belangrijk onderdeel van valrisicobeoordeling is de evaluatie van fysieke prestaties en mobiliteit. Verminderde fysieke prestaties en leeftijdgebonden afname van spiermassa en spierkracht (sarcopenie) worden geassocieerd met een verhoogd risico op fracturen. In de klinische praktijk wordt een evaluatie van het fysiek functioneren vaak gebruikt voor het beoordelen van het valrisico bij ouderen. Echter, we hebben weinig kennis over het fysiek functioneren van FLS patiënten. In Hoofdstuk 4 beoordeelden we het fysiek functioneren en de prevalentie van sarcopenie bij FLS-patiënten met een recente fractuur in vergelijking met een gezonde referentiepopulatie van dezelfde leeftijd en geslacht. De fysieke prestaties werden beoordeeld met de volgende testen: de Chair Stand Test (CST), handknijpkracht (HGS), Timed-Up-andGo (TUG), 6-minuten-wandel-test (6MWT); het percentage patiënten met sarcopenie werd berekend volgens de EWGSOP2-richtlijnen: 1. waarschijnlijke sarcopenie, bepaald door een lage CST of HGS score en 2. ernstige sarcopenie gedefinieerd als waarschijnlijke sarcopenie plús een lage spiermasse uitgedrukt in “appendiculaire lean mass”. Referentiedata van gezonde populaties werden verkregen door middel van literatuuronderzoek. Het aandeel FLS-patiënten met verminderde of slechte prestaties op de functietesten, in vergelijking met referentiedata, werd berekend met behulp van Z-scores. We definieerden een Z-score ≥-2SD tot <-1 als “verminderd presteren” en <-2 SD als “slecht presteren”. Op basis van een normale verdeling werd het verwachte aandeel verminderde en slechte prestaties geschat op 16%. Associaties tussen de Z-scores en fractuurtype, geslacht, leeftijd en tijd sinds de fractuur werden beoordeeld. In totaal werden 1789 opeenvolgende FLS-bezoekers bestudeerd met een mediane leeftijd (IQR) van 66 (59-74) jaar en een totaal van 70,7% vrouwen. De evaluatie van het val- en fractuurrisico op de FLS vond gemiddeld 3,9 (±1,6) maanden na de fractuur plaats. De prevalentie van verminderde of slechte prestaties voor CST, HGS, TUG en 6MWT was respectievelijk 39,2%, 30,4%, 21,9% en 71,5%. Ernstige sarcopenie werd gevonden bij 3,3% van de mannen en 2,5% van de vrouwen. Het aandeel patiënten met waarschijnlijke sarcopenie was respectievelijk 30,9% en 42,8%. Lagere testscores voor CST, TUG en 6MWT, maar niet voor HGS, werden gevonden bij patiënten met een heup- of andere ‘major’ fractuur, of ≥1 prevalente wervelfractuur in vergelijking met patiënten met andere fracturen. Het hoge aandeel patiënten met verminderde of slechte prestaties werd gevonden in alle leeftijdsgroepen en zowel bij mannen als bij vrouwen. We concludeerden dat de fysieke prestaties van FLS-patiënten van zowel mannen als vrouwen en van alle leeftijden significant lager waren op verschillende domeinen van fysiek functioneren in vergelijking met de gezonde referentiepopulatie van dezelfde leeftijd en geslacht. Deze bevindingen benadrukken de noodzaak om de fysieke prestaties van FLS-patiënten te beoordelen en te verbeteren. De lage prevalentie van ernstige sarcopenie was opmerkelijk en komt overeen met de EWGSOP2richtlijnen, waarin wordt gesuggereerd dat vaststelling van waarschijnlijke
sarcopenie het meest relevant is voor de beoordeling van sarcopenie, en dat de aanvullende ALM-meting van minder groot belang lijkt te zijn.
Fysieke capaciteit (PC) en fysieke activiteit (PA) zijn met elkaar geassocieerde fysieke prestatiematen. PC meet objectief de fysieke prestaties met specifieke testen zoals de CST, de TUG of de 6MWT, en PA wordt gedefinieerd als “elke beweging van het lichaam die energie verbruikt”. Samen worden PC en PA metingen gebruikt om fysieke prestaties te categoriseren in het eerder gepubliceerde “can do, do do”-model. In de laatste twee hoofdstukken (Hoofdstuk 5 en 6) van dit proefschrift onderzochten we met behulp van dit model de fysieke prestaties van patiënten die de FLS bezochten. PC werd gemeten door de 6-minuten-wandel-test (can’t do/can do) en PA door de MOXaccelerometer (don’t do/do do). De volgende kwadranten werden gedefinieerd op basis van vooraf vastgestelde afkapwaarden voor slecht functioneren: 1. “can’t do, don’t do”; 2. “can do, don’t do”; 3. “can’t do, do do”; 4. “can do, do do”.
In Hoofdstuk 5 beoordeelden we eerst of het model bruikbaar was om FLSpatiënten in verschillende groepen met specifieke patiëntkenmerken in te delen, met name specifieke val- en fractuurrisicofactoren. De PC en PA van 400 FLSpatiënten met beschikbare 6MWT- en MOX-gegevens werden beoordeeld. De gemiddelde leeftijd van de patiënten was 64 jaar en 70,8% was vrouw. De patiënten presenteerden zich als volgt: 8,3% “can’t do, don’t do”; 3,0% “can do, don’t do”; 19,3% “can’t do, do do”; 69,5% “can do, do do”. PC- en PA-metingen toonden aan dat deelnemers in de “can’t do” groep bijna tien keer meer kans hadden om te worden ingedeeld in de “don’t do” groep vergeleken met de “can do”-groep (OR 9,76, 95% CI: 4,82-19,80). Van alle “don’t do”-deelnemers was slechts 3% ingedeeld in de “can do, don’t do” groep, wat betekent dat ze in staat waren fysiek actief te zijn, maar dat niet deden. Slechts 4% van alle “can do” deelnemers was echter in deze groep ingedeeld, wat aangeeft dat als de FLS-populatie fysiek capabel is, ze vaak ook fysiek actief is. Een breed scala aan patiëntkenmerken werd vergeleken tussen de groepen. Zowel de “can’t do, don’t do” als de “can’t do, do do” groep verschilde significant van de “can do, do do” groep op verschillende val- en fractuurrisicofactoren, waaronder lagere functionele capaciteitsmetingen op alle fysieke functietesten, meer gebruik van loophulpmiddelen en een hoger aandeel osteoporose (bij mannen en vrouwen). We concludeerden dat het “can do, do do” model in staat is fractuurpatiënten met specifieke patiëntkenmerken te identificeren. Van alle FLS-patiënten bestaat 20% uit de “can’t do”, maar “do do” groep, met een hoge prevalentie van valrisicofactoren vergeleken met personen in de “can do, do do” groep, mogelijk heeft deze groep daarmee een hoger risico op vallen.
In Hoofdstuk 6 werd het “can do, do do”-model vervolgens gebruikt om de associatie tussen domeincategorisatie en toekomstige val-, fractuur-
en mortaliteitsuitkomsten in dezelfde FLS-populatie van 400 patiënten te beoordelen. Onderzochte uitkomsten waren de eerste val (na 3 jaar follow-up, gemeten met valdagboeken), de eerstvolgende fractuur en mortaliteit (uitkomst op basis elektronische patiëntendossiers na 6 jaar (verlengde) follow-up). Van de 400 opgenomen patiënten had 61,5% een eerste val, 20,3%, een volgende fractuur en 4,9% was overleden. Domeincategorisatie met behulp van het “can do, do do” model was in multivariate Cox-regressieanalyse niet geassocieerd met tijd tot de eerste val, de eerste volgende fractuur of mortaliteit. Daarnaast waren individuele PA- en PC-metingen niet geassocieerd met de drie uitkomsten in multivariate analyse. We concludeerden dat het categoriseren van patiënten in een tweedimensionaal model ontoereikend lijkt om deze complexe, multifactoriële uitkomsten te bestuderen. Een gepersonaliseerde aanpak op basis van de bekende risicofactoren voor vallen en fracturen is waarschijnlijk te verkiezen.
Hoofdstuk 7 bediscussieert de algemene bevindingen van dit proefschrift en biedt aanbevelingen voor toekomstig onderzoek en beleid.
In this thesis, we explored fall and fracture risk factors in patients with a recent fracture and in those who visited the Fracture Liaison Service (FLS) for secondary fracture prevention. Optimizing fracture prevention has gained significant attention in recent decades due to the rising societal, medical, and economic burdens caused by falls and fractures in an aging population. Patients with a recent fracture face a high imminent risk of subsequent fractures and mortality, making prompt prevention crucial. The FLSs play a key role in organizing this prevention. Research on fall prevention often focuses on older adults, osteoporotic populations, or the general fracture population. However, the FLS population is distinct with regard to the imminent subsequent fracture risk, with many patients under 65 years old, non-osteoporotic, with less severe fractures. All FLS patients have a recent fracture, mostly caused by falls, which makes the population relatively homogeneous. However, the underlying causes of the falls and fractures vary, necessitating a personalized approach to evaluation and treatment rather than a one-size-fits-all strategy. Despite this diversity, falls history and risk factors remain crucial indicators for predicting future falls and fractures. Unfortunately, fall assessments and interventions have not been fully implemented at FLSs. Furthermore, there is limited knowledge about the timing of falls post-fracture, physical performance of the patients, and the association between fall risk factors and clinical outcomes. Thus, clinicians lack information on adequate personalized evaluation and treatment. This thesis aimed to deepen the understanding of fall and fracture risk factors in FLS patients, with a focus on physical performance measures, in order to achieve a more personalized evaluation and treatment.
In this thesis, we found that not only an imminent fracture and mortality risk, but also an imminent fall risk is present in patients with a recent fracture. This means that the fall risk is highest in the first few years after fracture and declines afterwards. We found this imminent fall risk in all ages, both sexes and all index fracture types. The time pattern of this imminent fall risk was similar to that of the imminent subsequent fracture and mortality risk. In terms of fall risk predictors, our results showed that the proportion of (consecutive) FLS patients with a lower physical performance and muscle strength was much higher compared to a healthy reference population. This was the case for both the upper- and lower body strength tests, endurance test and combined walking and balance tests for patients with all types of fractures, ages and both sexes. Further, we showed that the “can do, do do framework” (combining a walking ability test with physical activity measurement on a patient level) could be applied to categorize patients into groups with distinct clinical characteristics, including important fall and fracture risk factors. The proportion of patients with low physical activity was small in our prospective cohort, and in this population the four domains of the framework were not associated with the
clinical endpoints falls, fractures or mortality. Moreover, performance on either the walking test or physical activity measurement was also not associated with clinical outcomes when separately analyzed.
In this thesis we introduce “imminent fall risk” as a new concept in the scientific field. The definition of this concept paves the way for further research in this field. By defining imminent fall risk, new research opportunities arise, such as studying this concept in various sub-populations and identifying predictors of imminent fall risk. The high imminent fall risk emphasizes the need for comprehensive falls assessment as part of secondary fracture prevention in the 50+ population with a recent fracture.
Moreover, we were the first to describe physical performance in a large cohort of FLS patients. The high proportion of impaired performance found in FLS patients will hopefully incentivize more researchers to assess falls and physical performance during follow-up of FLS patients. Very few other studies have assessed physical performance measures as a risk factor for clinical outcomes in fracture patients specifically. Low physical performance is already a risk factor in broader (general, older, or osteoporotic) populations, and is added to prediction models for future fractures. However, our findings suggest that measures of walking capability and physical activity might not effectively differentiate between high and low-risk patients for future falls and fractures within the FLS.
This thesis included the first assessment of the “can do, do do” framework in fracture patients. This framework does provide insight into the physical performance of FLS patients and the related fall and fracture risk factors in specific groups, but the added benefit is low compared to individual evaluation of the walking ability and other fall and fracture risk factors. Furthermore, the testing of the framework is time and cost consuming for both the care provider and patient. Therefore, although categorization of subgroups was successful, the lack of associations with clinical endpoints suggests that clinical applicability of this framework is low.
All in all, in this thesis we did not (yet) manage to provide an answer to the question “Who will fall, and who will fracture again?”. Future studies should explore other discriminatory patient characteristics for future falls and fractures.
The findings in this thesis provide valuable insights into the patterns and risk factors for falls, which are essential for clinicians to understand. Our research
emphasizes the significance of conducting early fall risk assessment during fracture evaluation, and clinicians should consider to either perform these assessments themselves or refer patients to specialized clinics. Clinicians also play a crucial role in educating patients about their risks and encouraging them to participate in exercise interventions.
The widespread imminent fall risk and impaired physical performance among fracture patients indicate that age, sex, and fracture type are not helpful in discriminating patients who need fall risk assessments. Thus, our findings support the current guideline recommendations for fall risk assessment in all fracture patients, including a brief assessment in those aged 50-65. Moreover, it emphasizes the importance of physical performance assessment, as most patients score low on one or more tests. However, it is important to note that more research is needed on the predictive ability of physical performance tests and cost-effectiveness of exercise interventions in FLS patients.
As stated, the data on imminent fall risk and physical performance measures can be used to inform patients of their imminent fall risk and motivate them to participate in fall risk assessments and to adhere to preventive recommendations. The thesis’s insights empower patients to actively participate in their fall prevention strategies, especially on the short-term by focusing on exercises that improve their strength and balance. Although this approach has not yet been proven to be effective in FLS patients, exercise is known to enhance overall health and reduce fall risk in general populations.
On a societal level, this thesis advocates for greater awareness of imminent fall risk and low physical performance in 50+ fracture patients, particularly in individuals between 50 and 65 years of age and in those with minor fractures, iin whom it was, up till now, less expected. Our results highlight the necessity for health care institutions and national health policymakers, to allocate organisational and financial recourses for further research on fall risk determinants and intervention strategies, with the ultimate goal of implementing effective falls prevention measures at the FLS, or referral clinics. Falls prevention offers potential to reduce falls and fracture related expenditure and to improve patient care and quality of life. Additionally, the findings that a higher fall and subsequent fracture risk and decreased physical performance are present in younger patients of working age, reveals the potential societal costs associated with fall and fracture-related incapacity to work. These
findings provide policymakers with additional financial motivation to prioritize fall prevention for fracture patients.
This thesis also assessed other fracture risk factors. The use of proton pump inhibitor (PPI), a commonly prescribed medication to decrease stomach acid production, has been associated with an increased fracture risk. There are some side effects of PPI use that could theoretically lead to alterations in the structural properties of the bone (for instance lower bone mineral density), which are often referred to as contributing factor for this higher fracture risk. In this thesis we found that PPI use was not associated with structural alterations in bone microarchitecture and strength. Our study adds to the scientific field that the fracture risk associated with PPI use is unlikely to be due to a deterioration of the bone structure. There might be other explanations for why PPI use is associated with fractures, for instance through a higher fall risk in patients that use PPI’s. Clinicians can consider this while evaluating falls and fracture risk factors at the FLS. However, before these results are definitively implemented in clinical care and recommendations to patients, our findings should be confirmed by other studies.
To conclude, this thesis underlines the need for adequate fall risk assessment in FLS patients. The risk of subsequent falls and fractures is high (especially on the short term) and physical performance is impaired in many FLS patients. Moreover, patients with minor fractures and patients aged 50-65 years old also have an increased risk compared to healthy individuals of the same age and sex. Additional research is needed to determine predictors of falls in fracture populations and to distinguish who will fall and who will fracture again.
List of publications and PhD portfolio Dankwoord Curriculum Vitae
List of publications and PhD portfolio
Publications
Scientific publications included in this thesis Year
Schene, M. R., Meijer, K., Cheung, D., Willems, H. C., Driessen, J. H. M., Vranken, L., Wyers, C. E. (2023). Physical Functioning in Patients with a Recent Fracture: The “Can Do, Do Do” Framework Applied to Explore Physical Capacity, Physical Activity and Fall Risk Factors. Calcif Tissue Int, 113, 195–206.
Schene, M. R., Wyers, C. E., Driessen, J. H. M., Souverein, P. C., Gemmeke, M., van den Bergh, J. P., & Willems, H. C. (2023). Imminent fall risk after fracture. Age Ageing, 52(10), afad201.
Schene, M. R., Willems, H. C., Driessen, J. H. M., Vranken, L., Heersprink, F. O. L., Janzing, H. M. J., Wyers, C. E. (2024). Physical performance and sarcopenia assessment in patients with a recent fracture visiting the Fracture Liaison Service. Osteoporos Int. 35, 851–862.
Schene, M. R., Bevers, M., van der Vijgh, W. J. F., Driessen, J. H. M., Vranken, L., van der Velde, R. Y., van den Bergh, J. P. (2024). PPI use is not associated with bone microarchitecture and strength assessed with HR-pQCT after three-years follow-up in patients visiting the Fracture Liaison Service. Bone, 117066.
Schene, M. R., Wyers, C. E., Driessen, J. H. M., Vranken, L., Meijer, K., van den Bergh, J. P., & Willems, H. C. (2024). The “Can Do, Do Do” Framework Applied to Assess the Association between Physical Capacity, Physical Activity and Prospective Falls, Subsequent Fractures, and Mortality in Patients Visiting the Fracture Liaison Service. J Pers Med, 14(4), 337.
Scientific publications not included in this thesis
Ter Horst, K. W., Schene, M. R., Holman, R., Romijn, J. A., & Serlie, M. J. (2016). Effect of fructose consumption on insulin sensitivity in nondiabetic subjects: a systematic review and meta-analysis of diet-intervention trials. Am J Clin Nutr, 104(6), 1562-1576.
2023
2023
2024
2024
2024
2016
Non-peer reviewed
Schene, M. R., Wyers, C.E. & van den Bergh, J. P. (2023). Vancouver, Canada - Young investigator Award en mondelinge presentatie voor onderzoek over de timing van valincidenten na een fractuur van Merle Schene. VieCuri Academy Magazine
Schene, M. R., Wyers, C. E., Driessen, A. M. H., Souverein, P. C., Gemmeke, M., van den Bergh, J. P., & Willems, H. C. (2023). Abstract, imminent valrisico na een fractuur. Osteoporose Journaal
2023
2023
University Allied for Essential Medicine-NL & Aidsfonds (2016). Background paper ‘Global health for Sale’ - Dutch Leadership on Access to Affordable Medicines and Innovation”. Presented at the National conference ‘Health for Sale’, The Hague, The Netherlands 2016
Portfolio
(PhD) Courses Year
Workshop Pitch Perfect Profiling for PhD candidates 2021
EndNote advanced workshop 2021
Scientific writing, VieCuri 2021
Statistics and SPSS I and II, VieCuri 2021
GCP Course 2022
Survival analysis, Maastricht University 2022
Introduction into R, Maastricht University 2023
Clinical prediction models, Masters of Epidemiology, Maastricht University 2023
Seventeenth Endocrine Fellows Forum, Vancouver, Canda 2023
Monthly meetings - Amsterdam UMC, Geriatrics Year
Monthly research meetings 2021-2024
Monthly ValOM research meetings 2021-2024
Monthly Journal Club – Promovendi overleg 2021-2024
Attended (Inter)national Conferences Year
Dutch geriatric days, Den Bosch, The Netherlands 2020
National fall symposium, Amsterdam, The Netherlands 2020
National fall symposium, Amsterdam, The Netherlands 2021
Werkgroep Interdisciplinaire Osteoporose (IWO) meeting 2021
Dutch geriatric days, Den Bosch, The Netherlands 2022
Annual conference of The American Society for Bone and Mineral Research (ASBMR), online 2022
Dutch ASBMR, Zeist 2022
National fall symposium, Amsterdam, The Netherlands 2022
IWO meeting 2022
Dutch geriatric days, Den Bosch, The Netherlands 2023
Annual conference of the ASBMR, Vancouver, Canada 2023
IWO meeting 2023
Oral presentations Year
Dutch Geriatric days - UGT2B7, CYP3A4 and SLC22A1 polymorphisms modify the association between opioids and fall risk 2020
Dutch ASBMR - Functional performance and sarcopenia in FLS patients 2022
Dutch ASBMR - ASBMR poster session: sharing knowledge and critical reflection, presenter and moderator 2022
National fall symposium - Can do do do framework to explore physical performance in FLS patients 2022
Annual conference of The ASBMR, Vancouver, CanadaImminent fall risk after fracture 2023
Poster presentations Year
National fall symposium - UGT2B7, CYP3A4 and SLC22A1 polymorphisms modify the association between opioids and fall risk 2020
Annual conference of The ASBMR (online) - Functional performance and sarcopenia in FLS patients 2022
National fall symposium - Functional performance and sarcopenia in FLS patients 2022
Dutch Geriatric days - Functional performance and sarcopenia in FLS patients 2023
Annual conference of The ASBMR 2023, Vancouver, Canada - Can do do do framework to explore physical performance in FLS patients, PPI use is not associated with bone microarchitecture and strength assessed with HR-pQCT after three-years follow-up in patients visiting the Fracture Liaison Service 2023
Endocrine Fellows Forum, 2023, Vancouver, Canada - Imminent fall risk after fracture 2023
Other presentations Year
Research meeting Geriatrics AMC - Imminent fall risk 2021
ValOM research meeting AMC - Functional performance in patients with a recent fracture 2022
Research Meeting Geriatrics AMC - Can do do do framework to explore physical performance in FLS patients 2022
V&VN annual meeting - Fall risk in FLS patients 2022
Wetenschapsweek VieCuri - Can do do do framework to explore physical performance in FLS patients, Functional performance and sarcopenia in FLS patients (posters and oral presentations) 2022
Research meeting Geriatrics AMC - Imminent fall risk after fracture 2023
Wetenschapsweek VieCuri - Imminent fall risk after fracture, PPI use is not associated with bone microarchitecture and strength assessed with HR-pQCT after three-years follow-up in patients visiting the Fracture Liaison Service (posters and oral presentations) 2023
Teaching and other activities Year
Supervision Scientific Internship Masters of Medicine, Julia Dröge 2022-2023
Polyfarmacie werkgroep onderwijs, Bachelor of Medicine Univeristy of Amsterdam 2024
Coordinator of PhD Intervision meeting PhD’s, Amsterdam UMC, Geriatrics 2023-2024
Coordinator of the monthly research meeting, Amsterdam UMC, Geriatrics 2023-2024
Parameters of Esteem Year
National Fall Symposium, Amsterdam, The Netherlands - Oral presentation Awards 2022
Annual conference of ASBMR, Vancouver, Canada - Young Investigators Award 2023
Endocrine Fellows Forum, Vancouver, Canada - Travel grant 2023
Imminent fall risk after fracture - Editors choice December 2023, Age and Aging 2023
Dankwoord
Het schrijven van een proefschrift is nooit een individuele prestatie. Dit proefschrift en de weg daarheen zouden onmogelijk zijn geweest zonder de hulp en steun van vele mensen. Ik ben hen daarvoor erkentelijk en wil graag een aantal mensen persoonlijk bedanken.
Allereerst mijn promotoren, Veel dank dat jullie dit traject met mij zijn aangegaan. Wat een geluk heb ik gehad met jullie als kundig, doelgericht, enthousiast en warm team. Jullie vertrouwen, steun en flexibiliteit gaven mij de ruimte om het werk te combineren met de hoge pieken en diepe dalen van persoonlijk roerige jaren. Ik kijk met bewondering terug op jullie rotsvaste begeleiding, zelfs op afstand. Veel dank.
Beste Joop, dankjewel dat ik deel mocht uitmaken van jouw onderzoeksgroep. Ik heb ontzettend veel van je geleerd. Je scherpe blik, altijd nieuwe ideeën en enthousiasme waren inspirerend. Veel dank voor het delen van je kennis, het snelle schakelen en de geboden uitdagingen en mogelijkheden in deze jaren. Sorry dat Vancouver zonder wijn en sushi moest deze keer.. Wie weet een volgende!
Lieve Caroline, jouw vraag: “Wat wil je nu echt weten, wat gaan we nu precies doen?” Jij wist altijd weer een lijn te trekken door mijn zwabberende, 300% willen en alles betrekkende gedachtegang. Dank dat je mij bij de les hield. Dank voor je sturing, je benaderbaarheid en je betrokken begeleiding. Voor je oog voor detail. Dank voor je rust en geduld. Wie wist dat België en Amsterdam zo dicht bij elkaar lagen?
Lieve Hanna, koffie op het voetenplein, Capo? Een van je vele appjes de afgelopen tijd. Maar ook hoe mijn keuze voor de ouderengeneeskunde, even tussendoor, informeel, met jou werd besproken tijdens mijn verbredend coschap jaren geleden. Je weet je deskundige begeleiding feilloos te balanceren met een grote, persoonlijke en warme betrokkenheid. Altijd tijd (hoe doe je het?), enthousiast, vol interesse, levenswijsheden en lessen, zowel als arts en onderzoeker, als ver buiten de geneeskunde. Dank voor je grote voorbeeld.
De leden van de promotiecommissie wil ik hartelijk danken voor het lezen en beoordelen van mijn werk, en de bereidheid mijn verdediging mogelijk te maken.
Beste Nathalie, dankjewel voor je enthousiaste en zeer leerzame kennismaking met wetenschappelijk onderzoek tijdens mijn master. Én voor je tip aan Hanna om mij te laten solliciteren voor deze positie.
Aan mijn mede-auteurs, Annemariek, voor alle wiskundige en statische bijdragen en inzichten. Voor je interesse, je geduld en didactisch vermogen. Voor je kritische blik en relaxte houding. Voor de ontzettend fijne samenwerking.
Melissa, voor je geweldige samenwerking in de PPI studie. Een super collega van wie ik veel heb geleerd, een zeer goede reisvriendin in Canada, immer vrolijk en energiek.
Professor Van der Vijgh, beste Wim, voor de ideeën, de belangrijke rol in de uitwerking en het grote enthousiasme in de samenwerking bij de PPI studie.
Patrick Souverein, Marle Gemmeke, Lisanne Vranken, Robert van der Velde, Kenneth Meijer, Donald Cheung, Okke Lambers Heersprink, Heinrich Janzing, voor jullie meedenken, meeschrijven en zeer gewaardeerde bijdragen aan de publicaties.
Aan mijn paranimfen, Sabine en Melissa (en Bente!), voor jullie hulp bij deze belangrijke dag.
Aan Luc en Jasper, voor de vormgeving.
Aan alle patiënten die participeerden in de FX MoVie studie. Bedankt!
Aan mijn mede-promovendi, postdocs en collega’s van het AMC en VieCuri, Vera, Marije, Oscar, Anouschka, Hanne-Eva, Sara, Stephanie, Soukaina, Eline, Joost, Lotta, Janet, Isabelle, Bob, Wesna, Kim, Samira, Anke, Paulieke, Thamar, Marsha, Veerle en Melissa, voor de vele gezellige en leerzame uren, werkend en vooral ook niet-werkend. In het bijzonder de Fab Five (inmiddels Ten?). Jullie immer geïnteresseerde en kritische blik en bijzonder grondige voorbereiding heeft mijn werk ontegenzeggelijk veel beter gemaakt. Dank voor jullie lessen en input! Vera, wat ben ik blij dat Hanna dacht dat wij zouden matchen, en wat had ze gelijk. Marlien, voor alle hulp en ondersteuning.
Aan alle clinici van de ouderengeneeskunde AMC, dat ik zoveel jaren op de afdeling thuis mocht zijn, voor de open en leerzame sfeer. Mede door jullie ben ik ongelooflijk trots dat ik internist ouderengeneeskunde mag gaan worden.
Bedankt!
Aan mijn vrienden, zichtbaar en onzichtbaar hebben jullie allen bijgedragen aan dit proefschrift.
Maartje, Vera, Sabine, Lisa, Mirjam en Maurits, voor jullie trouwe vriendschap in de dik 12 jaar dat wij samen het artsenpad bewandelen, Maurits voor je statistische inzichten en spontane crash courses, Veer, Sab en Mir, voor de vliegende start toen we onze studietijd mochten voortzetten als PhD collega’s in de corona-thuiswerktijd (wat een onverwacht cadeau).
Joline voor het lachen en de tranen, Max en Suus, voor jullie vriendschap.
Westsiders, voor jullie warme welkom, klushulp en wijze ouder-lessen. Afra, Liesje, Bente en Ellemijn. Bineke, Heleen, Chiara, Emmy, Elza en Sietske. Mijn vriendinnen, mijn familie. Hoe belangrijk en waardevol is elk van jullie voor mij geweest. Jullie hebben de meest verdrietige tijden draaglijk gemaakt, de goede tijden nog veel beter, en verrijken mijn leven dagelijks.
Bedankt!
Aan mijn schoonfamilie, voor jullie betrokkenheid, open armen en huizen en jullie warme steun. Voor jullie geweldige zoon en broer. Miek, voor je no-nonsense opvoeding, je creativiteit en avonturen.
Aan mijn zus en broer, Kiry en Imre, voor dat ik altijd net een stapje harder moest lopen om jullie bij te kunnen houden (vaak letterlijk).
Voor jullie voorbeeld en jullie vriendschap.
Aan mijn ouders, voor ons thuis vol met boeken, filosofie, kunst en cultuur, voor jullie harde werken voor ons leven vol mogelijkheden.
Lieve mama, voor je voorbeeld van levenslust, je moed en doorzettingsvermogen. Dat je er altijd, altijd bent. Dat je hebt laten zien dat je moeder en specialist kan zijn. Voor je revisies.
Bedankt!
Lieve papa. Je moet worden wie je bent. Zelfbeschikking, zelfreflectie en zelfverbetering. Ontwikkel je, werk hard, zoek leuke en interessante mensen op, en je zal vast ook leuke en interessante dingen gaan doen. Met jou de wereld ontdekken, je serieuze frons in je stoffige, overvolle professorstudeerkamer, je waardevolle lessen en gezelschap tijdens de wandelingen in onze bonustijd samen in mijn eerste promotie maanden. Ik mis je.
Lieve Diederik, jij bent alles. Samen kunnen wij de wereld aan. Bedankt voor je eeuwige steun en meedenken, voor je rust, je planning en controle. Voor onze uitspattingen en avonturen. Bedankt voor ons heerlijke thuis, ons mooie leven samen en voor onze dochter. Lieve Philou, hoe geweldig dat jij er bent. Ik hou van jullie.
Merle Schene was born on December 9th in 1992, in Utrecht, The Netherlands. In 2011, she graduated cum laude at the Christelijk Gymnasium Utrecht. She began her medical training at the University of Amsterdam (UvA), where she earned her Bachelor’s in Medicine with honors from 2012 to 2015. Merle completed her Master’s in Medicine at the UvA between 2016 and 2019, during which see undertook a series of specialized internships in geriatric medicine, internal medicine and intensive care medicine. Her education also included several research projects and international experiences in Spain, Suriname, Nepal and Sri Lanka.
During her studies, Merle was actively involved in various extracurricular activities, including leadership roles in Universities Allied for Essential Medicine (UAEM)-The Netherlands. In this role, she organized educational courses on access to affordable medicine at the UvA, Bildung Academy and the Vrije Universiteit, as well as a national conference entitled ‘Health for Sale’ to inform Dutch politicians and policy makers about costs of medicines and alternative research and development methods. This conference was organized in collaboration with Aidsfonds and Health Action International, and earned her the 2015 UAEM-International Award for best campaign action.
After completing her studies, she began her career as a medical doctor in Clinical Geriatrics at Tergooi Ziekenhuis, and Internal Medicine at Ziekenhuis Gelderse Vallei. Since May 2021, Merle has been engaged in PhD research at the Center of metabolic bone disease of the department of Internal Medicine at VieCuri Medisch Centrum, in collaboration with the Geriatrics department at the Amsterdam UMC and Maastricht University. Her research focusses on falls, physical performance and bone quality in patients with a recent fracture. During her PhD, she presented her research at several national and international conferences and received several awards, including the Young Investigator Award at the 2023 American Society of Bone and Mineral Research conference. Following her PhD, she started her residency Internal Medicine December 1st 2024 in the Diakonessenhuis in Utrecht.