278 10-Year Average 82% OF ALL DROWNING DEATHS WERE MALES 40% WERE
83
Justin Scarr Chief Executive Officer
Royal Life Saving – Australia
Adam Weir Chief Executive Officer
Surf Life Saving Australia
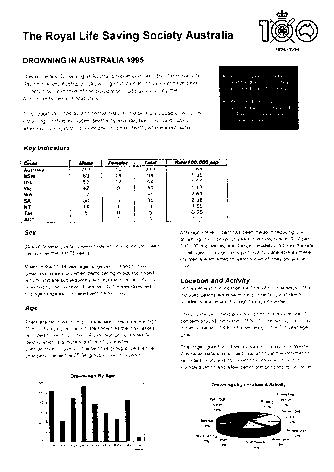
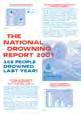
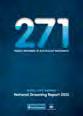
The National Drowning Report 2024 provides analysis of fatal drowning across Australia between 1 July 2023 and 30 June 2024. Tragically, 323 people lost their lives to drowning last year, an increase of 16% on the ten-year average.
Drowning has a devastating impact on so many people, families and communities. Drowning affects thousands of lives, including those who live with the consequences of non-fatal drowning.
This analysis is designed to inform all groups, including governments, who seek to reduce drowning risk and build resilience by implementing evidence-informed measures that address the vulnerabilities, exposures and hazards that make some populations at greater risk of drowning.
30 years of reporting drowning data
This year’s report, the 30th edition, is the second National Drowning Report developed by Royal Life Saving – Australia presented in partnership with Surf Life Saving Australia. By working in partnership, we aim to create efficiencies, remove the confusion of different data, and maximise the impact of the report on community awareness and policy action.
The 2024 fatal drowning rate is 29% lower than that of 1995, but the number of people who die from drowning each year remains tragically high between 260 - 330 annually. While strong progress has been made, it appears to have plateaued in recent years and we need to address two things.
1. The way Australians are enjoying the water is changing People are seeking out new places to enjoy the water, avoiding crowds and often in regional areas. Climate change is altering weather patterns, and major shifts in work and leisure, are extending the times of day and months that we swim. An ethnically diverse population means that community vulnerabilities to drowning are becoming more complex. As our community’s love for the water evolves, so too must our surveillance and rescue systems. It is essential that lifesaving services have the resources to adapt to these changes.
2. Is it acceptable that we may no longer be a nation of swimmers? We fear that swimming skills are going backwards and are perhaps lowest since large scale investments in school-based activities in the 1960s – 70s. Many families lack the means or access to private lessons, and schools are often unable to provide the safety net they once did. When families can afford lessons, their children start younger, but often drop out before learning critical lifesaving skills that are designed to keep them safe as teenagers.
Lifesaving awards like the RLSSA Bronze Star and Bronze Medallion, and SLSA Surf Rescue Certificate, commonly delivered through high schools or community groups, play a valuable role in building resilience to drowning, and have helped to keep previous generations safe around the water. It is essential that a long-term plan is actioned to reverse this trend. Access must be boosted, especially for children and adolescents, and those from refugee and migrant backgrounds.
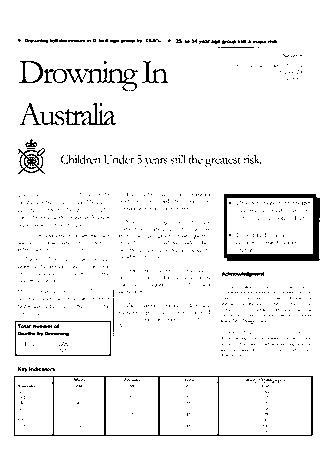
Drowning fatalities in young children continue to decrease
Reducing drowning in young children (0 - 4 years) is perhaps our greatest long-term success, reducing by 25% below the 10-year average. Legislative changes, environmental redesign (pool fencing), education and research have combined to turn around what was described as a national disgrace.
Ten- to twenty-year-olds
Our lowest rates of drowning are in 10-year-old children. However, research shows that things go wrong after 10, as drowning rates increase more than tenfold by the age of 20 years. COVID-19 pool closures have amplified this problem.
Late teens are notoriously hard to reach with awareness campaigns, meaning we must take the opportunity to build swimming and lifesaving skills in children 8-14 years. We need to teach smart decision making and build layers of resilience through swimming, basic rescue and lifesaving skills. Our high schools and community groups should be on the lookout for kids who can’t swim and have access to the resources to build swimming and lifesaving skills before it’s too late.
Beach-related drowning deaths
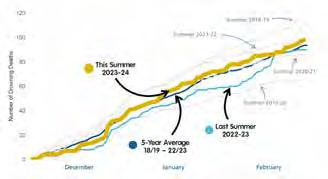
It has been a truly tragic year on our beaches, especially late in the summer, with February recording more deaths than average. Drowning deaths at beaches increased by 45% compared to the 10-year average and increased by 12% from last year. Rip currents continue to be the number one hazard and are a known contributing factor in more than 35% of beach drowning deaths.
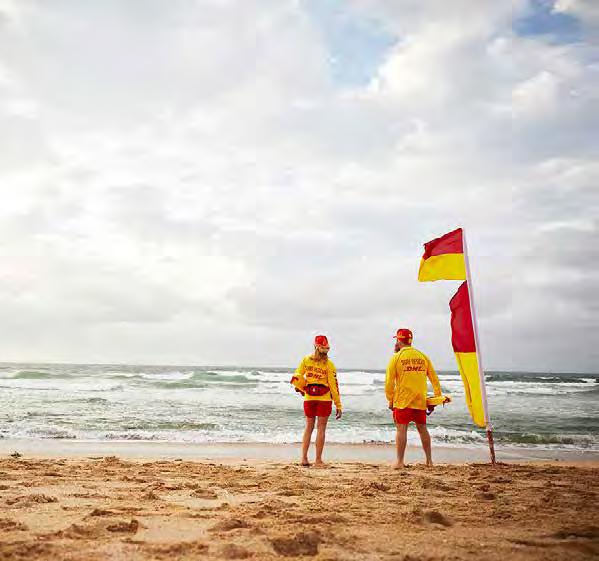
Swimming away from surf lifesaving services has again been a major risk. While we continue to reinforce the importance of swimming at patrolled beaches, between the red and yellow flags, we are expanding coverage outside of traditional hours and locations with the provision of support services and surveillance. If you can’t swim, we encourage you to ask lifeguards for advice or review safety signs.
Migrants
The report shows that 83 (25%) of the drowning deaths were people born overseas. Our long-term research estimates that this rate is as high as 34%. The first months and years in Australia are critical for building awareness, knowledge and skills to boost drowning prevention. We have seen tragic incidents in people arriving from countries like India, China and Nepal. The communities themselves are leading the way by raising awareness and promoting swimming and water safety programs. Key policy changes can help to ensure migrants, refugees and international students have early access to structured skill building programs in their local communities.
Regional and remote communities drown at higher rates
This year we’ve added analysis to identify the metropolitan and regional areas with the highest rates of drowning. Regional areas like the Top End in the NT, Torres and Cape in QLD, and Kimberley in WA have drowning rates 4-6 times the national average. In our cities, Darwin, Sunshine Coast, Hobart, Gold Coast and South Perth feature in the top 5, often with rates many times higher than the national average.
Some local governments are responding by implementing community drowning prevention plans, investing in frontline services, and investing in local swimming pools. Infrastructure and program support is much needed across all layers of government.
Drowning rates and numbers increase again from age 65
Adults 65 years or older are drowning at rates 2-3 times those of children under five. This age group now equates to 28% of all drowning deaths. Factors include underlying heart or other medical conditions, especially while boating or using watercraft and falls into water. Changing employment and residential patterns, increased participation in sport and recreation, drop offs in safety skills and decreased swimming fitness, may all have contributed to this concerning increase.
Brush up on swimming and water safety skills ahead of summer
It’s frightening to think that many choose to enter the water but lack the skills to float and swim to safety when caught in a current or when they suddenly find themselves in deep water.
We urge Australians to brush up on their swimming skills ahead of summer. Head to the local swimming pool to test your fitness and ability. Be realistic about your chances if something goes wrong in the water. If you can’t swim, set a goal to learn, and take extra caution until you are confident with your skills.
We love the water
We love the water, and want everyone to enjoy our beautiful rivers, lakes, beaches, bays, community pools and backyard swimming pools safely. Water activities, whether boating, surfing, snorkelling, fishing, or swimming with friends, provide unforgettable memories.
Following some simple water safety advice can and does save lives.
Always supervise children in, on and around water
Learn swimming, water safety and lifesaving skills
Wear a lifejacket when boating, rock fishing or paddling
Swim at a patrolled beach between the red and yellow flags
Avoid alcohol and drugs around water
Know the conditions, check the weather
We urge you to join us in sharing water safety messages. Together we can all prevent drowning.
The National Drowning Report (NDR) was established in 1995 to communicate the issue of drowning and to advocate for drowning prevention efforts to governments, media and the public.
While the look, feel, depth and complexity has evolved significantly over time, the purpose of the report remains the same: to increase awareness of drowning risk, provide data that informs and guides prevention efforts, and communicate risk reduction strategies.
Over the past 30 years, these reports have prompted important changes in the way we approach drowning prevention. The NDR has influenced significant policy changes at the National, State/Territory and Local Government level, including pool fencing legislation, boating safety legislation, and aquatic industry supervision policies.
The NDR insights have provided evidence for the Australian National Water Safety Plans and Strategies since 1998, guiding national level priorities and efforts. Several iterations of the NDR have also informed multiple State/Territory and community water safety plans, drowning prevention campaigns, conferences and symposiums, and impactful stories in the media that increase public awareness of drowning.
With the release of this 30th edition of the National Drowning Report, we would like to acknowledge the many people who have contributed to these reports and the maintenance of the National Fatal Drowning Database over the years. It is a difficult, often thankless task to read and report on how people have died.
We thank you for your work in ensuring that Australian drowning prevention efforts are guided by data and evidence.
To access the reports: https://www.royallifesaving.com. au/research-and-policy/drowning-research/nationaldrowning-reports
Crude fatal drowning rate per 100,000 population by financial year
*Rates rounded for presentation purposes
This brief section provides an overview of drowning and some guidance on how to approach the data presented in this report. For detailed information on data sources and methods used, please see the methods section on page 96.
What
is drowning?
The globally accepted medical definition of drowning is: The process of experiencing respiratory impairment from submersion or immersion in liquid. [1] Importantly, there are three outcomes for a person who experiences drowning: death, survival with morbidity, or survival with no morbidity. [1] Terms such as “near-drowning,” “secondary drowning,” and “wet/dry drowning” are no longer used.
Fatal and non-fatal drowning
This National Drowning Report includes information on fatal drowning only, that is, people who die from submersion or immersion in water. However, the burden of drowning is not limited to deaths alone. Each year, hundreds of nonfatal drowning events occur in Australia which have a range of outcomes. Sometimes the person who drowns and survives might only need to visit a clinic or hospital for a check. In other instances, non-fatal drowning events result in permanent, lifealtering neurological disability that severely impacts the person who drowns, their family, community, and caregivers. The exact number of non-fatal drowning incidents is difficult to report with precision, which is why improving data systems for non-fatal drowning is a key activity in the Australian Water Safety Strategy 2030. [2]
Understanding this year in context
This report often presents data from the current 2023/24 time period in comparison to a 10-year average. By looking at historical patterns, we can see how this year measures up to what we would expect from previous years, where numbers and rates have increased or decreased, and how the distribution of cases may be changing across different categories.
Throughout the different sections of this report, 2023/24 counts and rates are presented alongside a percent change as an increase or decrease from the 10-year average. This percent change measure is helpful to understand this year in context, as there will always be some random variation year-to-year. When counts are low or the population base for rates is small (e.g., ACT, NT), random variation might seem larger, and the percent change metric could be misinterpreted as a meaningful increase or decrease. Take note when you see percentage changes from a small number of cases or small population, and interpret with caution.
The following sections also include several graphics that show breakdowns by the proportion of cases in a particular group compared to the 10-year average. These figures give an indication of how the distribution of cases this year align or differ with what we have seen historically over the last decade.
Understanding counts, proportions and rates
When analysing drowning data, counts, proportions and rates are frequently presented to offer different perspectives. Each of these measures are useful but serve a distinct purpose. Counts represent the number of drowning events that occur within a given time frame, geographic location, and/or subgroup. Counts are useful for understanding the scope of the problem, communicating about the burden, and for determining the required capacity and scale of services or programs.
While useful for discussing the absolute number of people affected, comparing counts between subgroups, such as age or a geographic region, can make understanding the context of that subgroup challenging.
Sometimes it is helpful to examine the data as a proportion of cases instead. Percentages are often easier to understand and communicate in context, and they allow for simple comparisons between different groups that vary in the number of cases.
Note that throughout the report, proportions are rounded to whole numbers for presentation purposes and therefore may not add to exactly 100%.
While counts and proportions offer important information, drowning rates, presented here as crude fatal drowning rates per 100,000 residents, consider the size of the population at risk.
Rates are especially useful for making comparisons between groups or locations and identifying high-risk populations to guide prevention efforts. Comparing counts alone may be misleading because larger populations are more likely to have higher drowning counts simply due to their size.
By using rates, we can compare the drowning burden across populations that vary in size, allowing us to identify groups that are disproportionately affected by drowning and should therefore be considered a priority for prevention efforts.
The different sections in this report includes counts, proportions and rates. Be sure to take note which type of measure you are looking at.
SECTION ONE: People - Who drowns?
Drowning prevention strategies are most effective when tailored to specific populations and age groups. This National Drowning Report provides details on the people who drowned in 2023/24 to improve understanding of who is at an increased risk and ultimately to help prioritise and direct prevention efforts.
SOCIO-ECONOMIC ADVANTAGE AND DISADVANTAGE
The Index of Relative Socio-economic Advantage and Disadvantage (IRSAD) is a score assigned to geographic areas by the Australian Bureau of Statistics. [3] While a simplification of the realities Australians face every day, the score summarises information about the economic and social conditions of people and households to provide a relative measure of disadvantage (lower score) and advantage (higher scores).
The resident areas of people who drowned in 2023/24 were more or less evenly distributed across the socio-economic spectrum. 15% from the most disadvantaged areas versus 22% from the most advantaged areas. However, the drowning rates per 100,000 population show that those who live in the most advantaged areas drown at lower rates.
It is of note that greater proportions of the children and adolescents under the age of 14 years who drowned this year were from disadvantaged areas compared to those in older age cohorts.
22% OF THE 2,113 PUBLIC AND PUBLICLY ACCESSIBLE AQUATIC FACILITIES IN AUSTRALIA ARE LOCATED IN THE LEAST ADVANTAGED AREAS IN AUSTRALIA
Working towards more equitable access for swimming and water safety education
Of the 2,113 public and publicly accessible aquatic facilities in Australia, 22% are located in the least advantaged areas (IRSAD decile 1 and 2) and 21% are located in the most advantaged areas (IRSAD decile 9 and 10). A total of 1,190 pools or 56% of the total pools in Australia are located in moderately advantaged areas (IRSAD decile 3-8).
[4] Most Australians (89%) live within 20 minutes of a public aquatic facility, with these facilities attracting about 330 million visits per year. [5]
Previous research by Royal Life SavingAustralia found children from more advantaged socio-economic areas represent the majority of children attending private swimming lessons, and they begin doing so at a younger age compared to children from lower socio-economic areas. [6]
Alongside the economic, health and social benefits provided by public and publicly accessible aquatic facilities, these spaces offer swimming and water safety skill development in a more controlled environment, however inequalities in access to swimming and water safety education exist. [1] Supporting change in policy around infrastructure plans, funding availability and developments, is a priority in the Australian Water Safety Strategy 2030. [2]
Crude fatal drowning rate per 100,000 population by IRSAD decile of home residence, 2023/24
Disadvantage Advantage
Drowning deaths by IRSAD decile of home residence, 2023/24
Disadvantage Advantage
*Note: 12% of fatal drowning incidents are an unknown IRSAD score
Drowning deaths by body of water and IRSAD decile, 2023/24
Drowning deaths by age group and IRSAD decile, 2023/24
COUNTRY OF BIRTH
people who drowned were born overseas
For a more detailed analysis of multicultural drowning deaths over the past 10 years, go to page 102-103
Where known, the highest number of people who drowned in 2023/24 were born in
Most people who drowned were not visitors (27%), that is, they drowned within 10 km of where they lived. Visitor status was not available for 32% of cases.
2023/24 drive distance between residence and drowning location At home
REMOTENESS OF HOME RESIDENCE
In 2023/24, the majority of those who died from drowning lived in Major Cities (64%), followed by Inner Regional (23%), Outer Regional (11%), and Remote and Very Remote (2%) Australia. However, those residing in Regional and Remote areas had higher drowning rates compared to those from Major Cities: 36% higher for Inner Regional, 53% higher for Outer Regional, and 64% higher for Remote and Very Remote areas.
Crude fatal drowning rate per 100,000 population by residence remoteness classification, 2023/24
Note 12% unknown residence location
Major Cities of Australia Inner Regional Australia Outer Regional Australia Remote and Very Remote Australia
Young children aged 0-4 years reported a drowning rate of 0.99 per 100,000 population, a 24% decrease compared to the 10-year average of 1.3 per 100,000 population. The sustained decrease in fatal drowning among this age group over the last two decades is encouraging, however it still remains too high.
Children aged 5-14 years reported a drowning rate of 0.43 per 100,000 population, a 30% increase compared to the 10-year average of 0.33 per 100,000 population. Most drowning deaths in this age group resulted from an unintentional fall into water, reinforcing the need for swimming and water safety skills and knowledge to assist in unexpected situations. This was the only age to report more drowning deaths in females rather than males.
People aged 15-24 years reported a drowning rate of 1.17 per 100,000 population, a 16% increase compared to the 10-year average of 1.01 per 100,000 population. Nearly half (43%) of the drowning deaths in this age group occurred 50km or further away from where the person lived, unlike most other age groups that drowned at a location close to their home (<20km), and 26% occurred in January. This suggests that people in this age group may be travelling to unfamiliar locations and environments during the summer and may be unaware or complacent of the water hazards and conditions where they are visiting.
People aged 65 years and over (65+ years) reported the highest numbers, proportions and rates of drowning in most states/ territories, except Victoria. There has been a steady increase in drowning events among older age groups since 2017/18. This year, those aged 75+ years recorded the highest drowning rate of 2.17 per 100,000 of all age groups, an increase of 26% on the 10-year average. Promoting life long swimming and water safety skills and prioritising tailored prevention interventions in this age group is a major priority.
24%
DECREASE COMPARED TO THE 10-YEAR AVERAGE FOR YOUNG CHILDREN 0-4 YEARS
30%
INCREASE COMPARED TO THE 10-YEAR AVERAGE FOR CHILDREN 5-14 YEARS
16%
INCREASE COMPARED TO THE 10-YEAR AVERAGE FOR PEOPLE AGED 15-24 YEARS
26%
INCREASE COMPARED TO THE 10-YEAR AVERAGE FOR PEOPLE AGED 65+ YEARS
2023/24 fatal age-specific drowning rate compared to 10-year average fatal age-specific drowning rate in 5-year age bands
2023/24 number of drowning deaths by 5-year age groups compared with the 10-year average
Fatal drowning numbers and rates for children aged 0-4 years have reduced in recent years. Drowning deaths in the 0-4 year age group represented 5% of all drowning cases in 2023/24; and decreased by 6% from last year (2022/23) and 25% from the 10-year average. The crude fatal drowning rate of the 0-4 year age group in 2023/24 also decreased by 24% compared to the 10-year average.
87% of all drowning deaths in this age group were males. Children aged 1 year accounted for the highest number of drowning deaths in this age group this year, with six children aged 1 year dying from drowning.
27% of drowning deaths among children 0-4 years occurred in the home environment, most commonly in a swimming pool or a bathtub. The leading activity prior to drowning was a fall into water (60%) followed by bathing (27%).
Successful decreases in drowning number and rates in this age group have occurred over the years due to increased public awareness and education, advocacy and research, government policy, and enforcement [7,8]. However, this age group remains a priority area in the Australian Water Safety Strategy 2030. Clear and effective drowning prevention measures for this age group exist, [8,9] and continued focus is required to maintain the successful trends observed over the past two decades [2,7].
Drowning Deaths in 2023/24
20
10-Year Average
0.99
2023/24 Fatal Drowning Rate per 100,000
1.31
10-Year Average
Drowning deaths of children aged 0-4 years by location, 2023/24 Drowning deaths of children aged 0-4 years by activity, 2023/24
Drowning deaths in the 5–14 year age group represented 5% of drowning cases in 2023/24. The number of drowning deaths increased by 40% when compared to the 10-year average. The crude fatal drowning rate of 0.43 per 100,000 population also increased by 30% compared to the 10-year average.
This age group recorded more drowning deaths in females rather than males (60% females), the only age group to do so. By single year, children aged 6 years and 14 years recorded the highest number of drowning deaths.
Drowning deaths in this age group most frequently occurred in a river / creek (43%) and happened as a result of an unintentional fall into water (43%) or when swimming and recreating (21%).
The majority (64%) of drowning deaths among this age group occurred during the summer months, which includes the peak school holiday period, and 50% occurred on the weekend, indicating potentially less supervision and when families may be travelling or going away on holidays. That drowning deaths in this age group were frequently the result of an unintentional fall into water reinforces the need for swimming and water safety skills and knowledge to assist in unexpected situations and in unfamiliar locations.
Drowning
14
Drowning Deaths in 2023/24
0.43
2023/24 Fatal Drowning Rate per 100,000
10
10-Year Average
0.33
10-Year Average Fatal Drowning Rate per 100,000
Drowning deaths of children aged 5-14 years by location, 2023/24
Drowning deaths in the 15–24 year age group represented 11% of all drowning cases in 2023/24. The number of drowning deaths increased by 22% when compared to the 10year average. The crude fatal drowning rate of 1.17 per 100,000 population, also increased by 16% compared to the 10-year average.
This financial year recorded the highest number of drowning deaths and drowning rates for this age group in the previous five years (since 2018/19 n=41, 1.27 per 100,000 population).
Drowning deaths in this age group were mostly among males (82%). Those aged 20 years accounted for the highest number of drowning deaths in this age group (n=8).
39
Drowning Deaths in 2023/24
Drowning deaths most frequently occurred either at a beach (36%) or at a river / creek (31%). The leading activity prior to drowning was swimming and recreating (54%) followed by jumping into water (10%). 32
1.17
2023/24 Fatal Drowning Rate per 100,000
Drowning deaths of young people aged 15-24 years by activity, 2023/24
Drowning deaths of young people aged 15-24 years by location, 2023/24
The spike in drowning rates for ages 10 to 20
Children aged 10 have the lowest drowning rate of any age, but rates increase tenfold in the following decade of life.
The National Swimming and Water Safety Framework provides three benchmarks that should be achieved by ages 6 years, 12 years and 17 years. The aim is that all children by the age of 12 years are able to swim continuously for at least 50 metres; float, scull or tread water for 2 minutes; and perform a survival sequence wearing light clothing. By 17 years they should be able to swim continuously for 400 metres; float, scull or tread water for 5 minutes; and perform a survival sequence wearing heavy clothing. [10]
Swimming and water safety skills are one protective factor for drowning among children through to their teenage years, along with parent supervision, supervision policies at public swimming pools, measures such as pool fencing (even for older children), and life jacket wearing.
Children are usually reliant on their parents/ caregivers to get to aquatic locations such as swimming pools, beaches and rivers, by 20 years people are much more independent and less likely to attend aquatic locations with their parents and more with their friends/peers.
Research suggests that peer influence is more prevalent as people move into teenage years and young adulthood, [7] specifically young males being more likely to partake in risky behaviour around the water, such as jumping into water from a height. [11]
Once people finish school, there is less participation in organised sport and recreation, such as swimming lessons or squads. This is for a range of reasons including study, work, transport and other priorities.
For more information on the benchmarks for 12 years and 17 years visit our website: https://www.royallifesaving.com.au/educateparticipate/swimming/national-swimming-andwater-safety-framework
Crude fatal drowning rate per 100,000 population for ages 10 to 20, 2004/05 − 2023/24
Note this graph shows the 20-year cumulative crude fatal drowning rate from July 2004 - June 2024.
Drowning deaths in the 25–34 year age group represented 13% of total drowning deaths in 2023/24.
The number of drowning deaths (n=41) was equal to the 10-year average. The crude fatal drowning rate of 1.05 per 100,000 population, decreased by 7% compared to the 10-year average.
Males accounted for 83% of drowning deaths in this age group. Those aged 30 years recording the highest number of drowning deaths in this age group.
The leading activity prior to drowning was swimming and recreating (37%). The majority of drowning deaths in this age group occurred at river / creek locations (44%) followed by beaches (20%).
41
Drowning Deaths in 2023/24
0% Change
41
10-Year Average
Drowning
1.05
2023/24 Fatal Drowning Rate per 100,000
7% decrease
1.13
10-Year Average Fatal Drowning Rate
Drowning deaths of adults aged 25-34 years by location, 2023/24
Drowning deaths in the 35-49 year age group represented 21% of total drowning deaths in 2023/24. The number of drowning deaths increased by 16% when compared to the 10year average. The crude fatal drowning rate of 1.22 per 100,000 population, also increased by 8% compared to the 10-year average.
Males accounted for 80% of drowning deaths in this age group. Those aged 40 years, 43 years and 45 years recorded the highest number of deaths in this age group with seven fatalities each.
The leading activity prior to drowning was swimming and recreating (29%). The majority of drowning deaths in this age group occurred at beaches (28%), followed by rivers/creek (15%). Over a quarter (26%) of drowning deaths in this age group occurred 100km or further away from where the person lived.
65
Drowning Deaths in 2023/24
1.22
2023/24 Fatal Drowning Rate per 100,000
16% increase
56 10-Year Average
1.13
8% increase
Drowning deaths of adults aged 35-49 years by activity, 2023/24
Drowning deaths of adults aged 34-49 years by location, 2023/24
Drowning deaths in the 50-64 year age group represented 16% of total drowning deaths in 2023/24. The number of drowning deaths decreased by 2% when compared to the 10year average. The crude fatal drowning rate of 1.1 per 100,000 population also decreased by 8% compared to the 10-year average.
Males accounted for 88% of drowning deaths in this age group. Those aged 59 years and 60 years recorded the highest number of deaths in this age group with six drowning fatalities each.
The leading activity prior to drowning was swimming and recreating (35%), followed by boating (15%). Drowning deaths in this age group most frequently occurred at beaches (33%) followed by rivers/creeks (27%). Over one-third (37%) of drowning deaths occurred with 10km of where the person lived, including in their home environment.
52
Drowning Deaths in 2023/24
1.10
2023/24 Fatal Drowning Rate per 100,000
2% decrease
8% decrease
53
10-Year Average
1.20
10-Year Average
Drowning deaths of adults aged 50-64 years by activity, 2023/24
Drowning deaths of adults aged 50-64 years by location, 2023/24
Drowning deaths in this age group represented 28% of total drowning deaths in 2023/24, a proportion that has increased steadily over the last decade from 19% in 2013-14.
The number of drowning deaths increased by 44% when compared to the 10-year average. The crude fatal drowning rate of 2.02 per 100,000 population also increased by 22% compared to the 10-year average.
The Australian Water Safety Strategy 2030 acknowledges people over 65 years as a priority age group for drowning prevention. It identifies areas in which water safety awareness, swimming skills, and campaigns around medical check-ups and fall prevention, need to be implemented to promote and strengthen water safety behaviour. [2]
Males accounted for 85% of all drowning deaths of people aged 65+ years. People aged 76 years recorded the highest number of drowning deaths overall in 2023/24, with eight drowning deaths, along with people aged 20 years.
Drowning deaths in this age group occurred mainly at beaches (25%) followed by rivers/ creeks (21%). Swimming and recreating were the leading activity prior to drowning (29%) followed by boating (14%). Interestingly, drowning in this age group most commonly occurred mid-week, on a Tuesday or Wednesday (35%), a departure from patterns observed in other age groups. Over one quarter (29%) of drowning deaths occurred within 10km of where the person lived, including their home environment.
deaths of older people aged 65+ years by activity, 2023/24
92
Drowning Deaths in 2023/24
2.02
2023/24 Fatal Drowning Rate per 100,000
44% increase 22% increase
64
10-Year Average
1.66
10-Year Average
Downing deaths of older people aged 65+ years by location, 2023/24
SECTION TWO: When and how does drowning happen?
SECTION TWO: When and how does drowning happen?
Drowning deaths occurred most frequently during the summer months, similar to previous years, with December and January having the highest number of drowning deaths in the 2023/24 financial year (29% total). Notably, 49 drowning deaths occurred in the month of March, an 88% increase on the 10-year average of 26.
Typical with previous years, weekends (Saturday and Sunday) were the highest for drowning incidents, with Sunday having the highest number of drowning deaths (n=76), up by 43% on the 10-year average.
Drowning deaths occurred most frequently in the afternoon (12pm to 6pm), similar to previous years.
Percent of 2023/24 drowning deaths by season
49 DROWNING DEATHS OCCURRED IN THE MONTH OF MARCH, AN 88% INCREASE ON THE 10-YEAR AVERAGE OF 26
MONTH
Percent of 2023/24 drowning deaths by month compared to the 10-year average Percent of 2023/24 drowning deaths by day of the week compared to the 10-year average
2023/24 drowning deaths by time of day TIME OF
Early
Evening (6pm-12am)
DROWNING DEATHS OCCURRED MOST FREQUENTLY IN THE AFTERNOON (12PM TO 6PM), SIMILAR TO PREVIOUS YEARS.
Afternoon (12pm-6pm)
Consistent with previous years, swimming and recreating was the leading activity prior to drowning (33%) in 2023/24 for all age groups except children aged 0-14 years.
Swimming and water safety skills are highlighted in the Australian Water Safety Strategy 2030 as a priority focus and, while widely recognised as a key measure to preventing drowning, reaching each new generation of parents and children is a continued challenge. Young people and adults need to consider their ability and skills when participating in aquatic activities, and be aware of the environment they are swimming in. Refreshing skills in a pool environment before heading to the open water may be one way to increase awareness of current skills.
Falls into water were the second leading activity prior to drowning (11%). Children made up nearly half (44%) of all fall-related drowning deaths in 2023/24. Children aged 0-4 accounted for 26%, followed by children aged 5-9 years (18%).
This reinforces the importance of active supervision around water, especially as young children become more mobile and barriers preventing access to water, such as compliant pool fencing. Also of concern is people aged 65 years and over (65+ years), who made up 29% of people who drowned from an unintentional fall into water, which may be linked to medical conditions and limited mobility as people age.
Boating was the activity associated with 9% of drowning deaths, a 24% decrease from the 10-year average. People aged 55 years and over (55+ years) made up 68% of boating-related drowning deaths. While lifejacket use was unknown, previous research has reported that a lifejacket was not worn in most drowning cases. [12] This emphasises the importance of wearing a lifejacket, checking the condition and having correct and working safety equipment when planning a day on the water.
Drowning deaths that occurred while swimming and recreating increased by 30% compared to the 10year average. Young adults aged 20-24 years accounted for 16% of all swimming and recreating drowning deaths.
44% of drowning deaths related to a fall were among children 0-9 years and 29% of were of adults aged 65+ years.
Bathing-related drowning deaths were 27% lower than the 10-year average, and most commonly occurred among children 0-4 years.
2023/24 drowning deaths by activity category
SECTION THREE: Where do people drown?
Understanding where drowning events happen, and who drowns at those locations, is critical for prevention efforts. The Australian Water Safety Strategy 2030 underscores the need to prioritise high-risk drowning locations and identify specific water safety strategies tailored to each location.
Drowning numbers were higher in almost all body of water locations this year, except for bathtubs / spa baths (25% below the 10-year average) and rocks (14% below the 10-year average).
The highest number of drowning deaths in 2023/24 occurred at beaches with 26% of all cases, an increase in proportion from the last 10-years where beaches have represented 21% of all cases. River / creek locations followed with 25% of cases, equal to last 10-years where rivers / creeks have represented 26% of all cases.
Key coastal findings
• Coastal locations represented 46% of drowning deaths, 37% of which were swimming and recreating prior to drowning. Three in five coastal drowning deaths occurred at a beach (56%), followed by ocean / harbour (30%), then rocks (13%).
• Males and those aged 40–49 years accounted for 86% and 21% of the coastal drowning burden respectively. Beaches recorded an equal proportion of fatal drownings among those aged 18–24, 45–54, and 55–64 years (each accounting for 15% of beach drowning deaths). Rip currents, the leading coastal hazard, were involved in 35% of beach drowning deaths.
• The highest number of fatal drownings at ocean / harbour locations were for 65–74 year olds (27%), and those diving prior to drowning (29%). The majority of drowning at rock locations occurred in the 35–44 year age group (26%), and 42% were rock fishing.
Key inland waterway findings
• Swimming and recreating was the most frequent activity prior to fatally drowning at inland waterway locations (23%). The age groups most frequent to fatally drown at inland locations were adults aged 65-74 years (13%) and adults aged 75+ years (14%).
• The majority of cases at inland waterway locations (66%) occurred in regional and remote areas.
• 24% of inland waterway drowning deaths occurred more than 100km from the persons home residence.
COASTAL LOCATIONS
*Includes beaches, ocean/ harbour, rocks, and coastal rock pools
46% of 2023/24 Drowning Deaths
150
Drowning Deaths in 2023/24
26% increase
INLAND WATERWAYS
*Includes rivers / creeks and lakes / dams
119 10-Year Average
34% of 2023/24 Drowning Deaths
110
Drowning Deaths at Inland waterways in 2023/24
12% increase
SWIMMING POOLS
98 10-Year Average
11% of 2023/24 Drowning Deaths
35
Drowning Deaths at swimming pools in 2023/24
3% increase
34 10-Year Average
Percent of 2023/24 drowning deaths by location compared to the 10-year average
Primary and secondary location categories where drowning occurred, 2023/24
KEY 2023/24 COASTAL DROWNING INSIGHTS
86% OF COASTAL DROWNING DEATHS WERE MALE
21% WERE ADULTS AGED 40-49 YEARS
43% OCCURRED DURING SUMMER
BEACHES
26% OF ALL DROWNING DEATHS OCCURRED AT BEACHES
Beaches are dynamic coastal environments that can pose unexpected risks to beachgoers. This year beaches recorded 84 drowning deaths, a 12% increase from last year and a 45% increase from the 10-year average.
Swimming and recreating was the leading activity prior to drowning (67%) followed by diving and watercraft (8% each). Males continue to be over represented, along with people aged 18-24 and 45-64 years. For known cases, one in three were born overseas (33%), with 12% born in India.
Over half (54%) occurred in the afternoon (12pm to 6pm) and February recorded more drowning deaths than average, equal to January with 17 drowning deaths (20% each).
Compared to other bodies of water, those who drowned at beaches tended to come from advantaged areas with 46% of beach drowning cases involving people who lived in areas with IRSAD Decile scores of 7 or higher.
Drowning deaths at beaches by financial year
Drowning deaths at beaches by month, 2023/24 Drowning
Drowning deaths at beaches by time of day, 2023/24
Drowning deaths at beaches by activity (top 5), 2023/24
Remoteness classification of beach drowning locations, 2023/24
Drive distance between residence and beach drowning location 2023/24
OCEAN / HARBOUR
45 Drowning Deaths in 2023/24
39 10-Year Average 14% OF ALL DROWNING DEATHS OCCURRED AT OCEAN / HARBOUR
15% increase
Ocean and harbour locations encompass various coastal waterways including bays, offshore water, ports, marinas and jetties. Each enable a variety of recreation options and carry their own unique risk and prevention profiles.
There were 45 drowning deaths that occurred at ocean / harbour locations this financial year, a 36% increase from last year, and a 15% increase from the 10-year average. The leading activity prior to drowning was boating (36%) followed by diving (29%).
The drowning deaths that occurred in the ocean / harbour category were most frequently offshore (29%), during the summer (36%) and occurred in the afternoon (12pm to 6pm) (38%). The number of ocean / harbour drowning deaths was highest in the month of March (n=11, 24%, 3.5 times the ten-year March average), followed by December (n = 7, 16%).
Compared to other bodies of water, those who drowned at ocean / harbour locations tended to come from high advantaged areas: 27% of ocean / harbour related drowning cases involved people who lived in locations with IRSAD Decile scores 9 or 10, compared to 18% of cases from other bodies of water.
Proportion of drowning deaths at ocean / harbour locations, 2023/24
Drowning deaths at ocean / harbour locations by age group, 2023/24
Drowning deaths at Ocean / Harbour by month, 2023/24
Drowning
Remoteness
Drowning Location
Drowning deaths at ocean / harbour by activity (top 5), 2023/24
22 10-Year Average 6% OF ALL DROWNING DEATHS OCCURRED AT ROCKS ROCKS
19
Drowning Deaths in 2023/24
Rock locations include rocky land formations and cliffs. These locations are seen to present environmental challenges that can pose risks when not prepared for the conditions, or when not wearing appropriate safety equipment such as a lifejacket.
In 2023/24, drowning deaths that occurred at rock locations represented 5% of all drowning deaths, a 12% increase from last year, and a 14% decrease from the 10-year average.
Rock fishing was the leading activity prior to drowning (42%) followed by being swept in (37%) by a wave overtopping the rocks. Most drowning deaths occurred in inner regional areas, where people would drive more than 21km from their home. Those confirmed born overseas represented 68% of drowning cases at rocks.
Education and awareness approaches that lead to behaviour changes that increase lifejacket usage within these environments is important to decreasing drowning rates at these locations.
Lifejacket usage significantly improves survival outcomes. Interim evaluation of mandatory lifejacket wear legislation at declared high-risk rock platforms in NSW has revealed a promising reduction in rock fisher drowning deaths [13].
Drowning deaths at rocks by financial year
Drowning deaths at rocks by age group, 2023/24
Drowning deaths at rocks by month, 2023/24
Drowning
Drowning deaths at rocks by activity (top 5), 2023/24
Remoteness classification of rocks drowning locations, 2023/24
9
Drowning Deaths in 2023/24
12 20-Year Average 241 ROCK FISHING DROWNING DEATHS 2004-2024
25% decrease
Rock fishing is a popular coastal activity with an estimated 1 million fishers nationally. Rock fishing is also one of the most dangerous sports, due to the hazardous surf conditions and dangerous rocky environments creating a high risk of drowning and injury.
Since 2004, rock fishing drowning deaths have accounted for 10% of the coastal drowning burden (n=241). More than one in two fishers were born in Asia (56%), however 81% were Australian residents. Most rock fishing drowning deaths (49%) occurred among those aged 40-64 years. Four in five drowning deaths occurred more than 1km away from a surf lifesaving service (79%), with all occurring outside of supervised areas.
Waves contributed to 78% of fisher deaths, followed by fishers slipping and falling (22%). Lifejacket usage is one of the leading safety precautions rock fishers can adopt. It is widely accepted that correctly wearing a lifejacket greatly reduces drowning risk by improving survival outcomes [13], yet lifejackets were known to be worn in only 7% of drowning deaths.
Rock fishing drowning deaths 2004-2024 by country of birth
Hong
Taiwan
Philippines
United
Iran
Japan
Indonesia
Rock fishing drowning deaths by age group, 2004-2024
Lifejacket use in rock fishing drowning deaths, 2004-2024
Causal factors in rock fishing drowning deaths, 2004-2024
Rock fishing drowning deaths by distance from lifesaving service, 2004-2024
22%42%36%
<1KM1-5KM>5KM
RIVERS / CREEKS
25% OF ALL DROWNING DEATHS OCCURRED AT RIVERS / CREEKS
80 Drowning Deaths in 2023/24 72
Rivers / creeks were the second highest drowning location this financial year (2023/24), representing 25% of drowning deaths; a 5% increase from last year and a 11% increase from the 10-year average. Men continue to account for the vast majority of drowning deaths at rivers/creeks, 84% this financial year.
Drowning deaths were the highest in the 25–34year age group (22%) followed by 18-24-years and those in the 75+ years age group (14%). The majority (68%) of river creek drowning deaths occurred in regional or remote locations, and 25% of the cases involved a person who drove more than 100km from their home residence.
Over one third of drowning deaths at rivers / creeks occurred in the summer (38%) and on the weekend (48%), however the highest month of drowning at rivers / creeks was in the month of March (19%).
Compared to other bodies of water, those who drowned at rivers / creeks tended to come from disadvantaged areas: 19% of river /creek related drowning cases involved people who lived in IRSAD Decile 1-2 locations, whereas 11% of people who drowned at other bodies of water lived in Decile 1-2 locations.
Proportion of drowning deaths at rivers / creeks locations, 2023/24
Other Rivers / Creeks
Waterfalls / Waterholes
Drowning deaths at rivers / creeks by financial year
Drowning
deaths at rivers / creeks by age group, 2023/24
Drowning deaths at rivers / creeks by month, 2023/24
Drowning deaths at rivers / creeks by time of
2023/24
Drowning deaths at rivers / creeks by activity (top 5), 2023/24
Remoteness classification of rivers / creeks drowning locations, 2023/24
Drowning Location
30 Drowning Deaths in 2023/24
26 10-Year Average 9% OF ALL DROWNING DEATHS OCCURRED AT LAKE / DAM LAKE / DAM
15% increase
Lakes / dams represented 9% of drowning deaths this financial year (2023/24); an 11% increase from last year, and a 15% increase from the 10-year average. Most drowning deaths at lakes / dams occurred in the 65-74year age group (20%).
The leading activity prior to drowning at lakes / dams was swimming and recreating (27%) followed by an unintentional fall into water (23%). The highest number of drowning deaths were equal in the summer and spring (27%), with the greatest number of drowning deaths occurring in the month of September (20%) and January (17%).
Three percent of drowning deaths at lakes / dams occurred at the residence of the individual, whereas 20% drove over 100km from home to the lake / dam location; 40% of drowning deaths occurred in inner regional areas.
Proportion of drowning deaths at lake / dam locations, 2023/24
Drowning deaths at lake / dam by financial year
Drowning deaths at lake / dam by age group, 2023/24
Drowning deaths at lake / dam by month, 2023/24
Drowning
Drowning deaths at lake / dam by activity (top 5), 2023/24
SWIMMING POOLS
35
Drowning Deaths in 2023/24 34 10-Year Average 11% OF ALL DROWNING DEATHS OCCURRED AT SWIMMING POOLS
3% increase
Swimming pool deaths represented 11% of drowning deaths this financial year (2023/24); the count was up by 21% from last year and 3% from the 10-year average. The highest number of drowning deaths occurred in the 75+ years age group (23%) followed by the 0-4-year age group (17%).
The leading activity prior to drowning was swimming and recreating (69%) followed by an unintentional fall into water (26%). Over 50% of drowning deaths occurred in a private/ home pool and during the summer (46%). Most drowning deaths in swimming pools occurred in the month of December (20%) followed by March (17%).
The IRSAD score of the residence areas for those who drowned in a swimming pool varied by age. Children aged 0-14 years tended to come from disadvantaged areas, 57% from areas with IRSAD Decile scores of 4 or below; and adults over 50 years were more frequently from advantaged areas, 73% from areas with IRSAD Decile scores of 7 or above.
*Note: Home pools are primarily single-dwelling domestic pools. Communal pools include hotels, motels, resorts, holiday apartment complexes, and public pools include council owned pools, school and university pools, and commercial learn to swim centres.
Proportion of drowning deaths at swimming pool locations, 2023/24
Drowning deaths at swimming pools by financial year
Drowning deaths at swimming pools by age group, 2023/24
Drowning deaths at swimming pools by month, 2023/24
Drowning
Drowning deaths at swimming pools by activity (top 5), 2023/24
41 17%
Arrows reflect 2023/24 progress against the 10-year average.
New South Wales recorded the most unintentional drowning deaths (n=128), a 33% increase in unintentional fatal drowning from the 10-year average.
Queensland recorded the second largest number of unintentional drowning deaths (n=70).
5 38%
12 14%
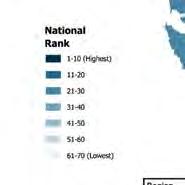
DROWNING RATES AMONG AUSTRALIAN RESIDENTS BY REGION,
2014/15 - 2023/24
Residential Drowning Rates
This map shows the crude fatal drowning rate per 100,000 residents of each region in Australia. The regions are based on local public health regions/units, determined by each State/ Territory. As an indication of the relative burden of drowning in each community, these rates are based on where people lived, not the incidents that occurred in each region. See the Methods Section on page 96 for additional information.
Further details on residential drowning rates of each region are provided in the following pages with breakdowns by each State/Territory.
Top 10 metro regions
Top 10 metro regions
There were 2 unintentional drowning deaths in the ACT between 1 July 2023 and 30 June 2024. This is equal to the 10-year average. There were no drowning deaths recorded in ACT the previous year (2022/23).
In the last 22 years, between July 2002 and June 2024, there have been 45 drowning deaths in the ACT with a cumulative crude drowning rate of 0.56 drowning incidents per 100,000 people.
100% OF DROWNING DEATHS IN THE ACT WERE MALE
2
Drowning Deaths in 2023/24
0.43 2023/24 Fatal Drowning Rate per 100,000
0%
2 10-Year Average
10% decrease
0.48 10-Year Average Fatal Drowning Rate per 100,000
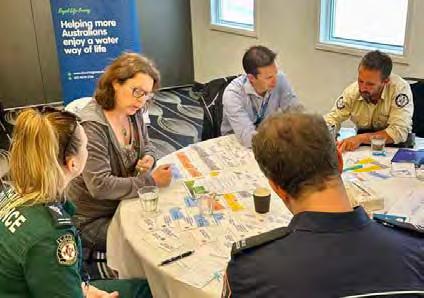
ACT Drowning Prevention Workshop and Plan
The ACT Drowning Prevention Workshop and Plan, funded by the Australian Government and supported by the ACT Government, aimed to address the critical issue of drowning prevention in the Australian Capital Territory (ACT).
Facilitated by Royal Life Saving ACT the workshop brought together over 45 different organisations, including representatives from various ACT Government departments, industry leaders, and community groups.
The ACT Drowning Prevention Workshop and Plan have been a significant success, demonstrating the power of collaboration and shared commitment to a common goal. The support from the Australian Government and the ACT Government has been instrumental in bringing together a diverse range of stakeholders to tackle drowning prevention. The implementation of the workshop’s recommendations will be crucial in making the ACT a safer place for everyone around water.
KEY OUTCOMES INCLUDED
1. Comprehensive Drowning Prevention Plan developed
2. Stakeholder Collaboration to implement the drowning prevention plan
3. Public Awareness Campaigns
4. Recommendations for improving Drowning Prevention strategies in the ACT
There were 128 drowning deaths that occurred in NSW between July 1st 2023 to June 30th 2024. This is the highest number of drowning deaths to occur in the state since the National Fatal Drowning Database records began in July of 2002.
The drowning rate of 1.53 per 100,000 population increased by 25% this financial year, compared to the 10-year average.
The highest number of drowning deaths in NSW occurred among those aged 25-34 years and 45-54 years (16% each). However, the age group reporting the highest crude rates for drowning were those aged 75+ years.
People who lived in disadvantaged areas (IRSAD Decile 1-4) accounted for 27% of the total drowning deaths in NSW whereas, people who lived in the most advantaged areas (IRSAD Decile 9-10) accounted for 25% of all drowning deaths.
Drowning deaths in NSW mainly occurred at beaches (27%), followed by river / creeks (22%), while swimming and recreating (29%).
128
Drowning Deaths in 2023/24
1.53
2023/24 Fatal Drowning Rate per 100,000
New South Wales drowning deaths by age group, 2023/24
Residential fatal drowning rate by NSW region, 2014/15 - 2023/24
This map shows the crude fatal drowning rates per 100,000 residents of each NSW region. As an indication of the relative burden of drowning in each community, these rates are based on where people lived, not where the incident occurred.
Nepean Blue Mountains
Mid North Coast NSW
Illawarra Shoalhaven
Hunter New England
Far West NSW*
Illawarra Shoalhaven
Nepean Blue Mountains
Mid North Coast NSW
Illawarra Shoalhaven Hunter
Far West
New South Wales drowning deaths by financial year, 2013/14 to 2023/24 909796967890879912 51 07128
New South Wales drowning deaths by month, 2023/24
New South Wales drowning deaths by
New South Wales drowning deaths by activity, 2023/24
New South Wales drowning deaths by location, 2023/24
There were 5 drowning deaths that occurred in the NT between July 1st 2023 to June 30th 2024.
The 2023/24 fatal drowning rate of 1.98 deaths per 100,000 population decreased by 39% this financial year, compared to the 10-year average.
The highest number of drowning deaths in NT occurred among those aged 55+ years. There were no drowning deaths of children and young people aged 0-19 years in 2023/24.
Drowning deaths in NT mainly occurred at rivers/creek (60%), while swimming and recreating (40%).
5
Drowning Deaths in 2023/24
1.98 2023/24 Fatal Drowning Rate per 100,000
38% decrease 39% decrease
8 10-Year Average
3.25
10-Year Average Fatal Drowning Rate per 100,000
100% OF DROWNING DEATHS WERE AGED BETWEEN 18-74 YEARS
Residential fatal drowning rate by NT region, 2014/15 - 2023/24
This map shows the crude fatal drowning rates per 100,000 residents of each NT region. As an indication of the relative burden of drowning in each community, these rates are based on where people lived, not where the incident occurred.
*Rates calculated from less than 10 cases, interpret with caution
Darwin, Palmerston, Litchfield
Central Australia*
East Arnhem*
Big Rivers*
Top End*
Barkly*
Northern Territory drowning deaths by location, 2023/24
Northern Territory Key Facts River / Creek
Swimming and recreating was the leading activity prior to drowning of cases alc ohol was recorded occurred in the wet season of cases drugs were recorded
The Northern Territory Water Safety Strategy 2030 is the 5th Water Safety Strategy for the NT and was developed by the NT Water Safety Advisory Council (NTWSAC). This Strategy aligns to the Australian Water Safety Strategy 2030.
The NT Minister for Sport - The Hon Kate Worden, MLA endorsed the NT Water Safety Strategy 2030, and it was released during Water Safety Week in September 2023.
This strategy is designed to build on work that has already been done, while continuing to minimise the rate of fatal, non-fatal drowning and other water-related injuries in the NT.
The NTWSAC was established in 2002 as part of the Northern Territory Government’s 5-point Water Safety Plan. The NTWSAC was mandated to ‘develop and implement a Northern Territory Water Safety Plan that focuses on water safety education, research and data collection and standards’.
KEY MESSAGES:
Check the weather
Safer to swim with us
If it’s flooded, forget it Make the right call
Key activities since the strategy launch Water Safety Week 2023
– including SPLASHFEST, September 2023 Water Safety Week 2023 (WSW23) was opened by the Honourable Natasha Fyles, Chief Minister of the Northern Territory, and featured a variety of events and activities throughout the NT. The slogan for WSW23 was ‘Be water safety wise’.
Highlights included
• 13 community events delivered, with an estimated reach of more than 15,000 Territorians.
• 2500 people attended SPLASHFEST, the key event for WSW23
• 209 children participated in the Water Safety Creek activity at Splashfest.
Advanced Communication Strategy
• The NTWSAC met in March 2024 to develop an Advanced Communication Strategy.
• This workshop aimed to align key messages that could be supported by all organisations to amplify the Council’s main messaging during peak periods throughout the year.
• The goal is to increase awareness and promotion of water safety activities in the NT.
For more information on the NT Water Safety Strategy: https://www.royallifesaving. com.au/nt/About-Royal-Life-Saving-NT/Whowe-are/nt-water-safety-strategy-2030
There were 70 drowning deaths that occurred in QLD between July 1st 2023 to June 30th 2024. The drowning rate of 1.28 per 100,000 population decreased by 2% this financial year, compared to the 10-year average.
Over a quarter of drowning deaths this financial year occurred in people aged over 65+ years (26%), with those age 75+ years and older recording the highest crude rate in the state: 2.91 deaths per 100,000 population.
People residing in disadvantaged areas (IRSAD Deciles 1-4), accounted for 35% of total drowning deaths in Queensland. Those who lived in the most advantaged areas (IRSAD Deciles 9-10) accounted for 11% of drowning deaths in Queensland.
Drowning deaths in Queensland mainly occurred at rivers / creeks (36%), followed by ocean / harbour (20%), while swimming and recreating (33%). Of note, beach-related drowning deaths were down 39% from the 10-year average, and the number of drowning deaths in the month of December was more than double the ten-year average, 16 this financial year compared to a tenyear average of 7.
70
Drowning Deaths in 2023/24
1.28
2023/24 Fatal Drowning Rate per 100,000
8% increase 2% decrease
65
10-Year Average
Queensland drowning deaths by age group, 2023/24
1.31
10-Year Average Fatal Drowning Rate per 100,000
Born overseas 29%
Residential fatal drowning rate by QLD region, 2014/15 - 2023/24
This map shows the crude fatal drowning rates per 100,000 residents of each QLD region. As an indication of the relative burden of drowning in each community, these rates are based on where people lived, not where the incident occurred.
*Rates calculated from less than 10 cases, interpret with caution
Central
North West QLD*
Torres and Cape
Sunshine Coast
Central QLD
Townsville Wide Bay
Mackay
QLD Metro South
QLD Metro North
Sunshine Coast
Darling Downs
West Moreton
Gold Coast
Cairns and Hinterland
Darling Downs
Queensland drowning deaths by financial year, 2013/14 to 2023/24
Queensland drowning deaths by month, 2023/24
Queensland
Queensland
Queensland drowning deaths by location, 2023/24
There were 12 drowning deaths that occurred in SA between July 1st 2023 to June 30th 2024, the lowest number since 2007/08, which also had 12 drowning fatalities.
The drowning rate of 0.65 per 100,000 population decreased by 19% this financial year, compared to the 10-year average.
Two-thirds of all drowning deaths in South Australia occurred in people aged 55+ years, with the 65-74-year age group recording the highest crude rates of 2.02 deaths per 100,000 population, followed by the 75+ years age group with a rate of 1.74 per 100,000 population.
The socio-economic background of those who drowned in South Australia were evenly spread across socio-economic spectrum, with 25% of cases occurring in the most disadvantaged (IRSAD Decile 1-2) and 25% occurring in the most advantaged (IRSAD Decile 9-10) areas, reinforcing the need for increased awareness and access to swimming and education programs for all communities.
Drowning deaths in SA mainly occurred at beaches (42%), followed by ocean / harbour (33%), while boating (25%). The majority of drowning deaths in South Australia occurred during March (67%).
12
Drowning Deaths in 2023/24
14% decrease
0.65
2023/24 Fatal Drowning Rate per 100,000
Male
19% decrease
14 10-Year Average
0.80
10-Year Average Fatal Drowning Rate per 100,000
aged 65-74 years 33%
South Australia drowning deaths by age group, 2023/24
Residential fatal drowning rate by SA region, 2014/15 - 2023/24
This map shows the crude fatal drowning rates per 100,000 residents of each SA region. As an indication of the relative burden of drowning in each community, these rates are based on where people lived, not where the incident occurred.
Northern Adelaide
Central Adelaide
*Rates calculated from less than 10 cases, interpret with caution
Southern Adelaide
Flinders and Upper North SA*
Riverland Mallee Coorong*
Yorke and Northern SA*
Eyre and Far North SA*
Limestone Coast
Barossa Hills Fleurieu
South Australia drowning deaths by financial year, 2013/14 to 2023/24
South Australia drowning deaths by month, 2023/24
South Australia drowning deaths by season, 2023/24
South Australia drowning deaths by activity, 2023/24
25% Boating
17% Swimming and Recreating
17% Unknown
South Australia drowning deaths by location, 2023/24
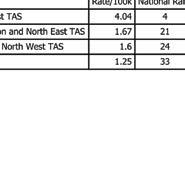
There were 11 drowning deaths that occurred in Tasmania between July 1st 2023 to June 30th 2024.
The drowning rate of 1.92 per 100,000 population increased by 14% this financial year, compared to the 10-year average.
Over half (54%) of drowning deaths in Tasmania occurred among people aged 55+ years, with the highest crude rate of 4.43 deaths per 100,000 population recorded among the 65-74 age group, closely followed by the 35–44 year age group (4.25 per 100,000 population).
More than half (54%) of the people who drown in Tasmania resided in areas with IRSAD Deciles below 4.
In 2023/24, drowning deaths in Tasmania mostly occurred at beaches (55%) when swimming, which is a change from previous years, where the highest number of drowning deaths usually occurred in ocean / harbour locations while boating.
11
Drowning Deaths in 2023/24
1.92
2023/24 Fatal Drowning Rate per 100,000
22% increase 14% increase
9
10-Year Average
1.68
10-Year Average
Fatal Drowning Rate per 100,000
Residential fatal drowning rate by Tasmanian region, 2014/15 - 2023/24
This map shows the crude fatal drowning rates per 100,000 residents of each Tasmanian region. As an indication of the relative burden of drowning in each community, these rates are based on where people lived, not where the incident occurred.
Launceston and North East TAS
West and North West TAS
Launceston and North East TAS
West and North West TAS
South East TAS
Hobart
Tasmania drowning deaths by financial year, 2013/14 to 2023/24
Tasmania drowning deaths by month, 2023/24
Drive distance between residence and Tasmania drowning location 2023/24
Tasmania
Ocean / Harbour River / Creek Bathtub / Spa Bath
Pool
There were 54 drowning deaths that occurred in Victoria between July 1st 2023 to June 30th 2024. The drowning rate of 0.79 per 100,000 population increased by 1% this financial year, compared to the 10-year average.
The 18-24 years age group recorded the highest number, proportion and rate of drowning, reaching a crude rate of 1.62 deaths per 100,000 population in this age group. This differs from national trends, where people aged 55+ years are the group with the highest rates for drowning.
Nearly half (46%) of those who drowned in Victoria resided in socio-economically advantaged areas (IRSAD Decile 7-10), with 9% living in the most disadvantaged areas (IRSAD Decile 1-2).
Drowning deaths in Victoria mainly occurred at beaches (31%), which recorded 1.7 times the number of drowning deaths as the 10-year average, followed by river / creeks (22%), which recorded a 2023/24 number 9% higher than the 10-year average. Swimming and recreating was the most common activity for those who drowned in Victoria (44%); of these, 29% were aged 20-24 years.
54
Drowning Deaths in 2023/24
0.79
2023/24 Fatal Drowning Rate per 100,000
10% increase 1% increase
49 10-Year Average
Victoria drowning deaths by age group, 2023/24
0.78
10-Year Average Fatal Drowning Rate per 100,000
Residential fatal drowning rate by VIC region, 2014/15 - 2023/24
This map shows the crude fatal drowning rates per 100,000 residents of each VIC region. As an indication of the relative burden of drowning in each community, these rates are based on where people lived, not where the incident occurred.
*Rates calculated from less than 10 cases, interpret with caution
Barwon South West
Goulburn Valley
Loddon Mallee
Ovens Murray Grampians
Gippsland
North Eastern Melbourne
South East Melbourne
Barwon South West
Western Melbourne
Goulburn Valley
Loddon Mallee Grampians
Gippsland
Victoria drowning deaths by financial year, 2013/14 to 2023/24
Victoria drowning deaths by month, 2023/24
Victoria
Victoria drowning deaths by activity, 2023/24
Victoria drowning deaths by location, 2023/24
There were 41 drowning deaths that occurred in Western Australia between July 1st 2023 to June 30th 2024. This is the most recorded cases since 2016-2017, where there were 44 drowning deaths in WA.
The drowning rate of 1.42 per 100,000 population increased by 7% this financial year, compared to the 10-year average.
The highest number of drowning deaths in WA occurred in the 45-54-year age group (24%), which also recorded the highest crude rate in the state with 2.75 drowning deaths per 100,000 population. Drowning deaths among children 0-4 years accounted for 7% of drowning deaths this year, recording a crude drowning rate of 1.77, an increase of 52% on the 10-year average of 1.16 per 100,000 population.
Over half (56%) of all drowning deaths in Western Australia were of people who lived in areas with IRSAD scores below 4, reinforcing the need for increased access and opportunities to swimming and education programs for those that need it most.
Drowning in WA most commonly occurred at beaches (32%), followed by rivers/creeks (22%) and 15% in swimming pools (majority being home swimming pools), while swimming (23%) or as a result of an unintentional fall into water (15%), indicating that people may not have had the swimming and water safety skills to help themselves out of difficulty.
41
Drowning Deaths in 2023/24
1.42
2023/24 Fatal Drowning Rate per 100,000
Western Australia drowning deaths by age group, 2023/24
35
10-Year Average
1.33
10-Year Average Fatal Drowning Rate per 100,000
Born overseas 29%
Residential fatal drowning rate by WA region, 2014/15 - 2023/24
This map shows the crude fatal drowning rates per 100,000 residents of each WA region. As an indication of the relative burden of drowning in each community, these rates are based on where people lived, not where the incident occurred.
Great Southern WA South West WA
Midwest WA Wheatbelt*
Goldfields
Pilbara*
South Perth
Kimberley
Western Australia drowning deaths by financial year, 2013/14 to 2023/24
Western Australia drowning deaths by month, 2023/24
Western Australia drowning deaths by season, 2023/24
Western Australia drowning deaths by activity, 2023/24
Western Australia drowning deaths by location, 2023/24
METHODS
Fatal drowning
The information presented in the National Drowning Report 2024 has been collated from the National Coronial Information System (NCIS), State and Territory Coronial offices and year-round media monitoring. Cases are collated in partnership with Royal Life Saving State and Territory Member Organisations (STMOs) and Surf Life Saving Australia and analysed by Royal Life Saving – Australia. Data presented in the Insights by Key Drowning Locations: Beaches, Ocean / harbour, and Rocks sections, and the Rock Fishing Research Highlight, were analysed by Surf Life Saving Australia. Information contained within the NCIS is made available by the Victorian Department of Justice and Community Safety.
Royal Life Saving - Australia uses a media monitoring service for broadcast, print and online all year round to identify drowning deaths reported in the media. This information is then corroborated with information from the NCIS, police reports, Royal Life Saving STMOs, and Surf Life Saving Australia before being included in the National Drowning Report.
Great care is taken to ensure that the information in this report is as accurate as possible. Figures may change depending on ongoing coronial investigations and findings, as 83% of cases are still under investigation (i.e., open) as this report went to press. Royal Life Saving regularly publishes ongoing studies, which provide detailed information on long-term data trends.
Information on drowning cases is correct as of 10th July 2024. Historical drowning data are correct as of 1 July 2024 in accordance with Royal Life Saving’s ongoing data quality assurance policy. All cases in the Royal Life Saving National Fatal Drowning Database are checked against those in the NCIS on a regular basis and figures are updated in annual National Drowning Reports as cases close. The 10-year averages in this report are calculated from drowning death data from 2013/14 to 2022/23 inclusive.
Drowning rates per 100,000 population are calculated using population data from the Australian Bureau of Statistics (ABS) National, state and territory population data [14]. Percentages and averages are presented as whole numbers and have been rounded up or down accordingly.
Socio-Economic Indexes for Areas [3]
The Index of Relative Socio-economic Advantage and Disadvantage (IRSAD) summarises information about the economic and social conditions of people and households within an area, including both relative advantage and disadvantage measures.
For SEIFA 2021, the concept of relative socio-economic advantage and disadvantage is the same as that used for SEIFA 2016 and SEIFA 2011. That is, the ABS broadly defines relative socio-economic advantage and disadvantage in terms of people’s access to material and social resources, and their ability to participate in society.
A low score indicates relatively greater disadvantage and a lack of advantage in general. For example, an area could have a low score if there are:
• many households with low incomes, or many people in unskilled occupations, AND
• few households with high incomes, or few people in skilled occupations.
A high score indicates a relative lack of disadvantage and greater advantage in general. For example, an area may have a high score if there are:
• many households with high incomes, or many people in skilled occupations, AND
• few households with low incomes, or few people in unskilled occupations.
Data for socio-economic status was determined using the socio-economic index for advantage and disadvantage for an individual’s usual place of residence [3].
Sub-state and territory regions
The regional maps presented in the Insights by State and Territories section are intended to provide a general sense of the relative burden of drowning for residents in different parts of each state and territory. The sub-state/territory regions presented align with the local health districts/units of each state or territory, defined by the health department in that state/territory.
In cases where these geographies do not align to other defined Australian Statistical Geography Standard (ASGS) boundaries, the health district boundary was re-aligned to closest Statistical Area 1 (SA1) boundary. That is, if an SA1 overlapped with different two regions, it was assigned to the region that it shared the most area with.
Drowning cases were assigned to each region based on the home residence of the person who drowned. Of note, this rate is based on the number of people who lived in the region, not on the number of incidents that occurred in the region. For drowning cases in Victoria, available data on home residence was limited to postcode only for some cases. These were assigned to regions (Victorian Local Public Health Units) based on proportion of overlap; postcodes with geographic area split across one or more regions were assigned to the region with which they shared the most area.
Ten-year cumulative drowning rates per 100,000 residents were calculated for July 2014 to June 2024 using the SA1 population estimates from the 2016 and 2021 census releases from the ABS.
National Rank shows the relative position of each region’s residential drowning burden across the country, where rank 1 is the region with the highest residential drowning rate and rank 70 is the lowest.
Exclusions and categorisations
Drowning deaths as a result of suicide or homicide, deaths from natural causes, shark and crocodile attacks, or hypothermia have been excluded from this report. All information presented in this report relates to drowning deaths or deaths where drowning is a contributory cause of death.
‘Non-aquatic transport’ relates to drowning deaths involving a means of transport that is not primarily designed or intended for aquatic use such as cars, motorbikes, bicycles and aeroplanes among others.
Means of transport primarily used for aquatic purposes are categorised under ‘boating’ (water-based wind or motor-powered vessels, boats, ships and personal watercraft, such as boats, jet skis, sail boats and yachts). ‘Watercraft’ refer to water-based non-powered recreational equipment such as those that are rowed or paddled (e.g., rowboats, surfboats, kayaks, canoes, surf boards and boogie boards). Within this report, ‘swimming pool’ includes home swimming pools, public swimming pools, hotel and motel pools, and portable swimming pools among others.
Acknowledgements
Royal Life Saving would like to thank the following people and organisations for their assistance in producing the Royal Life Saving National Drowning Report 2023/24:
• Royal Life Saving State and Territory Member Organisations (STMOs)
• The National Coronial Information System (NCIS)
• Surf Life Saving Australia (SLSA)
• The Queensland Family and Child Commission (QFCC)
• Jessica Bryan - The National Coronial Information System
• Victorian Department of Justice and Community Safety
• Dr Bernadette Matthews (Life Saving Victoria)
• Dr Hannah Calverley (Life Saving Victoria)
• Lauren Nimmo (Royal Life Saving Western Australia)
• Rick Carter (Studio One Another)
The drowning prevention research of the Royal Life Saving – Australia is supported by the Australian Government.
This report was compiled and written by Dr William Koon, Lauren Miller, and Stacey Pidgeon from Royal Life Saving - Australia; and Dr Jasmin Lawes, Sean Kelly and Rebecca Stolper from Surf Life Saving Australia.
Royal Life Saving - Australia’s research and policy contribution in 2023/24 has been diverse and continues to impact drowning prevention policy and programs.
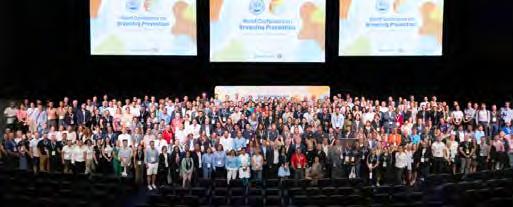
World Conference on Drowning Prevention, Perth, December 2023
Royal Life Saving - Australia and Surf Life Saving Australia cohosted the World Conference on Drowning Prevention (WCDP) at the Perth Conference and Exhibition Centre, Western Australia from 4-7 December 2023. Over 750 delegates from 50 countries, gathered for a conference week rich with opportunity.
The globally significant event focused world attention on drowning prevention. WCDP 2023 gathered experts in drowning prevention, lifesaving and water safety with the goal of Shaping Global Strategy and Mobilising for Action.
The conference was held at a time of great momentum for drowning prevention.
• United Nations General Assembly Resolution on Global Drowning Prevention in 2021.
• World Health Assembly will debate a draft resolution on Drowning Prevention.
• World Health Organization has announced plans to develop the first ever Global Status Report on Drowning Prevention.
• World Health Organization has announced plans to establish a Global Partnership for Drowning Prevention in 2023.
The conference themes reflected the challenges and opportunities of reducing drowning in all communities, nations, and regions.
• Measuring and mapping the drowning burden.
• Addressing drowning prevention in life stages and populations.
• Addressing drowning prevention in activities and occupational settings.
• Advancing drowning prevention through policy, partnerships and planning.
• Showcasing world-leading advances in coastal safety.
• Showcasing world-leading advances in aquatic industry leisure management.
• Showcasing world-leading swimming and water safety education.
• Advancing the science medical treatment and issues in drowning and aquatic injury.
• Confronting the challenges of disaster and climate change.
• Advancing drowning prevention in global health and development agendas.
• Fostering innovation in response to emerging challenges and opportunities.
The Conference Closing Statement highlighted three main takeaways:
Drowning prevention is multidisciplinar y, multisectoral and bigger than any organisation or individual – seize opportunities to collaborate, grow, and continue to expand collective impact.
Drowning prevention is increasingly an issue of equity, meaning the need for diverse voices is clear – prioritise those most affected, historically marginalised, and excluded; seek out different perspectives and work to create opportunities for new and inclusive forms of leadership.
The drowning burden is disproportionately borne by those under 25 years of age – future drowning prevention efforts must place children, adolescents, and young people at the centre of decision making; include, listen, and centre youth in all aspects of drowning prevention.
This was the first time a World Conference on Drowning Prevention has been hosted in Australia. Co-hosts, the Royal Life Saving - Australia (RLSS) and Surf Life Saving Australia (SLSA) were immensely proud and eager to welcome the global community to Perth, embracing them with everything that is impactful about Australian approaches to water safety and drowning prevention.
https://wcdp2023.com/2024/03/14/closingstatement/
2023 Young Males Drowning Prevention Workshop
In October 2023, Royal Life Saving – Australia organised an Australian Water Safety Council Workshop to advance drowning prevention strategies for Young males (15-29 years), a Key Focus Area of the Australian Water Safety Strategy 2030. Practitioners, researchers, policymakers, and experts from Australia’s drowning prevention and men’s health sectors assembled at the Essendon Football Club in Melbourne for the one-day event.
The workshop included presentations from experts who work outside water safety, a panel discussion with young males working in a variety of drowning prevention and aquatics roles, a review of statistics and research on young male drowning, assessment of a variety of male-focused drowning prevention campaigns from Australia and New Zealand, and table-top discussions to assess and prioritise the key Australian Water Safety Strategy actions in this area. The group determined four major priorities required for progress in this Focus Area of the AWSS 2030 (below) and came away with several important learnings relevant for young male drowning prevention efforts.
MAJOR PRIORITIES FOR YOUNG MALE DROWNING PREVENTION
Renew focus on high school-based water safety education.
Robust water safety education is required in schools for population-level impact on young males. In addition to swimming and water safety skill attainment, social and cultural norms play an important role in drowning risk for this age group. Comprehensive programs in school settings focused on both skill ascertainment and healthy risk taking and informed decisionmaking concepts are needed.
Enhance campaign messaging strategies. Campaigns that promote safer activity around the water should be designed by or in partnership with young males themselves, focused on specific behaviour change, follow health promotion and social marketing principals, and adapt to the rapidly evolving digital landscape. Successful messaging to this group involves strengths-based approaches and often leans on the power of peers as a motivator for behaviour.
Involve young males in young male drowning prevention efforts. We need young males to drive action, inform priorities, and guide efforts. Every drowning prevention initiative focused on this population should strive to be led, designed, or at minimum, informed by, young males. One action to improve engagement and empower young males is establishing a young male drowning prevention advisory group.
Collaborate for collective impact.
Drowning prevention for this complex and multi-faceted group requires diversity of ideas, perspectives, and leadership. To advance action in this space, drowning prevention organisations must partner with each other, and with groups outside of water safety that work with or for young males. One action to enhance collective impact is to integrate drowning prevention into existing men’s health initiatives and messages.
This Focus Area Update Brief accompanies the Young males (15-29 years) Focus Area section of the Australian Water Safety Strategy 2030 (pgs. 18-19). Please see the original AWSS 2023 document here: https://www.watersafety.com.au/australian-water-safety-strategy/
October 2023 AWSS Young Male Drowning Prevention Workshop, Melbourne.
LESSONS FROM THE 2023 YOUNG MALE DROWNING PREVENTION WORKSHOP
Key takeaways for young male drowning prevention
“Young males (15-29 years)” is a broad categorisation for this complex population. Segmentation of this group is likely to result in more effective drowning prevention efforts, for example, prioritising young males with a common geography, similar interests and values, or closer age ranges (e.g., 15-19, 20-24, 25-29 years).
Peers are a driving force of behaviour for this populationyoung males place high value on their relationships with friends.
By viewing risk taking as healthy and normal, young males can be supported to make informed decisions and be in control of their behaviours.
Masculinity is evolving. Emotional connection, mental health, vulnerability, and physical wellness are increasingly associated with what it means to be a healthy young man.
The digital communication landscape for reaching this population is changing quickly. Generally, is more likely to use Instagram, Snapchat, and TikTok more than Facebook or Twitter/X.
Access and equity factors are critical for young male drowning prevention efforts. The impact and intersection of socio-economic status, geography, ethnicity, and cultural background are related to one’s access to safe places to swim and swimming and water safety education.
Key Questions for Behaviour Change Campaigns focused on Young Males
Provided by Professor Kate Westberg, RMIT University
• Do we understand the different segments in the young male (15-29) target audience and see things from their perspective?
• What gaps exist in the target segment’s knowledge, beliefs, attitudes, & capabilities?
• Are we considering a combination of activities in order to encourage young males to achieve the desired action?
• Are we clear about what specific behaviour(s) we would like the target segment(s) to do?
• What or who might influence the desired behaviour?
• How is the target segment responding to current initiatives?
• Do the benefits of doing what we would like them to do outweigh the costs or barriers to doing it?
Workshop presentations
A lived experience: pressures, challenges, and learnings in the AFL environment
Ivan Maric, Richmond FC
Men, masculinities and “health” behaviour
Prof Murray Drummond, Flinders University
Social marketing: Considerations for engaging for young males
Prof Kate Westberg, RMIT University
Lessons from Australia’s men’s health sector
Glen Poole, Australia Men’s Health Forum
“Don’t be that guy” – Male focused drowning prevention strategies in Aotearoa New Zealand
Daniel Gerrard, Water Safety New Zealand
Fatal drowning and risk taking among young males in Australia
Dr Jasmin Lawes, SLSA
Dr William Koon, RLSSA
Young Male Panel Discussion
Matt Haanappel, AUSTSWIM
Declan Gillard-Martin, RLS-SA Calden Lyons, Apollo Bay SLSC
Kai Nielsen, Belgravia Leisure
Key Characteristics of Health Initiatives that Work for Men
Adapted from the Australian Men’s Health Forum Guide to Male Friendly Services
Promotion
• Target men directly
• Meet men where they are
• Use male-friendly language
Cultural
• Don’t view men as a problem
• Combine getting help with giving help
• Build social connection between men
Structural
• Help men help themselves
• Support approaches “by men for men”
• Use male-friendly activities
• Work with men’s strengths
See more at: https://www.amhf.org.au/ guide_to_male_friendly_services
Multicultural
Royal Life Saving - Australia and Life Saving Victoria hosted a Multicultural Water Safety forum in Melbourne, last week, in response to a tragic summer where it is estimated that 25% of drowning deaths involved people born overseas.
Over 60 delegates from across Australia, including multicultural community leaders, government officials, academics, and the water safety sector, gathered for a two-day, nationally focused workshop to prioritise high-level solutions for addressing drowning among Australia’s multicultural communities.
Community leaders who attended the Forum made it clear to policy makers and water safety agencies that multiple solutions are needed that go beyond signage, learning to swim and translated resources. Community leaders emphasised that initiatives need to be co-designed with community and tailored to community needs in order to make a difference.
A highlight of the Forum was hearing from young community role models from multicultural backgrounds who learnt to swim in Australia and are now teaching their own communities, as one example of successful solutions that address both water safety and settlement outcomes, such as employment and social networks.
To download the report visit: https://www.royallifesaving.com.au/ research-and-policy/research-by-topic/ populations
The forum highlighted several key areas that require future discussion and action to improve water safety and reduce drownings in diverse communities. Some of these include:
1. Partnerships and collaboration among water safety organisations, swim program providers and multicultural agencies and community leaders to drive community level change, including working with university sectors to prioritise strategies for international students.
2. Sustained, expanded investment for the ongoing implementation of programs and initiatives aimed at reducing the drowning toll in vulnerable communities across the country.
3. Robust communication of water safety messages that go beyond translation and signage, co-designed with community leaders to ensure education campaigns and safety messages are understood and have greater reach into communities.
4. Removing barriers to participation and increasing access to appropriate swimming and water safety education programs for people of all ages, from all backgrounds and abilities.
people drowned in Australian waterways
Between 2013/14 and 2022/23
2013-20142014-20152015-20162016-20172017-20182018-20192019-20202020-20212021-20222022-2023 Financial Year
Summer Drowning Toll and media analysis
Royal Life Saving - Australia research shows a consistent peak in fatal drowning cases in the summer months. In a bid to understand the increased risks during this time, each year, we publish the Summer Drowning Toll from 1 December to the end of February, which charts drowning incidents around Australia in these months. This serves as a timely vehicle for us to promote safety advice in conjunction with our ongoing drowning prevention campaigns for particularly high-risk groups and communities, such as men, children and people from multicultural communities.
The purpose of the Summer Drowning Toll is to report on drowning number based on real-time report from the media and police reporting.
A media analysis was conducted that reviewed 166 drowning media stories between 1st July 2023 to 31st March 2024. March was included as it surprisingly was one of the highest months for drowning deaths. At the time of analysis, it was found that 57% of media stories did not focus on drowning but mainly on the rescue. When reading through these stories, it was also found that 46% were based on men that have died at various aquatic locations, without detailed information provided. Most of these stories took a coastal perspective however were short and non-informative.
Males sadly represented over 77% of cases that were reported in the media, and only 11% of media reports mentioned country of birth or cultural background. Drowning victims in the media were found to mostly be in their 20s followed by 40s. There were nine multiple fatality events, where more than one person drowned. Highest number of drowning fatalities in one event was 4 people. Three mass drowning events occurred during a storm or flood, which killed a total of 7 people.
In the media, there were 12 child reported drowning deaths under the age of 9-years old, 3 of these stories described victims to be non-verbal and autistic. One child drowning story was a double drowning event.
Three per cent of the media stories were rescues, all of which were parents trying to save their child. Cases where victim was rescuing a family member or another person, the media was very sentimental and would focus on remembering the victim rather than the event itself. Life jacket use was only mentioned or reported in 5% of media stories, whereas 7% of stories would identify the drowning had occurred at an unpatrolled beach.
Most media reports did not state who (91%) or what (61%) is responsible for the drowning event, and 5% identified the individual to be responsible for the drowning event. Nineteen per cent of media stories identified environmental conditions such as strong currents, floods, rising waters, rough waves, swells and rips were responsible for the drowning event. Only one news story mentioned alcohol as the reason for the drowning event.
Over 80% of media stories did not have water safety or drowning prevention messages, however water safety messages were more prevalent in stories that were based on unique locations such as storm drains and waterfalls. Media stories that did have water safety messaging, the top messages included:
• Being aware of the conditions and your limitations –making sure you have the right equipment
• Always swim between the flags
• Always supervise children around water
• There needs to be more warning signs and water safety information particularly for migrants, weak swimmers and children.
This analysis identified that details presented in the media is not enough to actually know who is drowning, therefore we need to be cautious with how we interpret these media stories.
Royal Life Saving’s Summer Drowning Toll dashboard was updated daily over the summer (1 Dec 2023 to 29 Feb 2024)
Indigenous research
Intertwining Indigenous ways of knowing, being and doing into water safety initiatives
Bronte Hayes, University of Wollongong
This research project led by Bronte Haynes, a Master’s student in Indigenous Health at the University of Wollongong and Kathleen Clapham, in partnership with the Royal Life Saving - Australia. This project explored the critical importance of water to the health, safety, and wellbeing of an Aboriginal community in Northwestern, NSW.
Using innovative arts-based methods, community mapping, and yarning, Bronte’s research delved into the profound connection between the Aboriginal community in Brewarrina, Western NSW and the Barwon River. By intertwining Indigenous ways of knowing, being and doing in the project, the study not only prioritised physical safety but upheld cultural heritage and respected the community’s intrinsic relationship with water.
Participants shared personal narratives and reflections through yarning, capturing the rich oral history and cultural messages that have been passed down through generations. The use of visual arts in the research allowed participants to depict their connection to the river, with paintings illustrating cultural stories of cultural beings that reside within the river. These beings played a role in cultural water safety messages, cautioning children against venturing to the river alone or after dark.
Community mapping sessions enabled participants to spatially represent their connection to water, highlighting significant landmarks and personal memories. This collaborative approach enriched the research with cultural and historical context, illustrating the deep bond between the community and the river.
The study uncovered the multidimensional bond with water that goes beyond the physical, encompassing cultural, emotional, and spiritual dimensions. This research not only celebrates cultural heritage but also demonstrates how art and storytelling play vital roles in preserving and deepening connections to land and water.
Bronte had the honour of presenting her findings at the Australasian Injury Prevention Network Conference in Rotorua, Aotearoa, where she was recognized as one of the three best presenters. Her work offers invaluable insights into the relationship between the Aboriginal community and water, highlighting the necessity of preserving these bonds for future generations.
Seven recommendations from the research:
• Respect for traditions and beliefs
• Effective communication
• Community engagement and empowerment
• Leverage local knowledge
• Cultural sensitivity and relevance
• Preservation of cultural identity
• Capacity building
1. World Health Organization, Global Report on Drowning: Preventing a Leading Killer. 2014, World Health Organisation: Geneva.
2. Australian Water Safety Council, Australian Water Safety Strategy 2030. 2021, Australian Water Safety Council: Sydney.
3. Australian Bureau of Statistics. Census of Population and Housing: Socio-Economic Indexes for Areas (SEIFA), Australia, 2021. 2021 Available from: https:// www.abs.gov.au/statistics/people/people-andcommunities/socio-economic-indexes-areas-seifaaustralia/latest-release
4. Pickles, K., S. Pidgeon, and R. Houston, Supervision of children at public pools: An analysis of industry programs. 2022, Royal Life Saving Society - Australia: Sydney.
5. Sherry, E., et al., The Social Impact of the National Aquatic Industry. 2021, Swinburne Sport Innovation Research Group and Royal Life Saving Society: Victoria, Australia.
6. Willcox-Pidgeon SM, Peden AE, and Scarr J, Exploring children’s participation in commercial swimming lessons through the social determinants of health. Health Promotion Journal of Australia, 2020.
7. Miller, L (2023). Analysis of unintentional drowning in Australia 2002-2022: progress, challenges and data to inform prevention. Royal Life Saving Society –Australia. Sydney
8. Mahony A, Pidgeon S (2023) Review of pool fencing legislation in Australia. Royal Life Saving Society –Australia. Sydney
9. Crawford, G., et al., Public health interventions to prevent children drowning: an updated systematic review. Journal of Public Health, 2024
10. Royal Life Saving Society – Australia, National Swimming and Water Safety Framework. 2019, Royal Life Saving Society – Australia: Sydney.
11. Leavy JE, Della Bona M, Abercromby M, Crawford G (2022) Drinking and swimming around waterways: The role of alcohol, sensation-seeking, peer influence and risk in young people. PLoS ONE 17(11): e0276558. https://doi.org/10.1371/journal. pone.0276558
12. Willcox-Pidgeon SM, et al., Boating-related drowning in Australia: Epidemiology, risk factors and the regulatory environment. Journal of Safety Research, 2019. 70: p. 117-125. DOI: 10.1016/j.jsr.2019.06.005
13. Peden, A. E., Daw, S., & Lawes, J. C. (2022). Preliminary evaluation of the impact of mandatory life jacket laws at declared high-risk rock platforms on unintentional rock fishing drowning deaths. Injury prevention, 28(6), 560-563. https://doi. org/10.1136/ip-2022-044724
14. Australian Bureau of Statistics. National, state and territory population, 2023. Available from: https:// www.abs.gov.au/statistics/people/population/ national-state-and-territory-population/latestrelease#data-downloads-data-cubes
Acknowledgement of Country
Royal Life Saving - Australia and Surf Life Saving Australia acknowledge the Aboriginal and Torres Strait Islander people of this nation. We pay our respects to their Elders past, present and emerging recognising their continued connection to land, waters and communities.
Suggested citation
Royal Life Saving Society – Australia (2024) National Drowning Report 2024, Sydney Australia. https://doi.org/10.62977/85070