

NATIONAL COASTAL SAFETY REPORT
KEY DEMOGRAPHICS
* Arrows denote change from 10-year average 86% MALE 61 20 23 26 1 9 10
LOCATION
INTRODUCTION
The National Coastal Safety Report 2024 is a comprehensive summary and analysis of SLSA research and presents evidence relating to participation, perceptions, lifesaving service delivery, coastal drowning and other coastal fatalities around the country. This report complements the National Drowning Report 2024 released in August in partnership with Royal Life Saving Australia.
Our beautiful coast and beaches are part of everyday life for many, with 85% of the population living within 50km of the coast. More than 16 million Australian residents (aged 16+ years) made over 650 million individual visitations to the coast in the last year, 86% of which were to a beach. Of the people who visit our coast, swimming remains the most popular coastal activity (57%), followed by boating (17%), then snorkelling (14%).
One in three beachgoers visit unpatrolled beaches, where hazardous conditions and lower perceived risk heighten drowning risks. Unpatrolled beaches are popular, yet they pose significant dangers, especially to recent migrants who may lack water safety skills. Our research shows engagement in formal swimming or water safety is higher for people that migrate to Australia at a younger age. A key concern is that migrants who have arrived within the last two years visit the coast more frequently and are at higher risk of being unintentionally caught in a rip current.
This highlights the need for improved water safety education, reinforces calls for equitable access to services

and education to tackle this issue. With more people flocking to our beaches, Surf Life Saving Australia (SLSA) is vital in promoting safety, education, and equitable access to lifesaving services, ensuring that coastal visits remain joyful rather than tragic.
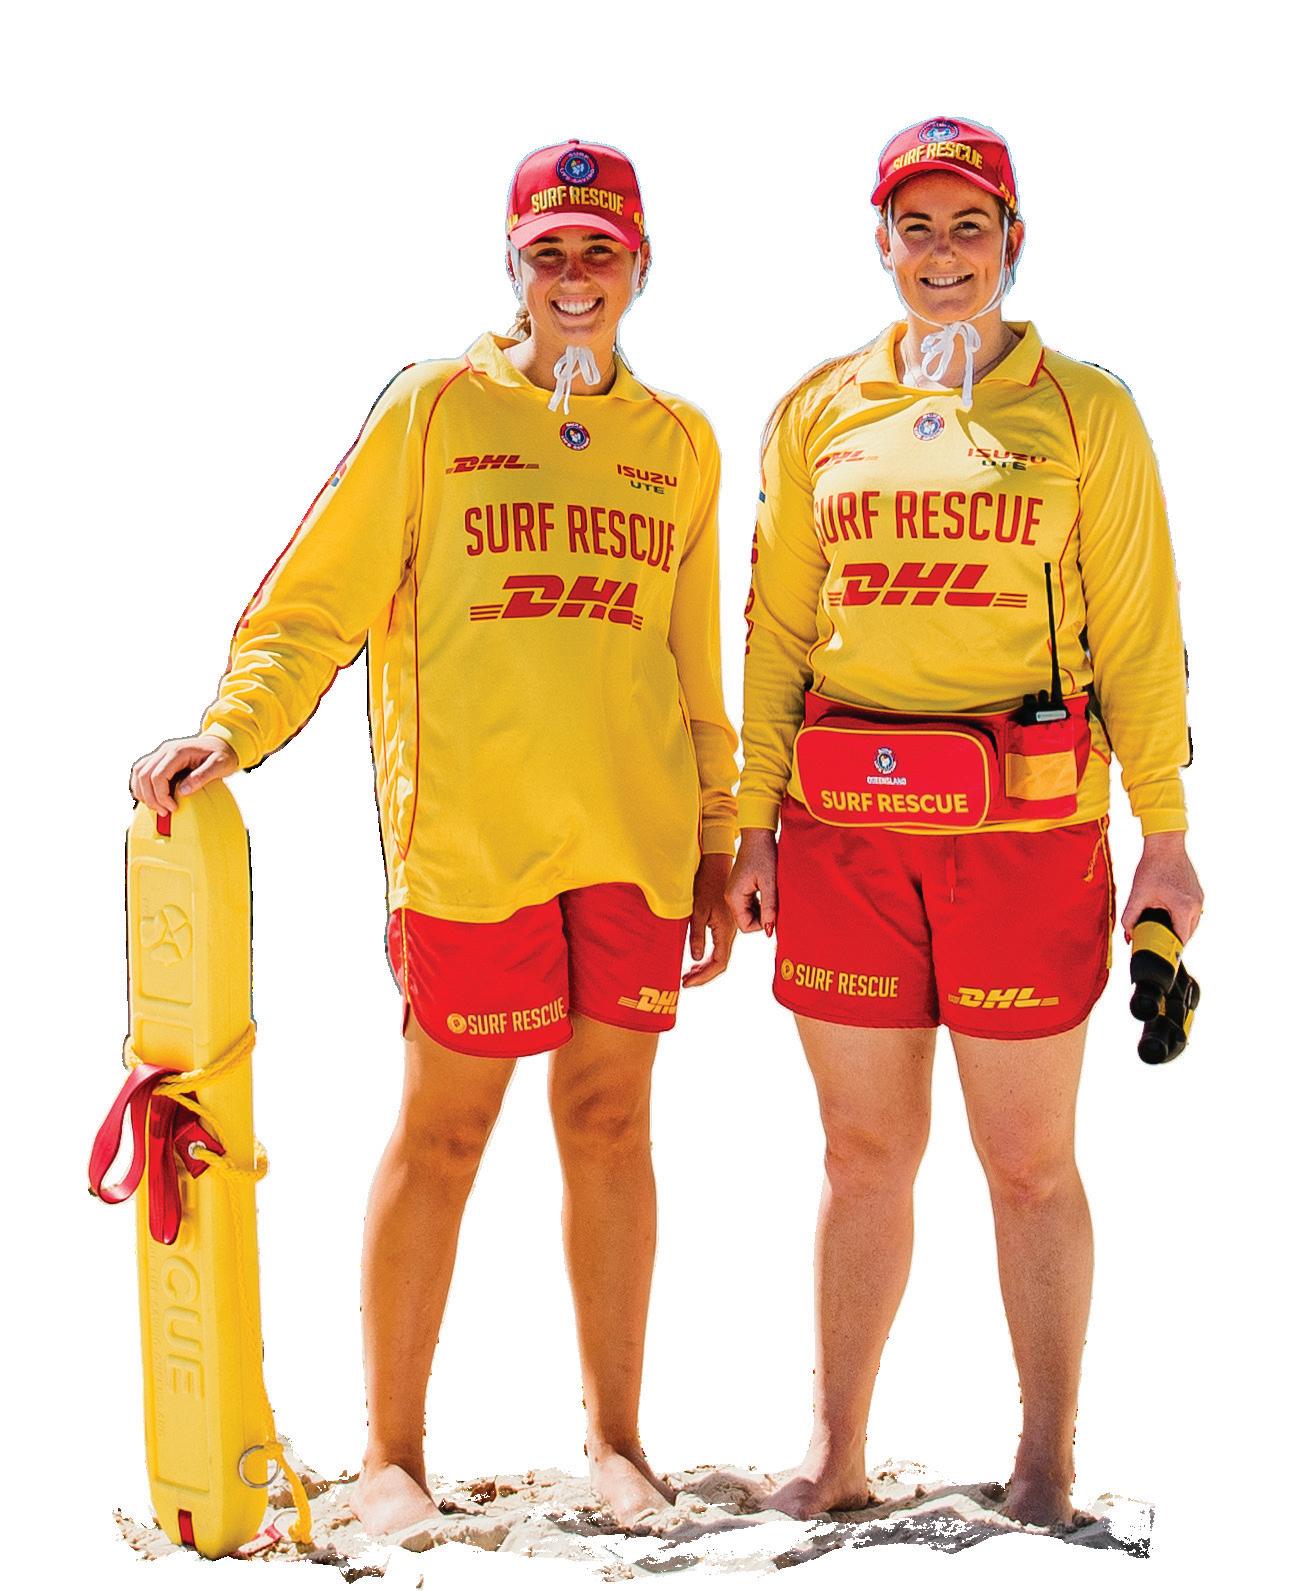
As the peak coastal water safety, drowning prevention, and rescue authority, SLSA is dedicated to creating a safe environment on Australia’s beaches and coastline. With more than 198,000 members providing lifesaving patrols on beaches, our volunteer surf lifesavers and paid lifeguards are a critical first responder component of our emergency response network.
This essential community service provides beachgoers with a safe place to swim and enjoy the beach with their friends and family. Patrols were provided by members from 558 services around Australia including 315 Surf Life Saving Clubs and 243
Australian Lifeguard Services. These services performed almost 9,000 rescues, over 1.4 million volunteer patrol hours and nearly 500,000 lifeguard service hours on patrol over 2023/24. In addition, our volunteers provided almost 50,000 first aid treatments and performed over 2.4 million preventative actions, which is the highest recorded number of preventative actions. Our research shows that since 2013/14, rescues have been decreasing while preventative actions are increasing.
Tragically, the 2023/24 period recorded 258 coastal deaths, 57% due to drowning. The 150 coastal drowning deaths represent 46% of the national drowning burden, the highest number of coastal drowning deaths recorded since records began in 2004. This is a 22% increase from 2022/23 (n=123) and an 18% increase from the ten-year average (n=127).
Without the enormous efforts of volunteer surf lifesavers and lifeguards
though, this would have been far higher and it is estimated that there would have been 1,684 additional drowning deaths and 1,010 critical injuries. These efforts in preventing injury and death on our coast provide a $9.5 billion-dollar economic impact for the community.
Men continue to dominate coastal drowning statistics representing 86% of coastal drowning in 2023/24. This year, 40-49 year olds and 20-24 year old comprise a combined 31% of coastal drowning deaths, with those aged 50+ years accounting for 50% of the drowning burden.
More than half occurred at beaches (56%, n=84), with one in three beach drowning deaths due to rip currents. Swimming at locations away from lifesaving services is again highlighted as a major risk – seven in ten coastal drowning deaths occurred more than one kilometre away from a surf lifesaving service (69%, n=104), showcasing again how lifesaving personnel are increasingly being called upon to do more without having additional resources. Never before have our surf lifesavers and lifeguards been asked to do so much.

With increasing beach visitations and more people swimming beyond the traditional summer holiday periods, coastal drowning is becoming a year-round public health concern. This is reflected in 2023/24 figures, with winter drowning deaths (n=26) 24% above average (n=21). Similarly, while most coastal drowning deaths did occur during summer months (43%, n=65), the highest number of incidents were recorded in February and March (15%, n=23 each), both 64% above the ten-year average (n=14).

An ongoing commitment to research is crucial for understanding why and how incidents occur, and to provide evidence to guide future prevention or mitigation strategies and inform resource allocation to support lifesaving services and the Australian community.
The National Coastal Safety Report 2024 is more than just numbers, it represents the significant loss of 258 people who did not return home to their families and friends – the highest drowning record in our history. The vision to achieve zero preventable deaths in Australian waters is a necessity that demands collaboration with communities and government. I encourage you to take the time to comprehend the gravity of this report. Together, we must work tirelessly to turn this vision into reality, ensuring that no more lives are needlessly lost along our coastline.
Adam Weir Chief Executive Officer Surf Life Saving Australia

8,857 RESCUES
WERE PERFORMED OVER 2023/24 - EACH ONE A NEAR MISS AND REPRESENT A LIFE SAVED
TOTAL SERVICE PLAN
The Total Service Plan is SLSA’s national drowning reduction strategy and service plan. It is created using an iterative process of analysis and review to identify coastal safety issues of national importance. This approach follows the public health model and is consistent with international risk management principles.
In collaboration with stakeholders, SLSA identifies coastal safety risks using incident monitoring, coastal risk assessments and participation analysis. This information is analysed to identify the top national coastal safety issues, priorities and blackspot areas that require intervention or mitigation strategies.
THE NATIONAL SAFETY AGENDA
Context
Drowning Statistics
Non-fatal Drowning Data
Operational Statistics
Market Research
Population Data
Participation/Behaviour Data
Coastal Safety Hub Risk Assessment
Risk Identification
Incident Tracking
Capability Statement
Participation/Behaviour
Communication & Consultation
Market Research
Stakeholder Consultation Councils, Committees and Groups Conferences and Forums
The issues and blackspots identified through the Total Service Plan process form the basis of SLSA’s National Safety Agenda. The agenda influences lifesaving operations, including services and equipment allocation.
It drives public education, including evidence-based mitigation strategies, communications campaigns and pilot projects, and informs SLSA’s research plan.
The Total Service Plan takes a risk management approach. It allows SLSA to use the evidence to ensure we locate lifesaving services and assets in areas of need and have appropriate public education programs and mitigation strategies to address the coastal safety issues and known blackspots. Embedded in the process is continual monitoring and evaluation to ensure the treatments and interventions are effective in reducing drowning deaths along the Australian coast.
The coastal safety needs of the Australian community reflected in the National Safety Agenda and the Surf Life Saving movement’s capacity and capability to meet these needs are explored in the ‘Capability’ section of this report.
NATIONAL SAFETY AGENDA ISSUES
Analysis
National Risk Register
Coastal Risk Assessments
Coastal Safety Briefs
Trend Identification GIS Analysis
Analysis Evaluation
National Coastal Safety Report
Strategic Research Agenda
National Safety Agenda
Critical Incident Analysis
Target Identification Case Studies
National Coastal Safety Issues
Blackspot Identification
Treatment/Intervention
Lifesaving and Support Services
Blackspot Reduction Program
Beach Safety Equipment Fund
Communication Campaigns
Public Education and Training
Early Warning Systems
TOTAL SERVICE PLAN PROCESS OVERVIEW
The Total Service Plan aligns with the International Standard ISO 31000:2018 framework, which provides principles and guidelines for risk management.
Monitoring & Evaluation
Monitor
Evaluate Pilot Programs
Evaluate Research
Figure 01
SECTION 1 COMMUNITY

16.6
AUSTRALIAN ADULTS (16+ YEARS) VISITED THE COAST IN 2023/24
15 PARTICIPATED IN COASTAL ACTIVITIES IN 2023/24
13.5
VISITED DURING LAST SUMMER
AUSTRALIAN POPULATION
VISITATION
& PARTICIPATION BY STATE
Figure 02
AUSTRALIAN POPULATION DENSITY PER LOCAL GOVERNMENT AREA (LGA)
This heat map shows the estimated Australian population density per LGA at June 2024. The majority of LGAs with a population density greater than 100 persons per square kilometre are located on Australia’s extensive coastline.
The National Coastal Safety Survey 2024 (NCSS2024) collected data on coastal visitation, frequency and activity participation for each state which are also presented here.
1.7M Coastal visitors 3.3 Visits per month 2.1 Hours per visit 1.4M Coastal activity participants
<0.1 persons per km2
0.1 - 1 persons per km2
1 - 10 persons per km2
10 - 100 persons per km2
>100 persons per km2
NT
0.15M Coastal visitors
4.0 Visits per month
2.2 Hours per visit
0.1M Coastal activity participants
SA
1.2M Coastal visitors
2.8 Visits per month
2.1 Hours per visit
1.0M Coastal activity participants
VIC
4.2M Coastal visitors
2.0 Visits per month
2.5 Hours per visit
3.4M Coastal activity participants
TAS
QLD
3.5M Coastal visitors
4.3 Visits per month
2.6 Hours per visit
2.8M Coastal activity participants
NSW
5.5M Coastal visitors
3.5 Visits per month
2.6 Hours per visit
4.5M Coastal activity participants
0.4M Coastal visitors
5.4 Visits per month
2.0 Hours per visit
0.3M Coastal activity participants
COASTAL VISITATION & PARTICIPATION
NATIONAL TRENDS

Figure 03
NCSS2024: COASTAL VISITATION & PARTICIPATION SUMMARY
Australians love the coast. To better understand how the coast is used, the annual National Coastal Safety Survey (NCSS) explores coastal visitation, activity participation, behaviours and perceptions. In the last twelve months, 16.6 million Australian adults (16 years and above) visited the coast on average 3.3 times each month. This suggests that there were over 650 million individual visitations to our coast last year. Males and females visit the coast equally (males 8.5 million visitors, females 8.1 million visitors), however, males visit more frequently (males average 3.5 visits per month, females average 3.0 visits per month).
8.5M COASTAL VISITORS
3.5 VISITS PER MONTH 2.4 HOURS PER VISIT 7M COASTAL ACTIVITY PARTICIPANTS 8.1M COASTAL VISITORS 3.0 VISITS PER MONTH 2.5 HOURS PER VISIT 6.5M COASTAL ACTIVITY PARTICIPANTS
16.6M
3.3 VISITS/MONTH
2.5 HOURS/VISIT
AUSTRALIAN ADULTS VISITED THE COAST IN 2023/24
13.5M COASTAL ACTIVITY PARTICIPANTS
Figure 04
NCSS2024: COASTAL VISITATION BY STATE
Frequency of coastal visitation varies by state. NSW has the highest number of coastal visitors (5.5 million visitors), 27% of which visit the coast at least once per week, and 22% at least once a month. This is followed by Victoria (4.2 million visitors; 17% weekly, 20% monthly), then Queensland (3.5 million visitors; 32% weekly, 21% monthly).
WATER USAGE IN COASTAL ENVIRONMENTS
Figure 05
NCSS2024: COASTAL LOCATIONS VISITED
Five in six visits to the coast were to a beach (86%), with the remaining 14% to other areas such as rocky coastline.
Figure 06
NCSS2024: FREQUENCY OF WATER USE
One in ten Australian adults enter the water every time they visit the coast (13%), with 27% entering the water most visits.
Figure 07
NCSS2024: FREQUENCY OF WATER USE BY DEMOGRAPHICS
Water use varies by age and state. Younger Australians enter the water more frequently than older Australians. People living in NSW use the water most, followed by those living in Queensland and Western Australia. Males and females both use the water equally.
ACTIVITY PARTICIPATION
PARTICIPATION BY
SEX, FREQUENCY & STATE
Coastal participation varies by activity, sex, age, and state. These pages show the number of annual activity participants, the frequency of participation, as well as the proportion of participants by sex, age, and state.
SEX
ACTIVITY PARTICIPANTS
RESCUE EXPERIENCE & SAFETY BEHAVIOURS
TOP 4 ACTIVITIES WITH THE HIGHEST PROPORTION OF PARTICIPANTS WHO HAVE REQUIRED RESCUING
13%
SCUBA DIVERS
SAFETY PRACTICES: DIVE WITH A BUDDY 90% USE SAFETY EQUIPMENT 88%
12%
SURFERS
SAFETY PRACTICES: SURF WITH A BUDDY 76% AVOID ALCOHOL/DRUGS 83%
8%
WATERCRAFT USERS
SAFETY PRACTICES: PADDLE WITH A BUDDY 77% FOLLOW LAWS & REGULATIONS 86%

ACTIVITY PARTICIPANTS
RISK TAKING & SAFETY BEHAVIOURS
Figure 08
NCSS2024: RISK TAKING VS. FOLLOWING SAFETY PRACTICES BY SEX
Overall, females follow safety practices more often than males (80% of the time vs. 76% of the time). However, males are more likely to take risks while participating in coastal activities than females (56% vs. 40%).
Males are 1.4x more likely to take risks during coastal activities than females
Figure 09
NCSS2024: PLAY SAFE INDEX
The play safe index is a representation of risk for activity participation by sex. It visualises the percentage of activity participants who feel experienced enough to take risk against the frequency of following safety practices. Points in the upper right hand corner represent the highest risk activity populations, including male rock fishers, land-based fishers, and watercraft users. Points in the bottom left represent the lowest risk activity populations, including female boaters, PWC riders, snorkellers, swimmers, waders, and rock fishers.
COASTAL SAFETY
RISK TAKING & SAFETY BEHAVIOURS
Figure 10
NCSS2024: COASTAL HAZARDS RATED EXTREMELY/VERY HAZARDOUS BY SEX
Male perception of coastal hazards is consistently lower than that of females. Rip currents remain the number one coastal hazard, rated extremely/very hazardous by 85% of females and 78% of males, followed by tropical marine stingers (72% of females, 70% of males), then sun exposure (74% of females, 63% of males).
Figure 11
NCSS2024: COASTAL CONCERNS FOR AUSTRALIAN ADULTS
One in two Australian adults are extremely/very concerned with being unintentionally caught in a rip current when visiting the coast (47%), while 37% are concerned with being stung by a marine stinger.
Figure 12
NCSS2024: TOP 4 AUTHORITIES TURNED TO FOR COASTAL SAFETY ADVICE
Lifesaving personnel are the number one trusted authority on coastal safety, trusted by 40% of Australian adults, followed by the Coastguard (10%), then the Bureau of Meteorology (9%).
RIP CURRENTS
EXPERIENCES
NUMBER
1 COASTAL HAZARD
82%
OF AUSTRALIAN ADULTS PERCEIVE RIP CURRENTS AS EXTREMELY/VERY HAZARDOUS
22%
HAVE EVER BEEN CAUGHT IN A RIP CURRENT UNINTENTIONALLY
1 IN 4
CAUGHT IN A RIP REQUIRED ASSISTANCE TO ESCAPE
27%
17%


Figure 13
NCSS2024: HAVE EVER BEEN UNINTENTIONALLY CAUGHT IN A RIP CURRENT
One in four males have been unintentionally caught in a rip current in their life (27%) compared to 17% of females.
Figure 14
NCSS2024: RIP CURRENT ESCAPE METHODS
Among those who have been caught in a rip current, seven in ten managed to self-recover by swimming or floating to safety (70%). One in four required assistance from someone else (12% by a member of the public, 9% by lifesaving personnel, and 5% by a surfer).
Figure 15
NCSS2024: RECOGNISED RIP CURRENT ESCAPE STRATEGIES
Nine in ten Australian adult swimmers recognise raising your arm to attract attention as an effective strategy for escaping a rip current (92%), compared to 84% asking a surfer for help and 67% recalling to float.
HAZARD PERCEPTIONS & SAFETY BEHAVIOURS
Figure 16
NCSS2024: HAZARD PERCEPTION OF RIP CURRENTS
Four in five Australian adults rate rip currents as being extremely/very hazardous (82%).
Figure 17
NCSS2024: CONFIDENCE & ABILITY TO IDENTIFY A RIP CURRENT
Two in five Australian adults state they are confident they can spot a rip current (44%), however, when tested, only 47% of those were able to do so correctly.
Figure 18
NCSS2024: LOOK FOR RIP CURRENTS BEFORE ENTERING THE WATER
One in two Australian adult swimmers always look for rip currents before entering the water (45%), while 25% check most of the time. One in ten never check for rip currents before entering the water (8%).
Figure 19
NCSS2024: REASONS FOR NOT LOOKING FOR RIP CURRENTS
The main reason for not looking for rip currents is not knowing what to look for (31%), followed by an intention not to go far into the water (14%).
AUSTRALIAN VS. OVERSEAS BORN
COASTAL VISITATION & ACTIVITY PARTICIPATION
Figure 20
NCSS2024: FREQUENCY OF VISITATION BY TIME LIVED IN AUSTRALIA
Frequency of coastal visitation varies by length of time since arriving in Australia. Those who arrived less than two years ago visit the coast most frequently, with 30% visiting the beach weekly, and an additional 25% visiting at least once a month. Those who arrived between two and ten years ago visit the coast slightly less (25% weekly, 26% monthly), but still more than those born in Australia (22% weekly, 18% monthly). Coastal visitation is lowest among those who arrived more than ten years ago (18% weekly, 15% monthly).
Figure 21
NCSS2024: FREQUENCY OF WATER USE BY TIME LIVED IN AUSTRALIA
Water use is highest among those who were born in Australia, followed closely by those who arrived between two and ten years ago.
Figure 22
NCSS2024: ACTIVITY PARTICIPATION BY TIME LIVED IN AUSTRALIA
Coastal activity participation is generally highest among those who arrived in Australia between two and ten years ago. This is particularly true for activities such as snorkelling, watercraft use, boating, surfing, and scuba diving. These activities often require more experiential knowledge and skill to participate in safely, and often take place away from patrolled areas.
SAFETY BEHAVIOURS & EXPERIENCES
Figure 23
NCSS2024: HAZARD PERCEPTION OF BEACHES BY TIME LIVED IN AUSTRALIA
Those who have arrived in Australia within the last two years generally perceive the beach (patrolled or unpatrolled) to be more hazardous than those who have lived in Australia for longer. However, their perception of the coast in general as being hazardous is lower than the other groups.

Figure 24
NCSS2024: SWIMMERS WHO HAVE BEEN CAUGHT IN A RIP IN THE LAST TWO YEARS BY TIME LIVED IN AUSTRALIA
Australians who have arrived in the country within the last two years are much more likely to have been caught in a rip compared to those who have lived in Australia for longer.
Figure 25
NCSS2024: PARTICIPATION IN FORMAL SWIMMING & WATER SAFETY EDUCATION LESSONS BY AGE AT ARRIVAL
Among those not born in Australia, engagement in either formal swimming lessons or water safety education is much higher for those who arrived in Australia at a younger age compared to those who arrived when they were older. Early access to swimming lessons is central if we are to bridge swimming ability gaps in new migrants.
UNPATROLLED BEACHES
Unpatrolled beaches are an emergent concern for coastal safety practitioners, often in remote and isolated locations. These locations present a greater risk, being further away and less accessible for lifesaving personnel.
Figure 26
NCSS2024: LOCATION OF LAST TEN COASTAL VISITS BY RESIDENCE DISTANCE TO A PATROLLED LOCATION
People who live close to a patrolled beach visit unpatrolled locations at the same rate as those who live far from a patrolled beach. This suggests that proximity and convenience are not the only reasons people visit unpatrolled locations.
NCSS2024: HAZARD PERCEPTION OF THE COAST & BEACHES
Unpatrolled beaches are perceived to be the most dangerous coastal location, with 56% of Australian adults rating them as extremely/very hazardous, compared to only 14% for beaches in general.
28
NCSS2024: BEACH PREFERENCES
If given a choice, seven in ten Australian adults would prefer to visit a patrolled beach (68%), compared to 10% who prefer unpatrolled beaches. One in five adults have no preference (22%).
Figure 27
Figure
29
NCSS2024: MAIN REASONS SWIMMERS VISIT UNPATROLLED BEACHES
The main reasons swimmers visit unpatrolled beaches relate to low level of perceived risk including that they do not go far into the water (39%) and that they feel safe where they swim (35%). Other reasons relate to preference, including that individuals like secluded areas and that patrolled beaches are too crowded (31% each). Accessibility is also important, but less so than preference and risk perception.

30
NCSS2024: SAFETY PRACTICES AT UNPATROLLED BEACHES
When visiting an unpatrolled beach, more than half of Australian adults sometimes or never check the surf conditions prior to entering the water (51%) and 45% sometimes or never check mobile phone coverage or plan what to do in case of an emergency.
Figure 31
NCSS2024: HAVE YOU EVER EXPERIENCED ANY DIFFICULTY IN THE WATER AT AN UNPATROLLED LOCATION?
One in seven Australians have experienced difficulty while in the water at an unpatrolled location (15%).
Figure
Figure
SECTION 2 CAPABILITY

315 SURF LIFE SAVING CLUBS
47,641 PROFICIENT MEMBERS
1,462,533 VOLUNTEER PATROL HOURS
8,857 RESCUES PERFORMED
243 AUSTRALIAN LIFEGUARD SERVICES
9 WESTPAC LIFESAVER RESCUE HELICOPTER SERVICES
VALUE TO COMMUNITY
$9,526,720,569
CAPABILITY
CORE SERVICES AND OPERATIONAL OVERVIEW
Surf Life Saving Australia’s (SLSA) position as Australia’s leading coastal safety authority Is founded on the national delivery of its essential services. SLS provides these core services through Surf Life Saving Clubs (SLSCs), Support Operations, and the Australian Lifeguard Service (ALS), who are responsible for coastal patrols, surveillance, and search and rescue (SAR) operations. The ability of SLS to carry out these vital functions, including its support in SAR operations, after-hours incidents, and natural disasters, is well-regarded by emergency services and disaster response agencies. The community and partner organisations are safeguarded through our dedication to high-quality training, with 40,868 Bronze Medallion and 6,773 Surf Rescue Certificate holders across 315 Surf Life Saving Clubs.
VOLUNTEER SURF LIFESAVERS
Surf Life Saving Australia’s success (SLSA) stems from our robust volunteer base, comprising over 198,000 members, making it one of the largest volunteer organisations globally. This diverse and skilled volunteer workforce is vital to SLSA’s achievements. In the past year, 45,236 volunteers contributed 1,462,533 hours of service through patrols. During these patrols, volunteers performed 5,274 rescues, undertook 661,831 preventative actions, and provided 25,262 first aid treatments.
Surf lifesavers are equipped with specialised gear and equipment and trained to use it effectively in various conditions. Rescue boards and tubes are primary tools for surf lifesavers on patrol, complemented by 1,224 inflatable rescue boats (IRBs) that enhance our service reach and capabilities. IRBs enable swift navigation through inshore surf, allowing surf lifesavers to cover greater distances for extended periods. Rescue boards are the most frequently used equipment for rescues (see Figure 37). Land-based roving patrols enhance our aquatic services and are a crucial part of SLSA’s drowning prevention strategy. A fleet of 358 side-by-side (SSV) vehicles and 222 4WD vehicles support patrols to monitor coastal locations beyond supervised patrolled areas. Aerial surveillance is facilitated by Unmanned Aerial Vehicles (UAVs; Figure 36), extending our reach and effectiveness.
SLSA’s capabilities extend beyond the iconic red and yellow flags, with 233 rescue watercraft (RWCs) and three jet rescue boats (JRBs) allowing for prompt responses in challenging coastal conditions. The organisation also operates nine offshore rescue boats (ORBs) and two rigidhull inflatable boats (RIBs) for blue-water rescues and extended surveillance and SAR operations.
AUSTRALIAN LIFEGUARD SERVICE
The Australian Lifeguard Service (ALS), a division of SLSA, is the largest professional lifeguard provider in Australia, operating 243 services at beaches and pools. With over 1,350 lifeguards employed on full-time, parttime, and casual contracts, the ALS complements SLSA’s volunteer services to provide comprehensive, year-round safety, including 365-day coverage. The ALS logged 497,752 service hours, performed 3,583 rescues, executed 1,820,182 preventative actions, and administered 24,069


first aid treatments. Their operations are supported by 91 vehicles and 55 RWCs. Lifeguard services managed internally by Australian councils are not included in this report.
WESTPAC LIFESAVER RESCUE HELICOPTER
For rapid, isolated, or complex rescues, the nine Westpac Lifesaver Rescue Helicopters offer invaluable aerial support, significantly boosting SLSA’s surveillance and SAR capabilities. These helicopters are equipped to handle challenging and often inaccessible rescue scenarios where traditional methods may fall short. Their ability to quickly navigate across various terrains, including remote or hazardous areas, allows them to effectively reach and assist individuals in urgent situations. This aerial support is crucial during incidents such as floods, severe weather events, or maritime emergencies, where swift intervention can mean the difference between life and death.
The helicopters are equipped with advanced technology and rescue equipment, including winching systems which enhances their effectiveness in locating and rescuing individuals under difficult conditions.
Beyond their primary role, the Westpac Lifesaver Rescue Helicopters also play a critical part in broader emergency
and disaster response efforts. They collaborate with other emergency services and disaster management agencies, providing essential aerial surveillance and support for various types of crises, including bushfires, natural disasters, and large-scale search operations. Their versatility and rapid deployment capabilities make them a key asset in coordinating multi-agency responses and delivering immediate assistance to affected areas. By integrating the Westpac Lifesaver Rescue Helicopters into emergency operations, SLSA extends our reach, effectiveness and ensures the comprehensive coverage and rapid response capabilities to diverse and complex rescue scenarios.
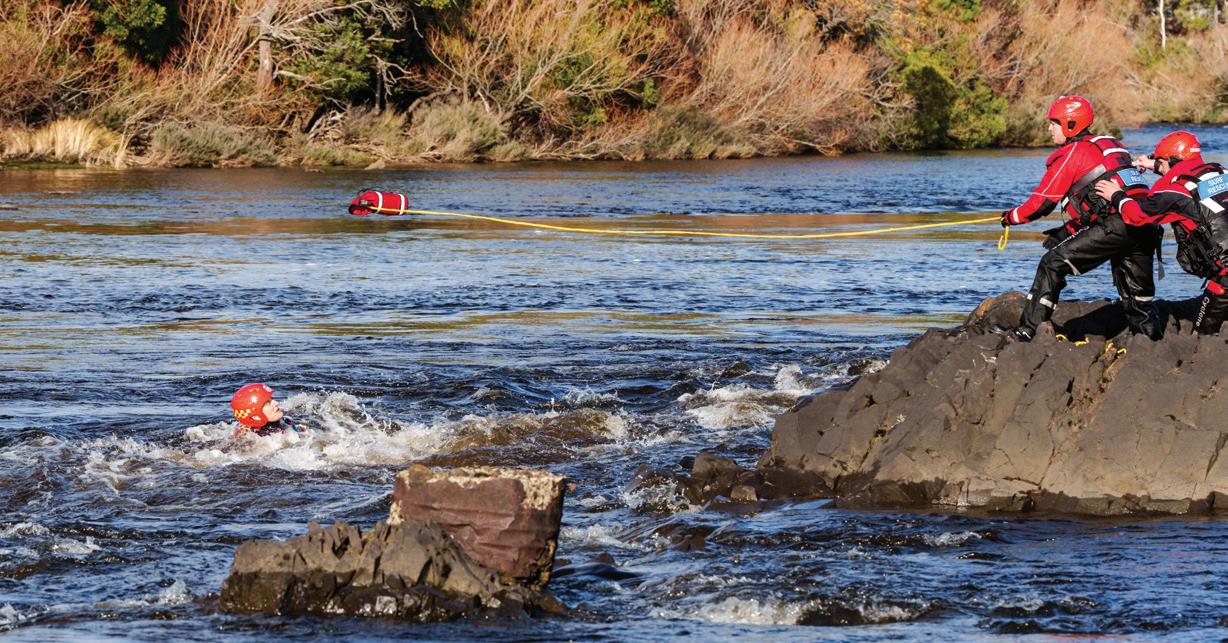
SWIFT WATER RESCUE
SLSA is well-prepared to manage swift water rescues, crucial for handling emergencies in rapidly flowing rivers, streams, and flood situations. This capability is vital during extreme weather events and natural disasters, where fast-moving water can create hazardous conditions for affected communities. SLSA’s swift water rescue operations are supported by specialised training and equipment. Surf lifesavers receive dedicated training tailored to the demands of swift water environments, focusing on techniques for navigating high currents and conducting safe rescues. They are equipped with inflatable rescue boats, personal flotation devices, and other essential gear to operate effectively in challenging conditions.
The organisation’s swift water rescue efforts are bolstered by coordination with other emergency services and disaster response agencies. This collaboration ensures a comprehensive approach to flood emergencies, integrating resources and expertise from various organisations to provide timely and effective assistance.

SURF LIFE SAVING SERVICES
2023/24: SURF LIFE SAVING SERVICES
Over 2023/24, SLSA supported 565 services around Australia. There are 315 Surf Life Saving Clubs and seven affiliated marine rescue services, with 129 in New South Wales, 58 in Queensland, 57 in Victoria, 31 in Western Australia, 22 in South Australia, 22 in Tasmania and three in the Northern Territory. The Australian Lifeguard Service provides 243 lifeguard services around Australia, with 97 in New South Wales, 76 in Queensland, 42 in Victoria, 16 in Western Australia, eight in the Northern Territory, two in South Australia and two in Tasmania.
SERVICE DELIVERY
2,482,013 PREVENTATIVE ACTIONS
49,331
1,462,533
VOLUNTEER PATROL HOURS
8,857 RESCUES
497,752
LIFEGUARD SERVICE HOURS
$9,526,720,569 VALUE TO COMMUNITY FIRST AID TREATMENTS
Figure 33
2023/24 THE VALUE OF SURF LIFE SAVING
This year Surf Life Saving Services performed 8,857 rescues, 2.4 million preventative actions, and provided 49,331 first aid treatments at a value of more than $9.5 billion to the community.
AWARD HOLDERS
40,868 BRONZE MEDALLION
2023/24: PROFICIENT MEMBERS
There was a total of 47,641 proficient members, including 40,868 Bronze Medallion holders and 6,773 Surf Rescue Certificate holders
SILVER MEDALLION IRB DRIVER
7,951
IRB CREW CERTIFICATE
15,348
SILVER MEDALLION PATROL CAPTAIN
1,383 SILVER MEDALLION BEACH MANAGEMENT
10,174
6,773 SURF RESCUE CERTIFICATE (CPR ENDORSED)
* Totals include member holders of multiple similar awards
Figure 34
2023/24: QUALIFICATIONS HELD BY MEMBERS
13,933
FIRST AID*
19,929
GOLD MEDALLION (ADVANCED LIFESAVING)
496 ADVANCED RESUSCITATION TECHNIQUES*
RADIO OPERATOR CERTIFICATE
4,738
Surf Life Saving Australia has 45,236 patrolling members who collectively hold 73,952 additional lifesaving qualifications. This underscores the extensive training our surf lifesavers undergo to ensure they are highly skilled first responders.
RESOURCE CAPACITY

35
2023/24: PATROLLING MEMBERS

There were a total of 45,236 members who performed a patrol. Of these patrolling members, 59.7% were male and 40.2% were female. 30 members identified with a non-binary gender (<1%).
810 BEACH SURVEILLANCE
42,837
40,185 SHARK SURVEILLANCE
SEARCH & RESCUE FLIGHTS & OVER 201,000KM FLOWN
Figure 36
2023/24: UAV CAPACITY
111
SLS UAV operations have expanded, with 42,837 flights covering over 201,000 KM. These missions include 40,185 flights for shark surveillance, 810 flights for beach surveillance, and participation in 111 search and rescue missions.
Figure 37
2023/24: EQUIPMENT USED IN RESCUES
Boards were used in 41% of rescues, followed by rescue watercraft (RWCs; 20%) and rescue tubes (17%).
Figure
ASSET CAPABILITY
2023/24: SLS MAJOR ASSET LOCATION AND SERVICE RANGE
SLS maintains a fleet of 288 rescue watercraft (RWC), three jet rescue boats (JRB), two rigid-hull inflatable boats (RIB), nine offshore rescue boats (ORB), and nine rescue helicopters. Their locations and service ranges are depicted on this map.
Key to Asset Location
Rescue Water Craft (RWC)
Jet Rescue Boat (JRB)
Rigid-hull Inflatable Boat (RIB)
Offshore Rescue Boat (ORB)
Westpac Lifesaver Rescue Helicopter
8
77
44
17
118
RESCUES
Figure 39
2023/24: RESCUES PER LOCAL GOVERNMENT AREA (LGA)
SLS surf lifesavers, lifeguards and lifesaving services performed 8,857 rescues across 117 local government areas around Australia.
Key to Rescues per LGA

< 14 Rescues

15 - 49 Rescues

50 - 149 Rescues

150 - 399 Rescues

> 400 Rescues
37
680
86
849
2,633
4,489
83
PREVENTATIVE ACTIONS
2023/24: PREVENTATIVE ACTIONS PER LOCAL GOVERNMENT AREA (LGA) SLS surf lifesavers, lifeguards and lifesaving services performed 2,482,013 preventative actions across 117 local government areas around Australia.
Key to Preventative Actions per LGA
< 1,499 Actions
1,500 - 4,999 Actions
5,000 - 19,999 Actions
20,000 - 99,999 Actions
> 100,000 Actions
6,393
787,366
104,461
11,923
455,937 1,291
1,114,642
FIRST AID
Figure 41
2023/24: FIRST AID PER LOCAL GOVERNMENT AREA (LGA)
SLS surf lifesavers, lifeguards and lifesaving services performed 49,331 first aid treatments across 117 local government areas around Australia.
Key to First Aid Incidents per LGA
< 49 Incidents
50 - 349 Incidents
350 - 649 Incidents
650 - 2,999 Incidents
> 3,000 Incidents
3,752
368
550
1,321
25,106
136
18,098
TRENDS IN LIFESAVING
PREVENTATIVE ACTION TRENDS
National trends of the past ten years show an increasing number of preventative actions being carried out, while the number of rescues performed has declined. General preventions, including warnings to swimmers, craft users, and the use of signage, have increased significantly since 2013/14, with the overall number of preventative actions more than doubling in this time. These preventions are likely to have led to the reduction in rescues. This suggests SLS community interactions are becoming more prevention-focused rather than reactive responses. SLS members are equipped with specialised gear and equipment, with powercraft becoming increasingly used to perform a rescue. Since 2019/20, a greater proportion of rescues are using powered craft, including rescue watercraft (RWC), inflatable rescue boats (IRB), and helicopters.
Figure 42
2014-24: PREVENTATIVE ACTIONS OVER TIME
The number of preventative actions has increased over the past ten years, with 2023/24 recording 2,482,013 preventative actions, 39% above the ten-year average (n=1,781,900).
Figure 43
2020-24: 5-YEAR PREVENTATIVE ACTION TRENDS
Numbers of preventative actions have increased since 2019/20. This is due to an increase in preventions, including warnings to swimmers, craft users, and the use of signage.
RESCUE TRENDS
Figure 44
2014-24: RESCUES OVER TIME
The number of rescues has decreased over the past ten years, with 2023/24 recording 8,857 rescues, 13% below the ten-year average (n=10,146).
Figure 45
2014-24: RESCUES USING POWERED VS. UNPOWERED CRAFT
Unpowered rescues make up the majority of rescues performed (66% in 2023/24), however, the proportion of powered rescues has increased since 2013/14, from 26% to 34% this year.
Figure 46
2020-24: 5-YEAR RESCUE TRENDS FOR UNPOWERED CRAFT
Rescues carried out using a rescue board has consistently increased over the past five years, similar to rescue tubes. These two gear types are the main equipment used for rescues, followed by no gear.
Figure 47
2020-24: 5-YEAR RESCUE TRENDS FOR POWERED CRAFT
Rescues using powered rescue craft has fluctuated over the past five years, with an increase in helicopter rescues observed. Rescue Water Craft (RWC) are the primary powered craft used in rescues, followed by inflatable rescue boats (IRB).
LIFESAVER LEARNING
TRANSFORMATIVE DROWNING PREVENTION THROUGH BEACH SAFETY LESSONS
BACKGROUND AND APPROACH
Australia has an incredible integrated network of lifesaving services who safeguard the beachgoing community. This significant contribution to drowning prevention is relatively successful, such that most coastal drowning deaths occur at unpatrolled locations away from these services and their protection.
SLSA is working with drowning prevention researchers to explore innovative approaches to address this concern and do more to keep people safe at unpatrolled beaches.
Surf Life Saving alongside the Universities of Melbourne and New South Wales, have been trialling a new type of beach safety intervention that combined a 20-minute safety lesson delivered by lifesaving personnel with a post-lesson conversation where participants were asked whether they had enjoyed the lesson, learned anything, and were they likely to change their beachgoing behaviours. Follow-up interviews were conducted four to six months later, to measure the impact of these lessons on behaviours.
KEY FINDINGS
12 Community Beach Safety lessons were conducted in Lorne, Victoria, with approximately 600 participants. Lessons used landmarks and observations of beach conditions to support learning about water safety and risk. Most participants (93%) enjoyed the lessons and 91% reported learning something new. Learning how to identify and escape a rip current were the two most learned skills.
The follow-up interviews revealed that 76% of people who had been to the beach since the lesson changed their beachgoing behaviour, with most trying to identify rip currents with friends or family before entering the water. Of this 76% of participants, 46% reported changing their behaviour at an unpatrolled beach.
Increased awareness of risk or ability to recall information from the safety lesson alone did not influence behaviour change. People who reported changed behaviour, described a reflective change or reevaluation of their past beachgoing behaviours. This significant finding highlights the importance of reflective cognitive processes for behaviour change. Being given an opportunity to self-reflect and re-evaluate behaviours after an enjoyable learning experience at the beach with lifesaving experts was the driver of this behaviour change.
Following the success of the pilot, the project was replicated at Umina, with 34 safety lessons delivered by surf lifesavers to nearly 300 community
members. Preliminary analyses have showed significant community learning, with 86% (n=64) stating that they learned either how to identify a rip current, how to escape a rip, or how to safely help someone else caught in a rip. This second case study showed the transferability of the approach to different locations and its capacity to impact learning. To target safer behaviours at unpatrolled locations, safety lessons from lifesaving practitioners could be implemented at scale to provide the needed water safety skill-building that translates to safer unpatrolled beaches, or potentially other aquatic locations.


20-MINUTE COMMUNITY SAFETY LESSON
91%
LEARNED SOMETHING NEW 93% ENJOYED THE LESSONS
86%
LEARNED HOW TO IDENTIFY A RIP
LEARNED OPTIONS THAT CAN HELP TO ESCAPE FROM A RIP
LEARNED HOW TO HELP SOMEONE CAUGHT IN A RIP
3in4 LOOKED FOR RIPS WHEN THEY WENT TO THE BEACH
46%
CHANGED BEHAVIOUR AT AN UNPATROLLED BEACH
SECTION 3 DROWNING ANALYSIS

150 COASTAL DROWNING DEATHS
21% 40-49 YEARS OLD
10% 20-24 YEARS OLD
43% SUMMER
56% BEACH
100% AWAY FROM PATROLLED AREAS
COASTAL DROWNING & FATALITY
2023/24: YEAR IN REVIEW
Earlier this year, the National Drowning Report 2024 revealed that 323 people lost their lives due to drowning between 1 July 2023, and 30 June 2024. Drowning deaths in coastal environments accounted for 46% of the national drowning burden (n=150). This is the highest number recorded since SLSA started collecting data on coastal drowning deaths in 2004.
In addition to the 150 coastal drowning deaths, 108 other coastal fatalities were recorded, 59% of which were unintentional. This means that a total of 258 deaths were recorded along the Australian coastline in 2023/24, a 17% increase from the previous year (n=221) and a 12% increase from the ten-year average (n=231).
The number of coastal deaths may have been far worse if not for the 8,857 rescues, 2,482,013 preventative actions and 49,331 first aids performed by SLS members. This section explores these deaths to better inform operations and to understand the true mortality burden our members and the community face.
Males remain a high-risk demographic, being 6.5 times more likely to drown in Australian coastal environments compared to females. Considering age groups, the greatest number of drowning deaths were recorded among 40-49 (21%) and 20-24 year olds (10%), while those aged 50+ accounted for 50% of the coastal drowning burden. Swimming/wading was the most common activity for decedents to have been participating in prior to a fatal drowning incident (41%), followed by boating (11%), then equally by snorkelling and falls (7% each).
Beaches were the leading location for coastal drowning deaths (56%) with rip currents known to be a causal factor in 35% of these incidents. Seven in ten drowning deaths (69%, n=104) occurred more than 1km away from a lifesaving service, with all incidents occurring at unpatrolled locations, outside of patrol times, or outside the red and yellow flags.
While we encourage the community to swim between the flags, it is recognised that this is not always possible. With this in mind, when heading to the coast, please remember to stop and check for rip currents before entering the water, look for other dangers, and plan how to stay safemaking water safety a priority for everyone this year.
150 DROWNING DEATHS
COASTAL 141 OCEAN 9
INTENTIONAL 44 UNINTENTIONAL 64
62
Figure 48 2023/24: OVERVIEW OF COASTAL DEATHS
Overall, 258 coastal deaths were recorded in 2023/24, with a mortality rate of 0.96/100,000 pop.
Figure 49
2023/24:
COASTAL MORTALITY BY STATE
New South Wales recorded the highest number of coastal deaths (n=99; 61 drowning deaths) , followed by Queensland (n=47; 23 drowning deaths), then Victoria (n=40; 26 drowning deaths). Tasmania recorded the highest mortality rate (2.61/100,000 pop.), followed by the Northern Territory (1.58/100,000 pop.), then Western Australia (1.31/100,000 pop.). Drowning deaths were the most prevalent incident across all states/territories (58%, n=150).
Coastal drowning
Coastal fatality
Coastal drowning or fatality 23:24 4 20:18 9:6 26:14 61:38 10:5
2023/24: COASTAL DEATH LOCATIONS
In 2023/24, 150 coastal drowning deaths and 108 other coastal fatalities were recorded. Red and yellow numbers indicate the number of drowning deaths and fatalities respectively for each state. For states with small numbers, black numbers indicate combined drowning deaths and other fatality numbers.
2023/24:
LOCAL GOVERNMENT AREA BLACKSPOTS
A blackspot is an area where a concentration of incidents are recorded and have a high probability/risk of ongoing reoccurrence. These LGAs below recorded the highest number of fatal coastal incidents (both drowning deaths and other fatalities) in 2023/24.
NSW: Northern Beaches (9), National Parks and Wildlife Service NSW (9), Shoalhaven (7), Sutherland (6), Woollahra (5), Central Coast (5), Waverley (5), Coffs Harbour (5), Port Stephens (5)
QLD: Queensland Parks and Wildlife Service (8), Sunshine Coast (8), Great Barrier Reef Marine Park Authority (5), Cairns (4), Gold Coast (3)
VIC: Mornington Peninsula (8), Bass Coast (6), Hobsons Bay (4), Colac Otway (3), Parks Victoria (3)
WA : Rockingham (4), Albany (4)
TAS: Kingborough (2), Hobart (2)
SA : Port Adelaide Enfield (3), Glenelg (2)
NT: Darwin (4)
Figure 50
COASTAL DROWNING
2023/24: YEAR IN REVIEW
The following pages present a deeper analysis of coastal drowning deaths that occurred this year. This information is invaluable for understanding circumstances around incidents and assisting with the development of education and awareness programs, initiatives and actions to reduce coastal incidents into the future.
KEY DEMOGRAPHICS
COASTAL DROWNING DEATHS
The
coastal
drowning rate was 2.3x higher during summer
Figure 51
2023/24: COASTAL DROWNING DEATHS OVER TIME
Coastal drowning deaths during 2023/24 were in line with the 10year average up until mid-December, when numbers rose more steeply through to April. The final number of 150 coastal drowning deaths is the highest recorded since Surf Life Saving Australia’s data collection began in July 2004.

Figure 53
Figure 52
2023/24: COASTAL DROWNING BY AGE & SEX
The highest number of coastal drowning deaths were recorded among 45-49 year olds (11%, n=16), followed by 20-24 and 40-44 year olds (10%, n=15 each), while those over 50 years old accounted for 50% of coastal drowning deaths (n=75). The highest age-specific drowning rate was among 70-74 year olds (1.21/100,000 pop.), followed by 75-79 year olds (1.17/100,000 pop.). Males accounted for 86% of drowning deaths (n=129) and were 6.5 times more likely to drown than females (0.97/100,000 males vs. 0.15/100,000 females).
2023/24: DROWNING DISTANCE FROM SURF LIFE SAVING SERVICE
Seven in ten coastal drowning deaths occurred more than 1km away from a Surf Life Saving service (69%, n=104). All incidents occurred outside of the red and yellow flags, patrol times, or at unpatrolled locations.
Figure 54
2023/24: DROWNING BY ACTIVITY
Swimming and wading recorded the most drowning deaths (41%, n=61), followed by boating (11%, n=16), then by snorkelling and falls (7%, n=11 each). Swimming and wading drowning deaths increased by 49% compared to the 10-year average.
Figure 55
2023/24: REMOTENESS CLASSIFICATION OF DROWNING LOCATION
One in two incidents occurred in a regional/remote area (49%, n=73), 42% in major cities, and 9% offshore. The remoteness classification of an incident location was coded to the Australian Statistical Geographical Standard of Remoteness Areas. 1 in 3 beach
Figure 56
2023/24: DROWNING BY LOCATION & RIP CURRENT DROWNING AT BEACHES
Beaches were the leading location for coastal drowning deaths (56%, n=84), followed by offshore (19%, n=28), then rock/cliff locations (13%, n=19). Rip currents were known to contribute to one in three of beach drowning deaths (35%, n=29), however, this may be higher as rip involvement remains unknown for 42% of beach cases.
Figure 57
2023/24: RESIDENCE
DISTANCE TO DROWNING LOCATION
Most decedents were intrastate visitors to the drowning location (31%, n=46), followed by local residents (25%, n=38).

OCCURRED IN THE AFTERNOON (12-6PM)
Figure 58
2023/24: DROWNING
DEATHS BY DAY
Two in five drowning deaths occurred on a weekend (40%, n=60).
Figure 59
2023/24: DROWNING DEATHS BY MONTH
Most coastal drowning deaths occurred during summer (43%, n=65), but winter drowning was 24% above average. The highest number of incidents were recorded both in February and March (15%, n=23 each), 64% above average.
COASTAL DROWNING
2014-24: 10-YEAR ANALYSIS
Figure 60
2014-24: NATIONAL COASTAL DROWNING DEATH TRENDS (N=1,267)
Annual trends of coastal drowning deaths are illustrated above. Tragically, 150 coastal drowning deaths were recorded in 2023/24, 18% above the 10-year average and the highest number since Surf Life Saving Australia’s records began in 2004. While the 2023/24 coastal drowning death rate (0.56/100,000 pop.) was also above the 10-year average (0.51/100,000 pop.), it was still below the highest rate recorded in 2015/16 (0.57/100,000 pop.).
KEY DEMOGRAPHICS
1,276
COASTAL DROWNING DEATHS
0.51 87% 13%
DROWNING RATE/100,000 POP.
16% 20-29 YEARS OLD
16% 40-49 YEARS OLD
Figure 61
2014-24: DROWNING BY ACTIVITY
Drowning prevalence varies by activity and over time. Since 2014, swimming and wading has recorded the most drowning deaths (32%, n=411), followed by boating (19%, n=242), then snorkelling (9%, n=120).

Figure 62
2014-24: DROWNING DISTANCE FROM SURF LIFE SAVING SERVICE
Three in four drowning deaths (74%, n=936) occurred greater than 1km from a Surf Life Saving service.
Figure 63
2014-24: DROWNING DEATHS BY LOCATION
Beaches are the leading drowning location (50%, n=635), followed by offshore (21%, n=264), then rock/cliff locations (17%, n=211).
Figure 64
2014-24: REMOTENESS CLASSIFICATION OF DROWNING LOCATION
One in two drowning deaths occurred in a regional/remote area (55%, n=700), followed by major cities (38%, n=486), then offshore locations (6%, n=81). The remoteness classification of an incident location was coded to the Australian Statistical Geographical Standard of Remoteness Areas.
COASTAL DROWNING LOCATIONS
2014-24: 10-YEAR ANALYSIS
17
83
270
459
189 59
UNINTENTIONAL COASTAL FATALITIES
2014-24: 10-YEAR ANALYSIS
Figure 65
2014-24: NATIONAL COASTAL FATALITY DEATH TRENDS (N=592)
Annual trends of unintentional coastal fatality rates are illustrated above. 64 coastal fatalities were recorded in 2023/24, above the 10-year average (n=59). The coastal fatality rate was equal to the 10-year average (0.24/100,000 pop.).
KEY DEMOGRAPHICS
UNINTENTIONAL COASTAL FATALITIES 592 DROWNING RATE/100,000 POP. 0.24
22% 55-64 YEARS OLD
19% 65-74 YEARS OLD
Figure 66
2014-24: AVERAGE COASTAL FATALITIES BY ACTIVITY COMPARED TO 10-YEAR AVERAGE Fatality numbers vary by activity and over time. Boating has recorded the greatest number of fatalities (22%, n=131), followed by falls (12%, n=69), then non-aquatic transport (11%, n=66).
Figure 67
2014-24: COASTAL FATALITY DISTANCE FROM SURF LIFE SAVING SERVICE
Three in four coastal fatalities have occurred more than 1km from a Surf Life Saving service (77%, n=456).
Figure 68
2014-24: COASTAL FATALITY BY LOCATION
Beaches are the leading location for coastal fatalities (49%, n=289), followed by offshore (20%, n=118), then rock/cliff locations (15%, n=86).
Figure 69
2014-24: COASTAL FATALITY REMOTENESS CLASSIFICATION
Three in four coastal fatalities have occurred in regional/remote areas (57%, n=335), followed by major cities (35%, n=205), then offshore (9%, n=52). The remoteness classification of an incident location was coded to the Australian Statistical Geographical Standard of Remoteness Areas.
COASTAL FATALITY LOCATIONS
2014-24: 10-YEAR ANALYSIS
18
132
43 52
200
COASTAL DROWNING VS. FATALITY
2014-24: 10-YEAR ANALYSIS
Surf life saving personnel respond to all incidents regardless of their cause. To develop a holistic picture of coastal mortality trends and emergent issues, SLSA collates information on all deaths that occur along the coast. This serves to improve our understanding of the challenges faced by surf life savers on patrol and enables better resource allocation for effective and continued service delivery.
Figure 70
2014-24: DROWNING VS. FATALITY BY AGE & SEX
The age profile of drowning deaths is much flatter and broader, impacting those aged 20 to 74 years old in similar numbers, compared to unintentional coastal fatalities, which are more prevalent among those in older age groups (55 to 74 year olds).
Figure 71
2014-24: AVERAGE DROWNING VS. FATALITY BY MONTH
Drowning deaths are the most prevalent type of coastal death and record a noticeable spike in numbers during the warmer summer months. Unintentional coastal fatalities are less common and relatively constant throughout the year with a much smaller spike over summer.
RECOMMENDED SAFETY PRACTICES DROWNING
Swim at a patrolled location
Don’t mix alcohol/drugs with swimming
Swim with others and supervise children at all times
Check for rip currents and hazardous conditions before entering the water
Have regular medical checks
Learn CPR and first aid to help protect others
Go with a buddy and look after others
Beware of overheating and the increased risk of cardiac events
VISITOR DROWNING
2014-24: INTRASTATE VISITORS
Figure 72
2014-24: DROWNING LOCATION DISTANCE FROM RESIDENCE
Between 2014 and 2024, 30% of coastal drowning deaths occurred among intrastate visitors (n=384).
Figure 73
2014-24: INTRASTATE VISITOR DROWNING DEATHS BY LOCATION
Half of the incidents happened on beaches (48%, n=184), followed by offshore (25%, n=94), then rock/cliff locations (19%, n=76).
INTRASTATE VISITOR DROWNING DEATHS 384
REGIONAL/REMOTE AREAS
Figure 74
2014-24: INTRASTATE VISITOR DROWNING DEATHS BY STATE
One in three intrastate visitors drowned in New South Wales (31%, n=118), followed by Victoria (21%, n=79), then Queensland (19%, n=74).
2014-24: INTERSTATE VISITORS
Figure 75
2014-24: DROWNING LOCATION DISTANCE FROM RESIDENCE
Between 2014 and 2024, 7% of coastal drowning deaths occurred among interstate visitors (n=83).
REGIONAL/REMOTE AREAS
INTERSTATE VISITOR DROWNING DEATHS
Figure 76
2014-24: INTERSTATE VISITOR DROWNING DEATHS BY LOCATION
Over half of the incidents happened on beaches (55%, n=46), followed by offshore locations (20%, n=17) and rock/cliff locations (16%, n=13).
Figure 77
2014-24: INTERSTATE VISITOR DROWNING DEATHS BY STATE
Half of domestic interstate tourists drowned in New South Wales (47%, n=39), followed by Queensland (24%, n=20), then Tasmania (8%, n=7).
VISITOR DROWNING
2014-24: INTERNATIONAL VISITORS
INTERNATIONAL VISITOR DROWNING DEATHS
REGIONAL/REMOTE AREAS
Figure 78
2014-24: VISITOR CATEGORY OF DECEDENT
Between 2014 and 2024, 7% of coastal drowning deaths occurred among international visitors (n=81).
Figure 79
2014-24: BIRTH CONTINENT OF INTERNATIONAL VISITOR
Two in five international visitors hail from Europe (41%, n=33), followed by 37% from Asia (n=30), then 15% from North America (n=12).
Figure 80
2014-24: INTERNATIONAL VISITOR DROWNING DEATHS BY LOCATION
Almost two thirds of international visitor drowning incidents happened at beaches (63%, n=54), followed by offshore locations like the Great Barrier Reef (23%, n=20).

2023/24: VISITATION & CAPABILITY
In the last twelve months, 5.5 million New South Wales residents (16 years and above) visited the coast on average 3.5 times each month (NCSS2024). This equates to approximately 230 million individual visitations to the coast.

PROFICIENT MEMBERS 21,073
PATROLLING MEMBERS 20,878
$$$$$ NEW SOUTH WALES
VOLUNTEER PATROL HOURS 685,090 CAPABILITY $4,423,009,839 VALUE TO COMMUNITY 2.6 HOURS/VISIT
442 Searches
5.5M COASTAL VISITORS 3.5 VISITS/MONTH 4.5M COASTAL ACTIVITY PARTICIPANTS 4,489 RESCUES 1,114,642 PREVENTATIV E ACTIONS
18,098 FIRS T AID TREATMENTS
254 Shark alarms 236 Lost children
11,646 Marine stings 227 Fractures/ Dislocations
13 CPR provided
COASTAL DROWNING
2023/24: YEAR IN REVIEW
Across New South Wales, 128 drowning deaths were recorded in 2023/24, 48% of which occurred in coastal waters (n=61, 0.73/100,000 pop.). This is a 27% increase from last year (n=48), and 33% above the tenyear average (n=46).
Males continue to be overrepresented, accounting for 85% of coastal drowning deaths, with 20-29 (16%) and 45-54 (23%) year olds identified as high-risk age groups in New South Wales coastal drowning deaths.
Swimming/wading, rock fishing and watercraft recorded 39%, 11% and 7% of coastal drowning deaths respectively. Most coastal drowning deaths occurred at beaches (56%), with a further 25% at rock/cliff locations.
Regional and remote areas, which are harder to access and often have limited resources, recorded 39% of coastal drowning deaths, and 62% occurred more than 1km from a Surf Life Saving service.
INCREASE FROM 10-YEAR AVERAGE 0.73/100,000POP. DROWNING RATE COASTAL DROWNING DEATHS
NB: Arrow indicates change from 10-year average
NEW SOUTH WALES
2014-24: COASTAL DROWNING DEATHS
Figure 81
2014-24: COASTAL DROWNING DEATH TRENDS
NSW coastal drowning deaths and drowning rates are illustrated above. Coastal drowning deaths and rates recorded in 2023/24 (n=61; 0.73/100,000 pop.) were above the 10-year average.
CAUSAL FACTORS
Figure 82
2014-24: DROWNING DEATHS BY ACTIVITY
Drowning prevalence varies by activity and over time. Since 2014, swimming and wading has recorded the most coastal drowning deaths (35%, n=161), followed by rock fishing (17%, n=80), then boating and personal watercraft (PWC; 12%, n=54).
EMERGENCY RESPONSE BEACONS
The New South Wales coastline covers more than 1,500 kilometres, 800 beaches and 600 shore platforms, presenting a significant challenge for water safety personnel to monitor visitors and respond to incidents efficiently.
While surf lifesaving and lifeguard services are available at nearly 200 beaches, there are many areas where no services are provided, leading to a majority of coastal drowning incidents occurring at unpatrolled sites or outside of patrol times.
To address this issue, Surf Life Saving NSW is expanding the network of Emergency Response Beacons (ERBs) at high-risk locations. These ERBs are equipped with a telephone and camera, enabling bystanders to instantly alert the Surf Emergency Response System (SERS) in the event of an emergency. This allows for a quicker and more targeted response, as the precise location of the ERB is known, and a direct line of communication is established between the witness and emergency response services.
In addition, all ERBs are being retrofitted with Rescue Tubes to enable capable bystanders to perform rescues if necessary. Furthermore, video footage from many locations is analysed by third-party AI to monitor beach activity and enhance safety measures.
The implementation of ERBs requires collaboration with coastal safety stakeholders and compliance with relevant legislation, and has been wellreceived by local communities. Currently, there are 40 ERBs along the New South Wales coastline, with an additional 32 proposed for installation over the next four years, including upgrades to existing ERBs.

ERBS HAVE BEEN INSTALLED AT THE FOLLOWING LOCATIONS OVER THE PAST 24 MONTHS:
• Brunswick Heads, Byron Shire
• Belongil Beach, Byron Shire
• Suffolk Park, Byron Shire
• Lennox Head, Ballina Shire
• The Ruins, Port Stephens
• Fingal Spit, Port Stephens
• Fingal Island, Port Stephens
• Budgewoi, Central Coast
• The Entrance, Central Coast
• Pearl Beach, Central Coast
• Forresters Beach, Central Coast
• Bateau Bay, Central Coast
• North Palm Beach, Northern Beaches
• Turimetta Beach, Northern Beaches
• Gordons Bay, Randwick
• Mahon Pool, Randwick
• Woonona Pool, Wollongong
• Austinmer Beach, Wollongong
• Illawarra Channel, City of Shellharbour
• Shellharbour South, City of Shellharbour
In the last twelve months, 3.5 million Queenslanders (16 years and above) visited the coast on average 4.3 times each month (NCSS2024). This equates to approximately 180 million individual visitations to the coast.
2023/24: VISITATION & CAPABILITY 2,633 RESCUES 787,366 PREVENTATIV E ACTIONS
2.6 HOURS/VISIT
2.8M
$2,972,165,797 VALUE TO COMMUNITY
Searches
Shark alarms 70 Lost children 25,106 FIRS T AID TREATMENTS
COASTAL DROWNING
QUEENSLAND 2023/24: YEAR IN REVIEW
Across Queensland, 70 drowning deaths were recorded in 2023/24, 33% of which occurred in coastal environments (n=23). This is a 14.8% decrease from last year (n=27), and 14.8% below the ten-year average (n=27).
Males continue to be overrepresented, accounting for 87% of drowning deaths, with 40-49 (22%) and 60-69 (35%) year olds identified as high-risk age groups in Queensland coastal drowning deaths.
Swimming/wading, boating and snorkelling accounted for 35%, 22% and 17% of coastal drowning deaths, respectively. Most coastal drowning deaths occurred in offshore waters (48%), with a further 35% at beaches.
Regional and remote areas, which are harder to access and often have limited resources, recorded 43% of coastal drowning deaths, and 70% occurred more than 1km from a Surf Life Saving service.
COASTAL DROWNING DEATHS
DECREASE FROM 10-YEAR AVERAGE 0.42/100,000POP. DROWNING RATE
NB: Arrow indicates change from 10-year average
YEAR OLDS
YEAR OLDS
QUEENSLAND
2014-24: COASTAL DROWNING DEATHS
Figure 83
2014-24: COASTAL DROWNING DEATH TRENDS
QLD coastal drowning deaths and drowning rates are illustrated above. Coastal drowning deaths and rates recorded in 2023/24 (n=23; 0.42/100,000 pop.) were below the 10-year average.
KEY DEMOGRAPHICS
Figure 84
2014-24: DROWNING DEATHS BY ACTIVITY
Drowning prevalence varies by activity and over time. Since 2014, swimming and wading has recorded the most coastal drowning deaths (33%, n=90), followed by boating and personal watercraft (25%, n=67), then snorkelling (16%, n=44).
CAUSAL FACTORS
2020-24: QUEENSLAND BEACH DROWNING DEATHS
Figure 85
2020-24: BEACH DROWNING DEATH TRENDS
Since 2019/20, 62 drowning deaths have been recorded at Queensland beaches. 2020/21 recorded the most in a single year (n=18).
Figure 86
2020-24: RESIDENT STATUS
One in two beach drowning decedents were Australian-born (52%), while 37% were Australian residents who were born overseas, and 10% were short term visitors. Resident status was unknown for 2% of decedents.
Figure 87
2020-24: BEACH RESCUES BY AGE & SEX
Males are a high risk demographic, being 1.5x more likely to be rescued than females. This is true for both children and adults, while both male and female young adults are rescued equally.
4.2M COASTAL VISITORS 2.7
2023/24: VISITATION & CAPABILITY 849 RESCUES 455,937 PREVENTATIV E ACTIONS 103 Searches 11 Shark alarms
In the last twelve months, 4.2 million Victorians (16 years and above) visited the coast on average twice per month (NCSS2024). This equates to approximately 100 million individual visitations to the coast. CAPABILITY
PROFICIENT MEMBERS 7,278
MEMBERS
3.4M
ACTIVITY PARTICIPANTS 2.5 HOURS/VISIT
$1,529,941,231 VALUE TO COMMUNITY
73 Lost children 1,321 FIRS T AID TREATMENTS
COASTAL DROWNING
VICTORIA 2023/24: YEAR IN REVIEW
Across Victoria, 54 drowning deaths were recorded in 2023/24, 48% of which occurred in coastal environments (n=26). This is a 37% increase from last year (n=19), and 38% above the ten-year average (n=18.9).
Males continue to be overrepresented, accounting for 85% of coastal drowning deaths, with 20-29 (27%) and 55-64 (31%) year olds identified as high-risk age groups in Victoria coastal drowning deaths.
Swimming/wading, snorkelling and scuba diving recorded 54%, 12%, 8% of coastal drowning deaths, respectively. Most coastal drowning deaths occurred at beaches (65%), with a further 19% in offshore waters.
Regional and remote areas, which are harder to access and often have limited resources, recorded 62% of coastal drowning deaths, and 69% occurred more than 1km from a Surf Life Saving service.
VICTORIA
2014-24: COASTAL DROWNING DEATHS
88
2014-24: COASTAL DROWNING DEATH TRENDS
Annual trends of coastal drowning deaths and rates are illustrated above. 26 coastal drowning deaths were recorded in 2023/24, above the 10-year average (n=18.9). Similarly, the 2023/24 coastal drowning rate (0.38/100,000 pop.) was above the 10-year average (0.29/100,000 pop.).
Figure 89
2014-24: DROWNING DEATHS BY ACTIVITY
Drowning prevalence varies by activity and over time. Since 2014, swimming/wading has recorded the most coastal drowning deaths (37%, n=70), followed by boating (17%, n=33), then snorkelling (11%, n=20).
YEAR OLDS KEY DEMOGRAPHICS
CAUSAL FACTORS
Figure
CASE STUDY: THE PILLARS MULTI-AGENCY RESCUE
On January 5, Life Saving Victoria was alerted to a patient at The Pillars near Mount Martha.
Located towards the southeastern end of Port Phillip Bay, The Pillars is a fragile coastal cliff formation described by the local council as “posing a very high safety risk” and having limited access and facilities.
Despite this, the site is a popular visitors’ spot, and has become known around the world as a scenic spot for cliffjumping. Despite safety advice following numerous recent incidents where jumpers had been seriously injured, a
20-year-old man had reportedly jumped from The Pillars and suffered a suspected spinal injury.
Mount Martha Life Saving Club volunteers and Life Saving Victoria’s Rescue Water Craft service responded. They were assisted by Ambulance Victoria and Victoria Police to extricate the patient from the site.
The response was an example of highly effective collaboration between these agencies to ensure the patient was handed to paramedics, and could receive necessary assessment and treatment.

In the last twelve months, 1.7 million Western Australians (16 years and above) visited the coast on average 3.3 times each month (NCSS24). This equates to approximately 67 million individual visitations to the coast.
1.7M COASTAL VISITORS 3.3
2023/24: VISITATION & CAPABILITY 680 RESCUES 104,461 PREVENTATIV E ACTIONS 58 Searches 1,074 Shark alarms
1.4M
PARTICIPANTS 2.1 HOURS/VISIT
$487,864,541 VALUE TO COMMUNITY
69 Lost children 3,752 FIRS T AID TREATMENTS*
WESTERN AUSTRALIA 2023/24: YEAR IN REVIEW
Across Western Australia, 41 drowning deaths were recorded in 2023/24, 49% of which occurred in coastal environments (n=20). This is a 4.8% decrease from last year (n=21), and 5.3% above the ten-year average (n=19).
COASTAL DROWNING 20
Males continue to be overrepresented, accounting for 90% of drowning deaths, with 40-49 (35%) and 60-69 (20%) year olds identified as high-risk age groups in Western Australia coastal drowning deaths.
Swimming/wading, snorkelling and rock fishing accounted for 40%, 15% and 10% of coastal drowning deaths, respectively. Most coastal drowning deaths occurred at beaches (65%), with a further 15% in offshore waters. Regional and remote areas, which are harder to access and often have limited resources, recorded 55% of coastal drowning deaths, and 75% occurred more than 1km from a Surf Life Saving service.
WESTERN AUSTRALIA
2014-24: COASTAL DROWNING DEATHS
Figure 90
2014-24: COASTAL DROWNING DEATH TRENDS
WA coastal drowning deaths and drowning rates are illustrated above. Coastal drowning deaths and rates in 2023/24 (n=20; 0.69/100,000 pop.) were above the 10-year average.
KEY DEMOGRAPHICS
Figure 91
2014-24: DROWNING DEATHS BY ACTIVITY
Drowning prevalence varies by activity and over time. Since 2014, boating and personal watercraft has recorded the most coastal drowning deaths (PWC; 25%, n=47), followed by swimming and wading (24%, n=46), then snorkelling (13%, n=24).
CAUSAL FACTORS
SURF ALERT MODULES: A NEW BEACH SAFETY ALERT SYSTEM
Beachgoers at select locations along the Western Australian coast can now benefit from new technology, with beach safety delivered via new virtual surf lifesavers.
With support from the Federal Government’s ‘Saving Lives in the Water’ program, Surf Life Saving Western Australia (SLSWA) collaborated with an experienced security and technology business to take an existing product and enhance it to develop a “virtual” lifesaver.
The Surf Alert Module (SAM) leverages advancements in security and surveillance technology commonly seen in the community and widely used by a variety of industries. Its goal is to create a sustainable approach to improving coastal safety, primarily at locations with minimal to no existing lifesaving services.
The modules are designed to provide beach users with real-time warning and safety messages about hazards and risks at specific beach locations, ultimately leading to improved decisionmaking and behaviours.
With an in-built camera, visual display messaging, warning lights and sirens, the units provide a visual and audible alert system for beachgoers. These can be used as an emergency evacuation alert, activated for detection of a shark, and provide messaging advice whether the beach remains closed or is now open.

The units also include an emergency assistance intercom, which directs calls to SLSWA’s state operations centre during operational support hours, or to ‘000” after hours.
Other considerations in the development of the module included;
• Scalable functionality that could easily be integrated into SLSWA’s broader coastal safety strategy
• The ability to integrate into existing SLSWA systems and applications and those of other key stakeholders
• Improved coverage, cost, and capability of cellular connectivity
• Able to operate within existing public coastal safety initiatives, such as Beach Emergency Numbers (BEN) and other shark warning and public security systems.
The first of SLSWA’s SAMs was installed at Clayton’s Beach in January 2023, where the unit underwent extensive testing before additional units were rolled out at select locations along the WA coast.
SAMs are now installed and operational at six other Western Australian beaches, including Leighton Beach, Falcon Bay, Pyramids Beach, Twilight Beach/Gazebos, Picnic Cove and Wylie Bay.
In the last twelve months, 1.2 million South Australians (16 years and above) visited the coast on average 2.8 times each month (NCSS2024). This equates to approximately 40 million individual visitations to the coast.
SOUTH AUSTRALIA $$$$$
2023/24: VISITATION & CAPABILITY 86 RESCUES 11,923 PREVENTATIV E ACTIONS
550
2.1
1.0M
$58,056,279
SOUTH AUSTRALIA 2023/24: YEAR IN REVIEW
Across South Australia, 12 drowning deaths were recorded in 2023/24, 75% of which occurred in coastal waters (n=9). This is a 50% increase from last year (n=6), and 8.4% above the ten-year average (n=8.3).
Males continue to be overrepresented, accounting for 100% of drowning deaths, with 70-79 (56%) and 35-44 year olds (22%) identified as high-risk age groups in South Australia coastal drowning deaths.
Boating accounted for 33% of coastal drowning deaths, while fishing, attempting a rescue, and swimming/wading each accounted for 11% of coastal drowning deaths. Most coastal drowning deaths occurred at beaches (56%), with a further 33% in offshore waters.
Regional and remote areas, which are harder to access and often have limited resources, recorded 22% of coastal drowning deaths, and 78% occurred more than 1km from a Surf Life Saving service.
YEAR OLDS
YEAR OLDS
SOUTH AUSTRALIA
2014-24: COASTAL DROWNING DEATHS
Figure 92
2014-24: COASTAL DROWNING DEATH TRENDS
SA coastal drowning deaths and drowning rates are illustrated above. Coastal drowning deaths and rates recorded in 2023/24 (n=9; 0.48/100,000 pop.) were above the 10-year average.
KEY DEMOGRAPHICS
Figure 93
2014-24: DROWNING DEATHS BY ACTIVITY
Drowning prevalence varies by activity and over time. Since 2014, Swimming and wading has recorded the most coastal drowning deaths (34%, n=28), followed by boating (23%, n=19), then attempting a rescue (7%, n=6).
CAUSAL FACTORS
47% SUMMER
28%
57% BEACH 12%
19%
WELCOME TO SA SHORES PROGRAM
Surf Life Saving SA offers a range of beach and water safety programs designed to ensure community members can be educated using approaches suited to their needs. The Welcome to SA Shores program, now known as Welcome2, is a sixweek targeted water safety program where participants learn about beach hazards and water safety skills during six water safety sessions. Because coastal environments are dynamic and complex, the first five sessions are delivered in a pool setting before heading to the beach for the final session with our surf lifesavers.
UKRAINIAN
BEACH DAY
Surf Life Saving SA proudly executed the Welcome2 program recently, focusing on displaced Ukrainians. The program was expanded to offer additional support to this group, including a one hour theoretical workshop for those who could not engage in the practical sessions.
This program was delivered in partnership with Help Ukrainians Australia, Association of Ukrainians in SA, iSwim @ Immanuel, Glenelg Surf Life Saving Club, Multicultural Councils of SA, and with financial support from the Office for Recreation, Sport and Racing as well as the Office for Human Services. This initiative was a huge success, attracting 120 individuals from the community. Additionally, two scholarships for participants to attend the AUSTSWIM Teacher of Swimming and Water Safety course were offered to community members. These scholarships train young adults with the skills needed for employment within the Welcome2 program as Assistant Instructors. Enhancing the program further, these newly trained Assistant Instructors can assist with delivering the program in language, helping to overcome a significant barrier to communities understanding of water safety.
The resounding success of this endeavour was exemplified by its recognition as the recipient of the national ‘AUSTSWIM Local Community Initiative Award’ at the AUSTSWIM Awards of Excellence 2023. In 2024, Surf Life Saving SA has received funding through the Office for Recreation, Sport and Racing’s partnership grant to expand on this vital program and increase our services within multicultural communities.

2023/24: VISITATION & CAPABILITY
In the last twelve months, 400,000 Tasmanians (16 years and above) visited the coast on average 5-6 times each month (NCSS2024). This equates to approximately 26 million individual visitations to the coast.
400K
0.3M
$27,131,403 VALUE TO COMMUNITY
83 RESCUES 1,291 PREVENTATIV E ACTIONS 16 Searches 0 Shark alarms
4 Lost children 136 FIRS T AID TREATMENTS
TASMANIA 2023/24: YEAR IN REVIEW
Across Tasmania, 11 drowning deaths were recorded in 2023/24, 91% of which occurred in coastal environments (n=10). This is a 233% increase from last year (n=3), and 70% above the ten-year average (n=5.9).
Males continue to be overrepresented in coastal drowning statistics, accounting for 80% of drowning deaths, with 30-39 (30%) and 70-79 (30%) year olds identified as highrisk age groups in Tasmania coastal drowning deaths.
Swimming/wading, scuba diving, boating and personal watercraft (PWC) accounted for 50%, 30% and 10% of coastal drowning deaths, respectively. Most coastal drowning deaths occurred at beaches (60%), with a further 40% in offshore waters.
Regional and remote areas, which are harder to access and often have limited resources, recorded 90% of coastal drowning deaths, and 90% occurred more than 1km from a Surf Life Saving service.
30-39 YEAR OLDS
70-79 YEAR OLDS
INCREASE FROM 10-YEAR AVERAGE
1.74/100,000POP. DROWNING RATE COASTAL DROWNING DEATHS
NB: Arrow indicates change from 10-year average
TASMANIA
2014-24: COASTAL DROWNING DEATHS
Figure 94
2014-24: COASTAL DROWNING DEATH TRENDS
TAS coastal drowning deaths and drowning rates are illustrated above. Coastal drowning deaths and rates recorded in 2023/24 (n=10; 1.74/100,000 pop.) were above the 10-year average.
KEY DEMOGRAPHICS
Figure 95
2014-24: DROWNING DEATHS BY ACTIVITY
Drowning prevalence varies by activity and over time. Since 2014, boating & PWC has recorded the most coastal drowning deaths (37%, n=22), followed by swimming/wading (17%, n=10), then falls (12%, n=7).
CAUSAL FACTORS
CENTRE OF EXCELLENCE IN FLOOD AND SWIFT WATER RESCUE (COE FSWR)
The Centre of Excellence in Flood and Swift Water Rescue (CoE FSWR), established by Surf Life Saving Australia (SLSA) in collaboration with Surf Life Saving Tasmania (SLST), is a pioneering initiative aimed at enhancing the flood and swift water rescue capabilities of surf lifesavers across Australia. Located in Hobart, Tasmania, the Centre leverages SLST’s extensive experience and international best practices to provide top-tier training and resources.
BACKGROUND
Climate change has led to an increase in extreme weather events, including floods, which have highlighted gaps in rescue services. The devastating floods in Tasmania in 2016 underscored the need for specialised training. SLST has since invested in international best practice training, resources, and research, earning recognition as a leader in flood and swift water rescue.
TRAINING AND STANDARDS
The CoE FSWR offers comprehensive training programs, including Flood Rescue Responder and Flood Rescue Responder Plus, designed to equip volunteers with the necessary skills for effective flood and swift water rescues. The Centre adheres to rigorous standards, including Flood Rescue Standards and Operational Deployment Policy, and operational standards aligned with international concepts of operations (CONOPS). Research on thermal demands and PPE ensures rescuers are wellprepared for various conditions.
COLLABORATION AND IMPACT
The Centre fosters collaboration with other emergency services and agencies, enhancing national interoperability and standardising training and equipment standards. This initiative not only supports local communities but also strengthens national rescue capabilities. The Centre’s strategic location in Hobart, with access to natural water systems, provides an ideal environment for realistic and effective training.

RECOGNITION AND FUTURE GOALS
SLST’s commitment to excellence has led to recognition by emergency services, governments, and international bodies. The CoE FSWR stands as a testament to the dedication and versatility of Surf Life Saving volunteers, showcasing their ability to adapt and respond to the increasing frequency of natural disasters. This innovative approach ensures that Australia remains at the forefront of flood and swift water rescue, ready to save lives and support communities in times of need.
In the last twelve months, 150,000 Northern Territorians (16 years and above) visited the coast on average 4 times each month (NCSS2024). This equates to approximately 7 million individual visitations to the coast.
2023/24: VISITATION & CAPABILITY 37 RESCUES 6,393 PREVENTATIV E ACTIONS
150K
5 Searches
3
0.1M
9 Lost children 368 FIRS T AID TREATMENTS PROFICIENT MEMBERS
$28,551,480 VALUE TO COMMUNITY
0 Shark alarms
2 Fractures/ Dislocations
337 Cuts & abrasions
COASTAL DROWNING
NORTHERN TERRITORY 2020-24: 5 YEARS IN REVIEW
Across the Northern Territory, 25 drowning deaths were recorded from 2020-24, 28% of which occurred in coastal environments (n=7). This is 30% lower than the preceding 5 years (n=10), and 18% below the ten-year average (n=1.7).
Males continue to be overrepresented, accounting for 86% of drowning deaths, with 25-34 (29%) and 55-64 (29%) year olds identified as high-risk age groups in Northern Territory coastal drowning deaths.
Swimming/wading, falls and boating and personal watercraft (PWC) accounted for 57%, 29% and 14% of coastal drowning deaths, respectively. Most coastal drowning deaths occurred at beaches (57%), with a further 29% at port/marina locations.
Regional and remote areas, which are harder to access and often have limited resources, recorded 100% of coastal drowning deaths, and 86% occurred more than 1km from a Surf Life Saving service.
DECREASE FROM 10-YEAR AVERAGE
0.39/100,000POP. DROWNING RATE COASTAL DROWNING DEATHS
NB: Arrow indicates change from 10-year average
YEAR OLDS
NORTHERN TERRITORY
2014-24: COASTAL DROWNING DEATHS
Figure 96
2014-24: COASTAL DROWNING DEATH TRENDS
NT coastal drowning deaths and drowning rates are illustrated above. Coastal drowning deaths and drowning rates recorded between 2019-24 (n=7; 0.56/100,000 pop.) were below the 10-year average.
CAUSAL FACTORS
Figure 97
2014-24: DROWNING DEATHS BY ACTIVITY
Drowning prevalence varies by activity and over time. Since 2014, boating and swimming and wading have recorded the equal most coastal drowning deaths (29%, n=5), followed by falls (18%, n=3).
WET SEASON LIFESAVING SERVICE STRATEGY
BACKGROUND
The NT has the highest drowning rate per capita in Australia. SLSNT provide beach patrols during the dry season (between May and November), the most popular period for swimming. However, the wet season, officially running from November to April, is also a high-risk period for drowning. During these months, there are heightened aquatic risks including strong winds, rough seas, and tidal currents. Crocodiles (Crocodylus sp.) and Box Jellyfish (Chironex fleckeri) are also more prevalent during the wet season when the air and water temperatures are warmer.
In early 2014, during wet season monsoonal conditions, there were two coastal drowning deaths between Rapid Creek and Dripstone Cliffs, and a spate of serious aquatic incidents around Darwin’s beaches during the same period. In response, Surf Life Saving NT initiated the Wet Season Lifesaving Service (WSLS) with a four-week trial in early 2014. The trial identified that aquatic recreation in the wet season was popular among the Darwin community with unpowered watercraft users (i.e. surfing, kite surfing, stand up paddling, recreational kayaks/skis and body boards) being the most frequent participants.
SLSNT identified that there was a need to reinforce safe practices and provide preventative measures that support public safety during the wet season and, as such, have developed the Wet Season Lifesaving Strategy.
AIM
Reduce the risk of aquatic related incidents on Darwin beaches with a specific focus on the popular Nightcliff, Rapid Creek and Casuarina beaches during the wet season through:
1. Surveillance and monitoring of conditions and water users (surfers, swimmers etc).
2. Provision of education on wet season hazards.
3. Encouraging and promoting surfsmart behaviours.
4. Provision of rescue and emergency response.
5. Regular liaison with other emergency services.
Data on beach usage and conditions will be collected to facilitate a comprehensive review at the end of each season to ensure scope meets community needs.
BENEFITS
The Wet Season Lifesaving Strategy will:
• Provide an improved safety net for the aquatic recreational community.
• Meet expectations of key stakeholders, especially NT Government and City of Darwin who are the principal land managers.
• Contribute to the safety and education of the public engaged in aquatic sport and recreation.
• Generate positive media coverage.
• Support those that enjoy wet season aquatic sport and recreation.
• Provide an opportunity for SLSNT members to gain experience in a wider range of conditions and locations.

GLOSSARY
Adult For the purpose of this report, adult refers to a person 16 years of age and over.
Advanced Resuscitation Techniques A certification providing the skills and knowledge required to use specialised equipment in the provision of resuscitation in line with the Australian Resuscitation Council (ARC) guidelines.
ALS Australian Lifeguard Service.
Apply First Aid A certification providing the skills and knowledge required to provide a first aid response to a casualty.
Aquatic fatality Refers to non-drowning related incidents which have occurred in the water at a coastal location.
Attempting a rescue Trying to retrieve a person in distress and deliver them to a place of safety.
AWSC Australian Water Safety Council also Australian Water Safety Conference.
AWSS Australian Water Safety Strategy.
Bay A body of water partially enclosed by land but with a wide mouth, affording access to the sea.
Beach A wave-deposited accumulation of sediment – usually sand, but ranging in size up to boulders, deposited between the upper swash limit and wave base.
Blackspot An area with a concentration of coastal/ocean incidents and a high probability/risk of ongoing recurrence.
Boating Using either a powered vessel or sailing boat for pleasure and/ or fishing.
Bystander A person who is present at an incident but not part of it initially.
Cause of death The condition, injury, or circumstances of the injury, that initiated the train of morbid events leading to death as determined by forensic investigation.
Coastal Describes the foreshore, seabed, coastal water, and air space above a large body of water (harbour/bay/inlet), including areas up to 3nm offshore and of which the landward boundary is the line of mean high water, except where that line crosses a river/inlet, the landward boundary at that point shall be the point upstream that is calculated by multiplying the width of the river/inlet mouth by five. (Adopted from the Resource Management Amendment Act 1993 New Zealand).
COD Cause of death.
Co-morbidity A term that refers to the occurrence of more than one disorder, disease, injury, or medical condition at the same time.
Dangerous surf warning An alert issued by the Bureau of Meteorology indicating that surf conditions in an area are unsafe for coastal activities. The warnings are calculated based on wave height, swell direction, and swell period and must exceed the predetermined limitations to be in effect.
Decedent A deceased person.
Drowning The process of experiencing respiratory impairment from submersion/immersion in liquid; outcomes are classified as death, morbidity, and no morbidity.
Drowning death A fatal drowning incident arising from the process of respiratory impairment as a result of submersion/immersion in liquid.
Drowning rate A comparative rate of drowning deaths to the size of the population for a given area or activity.
Drugs A medicine or other substance which has a physiological effect when ingested or otherwise introduced to the body. The category includes therapeutic, over-the-counter and illicit drugs.
Emergency response An action taken by an SLS entity in response to a call for assistance from an emergency management organisation.
Estuary A dynamic coastal water body where freshwater runoff from land transitions to saltwater from the ocean environments.
Falls (trips/slips) Events that result in a person coming to rest inadvertently in the water, on the ground or other lower level.
Fatality A fatal incident arising from circumstances other than drowning (eg. Medical condition, injury, self-harm, marine creature).
Fatality rate A comparative rate of fatality to the size of the population for a given area or activity.
First Aid Assessments and interventions that can be performed by a bystander (or by the patient) with minimal to no equipment.
Fishing The act of attempting to catch fish from anywhere except coastal rock platforms
Hazard A source of potential harm.
ILS International Life Saving Federation.
Incident Any unplanned event requiring lifesaving services intervention.
Inland An area that is beyond the line of mean high water or within a landward distance of five times the width of the coastal inlet/river mouth.
Intentional fatality Any intentional incident, including homicide and self-harm related incidents.
International Describes an individual who is confirmed to reside overseas and/or is a temporary visitor to Australia.
IRB Inflatable rescue boat.
IRD Incident report database. A web-based portal used by SLS services to electronically record incident reports.
Jetty An artificial structure that projects out into the water from land.
JRB Jet rescue boat.
Jump(ing) The activity of launching off a cliff, rock platform, pier, jetty. Aka tombstoning (UK/Europe/North America).
Lifeguard An individual who undertakes patrols at a beach or another aquatic environment. He/she is typically a salaried member, qualified in
public safety and aquatic rescue.
Lifejacket A buoyant or inflatable garment or device designed to keep a person afloat in water and increase their likelihood of survival.
Lifesaving Service A coordinated group that exists to provide aquatic safety services to the public. This includes Surf Life Saving Clubs, Lifeguards, SurfCom, RWCs, RIBs, JRBs, ORBs, Rescue Helicopters and 4WD units.
Local Government Area (LGA) Also known as local councils, LGAs include cities, towns, shires, municipalities, or boroughs.
Marina A man-made boat basin having sea walls or breakwaters and offering dockage and other services for water vessels.
Marine fauna Macro-organisms (mostly animals) that live within marine systems (eg., fish species including sharks and rays, estuarine crocodiles, blue-ringed octopus, jellyfish species, sea snakes, etc.).
Medical For the purpose of this report, medical refers to an aquatic incident that was caused by a medical episode, e.g., a heart attack or epileptic seizure.
NCIS National Coronial Information System.
NCSS The National Coastal Safety Survey conducted annually to gather information about Australian coastal participation, swimming ability, risk perception, behaviours, and attitudes to coastal safety.
Non-aquatic fatality Non aquatic fatalities refer to non-drowning related incidents which have occurred at a coastal location but not in the water.
Non-aquatic transport Any form of transport that is not meant for the water such as airplanes, bicycles, and motor vehicles.
Ocean The seabed, water, and air space above the water between 3nm and 12nm (the Australian Territorial Sea) offshore.
Offshore Describes the coastal water area beyond the surf zone and inshore area from 500m to 200nm.
ORB Offshore rescue boat.
Patrol Service undertaken to monitor activities in/around an aquatic environment and respond accordingly through either preventative actions or rescue operations.
Patrol flags Red and yellow horizontally divided flags which are set after performing a risk assessment to determine the most suitable area for swimming. The flags identify a zone for swimming and bodyboarding within a patrolled location.
Patrolled location A location supervised by a lifesaving service.
Preventative action Direct action taken to reduce or eliminate the probability of a specific rescue, first aid or other reportable incident from happening in the future.
PWC Personal watercraft, also known as jet ski.
Rescue The retrieval of a person in distress, delivering them to a place of safety and the application of first aid and basic life support as may be required.
Resuscitation Prevention or restoration of life by establishing and maintaining a person’s airway, breathing and circulation.
RIB Rigid-hull inflatable boat.
Rip current A seaward flowing current of water moving through a surf zone.
River A natural stream of water flowing into an ocean, lake, or other body of water.
Rock/Cliff A rock platform or shelf that may project out from the coast or may have a high steep face.
Rock fishing The act of attempting to catch fish from a coastal rock platform.
RWC Rescue watercraft.
Scuba diving Swimming underwater with the aid of scuba equipment for recreational or commercial purposes.
Service season and hours Vary between states due to climatic factors, but in the context of this report, the season is for the period July 2023 to June 2024.
Snorkelling Swimming with a snorkel and face mask. Includes freediving and spearfishing.
SurfCom SLS radio communications centre that assists in managing the communications of lifesaving operations and data collection.
Surf lifesaver An individual who undertakes patrols at a beach or other aquatic environment. They are typically a nonsalaried member qualified in public safety and aquatic rescue.
Support Operations Rapid response rescue units not affiliated to any one Surf Life Saving Club.
Surf Life Saving Club A SLS affiliated not-for-profit organisation that has volunteer members who provide coastal safety services to the community.
Swimming Moving through water by moving the body or parts of the body.
Total Service Plan An assessment of current and future lifesaving resources, trends, national blackspots, and coastal safety issues combined with evidence-based mitigation strategies to address these issues.
Toxicology The measurement and analysis of potential toxins, intoxicating or banned substances, and prescription medications present in a person’s body.
Unintentional fatality Deaths other than drowning deaths (such as medical incidents, injury, accidents, or marine creature), excluding homicide and self-harm related incidents.
Wading Walking through water while partially immersed.
Watercraft A piece of non-powered recreational equipment used in water. Examples include surfboards, stand-up paddle boards, bodyboards, windsurfers or kayaks.
REFERENCES
METHODOLOGY
The National Coastal Safety Report 2024 contains information on Australian community behaviours and attitudes to the coast; SLS capability and membership capacity; rescues and emergency response; and coastal drowning deaths and other fatalities that occurred along the Australian coast during the period of 1 July 2023 to 30 June 2024. This information is correct as of 12 July 2024. All care is taken to ensure the statistical information included within this report is correct. However, pending the outcome of ongoing coronial investigations and as SLS update their operational information, this data may be amended. Data in figures may not always add up to 100% due to rounding. Total mortality rates were calculated using the number of deaths divided by the population (per head of 100,000) from Australian Bureau of Statistics.
THE AUSTRALIAN COMMUNITY ANALYSIS
Information about community swimming ability, behaviours, and attitudes to coastal safety, risk perceptions, safety strategies and rescues was gathered from the SLSA National Coastal Safety Survey. Conducted by Omnipoll Market Research, the latest survey was run online over the period 6 - 30 April 2024 among a national sample of 3,084 respondents aged 16 and above. The study was carried out in compliance with AS-ISO 20252 - Market, Social and Opinion Research. To reflect the population distribution, results were post-weighted (on age, sex, geographic strata, and education) and projected to Australian Bureau of Statistics data (Census 2021). The Australian population aged 16 and above (the reference population for this survey) is 20,434,000.
CAPABILITY & RESCUE ANALYSIS
SurfGuard, the Incident Report Database (IRD), and SurfCom management system (SurfCom) are web-based applications and part of a suite of applications that enable members, clubs, branches, state offices and SLSA to enter and access SLS operational (including rescues and first aids), capability (including assets and services), educational and administrative data. Information was extracted from
SurfGuard to identify how many rescues were performed by volunteers, lifeguards and lifesaving services during 2023/24; and how many active surf lifesavers and award holders there were during 2023/24. The data was verified by SLS state/territory entities. Information about assets and services were gathered from each state/territory entity.
DROWNING & FATALITY DATA ANALYSIS
SLSA collects incident data from SurfGuard, the IRD, SurfCom, the National Coronial Information System (NCIS) and by monitoring media reports for coastal and ocean incidents. The information is verified with the assistance of SLS state/territory entities and compiled for analysis by SLSA’s Coastal Safety Department. The following variables are used to match fatal incidents from more than one data source: incident date; location; age; sex; and incident description. The NCIS is considered the ‘gold standard’ when there is a discrepancy in the detail collected from different data sources. Deaths are excluded as a coastal drowning if they are reported as ‘intentional deaths’, they occur at inland locations, or ‘drowning/ immersion’ is not a contributory factor as noted by the coroner. Coastal incidents that are deemed intentional or not due to drowning/immersion are logged as coastal fatalities instead. This report presents information on drowning deaths and other non-drowning fatalities that have occurred along the Australian coast. We explore incidents that have occurred between 1 July 2004 – 30 June 2024. The authors are responsible for the use made of the data in this report.
DROWNING & FATALITY DATA LIMITATIONS
Over years of investigation as part of the NCIS process, some cases are amended prior to their closure, resulting in changes to the classification of cases in our datasets. Therefore, the number of coastal drowning deaths published in this report may be different from annual totals previously reported. In an effort to produce a timely report on our current year’s data we acknowledge that these figures will change. Each year, the changes that occur in the previous year’s report will be made transparent. The data in this current report are not the final figures as 92%
of 2023/24 coastal drowning deaths and 69% of 2023/24 coastal fatalities recorded remain open cases and 32% of 2023/24 cases do not yet have a cause of death (COD) listed. Once NCIS closes a case, SLSA modifies those with unknown intent and those where the cause of death is not drowning, from ‘coastal drowning’ to ‘coastal fatality’. The incidents are included in our annual totals and analysis, and they will remain so until a COD is listed other than drowning/immersion.
CHANGES FROM PREVIOUS REPORTS
As part of the NCIS investigation process, some cases are amended prior to their closure and have resulted in changes to our datasets. This year SLSA has commenced a thorough review of its coastal and ocean fatality database to update all cases to the same inclusion standards. See the below table for annual case numbers.
photocopying, recording or otherwise) without prior permission from Surf Life Saving Australia.
For enquiries concerning reproduction, contact SLSA on: phone 02 9215 8000; email: info@slsa.asn.au
Every attempt has been made to trace and acknowledge copyright, but in some cases this may not have been possible. Surf Life Saving Australia apologises for any accidental infringements and would welcome any information to redress the situation.
ACKNOWLEDGMENTS
SLSA wishes to thank the following people and organisations for their contribution to the National Coastal Safety Report 2024: the Australian Government: Department of Health; National Coronial Information System: Jessica Bryan; Department of Justice and Community Safety; Omnipoll: Frederic Anne; Royal Life Saving Society Australia: William Koon, Stacey Pidgeon and Lauren Miller; SLS State Centers, branches, clubs, support operations and ALS; SLSA major national corporate partners: Ampol, DHL, Isuzu and Westpac.
This report was compiled by Jasmin Lawes, Researcher; Sean Kelly, Research Assistant; Rebecca Stolper, Research Assistant; Rhiannon Brinckman, Project Officer Coastal Safety; Michael Bonnici, Manager Coastal Safety; Shane Daw, General Manager Southern Region. Design: Melissa Conchar. Maps: John Frith, Flat Earth Mapping.
CONTACT INFORMATION
SUGGESTED CITATION: Surf Life Saving Australia (2024) National Coastal Safety Report 2024. SLSA: Sydney.
REFERENCES
• Australian Bureau of Statistics (December 2023), National, state and territory population, ABS Website, accessed 21 August 2024.
Available from: https://www.abs.gov.au/statistics/people/ population/national-state-and-territory-population/latestrelease#cite-window1
• Australian Bureau of Statistics (2021), Population: Census, ABS Website, accessed 21 August 2024. Available from: https://www.abs.gov.au/statistics/people/population/ population-census/latest-release#cite-window1
• SLSA National Coastal Safety Survey 2024 © 2024 SURF LIFE SAVING AUSTRALIA
This publication is copyright. Except as expressly provided in the Copyright Act 1968 and the Copyright Amendment Act 2006, no part of this publication may be reproduced, stored in any retrieval systems or transmitted by any means (including electronic, mechanical, microcopying,


SLSA receives Government funding to commence valuable initiatives and programs. However, we rely on the generosity of the community and corporate support to ensure they continue.
For more information:
Surf Life Saving Australia sls.com.au
Surf Life Saving New South Wales surflifesaving.com.au
Surf Life Saving Northern Territory lifesavingnt.com.au
Surf Life Saving Queensland lifesaving.com.au
Surf Life Saving South Australia surflifesavingsa.com.au
Surf Life Saving Tasmania slst.asn.au
Life Saving Victoria lsv.com.au
Surf Life Saving Western Australia mybeach.com.au
2,482,013 PREVENTATIVE ACTIONS
1,462,533 VOLUNTEER PATROL HOURS
8,857
49,331 FIRST AID TREATMENTS