1 minute read
STATISTICS
from Site Analisys
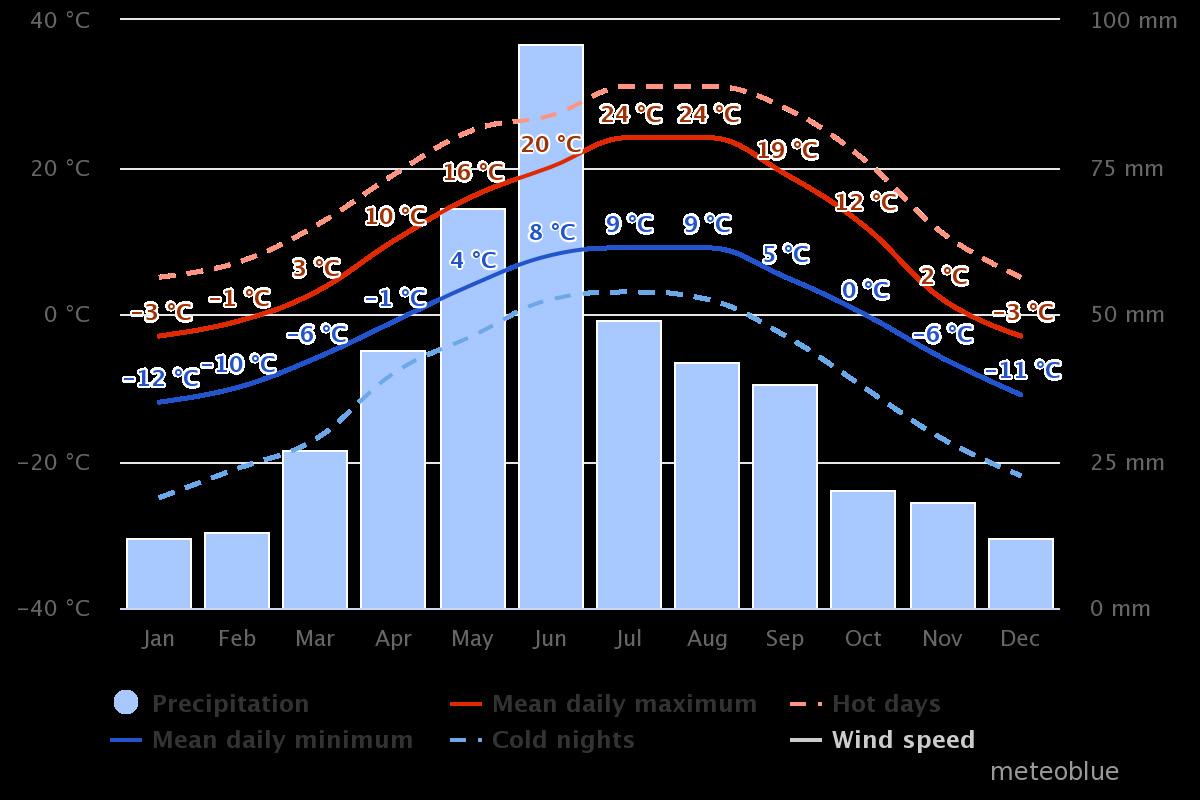
The “mean daily maximum” (solid red line) shows the maximum temperature of an average day for every month for Airdrie. Likewise, “mean daily minimum” (solid blue line) shows the average minimum temperature. Hot days and cold nights (dashed red and blue lines) show the average of the hottest day and coldest night of each month of the last 30 years
PRECIPITATION AMOUNTS
Advertisement

The precipitation diagram for Airdrie shows on how many days per month, certain precipitation amounts are reached.


