
LUXURY REPORT Q 1 2023
insight
Las Vegas Sotheby’s International Realty is thrilled to present you with the latest trends and developments affecting luxury communities in Las Vegas, Henderson and beyond. Our report is a consolidation of local real estate knowledge and an in-depth analysis of market data, providing you with the most useful insights as they emerge in the region.
In addition to offering general statistics about the overall market, we are proud to note the large-scale growth in the city, with new developments and expansions bringing forth many opportunities for our clients to capitalize on future investments.
As an international luxury brand, with representation in 81 countries, over 26,000 associates across 1,075 offices, and a team of skilled agents and brokers, Sotheby's International Realty has the capacity to offer you unparalleled talent and marketing expertise. At Las Vegas Sotheby's International Realty, our goal is to provide you with the best possible service and ensure you have all the information you need to make informed decisions about your real estate needs as well as provide the best possible experience for our clients.
Moreover, we are excited to announce that Las Vegas has been tapped by Sotheby's International Realty to be the host city for the Global Networking Event happening in April. We are thrilled to welcome thousands of our fellow Sales Associates to our city. In addition, there are exciting things on the horizon for our city from the F1 Las Vegas Grand Prix to the upcoming opening of the MSG Sphere to the Super Bowl in 2024. These events will undoubtedly further strengthen the city's position as a hub for luxury living and investment opportunities.
Whether you are interested in learning more about current market conditions or are considering representation in the sale of your home, Las Vegas Sotheby’s International Realty is here to serve you. We invite you to take a look at this report and contact us should you need a more targeted analysis.
PRESIDENT & BROKER
Randy Char
MANAGING BROKERS
Thomas Marsaw
Robyn Yates-Gajjar
ART DIRECTION
Renee Ladores
Angela Welch
Las Vegas Sotheby’s International Realty publishes Insight, a luxury market report magazine each quarter. All materials are copyrighted and can not be reprinted or duplicated without permission, including photographs, artwork, designs and text. The publication is distributed without charge to readership throughout Southern Nevada. Additional copies and advertising information can be
by
Las Vegas Sotheby’s International Realty. 8548 Rozita Lee Ave, 100, Las Vegas, NV 89113 | 702.360.1414 | insight@lasvegassir.com | lasvegassir.com ABOUT INSIGHT LUXURY REPORT
requested
contacting
®,™ and SM are licensed trademarks to Sotheby’s International Realty Affiliates, Inc. An Equal Opportunity Company. Equal Housing Opportunity. Each Office Is Independently Owned And Operated, Except Offices Owned And Operated By NRT Incorporated. If your property is listed with a real estate broker, please disregard. It is not our intention to solicit the offerings of other real estate brokers. We are happy to work with them and cooperate fully. * All information from sources deemed to be reliable although not warranted or guaranteed by or Sotheby’s International Realty® All information from sources deemed to be reliable although not warranted or guaranteed by or Sotheby’s International Realty® Data pulled from MLS as of April 7, 2023. Randy Char
PRESIDENT & BROKER

4 SUMMERLIN 10 LAS VEGAS 14 HENDERSON 20 BOULDER CITY 22 VERTICAL VEGAS
SUMMERLIN OVERVIEW: OVER $1 MILLION LAST 13 MONTHS
4 | LASVEGASSIR.COM
MAR 2022 APR 2022 MAY 2022 35 25 18 JUN 2022 JUL 2022 AUG 2022 21 29 26 SEP 2022 OCT 2022 NOV 2022 44 59 48 DEC 2022 JAN 2023 FEB 2023 52 68 78 MAR 2023 49 $2.5M AVERAGE SALES PRICE $2M $1.5M $1M $500K MAR 2022 APR 2022 MAY 2022 $2.01M $2.07M $1.67M JUN 2022 JUL 2022 AUG 2022 $2.73M $1.78M $1.70M SEP 2022 OCT 2022 NOV 2022 $1.71M $1.82M $2.46M DEC 2022 JAN 2023 FEB 2023 $2.29M $2.23M $1.67M MAR 2023 $1.77M 43 20 20 24 22 31 25 27 52 25 54 60 60 PROPERTIES SOLD 30 0 MAR 2022 APR 2022 MAY 2022 61 JUN 2022 JUL 2022 AUG 2022 SEP 2022 OCT 2022 NOV 2022 DEC 2022 JAN 2023 FEB 2023 MAR 2023
AVERAGE DAYS ON MARKET
OVERVIEW: UNDER $1 MILLION LAST 13 MONTHS
Q1 2023 | 5
AVERAGE DAYS ON MARKET MAR 2022 APR 2022 MAY 2022 24 18 14 JUN 2022 JUL 2022 AUG 2022 18 18 29 SEP 2022 OCT 2022 NOV 2022 36 38 58 DEC 2022 JAN 2023 FEB 2023 55 57 57 MAR 2023 47 $650K AVERAGE SALES PRICE $600K $550K $500K $450K MAR 2022 APR 2022 MAY 2022 $620K $621K $628K JUN 2022 JUL 2022 AUG 2022 $640K $613K $605K SEP 2022 OCT 2022 NOV 2022 $589K $606K $572K DEC 2022 JAN 2023 FEB 2023 $595K $595K $541K MAR 2023 $591K 144 108 93 93 90 124 95 107 164 115 174 209 200 PROPERTIES SOLD 100 0 MAR 2022 APR 2022 MAY 2022 183 JUN 2022 JUL 2022 AUG 2022 SEP 2022 OCT 2022 NOV 2022 DEC 2022 JAN 2023 FEB 2023 MAR 2023
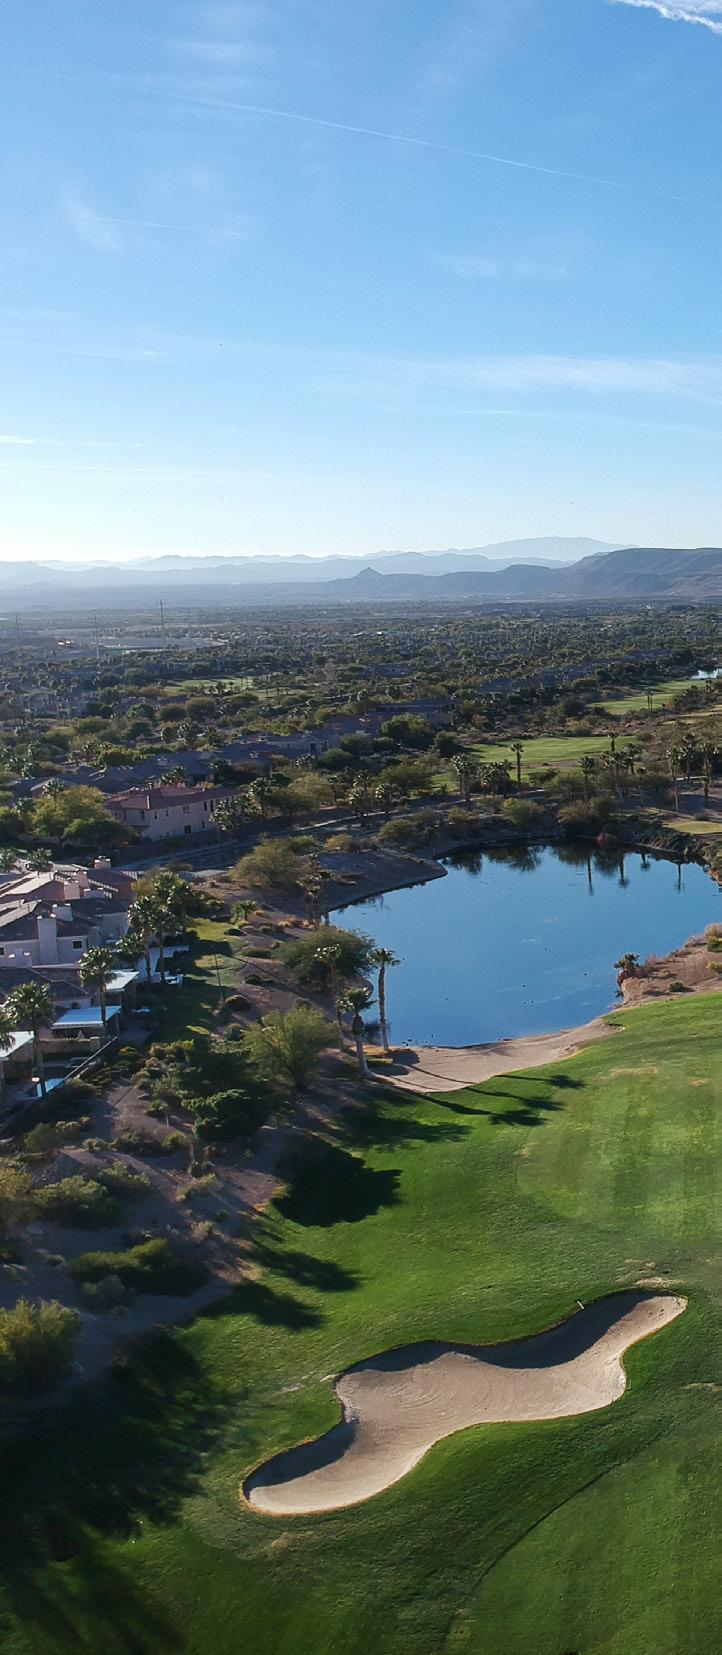
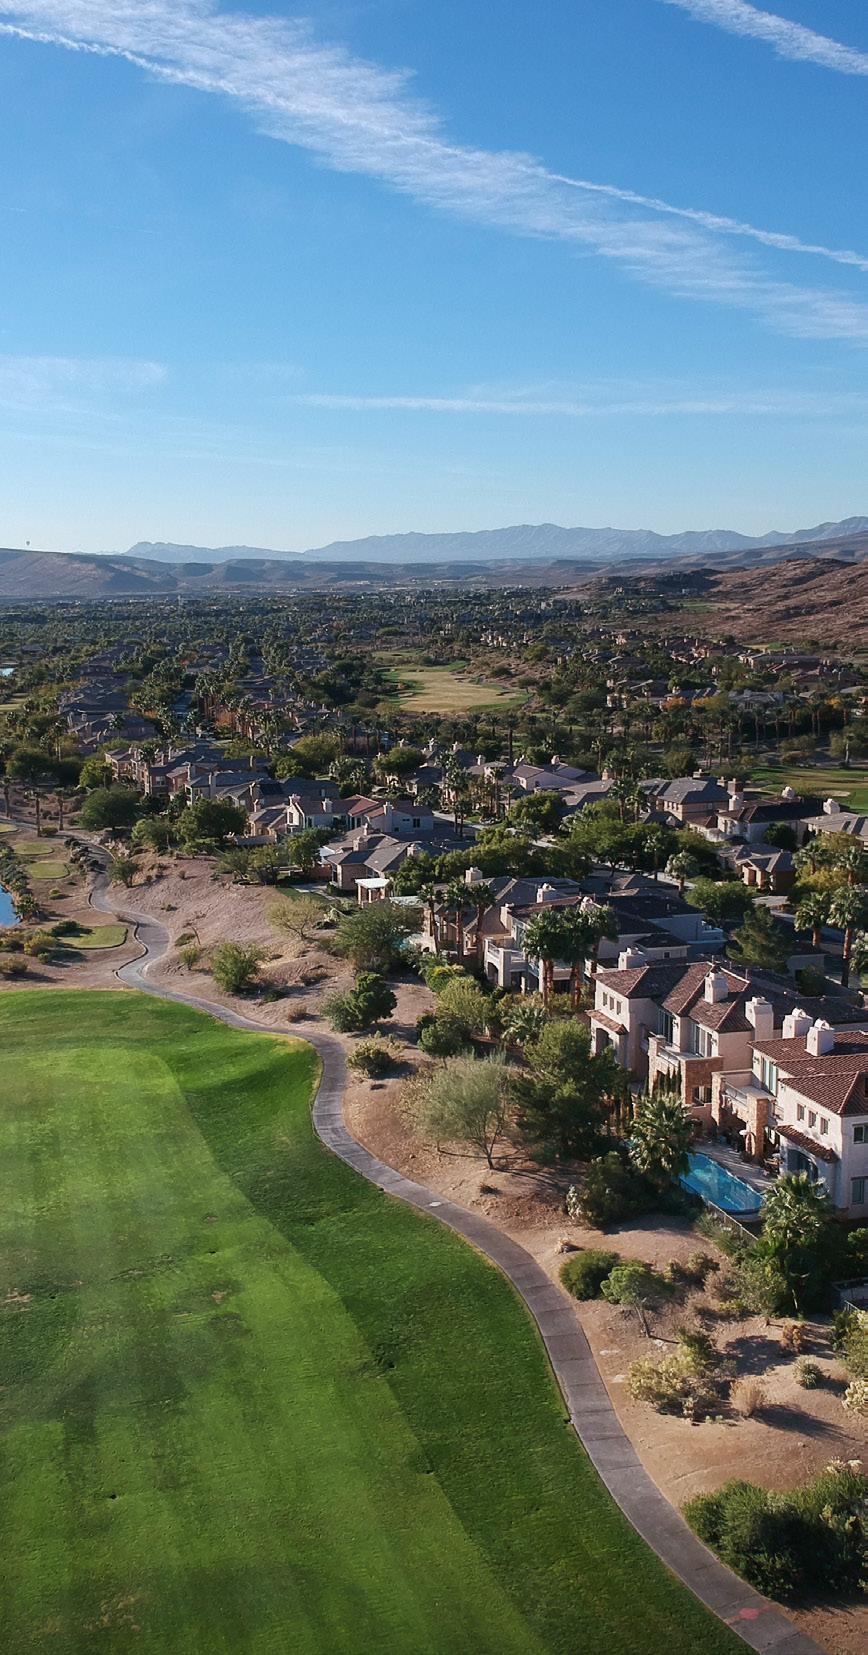
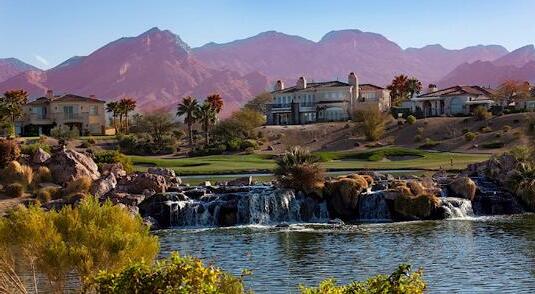
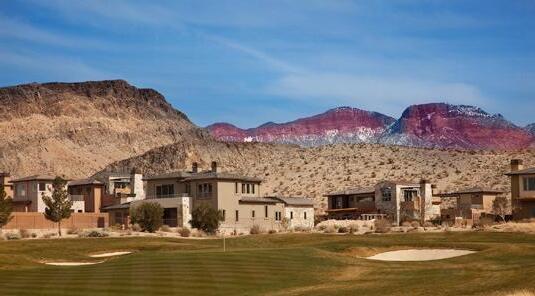
SUMMERLIN
6 | LASVEGASSIR.COM SUMMERLIN COMMUNITIES
# of Transactions Average Sales Price Average Price per SF Average Days on Market 6 2 -66.67% $2,718,333 $2,265,000 -16.68% $485 $456 -6.09% 48 41 -14.58% 2022 2023 CHANGE # of Transactions Average Sales Price Average Price per SF Average Days on Market 1 3 +200.00% $3,135,000 $2,750,000 -12.28% $725 $482 -33.49% 20 68 +240.00% 2022 2023 CHANGE
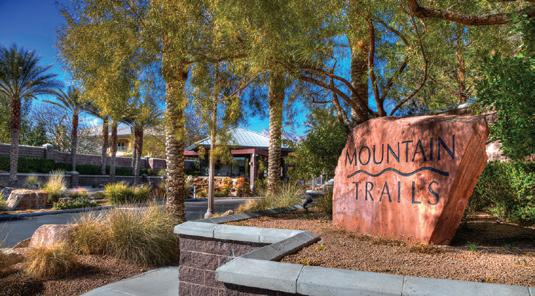
MOUNTAIN TRAILS # of Transactions Average Sales Price Average Price per SF Average Days on Market 1 2 +100.00% $2,900,000 $2,162,500 -25.43% $398 $337 -15.45% 7 75 +971.43% 2022 2023 CHANGE # of Transactions Average Sales Price Average Price per SF Average Days on Market 0 2 +100.00% $0 $1,650,000 +100.00% $0 $452 +100.00% 0 103 +100.00% 2022 2023 CHANGE # of Transactions Average Sales Price Average Price per SF Average Days on Market 1 3 +200.00% $2,875,000 $1,706,667 -40.64% $608 $515 -14.84% 73 151 +106.85% 2022 2023 CHANGE
# of Transactions Average Sales Price Average Price per SF Average Days on Market 1 4 +300.00% $1,375,000 $1,637,500 +19.09% $280 $332 +18.67% 61 94 +54.10% 2022 2023 CHANGE
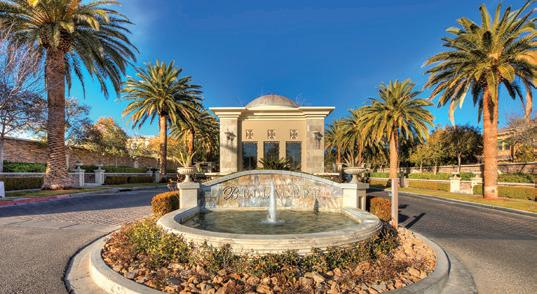
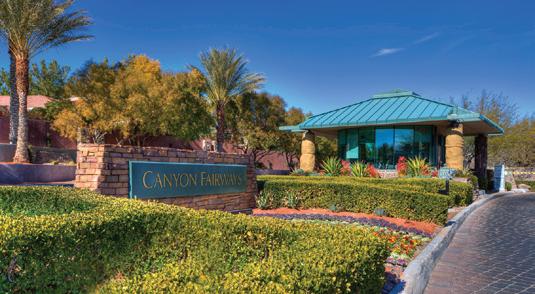
BELLACERE CANYON FAIRWAYS
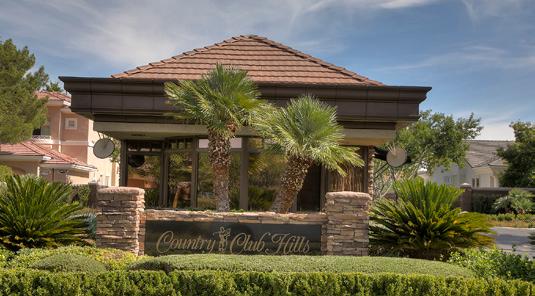
COUNTRY CLUB HILLS MESA RIDGE
PALISADES
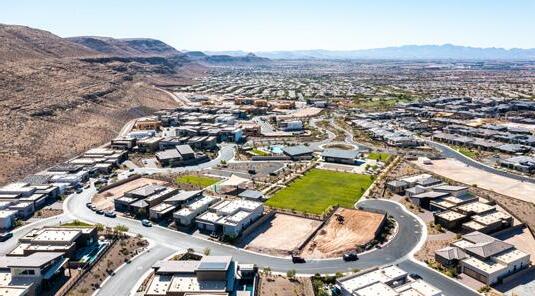
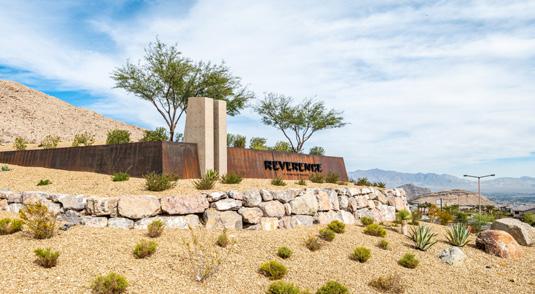
RED ROCK COUNTRY CLUB REVERENCE
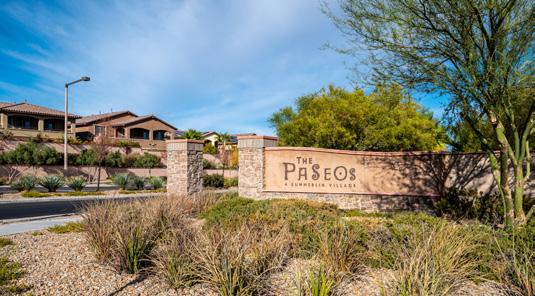
Q1 2023 | 7 PASEOS # of Transactions Average Sales Price Average Price per SF Average Days on Market 19 10 -47.37% $1,360,408 $1,176,000 -13.56% $375 $361 -3.91% 19 29 +52.63% 2022 2023 CHANGE
REGENCY
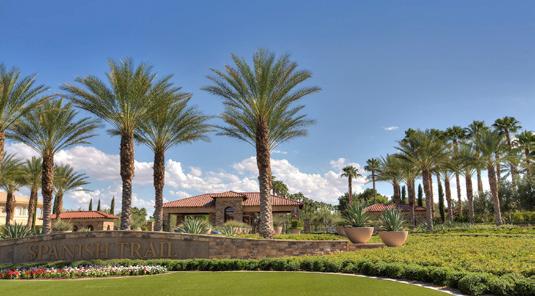
SUMMERLIN SIENA # of Transactions Average Sales Price Average Price per SF Average Days on Market 0 1 +100.00% $0 $1,498,000 +100.00% $0 $298 +100.00% 0 70 +100.00% 2022 2023 CHANGE # of Transactions Average Sales Price Average Price per SF Average Days on Market 1 2 +100.00% $1,225,000 $1,279,000 +4.41% $431 $424 -1.64% 0 4 +100.00% 2022 2023 CHANGE # of Transactions Average Sales Price Average Price per SF Average Days on Market 19 9 -52.63% $2,031,210 $1,678,889 -17.35% $509 $434 -14.74% 26 84 +223.08% 2022 2023 CHANGE # of Transactions Average Sales Price Average Price per SF Average Days on Market 9 4 -55.56% $2,045,000 $1,583,750 -22.56% $577 $399 -30.81% 19 50 +163.16% 2022 2023 CHANGE SPANISH TRAILS # of Transactions Average Sales Price Average Price per SF Average Days on Market 3 5 +66.67% $1,092,000 $1,841,800 +68.66% $279 $379 +36.05% 11 78 +609.09% 2022 2023 CHANGE
AT
8 | LASVEGASSIR.COM
"Sotheby's International Realty is a very clear brand.
I think even as a consumer when you see the sign and you're driving by, you're like 'oh, that must be a nice house'."
SUMMERLIN COMMUNITIES THE CLIFFS THE RIDGES # of Transactions Average Sales Price Average Price per SF Average Days on Market 13 12 -7.69% $4,364,385 $3,454,249 -20.85% $728 $662 -9.07% 80 71 -11.25% 2022 2023 CHANGE # of Transactions Average Sales Price Average Price per SF Average Days on Market 0 1 +100.00% $0 $1,210,000 +100.00% $0 $458 +100.00% 0 99 +100.00% 2022 2023 CHANGE WILLOW
# of Transactions Average Sales Price Average Price per SF Average Days on Market 5 4 -20.00% $1,150,000 $1,309,750 +13.89% $301 $346 +14.85% 16 42 +162.50% 2022 2023 CHANGE
— Gwyneth Paltrow
CREEK
$167 Billion USD IN GLOBAL SALES VOLUME IN 2022
48M VISITS TO SOTHEBYSREALTY.COM

#1
MOST PROFILED LUXURY REAL ESTATE BRAND IN THE NEWS WITH OVER 60,000 PRESS PLACEMENTS
Source: Meltwater January 1, 2022 - December 31, 2022
26,000 SALES ASSOCIATES
1,075 OFFICES IN 81 COUNTRIES & TERRITORIES
OVER 1M SOCIAL MEDIA FOLLOWERS
75M VIDEOS PLAYED IN 2022
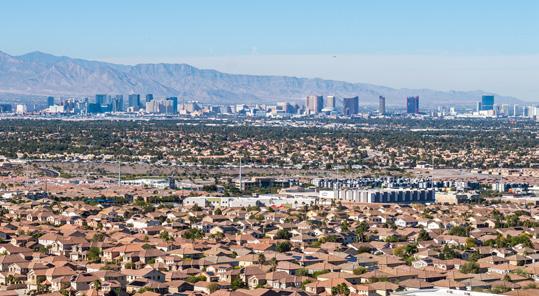
LAS VEGAS OVERVIEW: OVER $1 MILLION LAST 13 MONTHS
10 | LASVEGASSIR.COM AVERAGE
ON MARKET MAR 2022 APR 2022 MAY 2022 37 32 32 JUN 2022 JUL 2022 AUG 2022 25 35 44 SEP 2022 OCT 2022 NOV 2022 41 53 44 DEC 2022 JAN 2023 FEB 2023 50 60 85 MAR 2023 54 $2M
$1.75M $1.5M $1.25M $1M MAR 2022 APR 2022 MAY 2022 $1.77M $1.80M $1.61M JUN 2022 JUL 2022 AUG 2022 $2.13M $1.53M $1.66M SEP 2022 OCT 2022 NOV 2022 $1.78M $1.85M $1.98M DEC 2022 JAN 2023 FEB 2023 $2.01M $2.01M $1.59M MAR 2023 $1.62M 100 PROPERTIES SOLD 50 0 MAR 2022 APR 2022 MAY 2022 JUN 2022 JUL 2022 AUG 2022 SEP 2022 OCT 2022 NOV 2022 DEC 2022 JAN 2023 FEB 2023 MAR 2023 92 53 46 50 40 56 69 80 108 58 121 113 133
DAYS
AVERAGE SALES PRICE
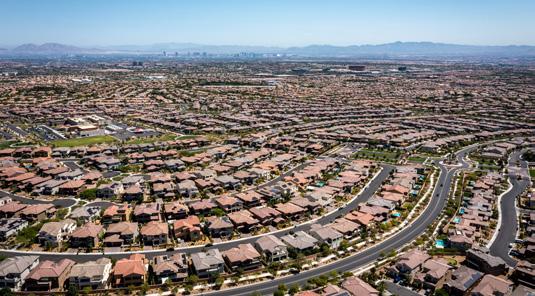
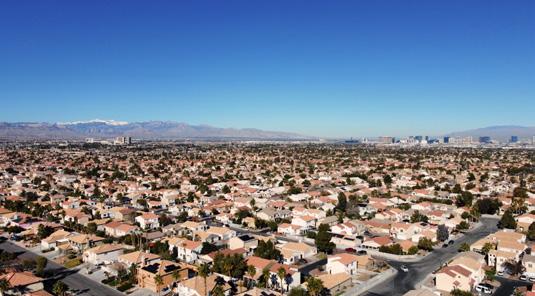
LAS VEGAS
OVERVIEW: UNDER $1 MILLION LAST 13 MONTHS
Q1 2023 | 11 AVERAGE DAYS ON MARKET MAR 2022 APR 2022 MAY 2022 19 17 14 JUN 2022 JUL 2022 AUG 2022 16 17 23 SEP 2022 OCT 2022 NOV 2022 34 36 43 DEC 2022 JAN 2023 FEB 2023 51 54 57 MAR 2023 55 $500K AVERAGE SALES PRICE $475K $450K $425K $400K MAR 2022 APR 2022 MAY 2022 $492K $500K $510K JUN 2022 JUL 2022 AUG 2022 $506K $492K $479K SEP 2022 OCT 2022 NOV 2022 $479K $470K $455K DEC 2022 JAN 2023 FEB 2023 $458K $455K $449K MAR 2023 $460K 1,451 1,087 923 805 928 1,247 1,037 1,218 1,642 1,236 1,763 1,991 2,000 PROPERTIES SOLD 1,000 0 MAR 2022 APR 2022 MAY 2022 1,859 JUN 2022 JUL 2022 AUG 2022 SEP 2022 OCT 2022 NOV 2022 DEC 2022 JAN 2023 FEB 2023 MAR 2023
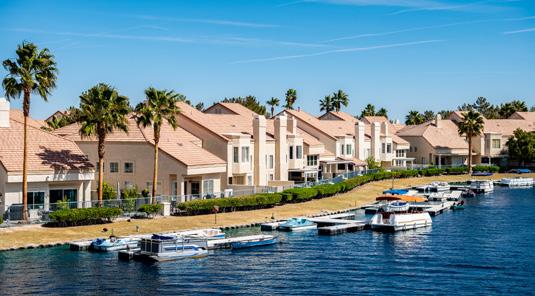
DESERT SHORES
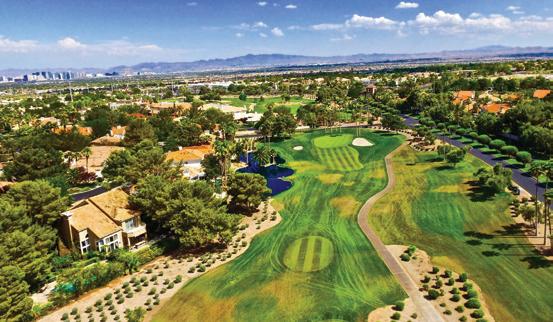
SCOTCH 80S QUEENSRIDGE
12 | LASVEGASSIR.COM LAS VEGAS COMMUNITIES
# of Transactions Average Sales Price Average Price per SF Average Days on Market 5 1 -80.00% $1,292,000 $1,105,000 -14.47% $322 $362 +12.48% 19 25 +31.58% 2022 2023 CHANGE # of Transactions Average Sales Price Average Price per SF Average Days on Market 4 2 -50.00% $1,285,000 $1,219,000 -5.14% $350 $275 -21.57% 52 41 -21.15% 2022 2023 CHANGE
SECTION 10 # of Transactions Average Sales Price Average Price per SF Average Days on Market 3 4 +33.33% $2,375,000 $1,285,000 -45.89% $407 $335 -17.68% 103 51 -50.49% 2022 2023 CHANGE # of Transactions Average Sales Price Average Price per SF Average Days on Market 2 1 -50.00% $1,205,000 $1,000,000 -17.01% $263 $213 -19.04% 30 606 +1920.00% 2022 2023 CHANGE # of Transactions Average Sales Price Average Price per SF Average Days on Market 1 3 +200.00% $2,105,000 $1,171,667 -44.34% $147 $360 +145.19% 75 97 +29.33% 2022 2023 CHANGE SOUTHERN HIGHLANDS COUNTRY CLUB # of Transactions Average Sales Price Average Price per SF Average Days on Market 24 19 -20.83% $2,208,208 $1,794,579 -18.73% $409 $371 -9.17% 51 47 -7.84% 2022 2023 CHANGE
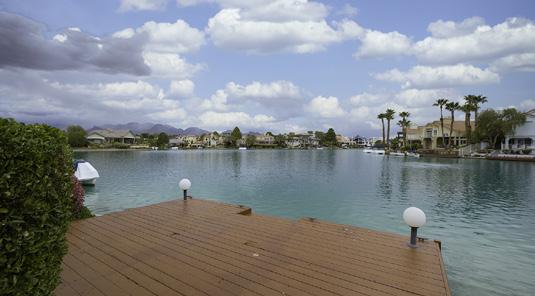
THE LAKES
SPANISH HILLS
# of Transactions Average Sales Price Average Price per SF Average Days on Market 1 2 +100.00% $1,002,000 $2,249,000 +124.45% $211 $378 +79.39% 7 86 +1128.57% 2022 2023 CHANGE # of Transactions Average Sales Price Average Price per SF Average Days on Market 2 5 +150.00% $1,442,500 $1,994,000 +38.23% $287 $318 +11.03% 83 46 -44.58% 2022 2023 CHANGE
HENDERSON OVERVIEW: OVER $1 MILLION LAST 13 MONTHS
14 | LASVEGASSIR.COM AVERAGE DAYS ON MARKET MAR 2022 APR 2022 MAY 2022 46 27 20 JUN 2022 JUL 2022 AUG 2022 38 32 45 SEP 2022 OCT 2022 NOV 2022 58 48 59 DEC 2022 JAN 2023 FEB 2023 24 79 28 MAR 2023 80 $2.5M AVERAGE SALES PRICE $2M $1.5M $1M $500K MAR 2022 APR 2022 MAY 2022 $2.10M $2.02M $2.23M JUN 2022 JUL 2022 AUG 2022 $2.23M $1.99M $1.70M SEP 2022 OCT 2022 NOV 2022 $1.60M $1.92M $2.52M DEC 2022 JAN 2023 FEB 2023 $2.25M $1.98M $1.68M MAR 2023 $2.32M 22 29 12 16 22 30 27 26 38 28 41 46 50 PROPERTIES SOLD 25 0 MAR 2022 APR 2022 MAY 2022 55 JUN 2022 JUL 2022 AUG 2022 SEP 2022 OCT 2022 NOV 2022 DEC 2022 JAN 2023 FEB 2023 MAR 2023
OVERVIEW: UNDER $1 MILLION LAST 13 MONTHS
Q1 2023 | 15 AVERAGE DAYS ON MARKET MAR 2022 APR 2022 MAY 2022 22 16 15 JUN 2022 JUL 2022 AUG 2022 16 18 23 SEP 2022 OCT 2022 NOV 2022 33 37 41 DEC 2022 JAN 2023 FEB 2023 53 61 59 MAR 2023 55 $550K AVERAGE SALES PRICE $500K $450K $400K $350K MAR 2022 APR 2022 MAY 2022 $542K $566K $554K JUN 2022 JUL 2022 AUG 2022 $547K $536K $511K SEP 2022 OCT 2022 NOV 2022 $535K $529K $530K DEC 2022 JAN 2023 FEB 2023 $496K $502K $505K MAR 2023 $501K 379 277 264 238 261 346 305 334 399 357 475 551 600 PROPERTIES SOLD 400 200 MAR 2022 APR 2022 MAY 2022 462 JUN 2022 JUL 2022 AUG 2022 SEP 2022 OCT 2022 NOV 2022 DEC 2022 JAN 2023 FEB 2023 MAR 2023
HENDERSON
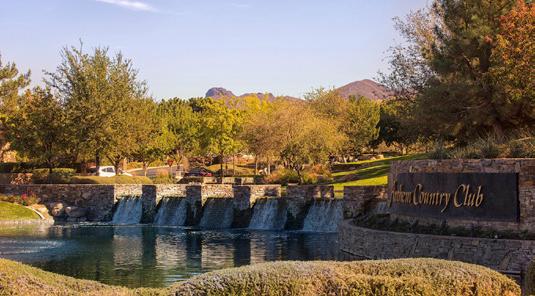
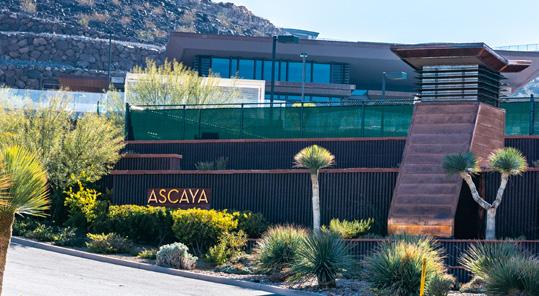
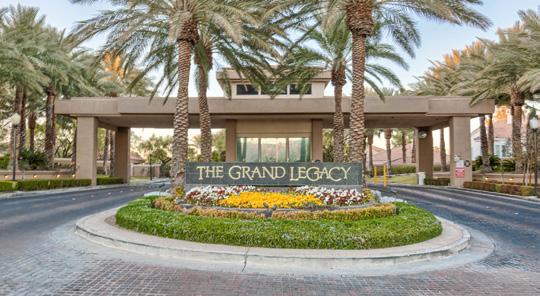
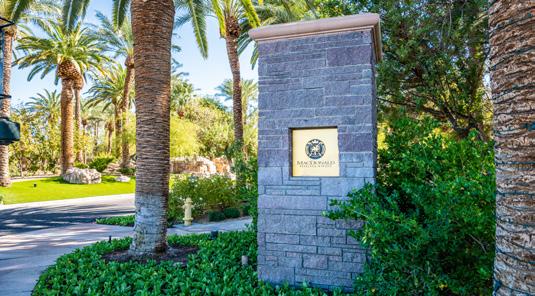
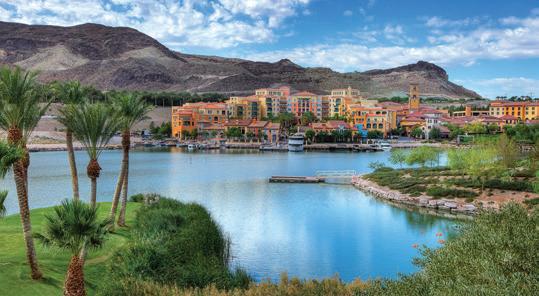
16 | LASVEGASSIR.COM HENDERSON COMMUNITIES ANTHEM COUNTRY CLUB ASCAYA # of Transactions Average Sales Price Average Price per SF Average Days on Market 2 2 +-0% $6,012,500 $8,700,000 +44.70% $954 $1,031 +8.02% 287 74 -74.22% 2022 2023 CHANGE # of Transactions Average Sales Price Average Price per SF Average Days on Market 18 7 -61.11% $2,362,833 $1,456,786 -38.35% $466 $333 -28.54% 55 96 +74.55% 2022 2023 CHANGE GRAND LEGACY MACDONALD HIGHLANDS LAKE LAS VEGAS QUAIL RIDGE ESTATES # of Transactions Average Sales Price Average Price per SF Average Days on Market 17 11 -35.29% $1,530,701 $1,717,864 +12.23% $420 $373 -11.18% 37 72 +94.59% 2022 2023 CHANGE # of Transactions Average Sales Price Average Price per SF Average Days on Market 1 2 +100.00% $2,295,000 $1,112,500 -51.53% $474 $238 -49.74% 63 69 +9.52% 2022 2023 CHANGE # of Transactions Average Sales Price Average Price per SF Average Days on Market 2 1 -50.00% $2,162,500 $1,350,000 -37.57% $314 $346 +10.21% 119 89 -25.21% 2022 2023 CHANGE # of Transactions Average Sales Price Average Price per SF Average Days on Market 13 7 -41.67% $4,595,273 $3,342,369 -27.27% $675 $710 +5.17% 81 117 +44.44% 2022 2023 CHANGE
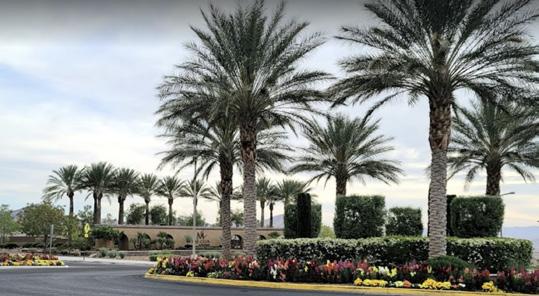
THE CLUB AT MADERIA CANYON
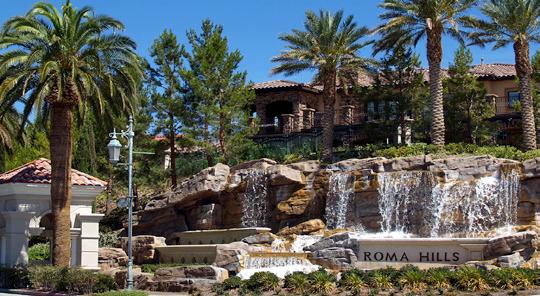

Q1 2023 | 17 ROMA HILLS # of Transactions Average Sales Price Average Price per SF Average Days on Market 2 2 +-0% $1,935,000 $1,752,500 -9.43% $337 $313 -7.28% 49 90 +83.67% 2022 2023 CHANGE
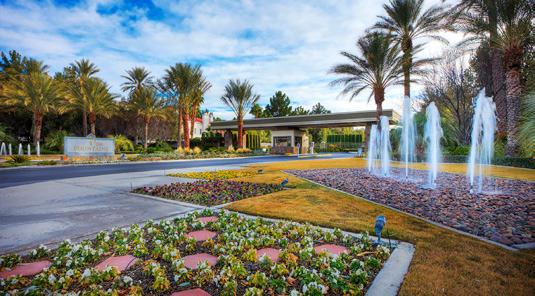
FOUNTAINS # of Transactions Average Sales Price Average Price per SF Average Days on Market 6 3 -50.00% $1,523,333 $1,441,650 -5.36% $305 $293 -3.75% 54 58 +7.41% 2022 2023 CHANGE # of Transactions Average Sales Price Average Price per SF Average Days on Market 6 1 -83.33% $1,132,500 $1,050,000 -7.28% $316 $259 -17.99% 31 131 +322.58% 2022 2023 CHANGE
THE
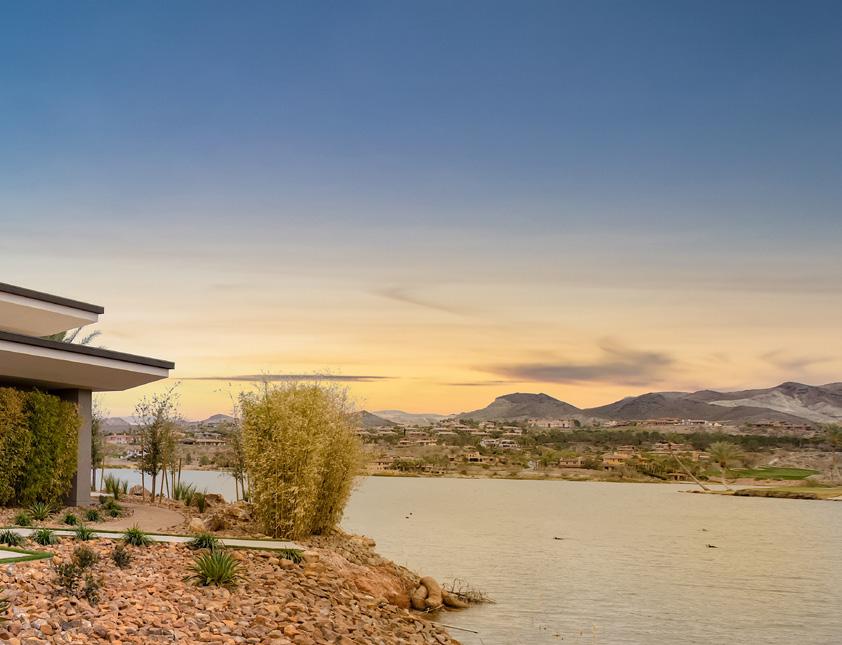


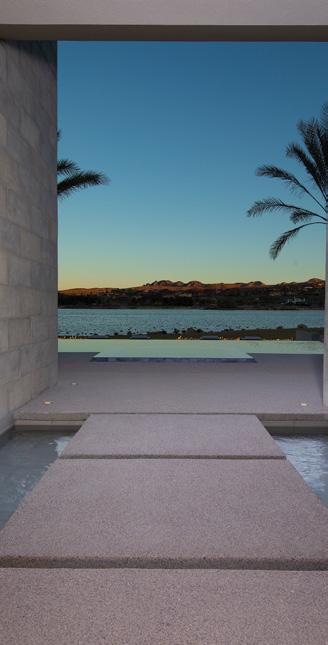
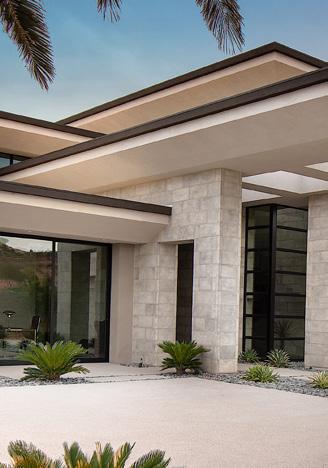
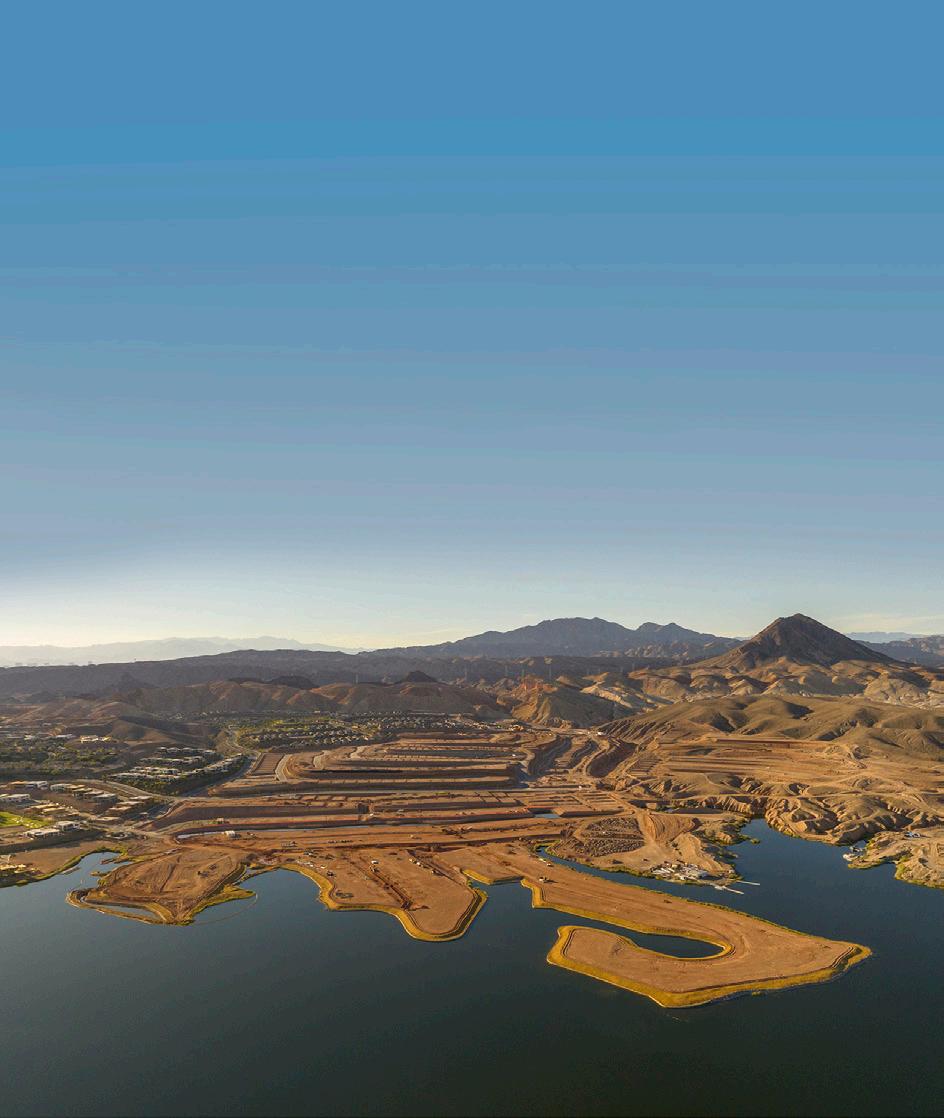
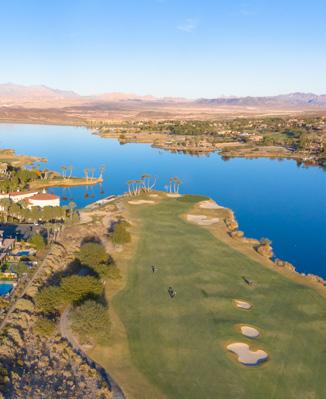
®,™ and SM are licensed trademarks to Sotheby’s International Realty Affiliates, Inc. An Equal Opportunity Company. Equal Housing Opportunity. Each Office Is Independently Owned And Operated, Except Offices Owned And Operated By NRT Incorporated. If your property is listed with a real estate broker, please disregard. It is not our intention to solicit the offerings of other real estate brokers. We are happy to work with them and cooperate fully. * All information from sources deemed to be reliable although not warranted or guaranteed by Sotheby’s International Realty® S.0074661 2030 Lake Las Vegas Pkwy | Open Daily 10am to 5pm | 702.497.0300 | lasvegassir.com Unparalleled Lake Access. Ultra Modern Architecture. Lake Las Vegas Lifestyle. This is The Island, the ultimate in lakeside living at Lake Las Vegas. All custom lots feature lakefront access and breathtaking views. Get away from it all and start your life on The Island at Lake Las Vegas. TO LEARN MORE ABOUT THIS ONCE IN A LIFETIME OPPORTUNITY, VISIT THE LAKE LAS VEGAS REAL ESTATE INFORMATION OFFICE LUXURY LAKESIDE LIVING REDEFINED AT LAKE LAS VEGAS
THE ISLAND
LUXURY LAKESIDE LIVING REDEFINED AT LAKE LAS VEGAS
CUSTOM WATERFRONT LOTS NOW AVAILABLE
UNPARALLELED LAKE ACCESS. ULTRA MODERN ARCHITECTURE. LAKE LAS VEGAS LIFESTYLE.
DISCOVER
BOULDER CITY OVERVIEW: OVER $1 MILLION LAST 13 MONTHS
20 | LASVEGASSIR.COM AVERAGE DAYS ON MARKET MAR 2022 APR 2022 MAY 2022 94 40 14 JUN 2022 JUL 2022 AUG 2022 0 6 0 SEP 2022 OCT 2022 NOV 2022 0 0 0 DEC 2022 JAN 2023 FEB 2023 83 0 0 MAR 2023 0 $1.5M AVERAGE SALES PRICE $1M $0M MAR 2022 APR 2022 MAY 2022 $1.85M $1.36M $1.25M JUN 2022 JUL 2022 AUG 2022 $0.00M $1.65M $0.00M SEP 2022 OCT 2022 NOV 2022 $0.00M $0.00M $0.00M DEC 2022 JAN 2023 FEB 2023 $1.25M $0.00M $0.00M MAR 2023 +1.28% 0 0 1 0 0 0 0 0 0 1 2 4 4 PROPERTIES SOLD 2 0 MAR 2022 APR 2022 MAY 2022 5 JUN 2022 JUL 2022 AUG 2022 SEP 2022 OCT 2022 NOV 2022 DEC 2022 JAN 2023 FEB 2023 MAR 2023
BOULDER CITY
OVERVIEW: UNDER $1 MILLION LAST 13 MONTHS
Q1 2023 | 21 AVERAGE DAYS ON MARKET MAR 2022 APR 2022 MAY 2022 18 36 12 JUN 2022 JUL 2022 AUG 2022 21 21 35 SEP 2022 OCT 2022 NOV 2022 50 33 63 DEC 2022 JAN 2023 FEB 2023 58 70 53 MAR 2023 81 $600K AVERAGE SALES PRICE $550K $500K $400K $350K MAR 2022 APR 2022 MAY 2022 $481K $520K $617K JUN 2022 JUL 2022 AUG 2022 $570K $572K $517K SEP 2022 OCT 2022 NOV 2022 $527K $589K $516K DEC 2022 JAN 2023 FEB 2023 $568K $600K $504K MAR 2023 $414K 18 12 16 11 17 17 8 13 17 13 21 29 30 PROPERTIES SOLD 15 0 MAR 2022 APR 2022 MAY 2022 23 JUN 2022 JUL 2022 AUG 2022 SEP 2022 OCT 2022 NOV 2022 DEC 2022 JAN 2023 FEB 2023 MAR 2023
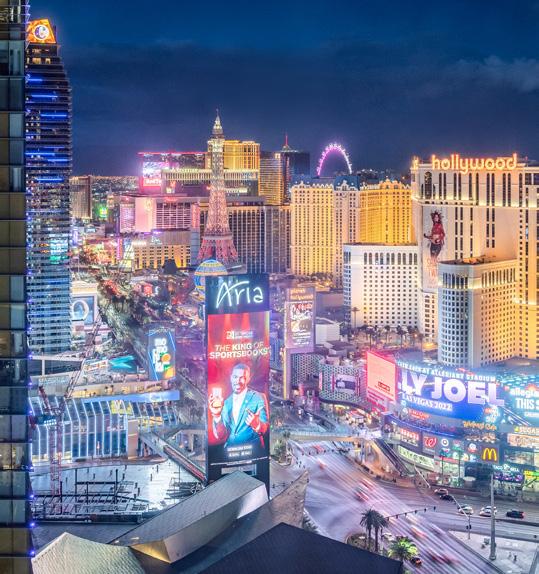
VERTICAL VEGAS OVERVIEW: OVER $1 MILLION LAST 13 MONTHS
22 | LASVEGASSIR.COM AVERAGE DAYS ON MARKET MAR 2022 APR 2022 MAY 2022 47 107 57 JUN 2022 JUL 2022 AUG 2022 47 54 39 SEP 2022 OCT 2022 NOV 2022 55 65 57 DEC 2022 JAN 2023 FEB 2023 128 45 54 MAR 2023 97 $4M AVERAGE SALES PRICE $3M $2M $1.5M $1M MAR 2022 APR 2022 MAY 2022 $1.78M $1.95M $2.32M JUN 2022 JUL 2022 AUG 2022 $2.91M $2.08M $2.82M SEP 2022 OCT 2022 NOV 2022 $1.73M $1.91M $2.13M DEC 2022 JAN 2023 FEB 2023 $2.08M $2.36M $3.75M MAR 2023 $2.12M 12 3 4 5 7 6 7 5 6 6 10 19 20
SOLD 10 0 MAR 2022 APR 2022 MAY 2022 14 JUN 2022 JUL 2022 AUG 2022 SEP 2022 OCT 2022 NOV 2022 DEC 2022 JAN 2023 FEB 2023 MAR 2023
PROPERTIES
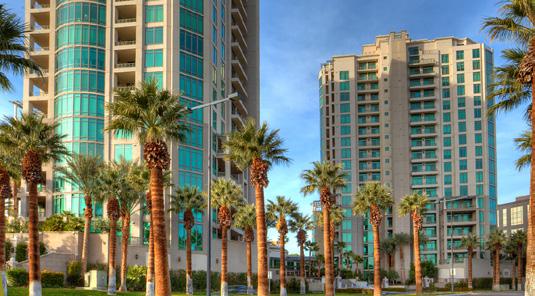
VERTICAL VEGAS
OVERVIEW: UNDER $1 MILLION LAST 13 MONTHS
Q1 2023 | 23 AVERAGE DAYS ON MARKET MAR 2022 APR 2022 MAY 2022 45 49 34 JUN 2022 JUL 2022 AUG 2022 38 45 42 SEP 2022 OCT 2022 NOV 2022 68 68 69 DEC 2022 JAN 2023 FEB 2023 67 86 87 MAR 2023 95 $450K AVERAGE SALES PRICE $400K $350K $300K $250K MAR 2022 APR 2022 MAY 2022 $445K $421K $406K JUN 2022 JUL 2022 AUG 2022 $452K $414K $429K SEP 2022 OCT 2022 NOV 2022 $440K $358K $401K DEC 2022 JAN 2023 FEB 2023 $440K $400K $406K MAR 2023 $408K 51 56 47 45 47 36 50 74 80 68 87 109 125 PROPERTIES SOLD 75 25 MAR 2022 APR 2022 MAY 2022 123 JUN 2022 JUL 2022 AUG 2022 SEP 2022 OCT 2022 NOV 2022 DEC 2022 JAN 2023 FEB 2023 MAR 2023
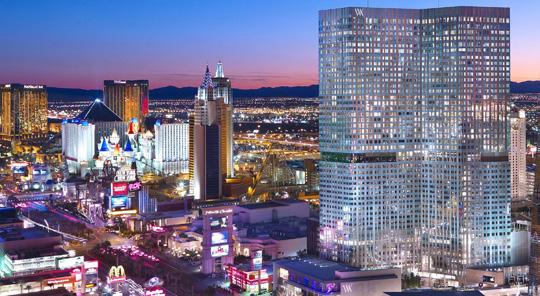
VERTICAL LAS VEGAS

24 | LASVEGASSIR.COM
1 12 ONE QUEENSRIDGE PLACE REGENCY TOWERS 2 13 ONE LAS VEGAS METROPOLIS 3 14 NEWPORT LOFTS TRUMP RESIDENCES 4 15 THE OGDEN PARK TOWERS 5 16 JUHL THE MARTIN 10 21 TURNBERRY TOWERS SIGNATURE MGM 11 TURNBERRY PLACE 7 18 PALMS PLACE VEER TOWERS 8 19 ALLURE PANORAMA TOWERS 9 20 SKY LAS VEGAS WALDORF-ASTORIA 6 17 SOHO LOFTS VDARA 1 SUMMERLIN MGM GRAND A T-MOBILE ARENA B THE COSMOPOLITAN OF LAS VEGAS C BELLAGIO D CAESARS PALACE E FLAMINGO F THE LINQ HOTEL & CASINO G MIRAGE H THE VENETIAN I WYNN J K SAHARA LAS VEGAS ATTRACTIONS 2 LAS VEGAS
Q1 2023 | 25 7 9 11 13 12 15 16 19 17 18 20 HARRY REID INTERNATIONAL AIRPORT ALLEGIANT STADIUM DOWNTOWN LAS VEGAS N A B C D E F G I J H K THE LAS VEGAS STRIP 8 DOWNTOWN LAS VEGAS 5 3 6 4 21 14 10
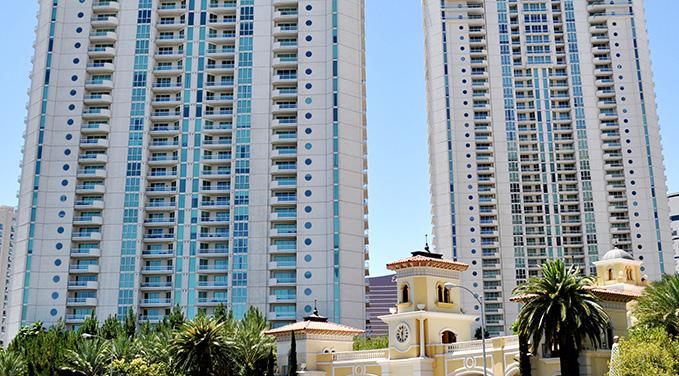
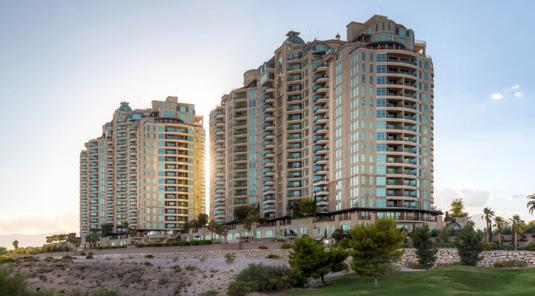
ONE QUEENSRIDGE PLACE
26 | LASVEGASSIR.COM
VEGAS
VERTICAL LAS
# of Transactions Average Sales Price Average Price per SF Average Days on Market 6 3 -50.00% $1,855,833 $2,850,000 +53.57% $578 $656 +13.53% 46 43 -6.52% 2022 2023 CHANGE
TOWERS # of Transactions Average Sales Price Average Price per SF Average Days on Market 1 1 +-0% $1,940,000 $3,300,000 +70.10% $554 $448 -19.09% 168 11 -93.45% 2022 2023 CHANGE # of Transactions Average Sales Price Average Price per SF Average Days on Market 0 1 +100.00% $0 $2,040,000 +100.00% $0 $580 +100.00% 0 12 +100.00% 2022 2023 CHANGE
# of Transactions Average Sales Price Average Price per SF Average Days on Market 6 7 +16.67% $1,799,667 $2,504,000 +39.14% $483 $586 +21.46% 52 104 +100.00% 2022 2023 CHANGE WALDORF
# of Transactions Average Sales Price Average Price per SF Average Days on Market 10 8 -20.00% $2,155,000 $2,130,000 -1.16% $1,126 $1,147 +1.90% 34 84 +147.06% 2022 2023 CHANGE
PARK TOWERS
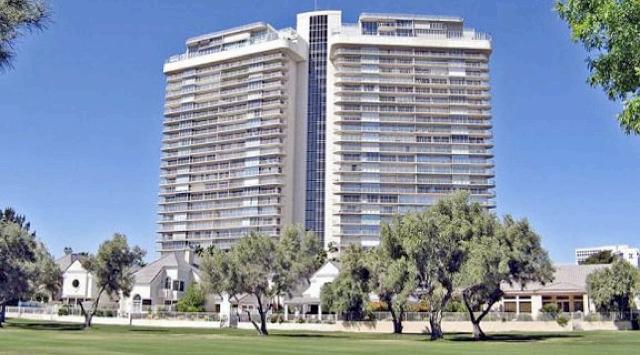
REGENCY
TURNBERRY PLACE
ASTORIA LAS VEGAS
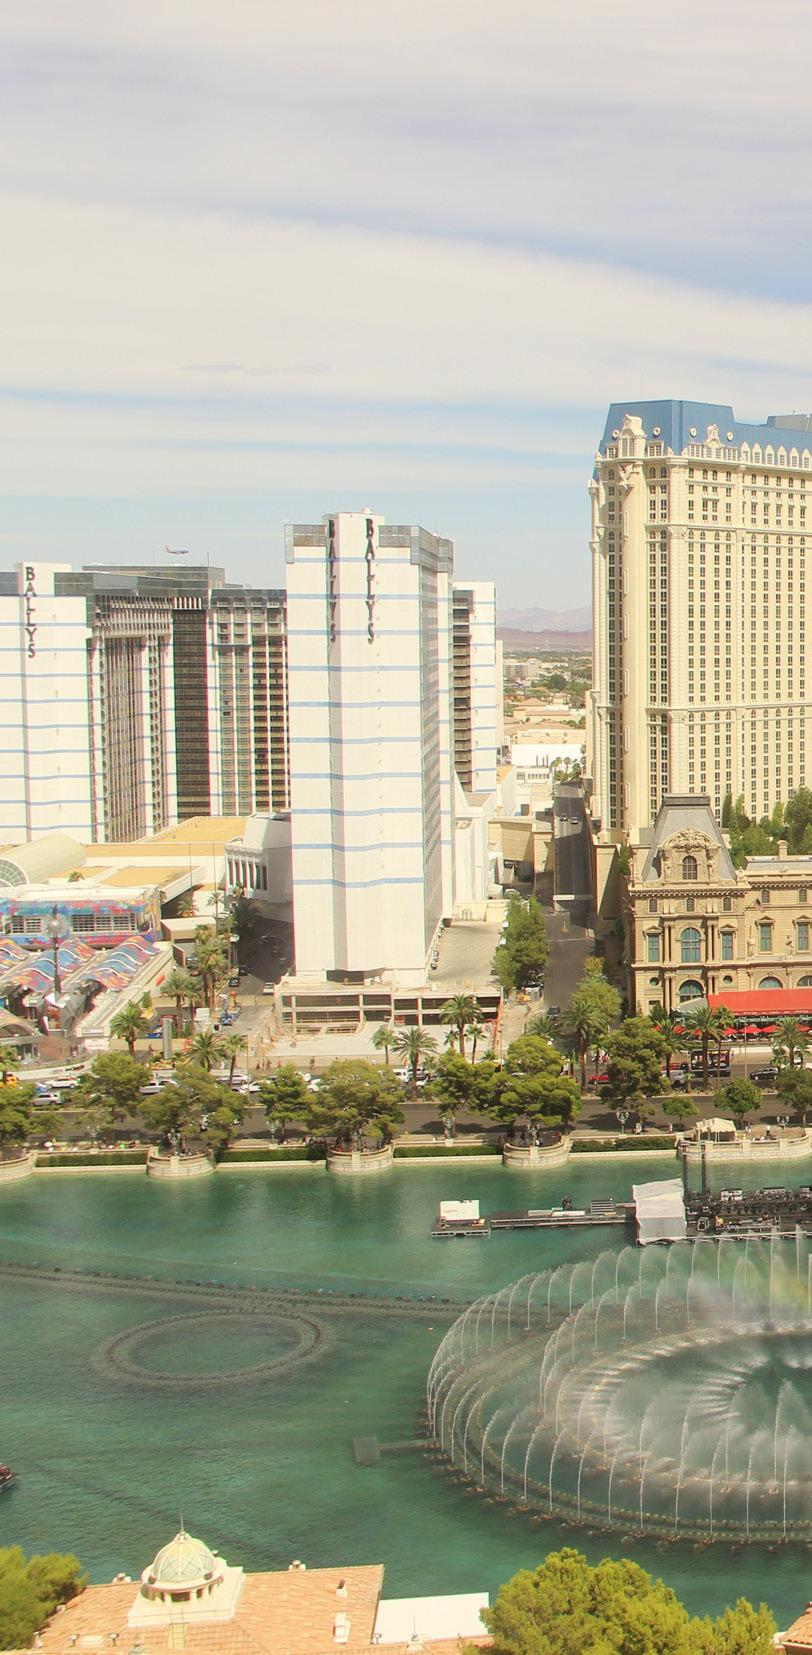
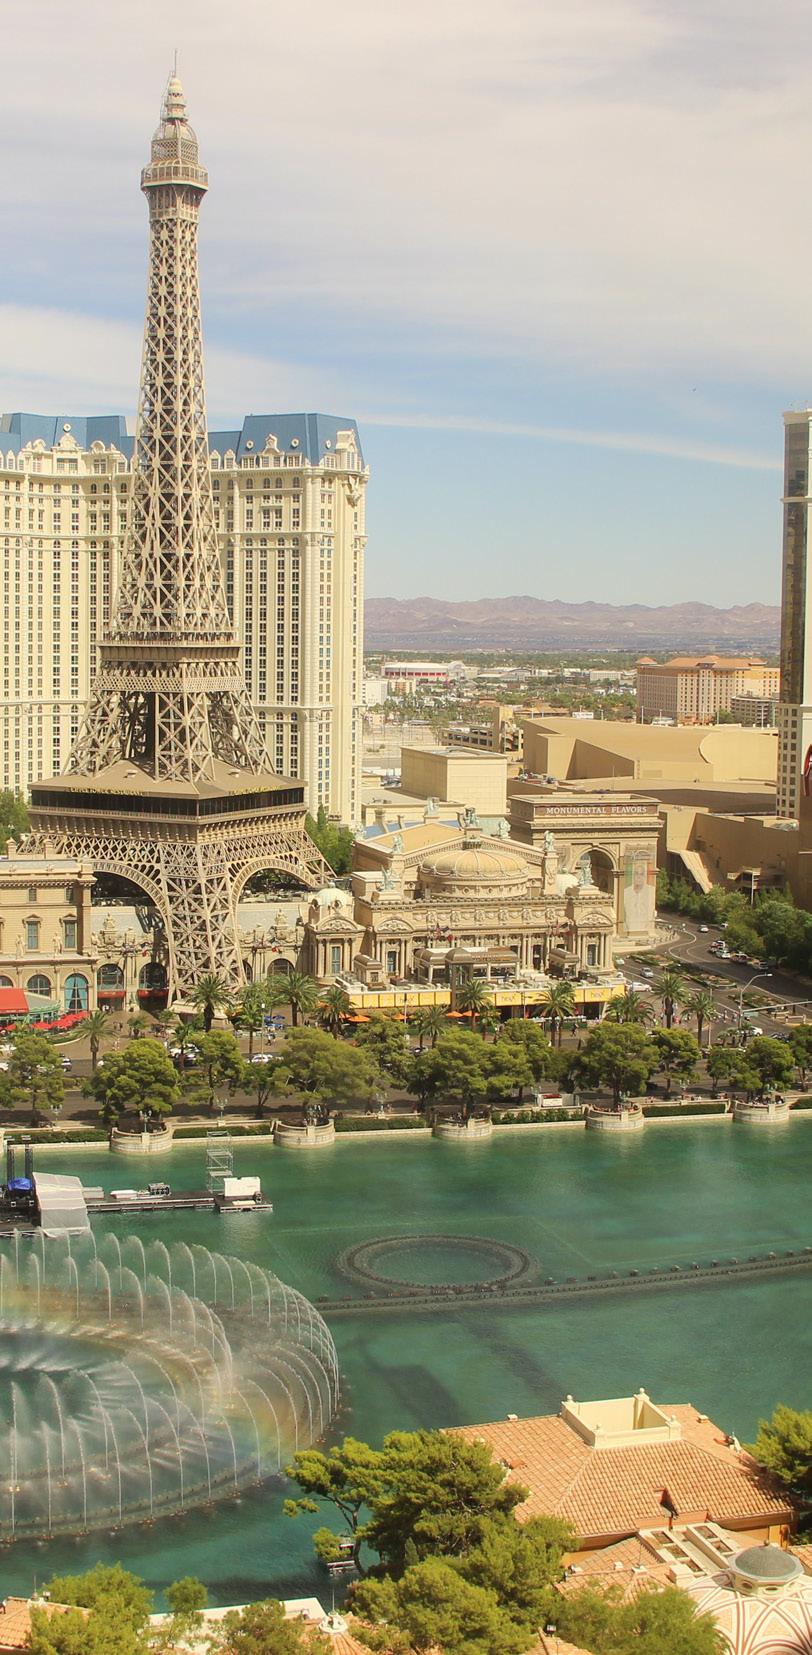
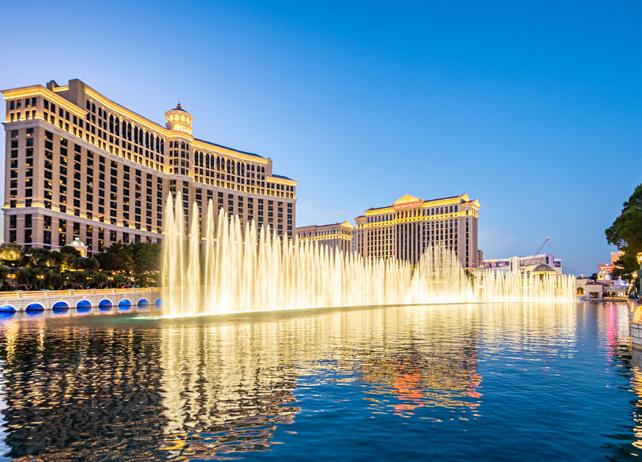
NOTHING COMPARES
For those looking for the very best in entertainment, sports, cuisine and nightlife, nothing compares to Las Vegas. This amazing city is a sought after destination for people all over the world. And when you call Vegas home, it’s all there in your backyard. Let us be your guide. Las Vegas Sotheby’s International Realty can connect you with incredible properties throughout Southern Nevada.
NO PERSONAL INCOME TAX
NO ESTATE TAX
BUSINESS FRIENDLY CITY
13TH BUSIEST US AIRPORT
38+ MILLION VISITORS IN 2022
2.8 MILLION RESIDENTS
25TH LARGEST CITY IN THE US

HOME TO NFL, NHL AND WNBA TEAMS
 LAS VEGAS AT A GLANCE
LEARN MORE AT LASVEGASSIR.COM
LAS VEGAS AT A GLANCE
LEARN MORE AT LASVEGASSIR.COM

LAS VEGAS 8548 Rozita Lee Ave, 100 Las Vegas, Nevada 89113 LAKE LAS VEGAS 2030 Lake Las Vegas Pkwy Henderson, Nevada 89011 lasvegassir.com | 702.360.1414
OUR LOCATIONS
