INFLATION LIFE RAFT

TH E P L A Y B OOK January 2023
Inflation, like the ocean tide, ebbs and flows often and restaurant operators find themselves stranded in a sea of indecision. The rate of inflation can increase or decrease, affecting the prices of everyday goods and services. As those goods and ser

As inflation increases, restaurant operators may experience several challenges: increased cost of goods, increased and supply chain issues. Each of these affects restaurant operations and it important to have a plan to mitigate potentially negative financial implications. Historically, restaurants are several months behind the tide of rising infl they risk drowning in the increased cost that inflation brings instead of anchoring themselves in a position of financial stability.

INDEX INFLATION LIFE RAFT 3 Definitions 4 Key Areas to Inflation - The Menu 6 Menu Engineering 8 Food Cost Percentages 10 Adapting to be Successful 12 Top 5 Inflation Busters 14 Key Areas to Inflation - The P&L 18 Key Areas to Inflation - The Revenue 20 7 Ideas to Drive Revenue 22 Industry Resources 24 Business Solutions 28 Calculators Guide 30 Sysco Brands
2 INFLATION BUSTERS PLAYBOOK
DEFINITIONS
WHAT IS INFLATION?
Inflation is an overall increase in the prices of goods or services in an economy. Over time, currency loses value and it doesn’t have as much purchasing power as it once did. In other words, whatever a dollar can buy is reduced over time. Inflation can occur for a variety of reasons, like higher wages, lower interest rates, supply chain issues, or broader issues in the global economy.
re·ces·sion
A period of temporary economic decline during which trade and industrial activity are reduced, generally identified by a fall in Gross Domestic Product (GDP) in two successive quarters.
PRODUCER PRICE INDEX (PPI)
The Producer Price Index (PPI) is an economic measurement of the average change in prices that domestic producers of goods receive for their products in a given country or region.
PPI is a metric used in economics to help define inflation rates. Previously known as Wholesale Price Index (WPI).
CONSUMER
INDEX (CPI)
PRICE
Inflation rates are calculated using the Consumer Price Index (CPI) and the Personal Consumption Expenditures Price Index (PCE). Together, these data points are used to determine the rate of increase in prices over a given period of time. The two broad, general causes of inflation are “demandpull inflation” and “cost-push inflation”. Demand-pull inflation refers to situations where there are not enough products or services being produced to keep up with demand. Cost-push inflation occurs when the cost of producing products and services rises, forcing business to raise their prices.
{ { MAJOR GROUPS OF THE CONSUMER PRICE INDEX THE 8 OTHERGOODS & SERVICES RECREATION M E D I CAL C ARE EDUCATION&COMMUNICATION TRANSPOR T A T I O N APPAREL HOUSING FOOD&BEVERAGES 3 INFLATION BUSTERS PLAYBOOK
KEY AREAS TO MANAGE INFLATION THE MENU

4 INFLATION BUSTERS PLAYBOOK
We’ve all heard the old adage: the menu is the only marketing piece a restaurant produces that 100% of its guests see. Whether delivering this menu in a hard copy or a digital format, this idea reigns supreme. A restaurant’s menu is an amalgamation: part expression of the brand, part summary of passions, and entirely linked to a restaurant’s profitability.
There are proven and necessary steps to ensure a profitable menu, such as: knowing the costs, knowing the costs for each plate, understanding how portion size, waste, and theft can potentially impact profits, and creating a menu design intentionally featuring the most profitable items on the menu. Leveraging the power of images and gaze patterns, guests are subtly directed to these items.


Understanding that menu design drives a restaurant’s revenue is the single biggest takeaway needed to make a menu more profitable. The next steps are leveraging the knowledge to improve digital presence and respond creatively to the challenges of inflation.


5 INFLATION BUSTERS PLAYBOOK


If I want a menu to be profitable, I need to... THE LITTLE ENGINE THAT COULD Know the Exact Portion & Cost for Every Plate Served 1 6 INFLATION BUSTERS PLAYBOOK
DOGS
PUZZLES
Plowhorses sell well, but don’t do as well in profit margin. Can you make these items more profitable by increasing price or decreasing cost?

Dogs don’t produce for you at all. Do you need these items on your menu?
Stars sell well and they bring the highest gross profit margin. Emphasize your Stars on your menu.
Puzzles don’t sell as well as you’d like, but when they do, the profit margin is above average. Look for ways to sell more of these items.

STAR CHART STARS
PLOWHORSES APPETIZERS
190 160 130 100 70 $6.50 $7.00 $7.50 $8.00 $8.50 UNITS SOLD GROSS PROFIT
Engineer to Feature Profitable Items 3 Monitor Waste/ Theft 2 7 INFLATION BUSTERS PLAYBOOK
IDEAL FOOD COST PERCENTAGES SHOULD BE SPECIFIC TO
YOU
We are often asked about what the “right” or “average” food cost percentage should be. The reality is that there are different food cost percentages for every cuisine type and service style.
For example, pizza restaurants and steak houses represent the extremes at 25% and 45%, respectively. Most other restaurant types operate somewhere between those two, with an average of 28-35%.

Your food cost percentage should be defined by your budget & profit goals.
For example,
2835% I NDUSTRY AVERAGE
8 INFLATION BUSTERS PLAYBOOK


INDUSTRY STANDARD FOOD COST PERCENTAGES Knowing average food cost percentages helps to strategize the appropriate response to inflation and increase overall revenue. Create and design recipes and menus, as well as engineer your menu for higher profitability. syscostudio.com SOLUTIONS CORNER APPETIZERS 20% - 32% SALADS Avg. 22% W/ PROTEIN 30% - 35% PASTA Avg. 18% W/ PROTEIN 20% - 35% BREAKFAST 20% - 30% SOUP 20% - 25% PIZZA 20% - 30% BURGERS 25% - 40% STEAKS 35% - 45% SEAFOOD 30% - 45% SANDWICHES 25% - 35% ENTREES 25% - 40% DESSERTS 20% - 35% SIDES Avg. 23% 9 INFLATION BUSTERS PLAYBOOK
The pandemic has accelerated changes that were projected to occur:
•
• 46% of consumers used curbside pickup for the first time
• 86% of consumers expect the food to be restaurant quality
• At least 84% anticipate ordering more or the same amount of delivery, pick-up, and drive-through.

PRO TIP
Make a guest's digital experience as seamless as possible. Streamline offerings to only those that stand up to delivery.
OF CONSUMERS BELIEVE THAT RESTAURANTS MUST ADAPT TO BE SUCCESSFUL 49% - Datassential 2022 Food @ Home Keynote
QR code downloads increased by 750%
ROBUST DIGITAL BRAND MATTERS NOW MORE THAN EVER! 10 INFLATION BUSTERS PLAYBOOK
A


SOLUTIONS CORNER Check out Sysco’s Business Resources Team in action putting Menu Strategy in motion. Menu Strategy Create QR codes TOP RECOMMENDED CHANGES PRO TIP Identify your top 10-15 products by expense and implement strict portioning and critical item tracking •Reduce the number of menu items •Consolidate preparation •Re-evaluate dishes that result in waste or requests for to-go boxes •Use high-quality further processed items to save labour •Implement strict portioning practices •Re-invent dishes to command a higher price point 11 INFLATION BUSTERS PLAYBOOK
5 TOP

RECESSION BUSTERS TO MAKE YOUR MENU MORE PROFITABLE 12 INFLATION BUSTERS PLAYBOOK


Drive revenue by offering partially prepared items to finish at home. Great opportunity to market towards busy families that are on-the-go! UNIQUE EXPERIENCES Ghost Kitchen, Virtual Brands, Eatertainment & Popups- Differentiation is the name of the game. Experience and exclusivity is the focus. DIGITAL/ APP EXCLUSIVES/ LOYALTY PROGRAMS Whether unlocking free food on an app or ordering through Roblox©, patrons are embracing digital loyalty programs. FAMILY-SIZE Large portions of beloved and signature options to feed 4 or more.
HEAD ON Restaurants are offering specials that take on inflation. Some examples are offering 80’s prices or discounts billed as economic stimulus packages. Even though they are limited offers, they create a perception of fair pricing. 13 INFLATION BUSTERS PLAYBOOK
MEAL KITS
ADDRESSING INFLATION
KEY AREAS TO MANAGE INFLATION THE P&L

14 INFLATION BUSTERS PLAYBOOK
INFLATION
has occurred throughout history for a variety of reasons. Inflation is when demand out paces supply, which can impact a variety of things: food prices, fuel costs, utilities, taxes, etc. Inflation at a healthy growth rate of 2% yearly is a good thing for the overall economy. However, as inflation grows beyond 2%, a restaurant’s profitability can dwindle fast!

15 INFLATION BUSTERS PLAYBOOK
What we have always done does not work today. Why? For years we have managed a restaurant’s P&L in a rule of thirds This is where the menu price is determined by multiplying the plate cost times three. From that menu price, typically 30% goes to Cost of Goods, 30% goes to labour, and 30% goes to business expenses, which leaves 10% profit for the operator. In the past, we have focused on food cost and price adjustment to impact our overall P&L profitability. However, as inflationary pressures grow, we must review the entire P&L to identify opportunities to grow our profits from Revenue to the Bottom Line.
So how can we use our P&L to help manage this? First, we must remember that a P&L is only 5 numbers: Revenue, Cost of Goods, Labour, Expenses and Profit We must balance the COGS (Cost of Goods Sold), Labour and Expenses against our Revenue to get to our profit goal. Looking across all categories in the P&L will have the greatest impact and prevent our prices from getting so high that we are no longer marketable. Let us look at each of the 5 key elements and ways to improve them.

16 INFLATION BUSTERS PLAYBOOK
REVENUE is the number one way to improve your profits. Growing your business above where it is today will allow you to add more dollars the fastest. Creating new and innovative revenue streams such as theme nights or takeout home meal kits will drive positive revenue!
COST OF GOODS is typically the largest opportunity to improve by controlling waste, theft, and over-portioning. Implement processes, such as a waste-log or count-sheet on highend product, to keep these under control. Understanding your theoretical food cost is important for you to understand and share to give a real measurement of what success looks like to your staff.
LABOUR is best managed when it is forecasted to your business. One way to do this is to predict your business for the week, multiply by your target labour percent, which will determine your total labour spend for the week. Take that dollar amount and divide it by your average hourly wage, which will give you the total hours you have to use on your schedule.

EXPENSES should be reviewed monthly. This identifies where you see changes in the monthto-month expenses that may be going unnoticed. Are all your expenses necessary? Can you renegotiate your services for a lower expense?
PROFIT is a win when you hit or exceed your goal!
Focusing on the big picture can help you to maintain your profitability. The profit you need to reinvest in your business, reinvest in your people and funds for those rainy-day events is critical to the continued success of your foodservice dream.

Cogs
Expenses
Profit
17 INFLATION BUSTERS PLAYBOOK
Revenue 100%
?% Labour ?%
?%
10%
KEY AREAS TO MANAGE INFLATION THE REVENUE

18 INFLATION BUSTERS PLAYBOOK
Conventional wisdom triggers two main responses during periods of inflation: raise menu prices and focus on Cost of Goods. While these two aspects are important, along with labour cost and variable expenses, they neglect one aspect of restaurant profitability that can potentially drive even greater returns to the bottom line: Revenue.
The mantra “A penny saved is a penny earned” is only partially correct within the context of a restaurant profit and loss statement. This is for two reasons:
1.Cost of Goods Sold is only one component of expenses within a P&L. A 10% increase in COGS does not translate directly into a 10% decrease in profits- in fact it’s likely to make a 2-3% impact- which is still significant considering the average profit margin for restaurants is less than 5%.
2.A penny saved is likely to be lost along the way. The main drivers of food cost are actually over-portioning, theft, and waste. Simply overportioning any protein by even ½ an ounce easily adds up to thousands of dollars per year in lost profits.
Strict controls over portioning and inventory are the most effective way to manage rising costs of goods, in conjunction with accurate menu pricing. So, if COGs is not the strongest lever to increase profits, what is?
Restaurants want to take advantage of what is known in microeconomics as ‘economies of scale’. Economies of scale are benefits realized when a business can handle greater sales volume without incurring an equivalent measure of expense. What does that look like in a restaurant? Your restaurant serves 100 covers on an average Monday. After COGS, labour, fixed and variable expenses you profit about 5% on those covers. Now, let’s say you are able to increase your Monday average to 120 covers: you are still paying the same overhead as you did with 100 covers, so the only expense incurred on those additional covers is the cost of the goods. Assuming a food cost of 35% that means you are driving 65% of that revenue straight to the bottom line.
During inflationary times consumers tend to dine out less, so attracting additional diners can be challenging. However, your P&L doesn’t care where the additional revenue actually comes from, just that you are generating more sales and your expenses aren’t increasing dramatically. This is when savvy operators will focus on new consumer preferences and channels that have arisen during covid, like off-premise features, streamlining service, leveraging technology, and utilizing online tools to interact with customers. Internally, promoting higher margin menu items and suggestive selling can easily add 20% to a check average. Unlike the 20% growth in the above example, this added revenue is gained without increasing the number of customers walking through the door. The next two pages provide some guidance on how to drive revenue in today’s marketplace.

19 INFLATION BUSTERS PLAYBOOK
The pandemic accelerated a variety of new experiences consumers have access to while dining out. Consumers are now reluctant to return to the past, which gives operators the opportunity to build revenue in new ways!
In other words, diners will continue to dineout, and creative operators will benefit from focusing on offering fun & unique experiences!
DRIVE REVENUE
Sharpen Your Online Brand.
Around 90% of diners who have not visited a restaurant will make that decision based on what they see on websites, social media, and especially reviews. That’s 9 out of 10. If your online Brand does not engage your potential customers, you’re left with just 10% of the market to fight over.
Off-Premise isn’t going away. The National Restaurant Association estimates that by 2023, 30% of ALL restaurant orders will be eaten off-premise, whether pick-up or delivery. And the vast majority of those orders will be placed online. The ability to order online via your website is your primary conduit for capturing what will soon be nearly 1/3 of all restaurant orders placed. And no, Facebook doesn’t count.

Make your Off-Premise Experience a Unique One. Have you ever received a take-out order and wished you had dined-in? The delicious food crammed haphazardly into a 9x9 box leaving a lack-luster experience. What if we can give the experience of dining-in with our off-premise food? A few fun ideas are to include a customized playlist of music that replicates the theme of the restaurant or including simple trivia games about the community or cuisine. Include a recommended viewing list for families on Hulu, Disney or Netflix.
Speaking of Economies of Scale. Right now the #1 demographic spending money in restaurants is Millennials, 25-40. There are a lot of new homeowners, one or both are employed, and they have young families. Ordering for a family online can prove a challenge when coordinating everyone’s selections and dealing with separate menus. Why not bring back the family meals? Family style meal orders can be taken online with a time buffer for preparation. They can utilize less expensive ingredients and less packaging while providing value for the consumer. And what better way to showcase your Disney playlist and word find puzzles you created?
1 2 3 4
20 INFLATION BUSTERS PLAYBOOK
Here are additional ideas to 7
Variety is the Spice of Life. Another avenue for attracting repeat diners is to offer variety so consumers can try new things more often. Whether it’s offering new features every day or once a week, or offering a different family style meal every day through the weekend, consumers will look forward to visiting your new website and checking out what you have to offer. Changing up your offerings is also a great way to manage ingredient shortages you might be having- especially since most ingredients that are experiencing shortages also tend to be more expensive due to demand. Market your offerings with videos and use words like ‘select’, ‘limited time only’ and ‘featured’- not “specials”, which sounds like you’re just trying to clean out the walk-in.
Regardless of the overall economy, two things are for certain: the American consumer will continue to dine away from home, and they will continue to crave a satisfying experience. All businesses, restaurants included, need to insure their financial house is in order. But more than ever there is a real opportunity to stand out from the competition and create an experience that will continue to generate additional revenue long after inflation has disappeared from the headlines.

5
21 INFLATION BUSTERS PLAYBOOK
There are many different platforms to choose from when looking for information on inflation. We have listed a few below to help you make informed decisions within your business when it comes to inflation.

The Trading Economics website has multiple topics that share current inflation information. This website will take you to an overview of Food inflation in Canada and a summary of the current condition.

The second topic in this website shares Canada's Producer Price Inflation Month over Month. This helps with understanding why costs have risen. The PPI measures the cost of goods before they reach the consumer. This is the leading indicator of consumer inflation.
Lastly, The Producer Prices Change topic shares the producer inflation as a percentage.
Datassential Trading Economics • Canada Food Inflation •Producer Price Inflation •Producer Price Changes Statistics Canada • Producer Price Index Detailed Report Restaurants Canada CPI Inflation Calculator
INDUSTRY RESOURCES 22 INFLATION BUSTERS PLAYBOOK
INDUSTRY RESOURCES
Consumer Price Index Inflation Calculator

Using the CPI Inflation Calculator, you can check a ‘now vs then’ dollar worth based off inflation.
Insert your current menu prices and see what it should be today.
Example: a dish priced at $12.99 in January of 2019 should be priced at 15.28 in July of 2022.
CLICK HERE TO USE THE CPI INFLATION CALCULATOR
Restaurants Canada has added many resources on inflation and long term forecasts which will allow you to see how inflation has impacted the restaurant industry. This link shares the latest foodservice sales and menu inflation trends by segment and province.
You can also visit Restaurants Canada's Member Portal to access exclusive industry insights, tools and best practices to help your business.

This information can be a lot to process, but using any of these reports to support your business decisions can impact your profitability immediately.

23 INFLATION BUSTERS PLAYBOOK
BUSINESS SOLUTIONS
Business Resource Consultants Category Specialists
Your BRC will host a virtual & personalized consultation with customers based on their objectives surrounding topics of concern. Discussions focused on inflation may include, but are not limited to, forecasting, menu engineering, food cost, Profit & Loss analytics, and demographic marketing.
Our Category Specialists are experts in their field: produce, protein, seafood or others. They will identify items specific to our customers’ menus that will aid them in growing revenues, while keeping costs at a minimum. Our specialists are visiting customer’s kitchens every day. Reach out to your SC to get some time booked!


Culinary Consultants
Your Culinary Consultants host in-house kitchen visits with customers to focus on cost saving in the back of the house. They feature value-added, less labour intensive and cost effective items to increase profitability. Discussions can surround back of the house efficiencies such as portion control, waste management, and inventory practices. Your SC can schedule a kitchen visit at your convenience to learn more!
24 INFLATION BUSTERS PLAYBOOK Ask your Sales Consultant to book a consultation!


INFLATION BUSTERS INFLATION BUSTERS
Quick
Whileyou can’t control the external factorswhichimpact the costof goods, youcan takesteps to drive profitabilityand maximize grossprofit inthe most bullish of markets. We callthese steps “Inflation Busters.” Engage the links belowto see Chef Neiltalk aboutsimple thingseveryoperator cando to stay solvent. INFLATION BUSTER #3 INFLATION BUSTER #1 INFLATION BUSTER #4 INFLATION BUSTER #6 INFLATION BUSTER #2 INFLATION BUSTER #5 TRADE UP TO EARN MORE RAISE YOU MENU PRICES USE ALTERNATIVE ITEMS PERFORM A MENU AUDIT USE VALUE ADDED ITEMS PORTION CONTROL INFLATION BUSTERS VIDEO LIBRARY MAXIMIZING PROFITS A Quick Guide to While you can’t control the external factors which impact the cost of goods, you can take steps to drive profitability and maximize gross profit in the most bullish of markets. We call these steps “Inflation Busters.” Engage the links below to see Chef Neil talk about simple things every operator can do to stay solvent. 25 INFLATION BUSTERS PLAYBOOK
A
Guide toMaximizingProfits
CALCULATORS GUIDE
Ask your sales consultant for access to these profit building resources.
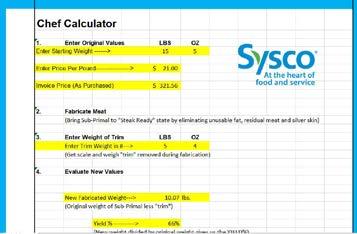
Chef Calculator - this calculator should be used to compare raw products that require labour to breakdown and prepare to items such as portion cut steaks and sliced or diced produce. We will need to weigh the waste associated with raw products to develop the yield ratio. This will enable us to then compare the true cost of producing the finished product and comparing it to the further processed item you are suggesting as a labour-saving product. Use this with the prep labour calculator for prime cost review.
Yield Charts - these simplify the process of weighing out the waste and calculating the yield ratio of usable/ purchased weight and provide a general expectation of what the yield should be on each product listed. Use to create accurate Sysco Studio batch recipes and plate builds.

Sysco vs. Wholesale Cost Calculator - What does that trip to local vendor really cost when all costs are added into the equation? Show them the value of what Sysco has to offer when the Sysco team professionally delivers quality assured, temperature-controlled products.


Sysco Studio - This powerful tool supports recipe costing by updating ingredient pricing and dialing in on portion and yield. It gives operators the power of knowledge and provides them with the ability to make smart choices on menu updates, portioning, and targeted marketing campaigns.


Batch Recipes (Sysco Studio) - Yield of the bulk recipe being created (such as salad dressing made by the gallon) is essential for understanding the cost of combining ingredients in a recipe and knowing the cost of ingredients to produce each plate. This value can than be used in plate recipes to accurately calculate plate costs of menu selections. This will enable operators to identify menu items that need price adjustments to correct the target food cost.
Menu Profit Calculator (Sysco Studio) - The profit calculator in Sysco Studio allows changes to menu prices to be entered so that operators can test drive the changes and know how it will affect the margins on each menu item. Volume adjustments can also be made to create hypothetical scenarios that help operators understand how decreases or increases in sales will affect overall profit.

Labour Cost Calculator - This calculator will tabulate the cost of current labour. It will allow tracking of labour costs to keep them in line with industry standards (see cheat sheet). You will also be able to predict labour cost increases for hourly and salaried employees to better understand the impact on your business as wages increase


Inflation Calculator - In five easy steps, determine what the needed increase per guest check to manage inflation. This tool also include food costing and recipe costing tools.
Menu Engineering Worksheet - As you try to find ways to increase profits in your restaurant, the easiest way to do that is to maximize the profit dollars from your existing customers. In other words, if you have the exact same number of people eat at your restaurant in a given year, you still have the opportunity to achieve higher profits by encouraging your guests to order more profitable items. The menu engineering exercise will allow you, as a business owner, to take the emotion out of decisions you make pertaining to your menu and allow you to base those decisions on data and facts.
26 INFLATION BUSTERS PLAYBOOK
CALCULATORS GUIDE
Ask your sales consultant for access to these profit building resources.
Prep Labour Cost Calculator - Dial in the cost of scratch made batch recipes by calculating the wages paid to prepare. This tool is useful in identifying who the productive members of the team are and who could use some retraining or reassignment. It can also be used to average the cost of prep labour to better understand the associated costs of scratch recipes beyond food costs.
Labour Simulator - As part of the Financial Planning Calculator workbook, this easy to use calculator provides managers with a tool to estimate what the business can afford when faced with decreasing sales forecasts. Input your labour costs and the expected decrease in sales. The calculator does the math and the result is what you’ll actually be able to afford based on the predicted decline in sales.
Prime Cost Calculators - This is perhaps the most important of all. It combines the two most costly budget items of every restaurant’s P&L. Food cost + Labour cost = Prime cost. Depending on service type, it generally is targeted to run 60%-65% of total revenue
P&L calculator - This great Sysco tool is the culmination of data from all the other sources and calculators. It combines reporting on revenue (what is sold) and expenses (what it cost to sell). The challenge is accurate and timely recording of data such as inventory and labour costs, so operators can see if they are making money, breaking even, or losing money. Fixed costs – these rarely change but can be negotiated. An example is rent. Variable costs – food and labour costs are the big variables and operators should focus on managing these variable costs to maximize bottom line improvement.

Break-Even Calculator - great tool included with the P&L calculator. It calculates what amount of revenue is needed to pay the bills and keep the lights on based on operational expenses and expected sales.
Sysco Scheduling Tool - This great tool allows operators to schedule around employee availability and shift level needs. It also includes the Wage Impact Calculator to allow operators to calculate the impact of wage increases and come up with a plan to offset them through various operational savings and revenue growth goals.


Budget Builder P&L Tool - Great new tool developed for operators to start budgeting and managing to their goals. Enter the numbers and watch the magic happen. Available in Calendar and Fiscal year formats
Weekly Tracker Tool - Don’t wait until the end of the month to see if you are on budget. This supplemental tool will help managers keep the business profitable. Use it with the Budget Builder and give managers an easy way to track revenue and expenses while proactively keeping the numbers of the P&L in line.

29 INFLATION BUSTERS PLAYBOOK
The Sysco Brand family encompasses a wide variety of foods, beverages and restaurant supply products, all backed by the highest quality standards and strictest oversight. Sysco Brand products are evaluated for flavor, appearance, nutrition, packaging, convenience and many other factors to make sure our customers receive the best quality and value available. Sysco’s unparalleled selection of innovative ingredients and cutting-edge products connects your business to the industry-leading distribution network - keeping you stocked with the freshest products, trends, and ideas.
BRAND COMPARISON
A QUALITY TIER TO MEET YOUR EVERY NEED!
Sysco Reliance products offer a good value for the price. They are more consistent than other economy labels and provide a lower cost option for all types of foodservice operators.
Sysco Classic products are as good or better quality than national and leading distributor brands while providing more value for the price. This extensive selection can be found in all product categories and ranges from pantry staples, fresh and frozen foods to prepared products.

Sysco Imperial products stand out for the quality of their ingredients sourced worldwide and offer premium performance and exceptional value.
Sysco Supreme products are the absolute finest products available in the foodservice industry. These products have unique formulations and superior ingredients.
30 INFLATION BUSTERS PLAYBOOK
GOOD BETTER BEST SUPERIOR
SYSCO BRANDS STORY

Sysco lives at the heart of food and service.
With every product, and every delivery, we demonstrate our passionate commitment to the success of every customer, supplier, community and partner. To support this mission, we routinely evaluate our services and develop solutions to meet our customers' diverse needs. As a result, we have recently undertaken a large-scale revitalization to update our Sysco Brand product designs. Customers will benefit from the clean, consistent look of product names, descriptions and reorder numbers on each package. As always, each of our family of products comes backed by the largest Quality Assurance team in the industry.
Leading Quality. Leading Brands.
We've built our reputation and success by focusing on quality, consistency, savings, and variety. We bring the very best to you and your customers.
31 INFLATION BUSTERS PLAYBOOK
SYSCO BRAND FAMILY

From Fresh to Finish
With Sysco, quality is assured. Our QA team consists of approximately 196 full-time corporate associates and 35 contracted inspectors dedicated to quality assurance. Through ongoing plant audits, inspections, and product evaluations, the QA team fulfills Sysco’s vision of being our customers’ most valued and trusted business partner by delivering products that meet the most stringent safety, reliability and quality standards. Our quality assurance program has a global presence, with products sourced from 40 countries worldwide.

C 100 M 28 Y 0 K 0 PMS 3005 C C 67 M 0 Y 98 K 5 PMS 369
32 INFLATION BUSTERS PLAYBOOK
MENU APART

Quality Assurance with Sysco Brand
These brands make no compromise in quality with a focus on superb consistency. Higher yields, quality, optimal traceability and much more ensuring our product is everything our customers deserve.
PRODUCE
We know how important produce is to your business. In fact, produce makes up half of every plate. Every Sysco branded produce item follows rigid specifications. Food Safety and Quality Assurance follows product from field to fork.


PROTEIN
Sysco’s Specialty Meat & Seafood Group was formed to answer demand from Sysco’s customers who required the highest quality portion-cut fresh steaks, chops, poultry and seafood produced in state of the art food safety conditions. Branded livestock proteins purchased from suppliers certified by Sysco and independent auditors to meet exacting and strict globally recognized standards for food safety and food quality. Our commitment to providing the best quality livestock protein products extends beyond product quality to detailed animal handling requirements in our Animal Welfare Program.

SEAFOOD
Sysco is leading the industry in Seafood Sustainability. Today’s catch is tomorrow’s supply. We are committed to offering products that meet operator needs.

PROCESSED FOODS
Processed fruits and vegetables are offered in canned or frozen forms. Processed fruits and vegetables are alternative to fresh fruits and vegetables, offering benefits of convenience, easy storage, easy preparation, longer shelf life, and year-round availability. Processed fruits and vegetables retain most vitamins as they are generally processed and packaged within hours of being harvested. Sysco is committed to delivering processed fruit and vegetable products that provide consistency and exceptional value at all quality levels.
SETTING YOUR
HIGHER YIELDS + HIGHER QUALITY = HIGHER PROFITS WINNING WITH SYSCO BRAND! 33 INFLATION BUSTERS PLAYBOOK


 JayAshton|SyscoCanada
JimTaylor|BenchmarkSixty
JayAshton|SyscoCanada
JimTaylor|BenchmarkSixty
The Sysco Advantage program is designed to make you more efficient, increase your profitability and make it easier for you to manage your operations.

The intent is to help drive business in all areas of house with our holistic collection of offerings, encompassing our specialized services, restaurant technology, tools, partnerships, and personalized consultation.
We have partnered with best - in- class companies to make sure our customers have the right tools to optimize their business and increase traffic.
Visit www.syscoadvantage.ca to see a full list of our partners.


INFLATION LIFE RAFT
TH E P L A Y B OOK

sysco.ca © 2022 All rights reserved. Sysco Corporation. 3452204

