15 minute read
Thermodynamic Charting of Materials Space

from Immerse 2018


by R Mythreyi
Advertisement
If all materials in the universe lived in one country, thermodynamics will form the government. Every aspect of a material’s existence and the changes it undergoes, no matter if it’s a pure element, compound or solution, is governed by the laws of thermodynamics. Building from the clear rules that have been laid out by thermodynamics, Professor Hari Kumar from the Department of Metallurgical and Materials Engineering, and his group members, use novel methods to simplify the process of providing useful insights to many engineering materials by generating ‘Phase Diagrams’ - one of the most indispensable tools in a material scientist’s arsenal.
Metallurgical & Materials Engineering
Elements and compounds have phases like solid, liquid and gas but phases can no longer be clearly distinguished in this manner when it comes to solutions. A simple example will be a solution of sugar in water. When we have pure water, we have one phase - liquid water. Similarly, just sugar is one phase - solid sugar. However, when we dissolve some sugar in water, they mix completely and we once again have one phase - sugar solution. If we keep adding sugar, we reach a limit beyond which sugar can no longer dissolve in water (called the “solubility limit”), and the solution is said to be saturated. Any extra sugar that we add to such a solution will precipitate out as a separate phase - solid sugar, giving us two phases in the mixture - solid sugar and sugar solution. The same phenomenon is observed in alloys (an alloy is a solution of different metals). One element can dissolve another element to form a single “phase”. However, there can be a “solubility limit”, beyond which a second phase of the alloy appears. There can therefore be many different phases even when only two or three elements are involved.
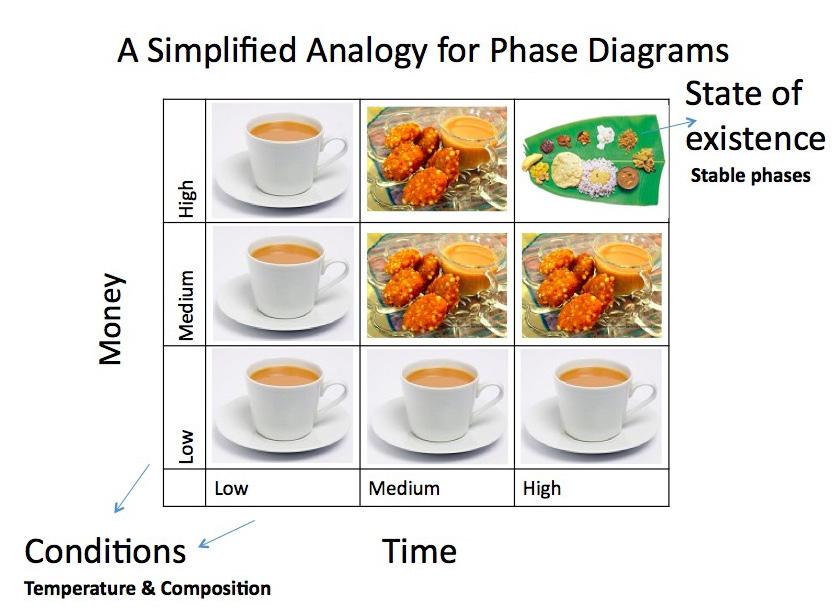
What is a phase diagram? When I ask this question to Guruvidyathri, a doctoral student working in this group, he shows me a “Phase Diagram” for food. He tells me enthusiastically, “A phase diagram is not a twodimensional graph, where there’s a one to one relation between the X and Y variables. Phase diagrams are more like maps, where there are at least two independent variables that we can change to observe different states of existence. To put it simply, consider a “phase diagram” of food (Figure 1), where we can control “time” and “money”. The kind of food that you can eat, the state of existence, depends on the time and money you have at the moment, your (hopefully) independent variables.” The phase diagrams for material systems are similar. The most commonly used phase diagrams give a map of the stable phase the system exists in, the state of existence at a particular temperature and composition of the system, the independent variables.
The Need for Phase Diagrams
To understand the need for phase diagrams, let’s imagine this situation. Suppose that you’re to meet your adventurous friend living in an unknown city in a far away country. You reach the city, equipped with some landmarks shared by people who have already been to the place. However, only when you reach there do you realise that everything you know about the place seems scattered, leaving you unsure as to where you must go. As you go from place to place looking for the destination, a kind passer-by gives you a map of the whole city. Relieved, you are now able to quickly find the correct spot and are on your way to meet your friend. Your situation before you knew about the map is not much different from what a metallurgist working on alloy design faces. The applications of an alloy is dictated by its properties. All of us know about the periodic table and the different elements in it. It is not possible to try out all the ways to combine elements to form alloys as the number of combinations is simply too large.
We can now see that metallurgists and material scientists need charts giving them a starting direction to solve many problems. These charts are called phase diagrams. Professor Hari Kumar and his group work on making sure that phase diagrams are available for important engineering materials. For example, by virtue of their high hardness and wear resistance, transition metal nitride coatings are of great interest for cutting and forming tool applications. Titanium, Zirconium and Nitrogen (Ti-Zr-N) is one such important material system. Soumya Sridar, another doctoral student in the group, works on the thermodynamic modelling of these transition metal nitride systems in order to get the phase diagrams. She says, “Knowing the phase equilibria information is crucial for understanding phase evolution in the material and for fine-tuning the chemistry of these coatings to enhance their properties”.
Fig. 1: A ‘Phase Diagram’ analogy for food. Money and Time are the independent variables. The kind of food one can eat is the ‘stable state of existence’
Computational Thermodynamics
This idea of thermodynamic ‘modelling’ is novel. Phase diagrams were generated only based on experiments in the earlier days. Since there are at least two independent variables, to get each phase diagram, researchers would perform systematic studies on varying amounts of materials in a particular system and would obtain the stable phases that exists at a given temperature, pressure and composition of the alloy. Looking at the complex phasetemperature-composition space that materials span, it was realized in early 1950’s that it’s quite a challenge to probe all of it through experiments alone. It was known that using thermodynamics to generate phase diagrams would be more efficient and powerful. With the development of computational tools in the 1980’s, the field of “Computational Thermodynamics” emerged and rose in popularity. These clever combinatorial techniques remove the sole dependence on thousands of painstaking experiments. This method of CALculation of PHase Diagrams is called CALPHAD. However, being a combinatorial technique, CALPHAD requires inputs that come from either very careful experiments in selected regimes of composition space or other computational methods. Therefore, in CALPHAD, experiments and computation complement each other.
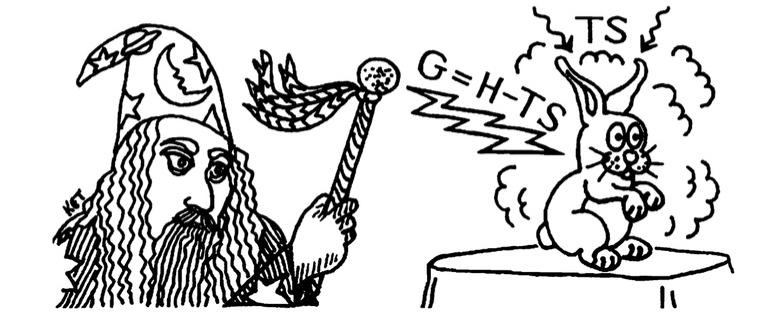
Thermodynamics is the study of transfer and conversions of energy that happens in different processes, including mechanical, thermal and chemical reactions, and the resulting changes. Based on the conditions in which a process occurs, there are different measures of energy that can be analyzed. One such measure is called the Gibbs energy, denoted by the symbol ‘G’. In thermodynamics of engines, it’s often called the useful energy that can be extracted from a system at constant temperature and pressure. The entity that restricts the complete extraction of energy is called entropy, denoted by ‘S’. Entropy is a measure of randomness. We can quantify the energy that gets dispersed out randomly, thereby becoming unavailable for useful extraction, using entropy. If true magicians existed, the energy that they will have to provide through their magic to pull a rabbit out from a hat is the Gibbs energy of the rabbit. Thus, ‘G’ (Gibbs energy) will be ‘U’ (Internal energy, for the atoms in the rabbit’s body), added with ‘PV’ (Pressure times Volume, energy to move the atmosphere away and create space for the rabbit) and subtracted by ‘TS’ (Temperature times Entropy). This is illustrated in Figure 2. Thus, Gibbs energy is a function of the state of the system and the state is determined by variables like temperature, pressure and composition. Being a fundamental law of thermodynamics, in our universe, all processes lead to an increase in entropy. When all systems tend to increase the entropy, it also means that all systems try to minimise their Gibbs energy, obtaining a stable state or ‘equilibrium’. It is one of the crucial ideas behind generating phase diagrams through CALPHAD because this gives information about which phases will be present at equilibrium at given conditions.
Using CALPHAD to get Phase Diagrams
To get a phase diagram using CALPHAD, we need to first find out all possible phases a chosen system can exist in. This depends not only on the number of components in the system, but also on the type of components and their mutual interactions. Once we know which phases can potentially form, the next step is to get the Gibbs energy function of each of the possible phases. This step is called the ‘Gibbs energy optimisation’ step. Here is where CALPHAD takes in inputs from other methods.
Fig. 2: Understanding Gibbs Energy intuitively to see why it must get minimised at equilibrium
Metallurgical & Materials Engineering
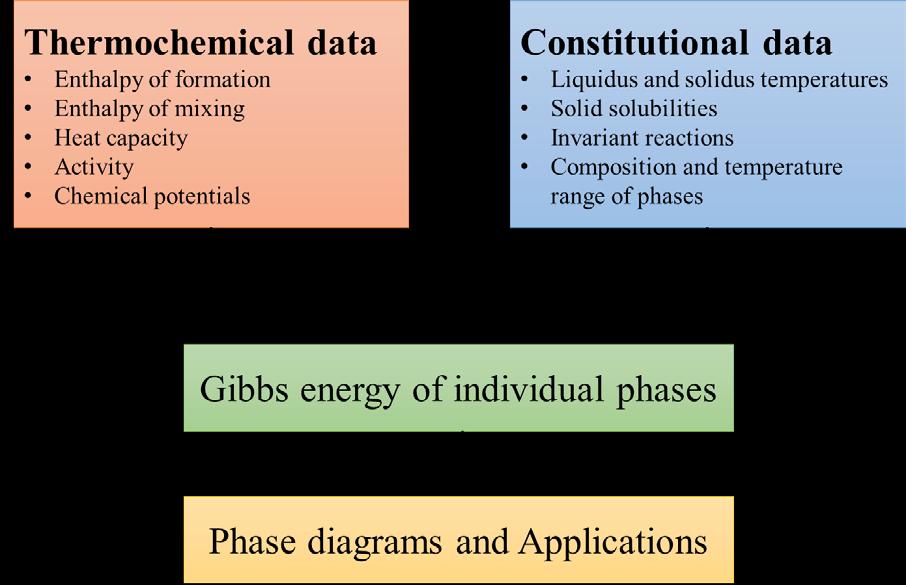
The experimental thermochemical data available for the Ti-Zr-N system is rather limited. In order to get the relevant inputs, there’s a need to look at other means. These inputs can be can be data generated from other empirical and computational methods too. Empirical methods are not based on the science behind the properties but are useful ‘shortcuts’ to obtain the properties quickly. Computational methods are physics based techniques such as Density Functional Theory (DFT). In DFT, Fig. 3: Flow of information in the CALPHAD method properties are obtained by modelling electronic interactions, those similar to the what we observe when we rub a plastic ruler with fur and use it to ‘attract’ bits of paper. The difference is that, in DFT, the interactions are based on quantum mechanics and are more complex. Once we get sufficient inputs, CALPHAD can give us a Gibbs energy function for all of the phases present through a careful optimisation exercise with some constraints included. After this, thermodynamics allows us to calculate the ‘equilibrium’ by minimising the optimised Gibbs energy expression. This minimisation can be thought to be a competition among the different phases to reach the lowest Gibbs energy. We can expect more than one winner out of this competition because thermodynamics allows multiple phases to reach a stable state that has a Gibbs energy lower than what the individual phases can reach on their own. At the end of this minimisation, we have information about the best combination of phases at a given state. This information is sufficient to construct the phase diagrams. As with any computational technique, some experiments are needed to corroborate the results obtained. Figure 4 is the phase diagram of Zr-N, is an example of such a comparison.
The Advantage of Computational Thermodynamics
The real power of computational techniques can be realised only when we look at alloys with many components and the serious scaling up that happens to the numbers involved. When we consider that there are around seventy useful engineering materials, nearly all the binary (two elements) combinations have been studied and around two thousand binary phase diagrams are accessible in form of handbooks or databases. This is a result of generation of phase diagrams through both experimental and computational methods. If we Fig. 4: Comparison of calculated Zr-N phase diagram and experimental data. Such a comparison validates calculations. add one more element to form ternary (three element) systems, the number of phase diagrams possible explodes to around fifty thousand. While some of ternary phase diagrams have also been generated so far, the number is much lower than fifty thousand. A new emerging trend in alloy design is the study of High Entropy Alloys, also called HEA’s. In HEA’s, four or more different elements are combined in equal

proportions to form new alloys. With the inclusion of these many elements, we can see that the numbers are just too big. If one starts a purely experimental program to generate all such phase diagrams, it’s going to be a very time consuming and difficult task. Here’s where CALPHAD comes in handy.
The highlight of the CALPHAD method is that it doesn’t require experimental data generation for four or five component systems; it works by extrapolation. The generated Gibbs energy functions of the lower order systems can be extrapolated to higher orders (four or more elements) based on some geometric methods. This extrapolation is very reliable because of two main reasons - one physical and one mathematical. When we look at the number of phases in unary (one element) systems and number of phases that are new in binary systems, the difference is big. A binary system can sometimes even have fifteen to twenty phases possible. But while creation of new phases is rampant in binary systems, the number of new phases decreases substantially thereafter. Rarely do find new phases that form in the higher order systems beyond the phases found in the ternary system. Hence, we do not have to extend the experimental search beyond three or a maximum of four components. This is the physical reason why extrapolation works in CALPHAD. The other reason is mathematical. The energy functions that are generated through CALPHAD usually have the energy contributions of each phase weighted by the composition of the phase. Composition is a fraction, therefore the unary contributions are multiplied by one fraction, binaries are multiplied by two, ternaries by three, and so on. When a number is multiplied over and over by a fraction, its contribution to the total energy becomes very small. We can safely ignore these terms and this adds to why CALPHAD works well.
Linking CALPHAD with other Computational Materials Engineering Techniques
Thermodynamics doesn’t deal with time, it can only tell us whether a change is possible or not but can’t tell us how long it will take to happen. For instance, thermodynamics says that diamonds are less stable than graphite (the same substance that makes our pencil leads) and so diamonds must transform into graphite to reach their equilibrium. But thankfully, the rate of this reaction is so slow at ambient conditions that we don’t observe this in the jewellery that we buy after paying lots of money. The rates of reactions are dealt with in kinetics. Most of the time, the engineering applications of a material will not require the equilibrium phase of the material. There may be other useful phases with desirable properties that have useful applications. Since the material is not at equilibrium already, it always has a tendency to transform. But when we use it in applications, it becomes important to look at how long the material can remain in the non-equilibrium state as the changes in its properties due to its transformation could be catastrophic to the application. We will have to know in advance when the material will be exhausted and for this, we perform kinetic simulations. To perform these kinetic simulations, we need thermodynamic inputs. The Gibbs function that we obtained by generating phase diagrams can become inputs to such simulations because though the phase equilibrium information that we got is the primary output of CALPHAD, we can also, in principle, obtain any other thermodynamic property that’s related to the Gibbs energy.
The most important difference between other computational techniques used in Material Science and CALPHAD is that it is very simple and one doesn’t require very powerful computing resources. This is because it relies on classical thermodynamics and minimisation. In techniques that use quantum mechanics like the Density Functional Theory discussed previously, the time required for calculations in higher order systems scales up very quickly. CALPHAD can handle such complexities fairly well and even multi-component systems up to twenty elements can be worked on using a simple laptop. This advantageous position occupied by CALPHAD in modelling of materials becomes instrumental in stringing different order systems together. One can model the lower-order systems using other techniques, and take those inputs to develop the necessary Gibbs functions for higher order systems using CALPHAD and proceed to calculations of such systems. Because of the opportunities to do more than one type of computation, CALPHAD, apart from being useful, is an interesting domain to pursue too.
What lies ahead
CALPHAD has grown into big community worldwide and every year a conference (called “CALPHAD”), brings people who work in the field together. During the early years of Computational Thermodynamics, there were new codes that were written to perform the required calculations. Some of the codes that started out as opensource, soon became commercial and now there are softwares like Thermo-Calc and Pandat, and Open Calphad is an open source distribution. The software provide holistic environments to use the CALPHAD approach. Their usage is growing in the industry as well and most people have now realised that computation along with careful experimentation can bring down the time to develop new materials for applications. There are no other groups in India that’s working extensively on Computational Thermodynamics. This makes Professor Hari Kumar’s group unique.
One of the key contributors to thermodynamics, Lord William Thomson, known better by the name Lord Kelvin, said in 1900, “There is nothing new to be discovered in physics now. All that remains is more and more precise measurement.” Nearly all the physics we now know to be right was discovered after 1900. Thermodynamics is an exception and it has stood the test of time. But from what we’ve seen so far about the work in Professor Hari Kumar’s group, thermodynamics has become more powerful by adapting to improving technology. Thermodynamics, the old dog, has learnt new tricks.
R Mythreyi (Author) Mythreyi is a third-year undergraduate student in the Department of Metallurgical and Materials Engineering. Being the kind of person who spends more time researching productivity than being productive, her compelling love for books and music has recently taken her on an exploration of cognitive psychology, rationality, the brain and classical music. She finds it thrilling to try and unearth correlations between many different things that capture her enthusiasm. Oftentimes, she finds energy through writing twisted and complicated sentences. She hopes to pursue research in Computational Materials Engineering.
Dr. K. C. Hari Kumar is a Professor in the Department of Metallurgical and Materials Engineering at IIT Madras. He is an Associate Editor of Calphad (an Elsevier journal) and a Key Reader of Metallurgical & Materials Transactions A (a Springer Journal). His research interests are Gibbs Energy Modelling of Materials, Applications of Density Functional Theory in Materials Science, Modelling of Diffusion Controlled Phase Transformations and Applications of Thermodynamics in Process Metallurgy.
Prof. Hari Kumar and his Research Group


