TEXAS LANDOWNER SURVEY


Texas A&M Natural Resources Institute
April 2023
The Texas A&M Natural Resources Institute has been working alongside landowners for many years. A useful landowner tool within the Institute is Texas Land Trends, a mapping resource program that allows users to explore land and growth patterns across the state. A complementary tool is the Texas Landowner Survey.

Repeated every 5 years, the survey determines landowner needs, preferences, and concerns that serve to improve outreach and programming.
Published by Texas A&M Natural Resources Institute
Authors
Lopez, A , D Barrientos, R Lopez, K L Skow, M Crawford, J Dreibelbis, K B Hays, and B. N. Wegner
Layout Abigail Holmes
Editor Brittany Wegner
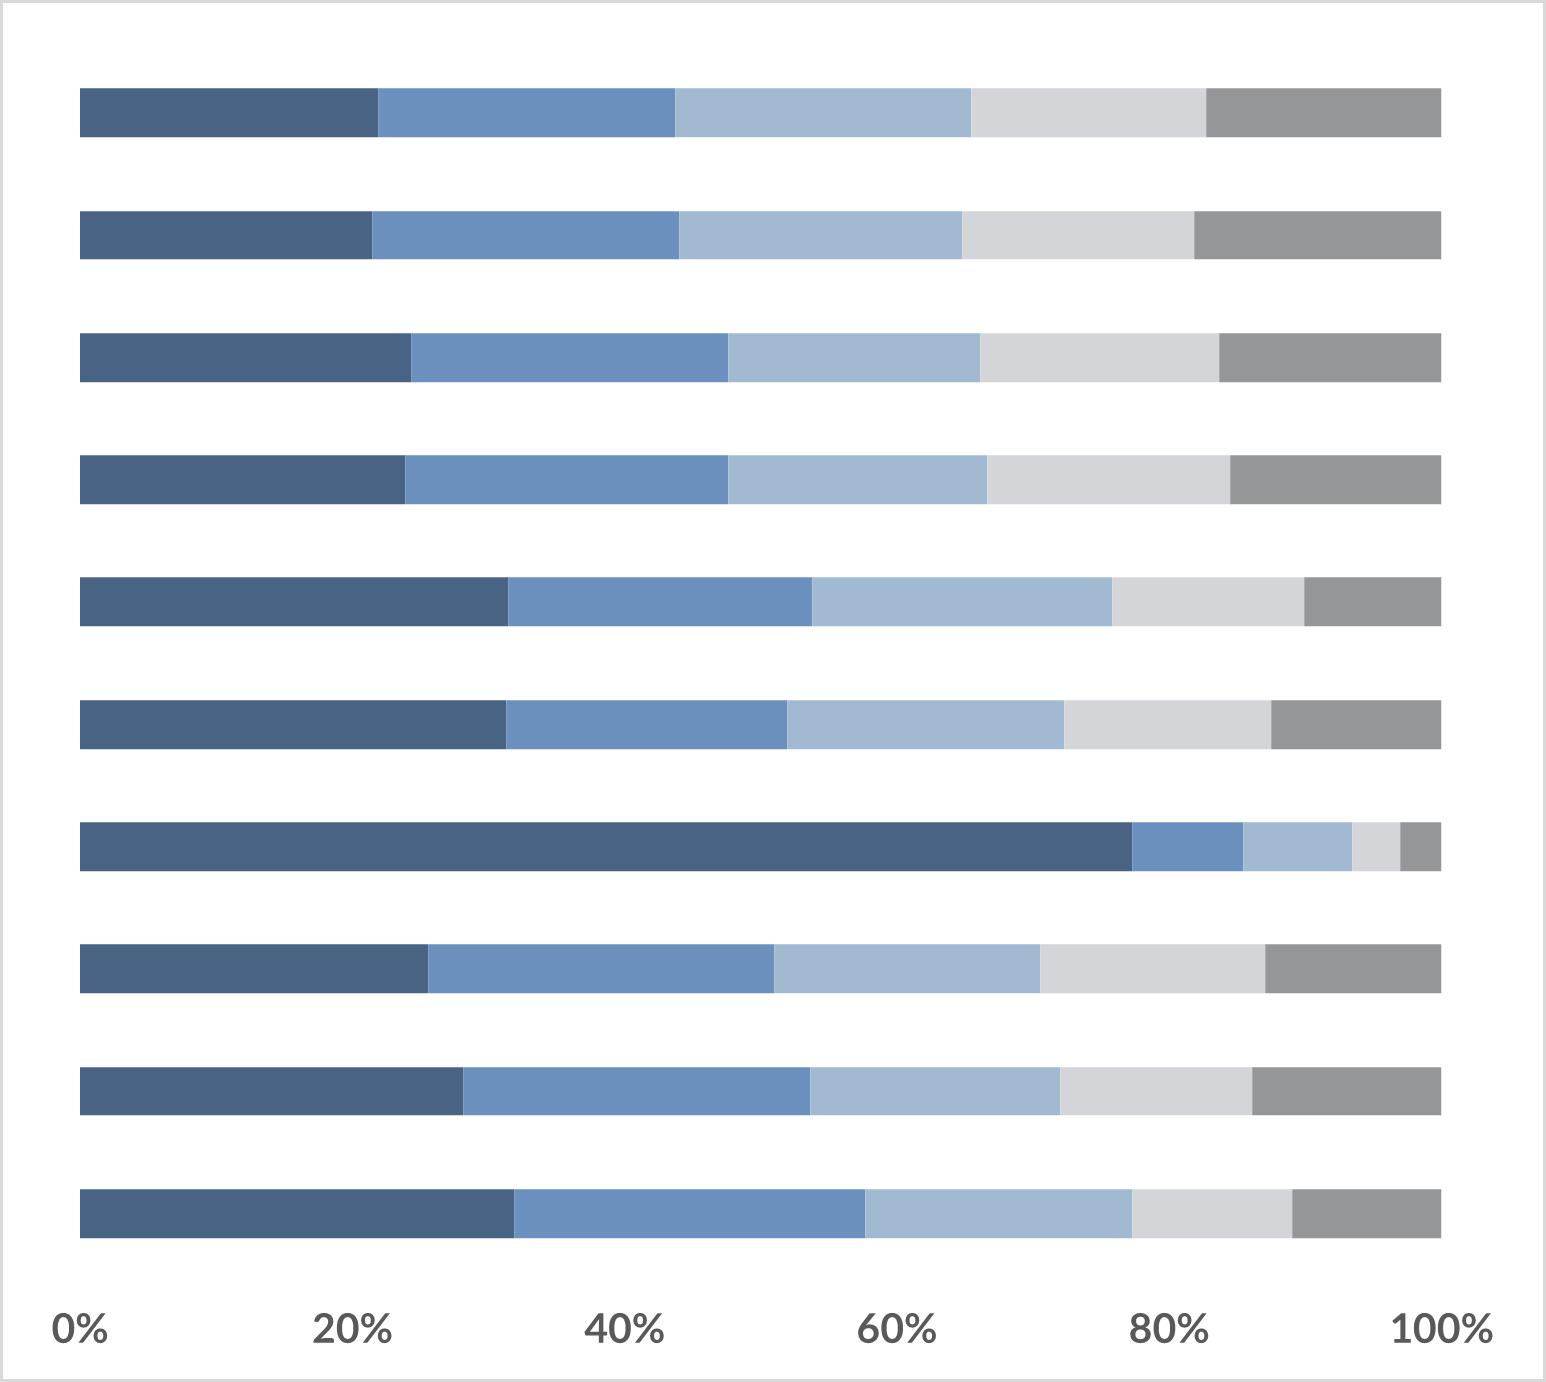
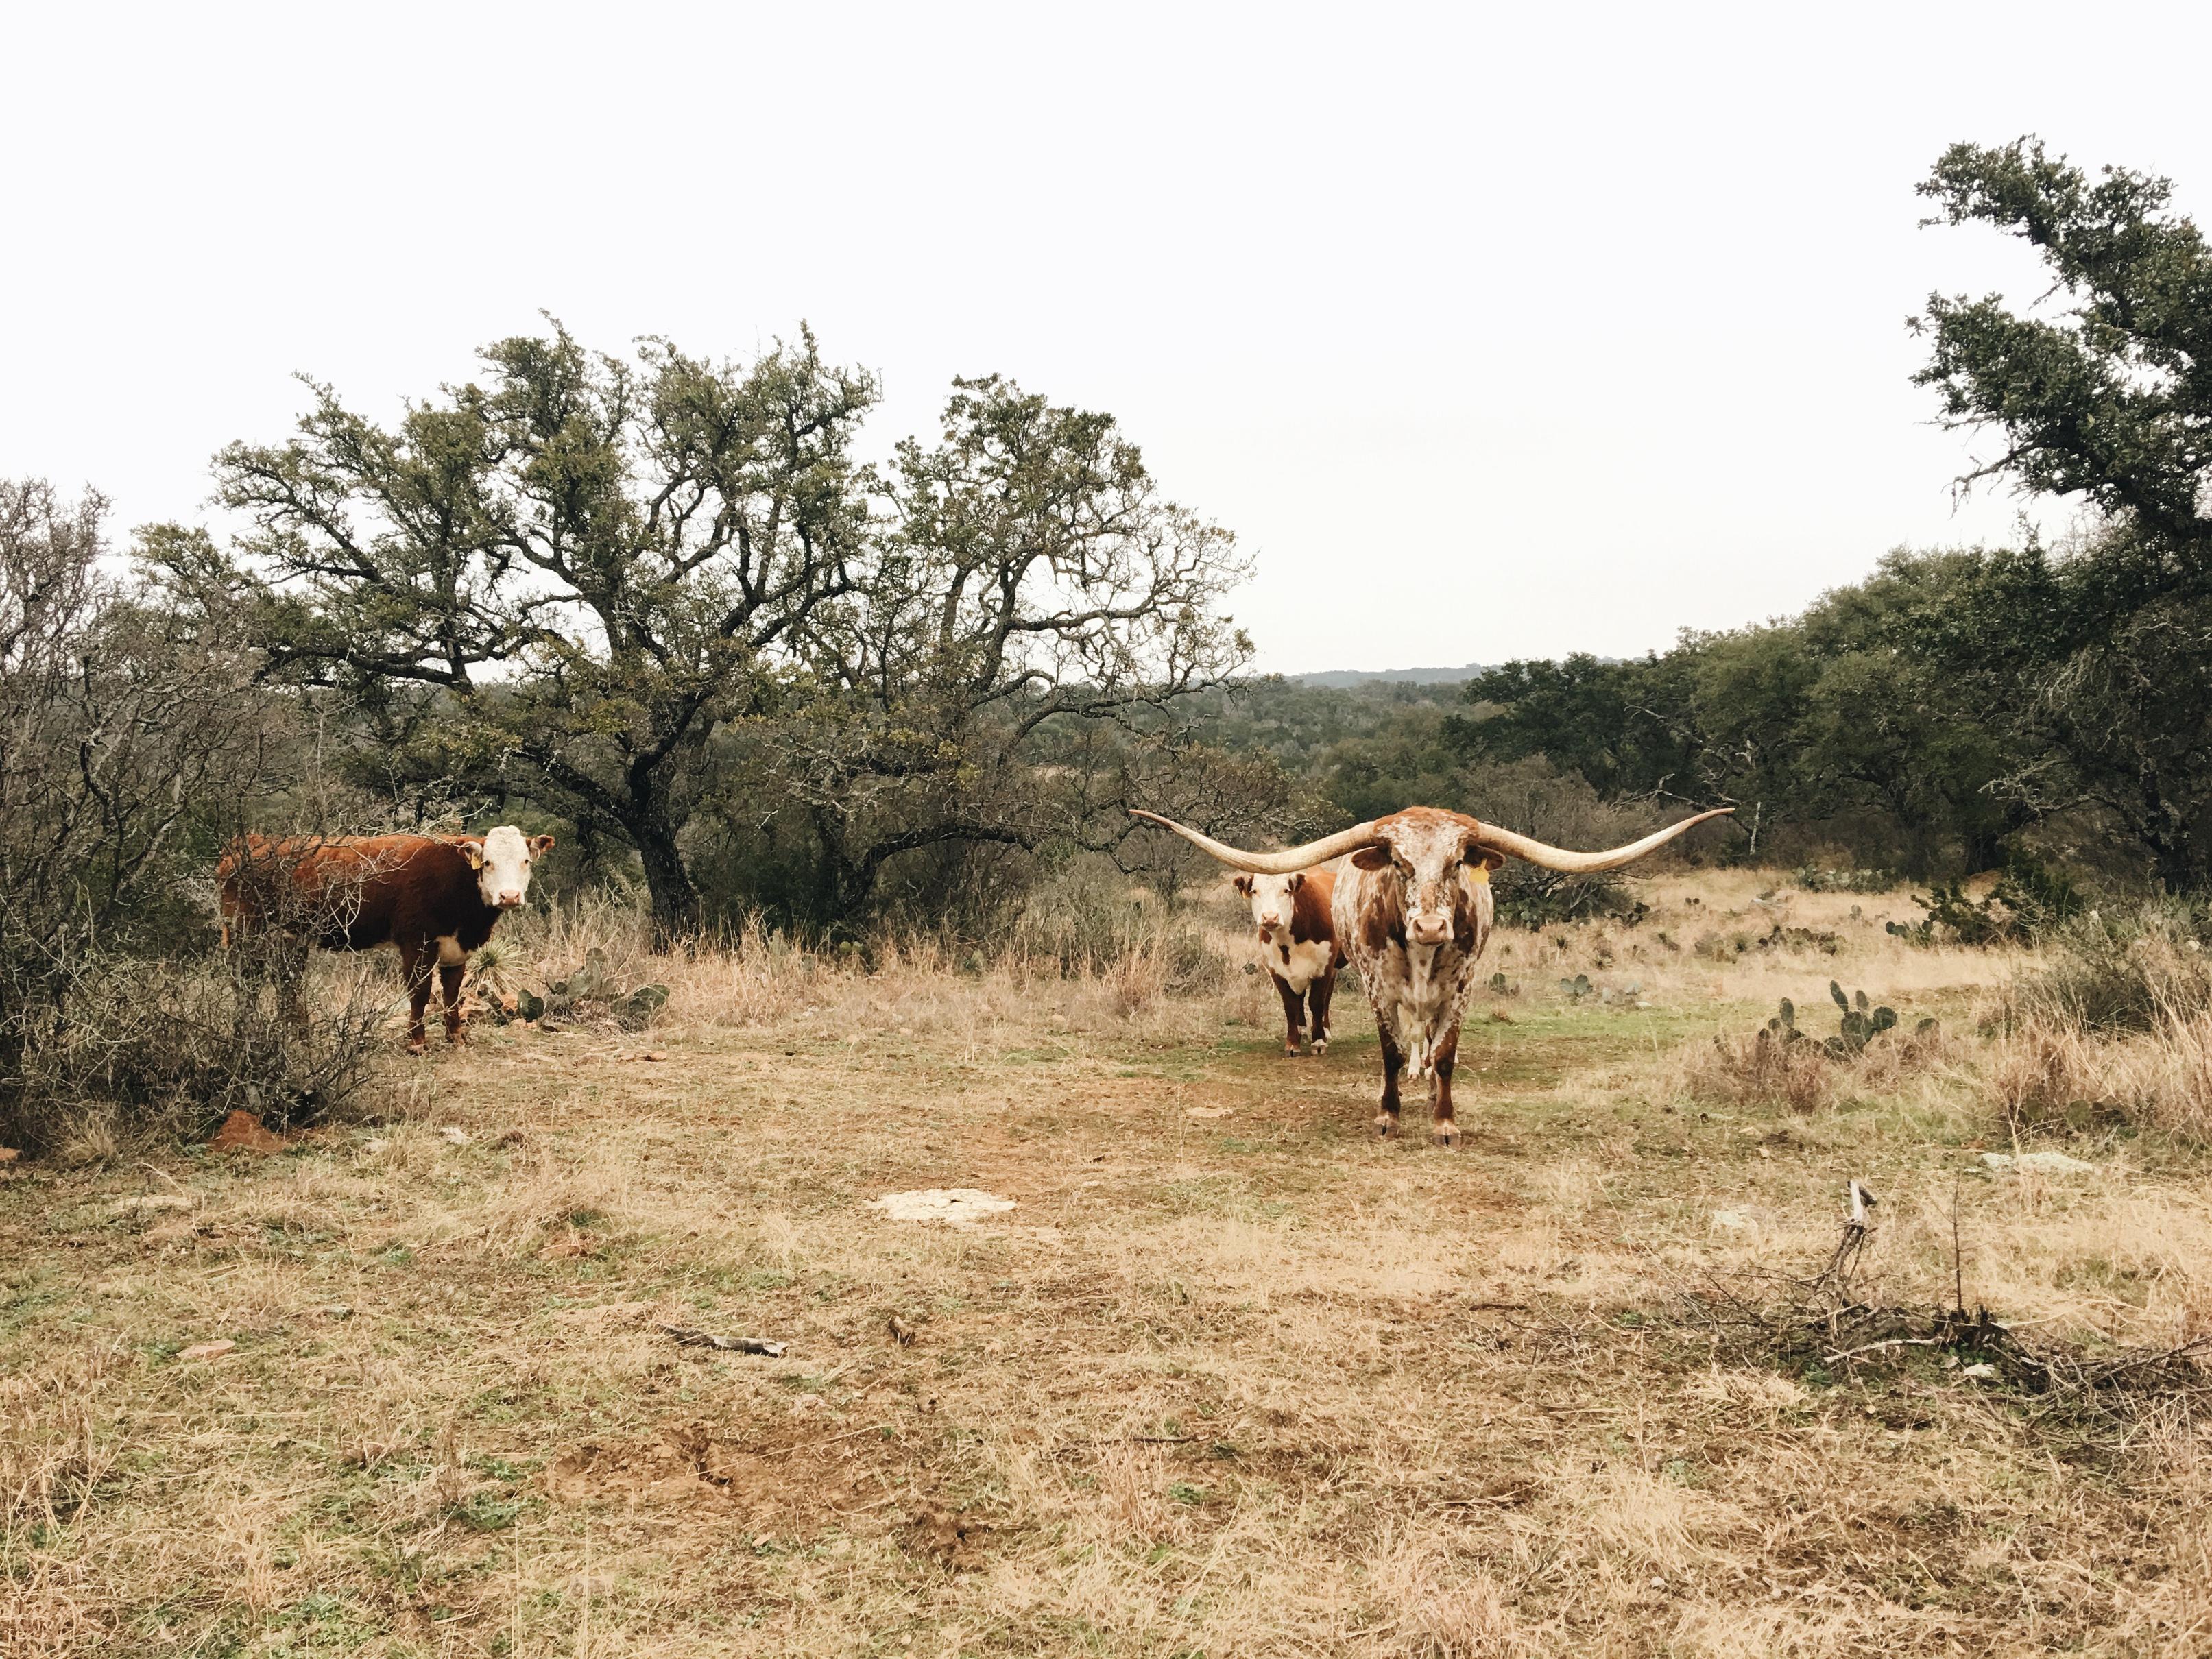
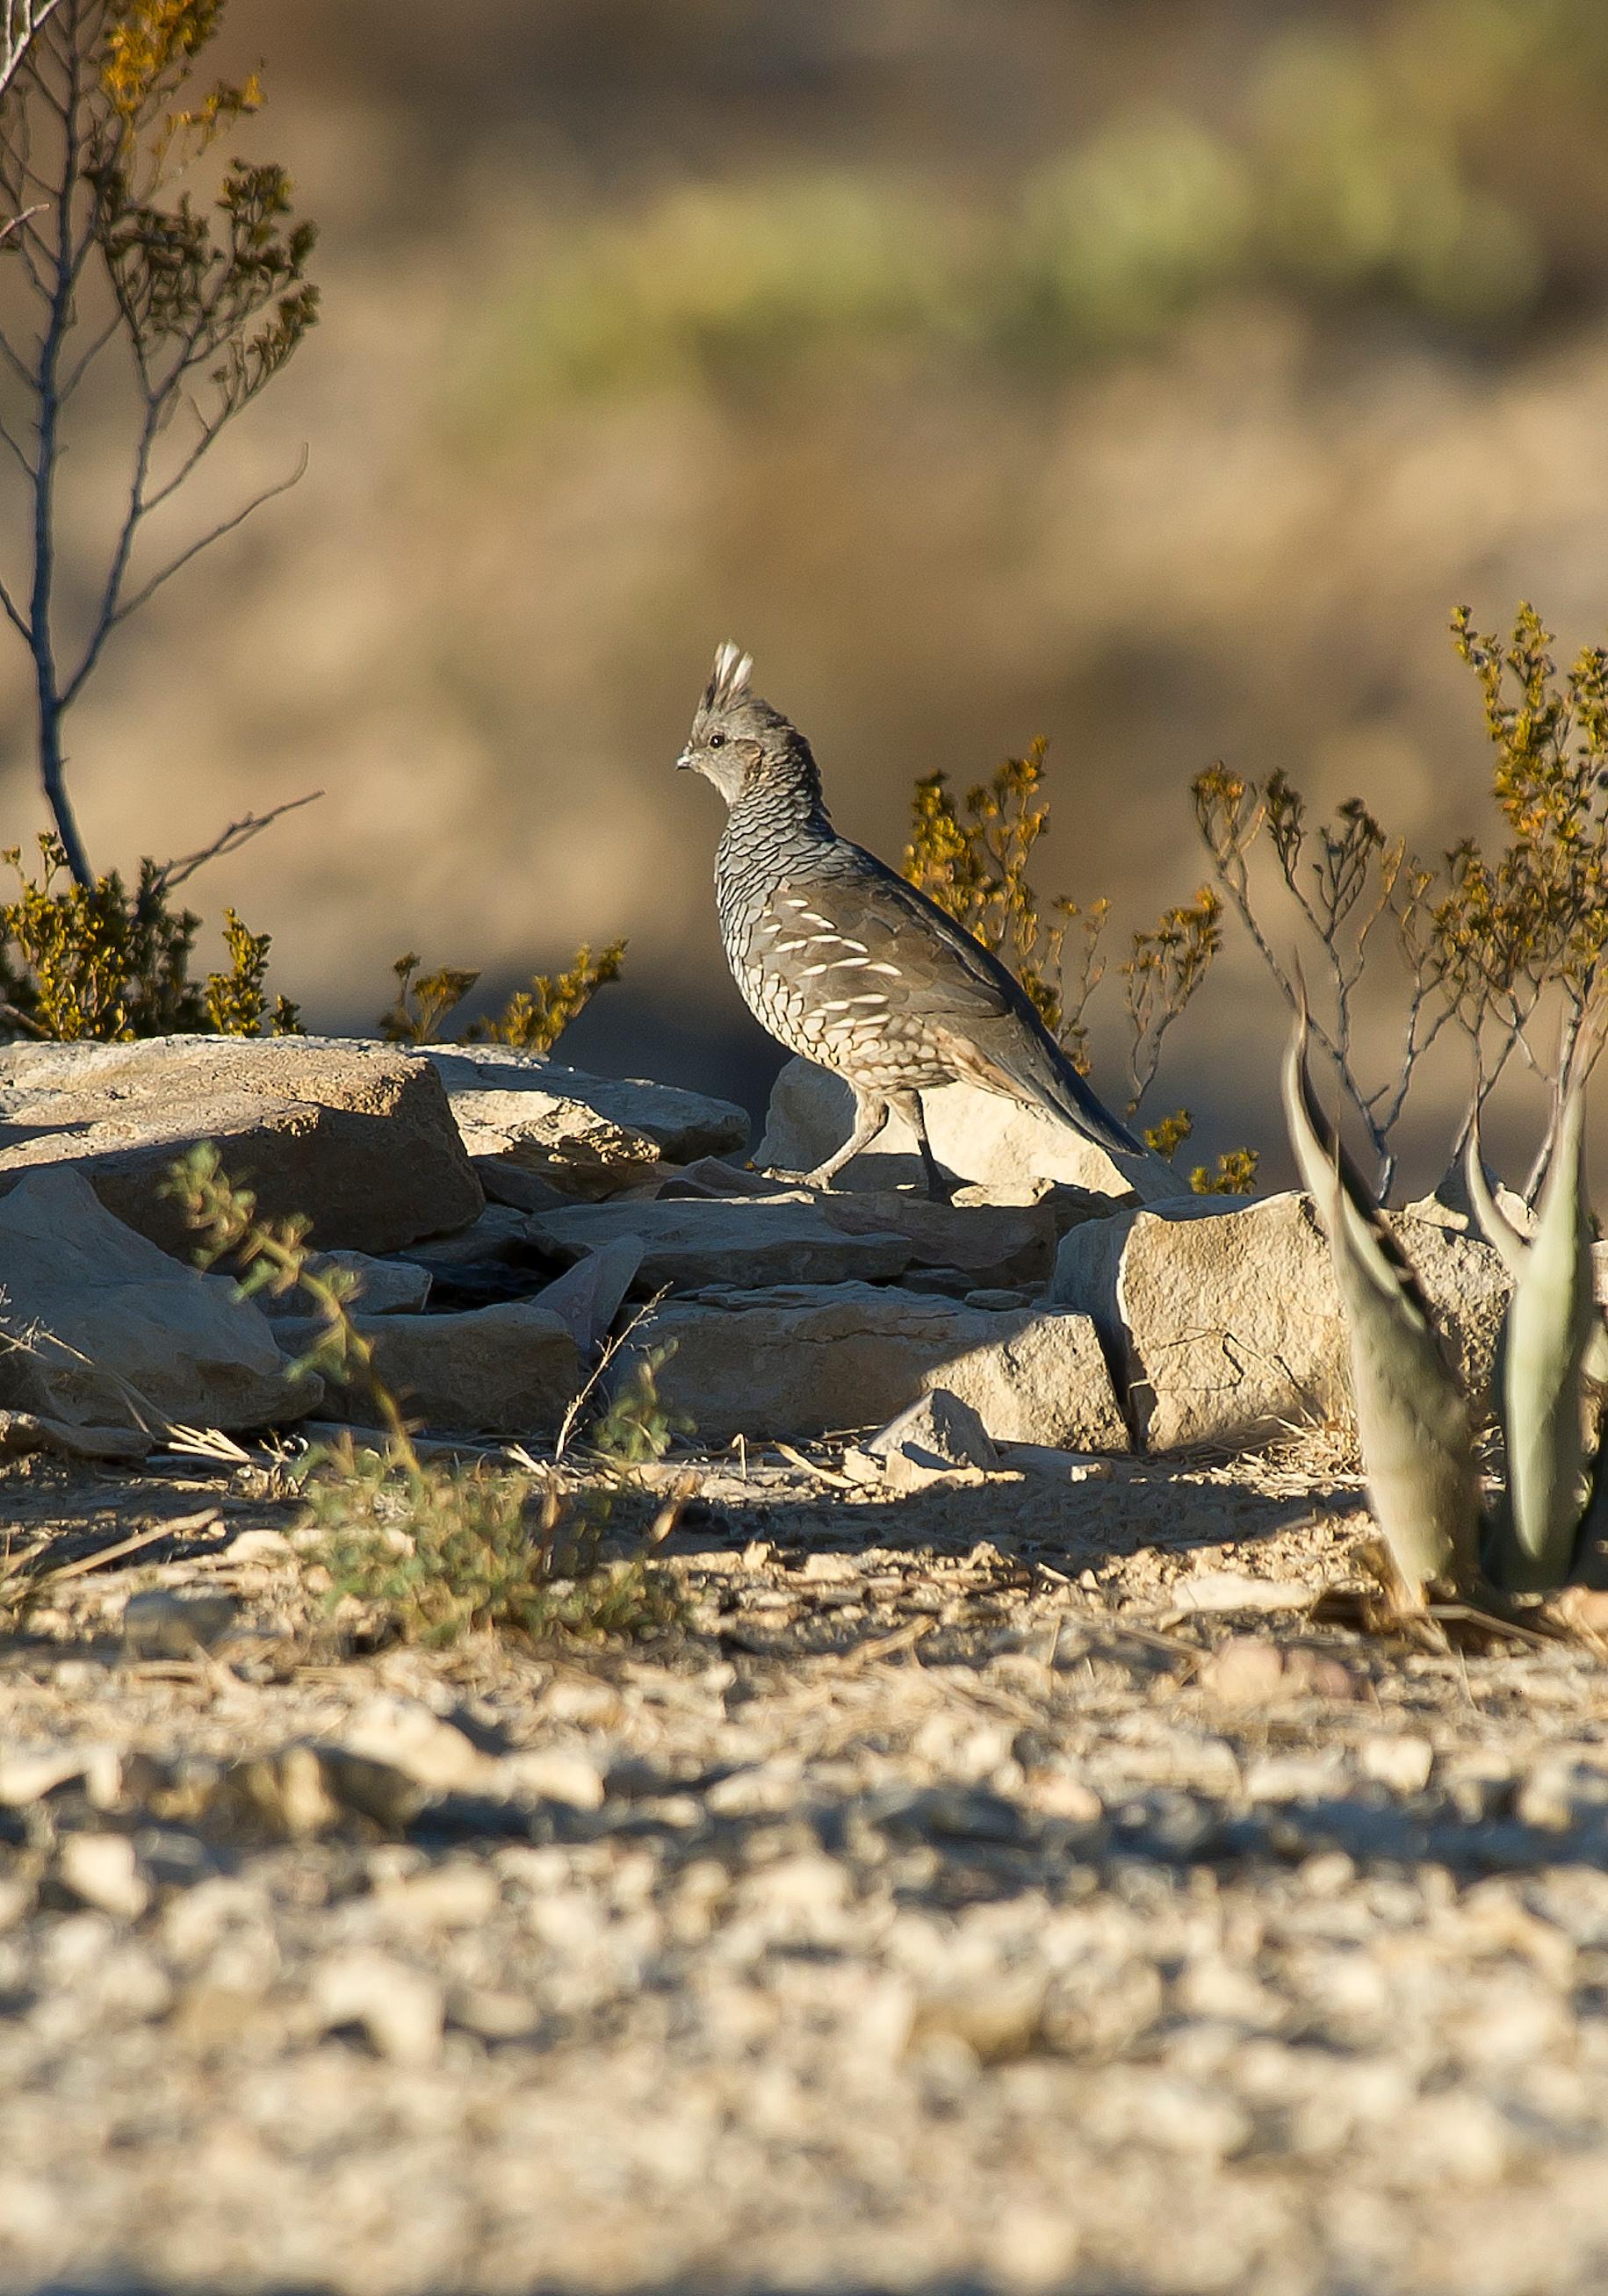
Photos Courtesy of Grace Scalzo, Texas Parks and Wildlife, and Long Acres Ranch


External Reviewers

2017 Survey: Linda Campbell, Dr. Bill Eikenhorst, and Tim Siegmund
2022 Survey: Michael Haynes, Nelda Speller, and Troy Luepke
Citation
Lopez, A., D. Barrientos, R. Lopez, K. L Skow, M Crawford, J Dreibelbis, K B Hays, and B N Wegner 2023
Texas Landowner Survey. Texas A&M Natural Resources Institute.
In collaboration with
1 | Texas Land Trends
txlandtrends org
OVERVIEW
Owners of private working lands in Texas are among the most productive stewards of farms, ranches, and forests in the country.
Their land management decisions influence wildlife habitat, create many year-round opportunities, and support economy-driving industries, such as agriculture and the energy sector. Since private rural working lands comprise the majority of open space in Texas (83%), private rural landowner stewardship determines the condition of the land and the resulting public and private benefits derived from their agricultural and natural resource practices. Landowners are an integral part of ecosystem service benefits, and understanding their needs translates to improved programming and stewardship practices. Supporting the stewardship of working lands makes business sense because it helps conserve the state’s economy.

txlandtrends org 2 | Texas Land Trends
ABOUT THE SURVEY
The Texas Landowner Survey is a state-wide project by the Texas A&M Natural Resources Institute (NRI). It is a collaborative effort by NRI, Texas Parks and Wildlife Department, and agricultural and natural resource professionals. The voluntary, confidential and anonymous survey helps better understand rural landowners, their land management objectives, challenges, concerns and preferences to ultimately support programming.
The survey is conducted every 5 years and consisted of 34 questions in 2017 and 45 questions in 2022, covering four topic areas: land management preferences, landowner concerns and challenges, land loss and general landowner information
Texas private landowners who steward rural working lands volunteered their time and offered candid responses across both survey years (2017 and 2022, n=5000+) We are grateful to the landowners who participated in our survey and to everyone who made this survey possible.
This report provides an overview of general survey responses to aid conservation organizations, natural resource agencies and policy makers in conserving working lands across Texas through better landowner engagement The report also draws from USDA-NASS data to allow for comparison and validation of survey responses and to provide an overview of Texas' owners of rural, private working lands. Understanding who we serve is vital to developing meaningful programs. In this report, the term “landowner” refers specifically to owners of private, rural, working lands (e.g., ag valued lands, 1-d, and 1-d-1) in Texas.

3 | Texas Land Trends txlandtrends org
WHO RESPONDED TO THE SURVEY?
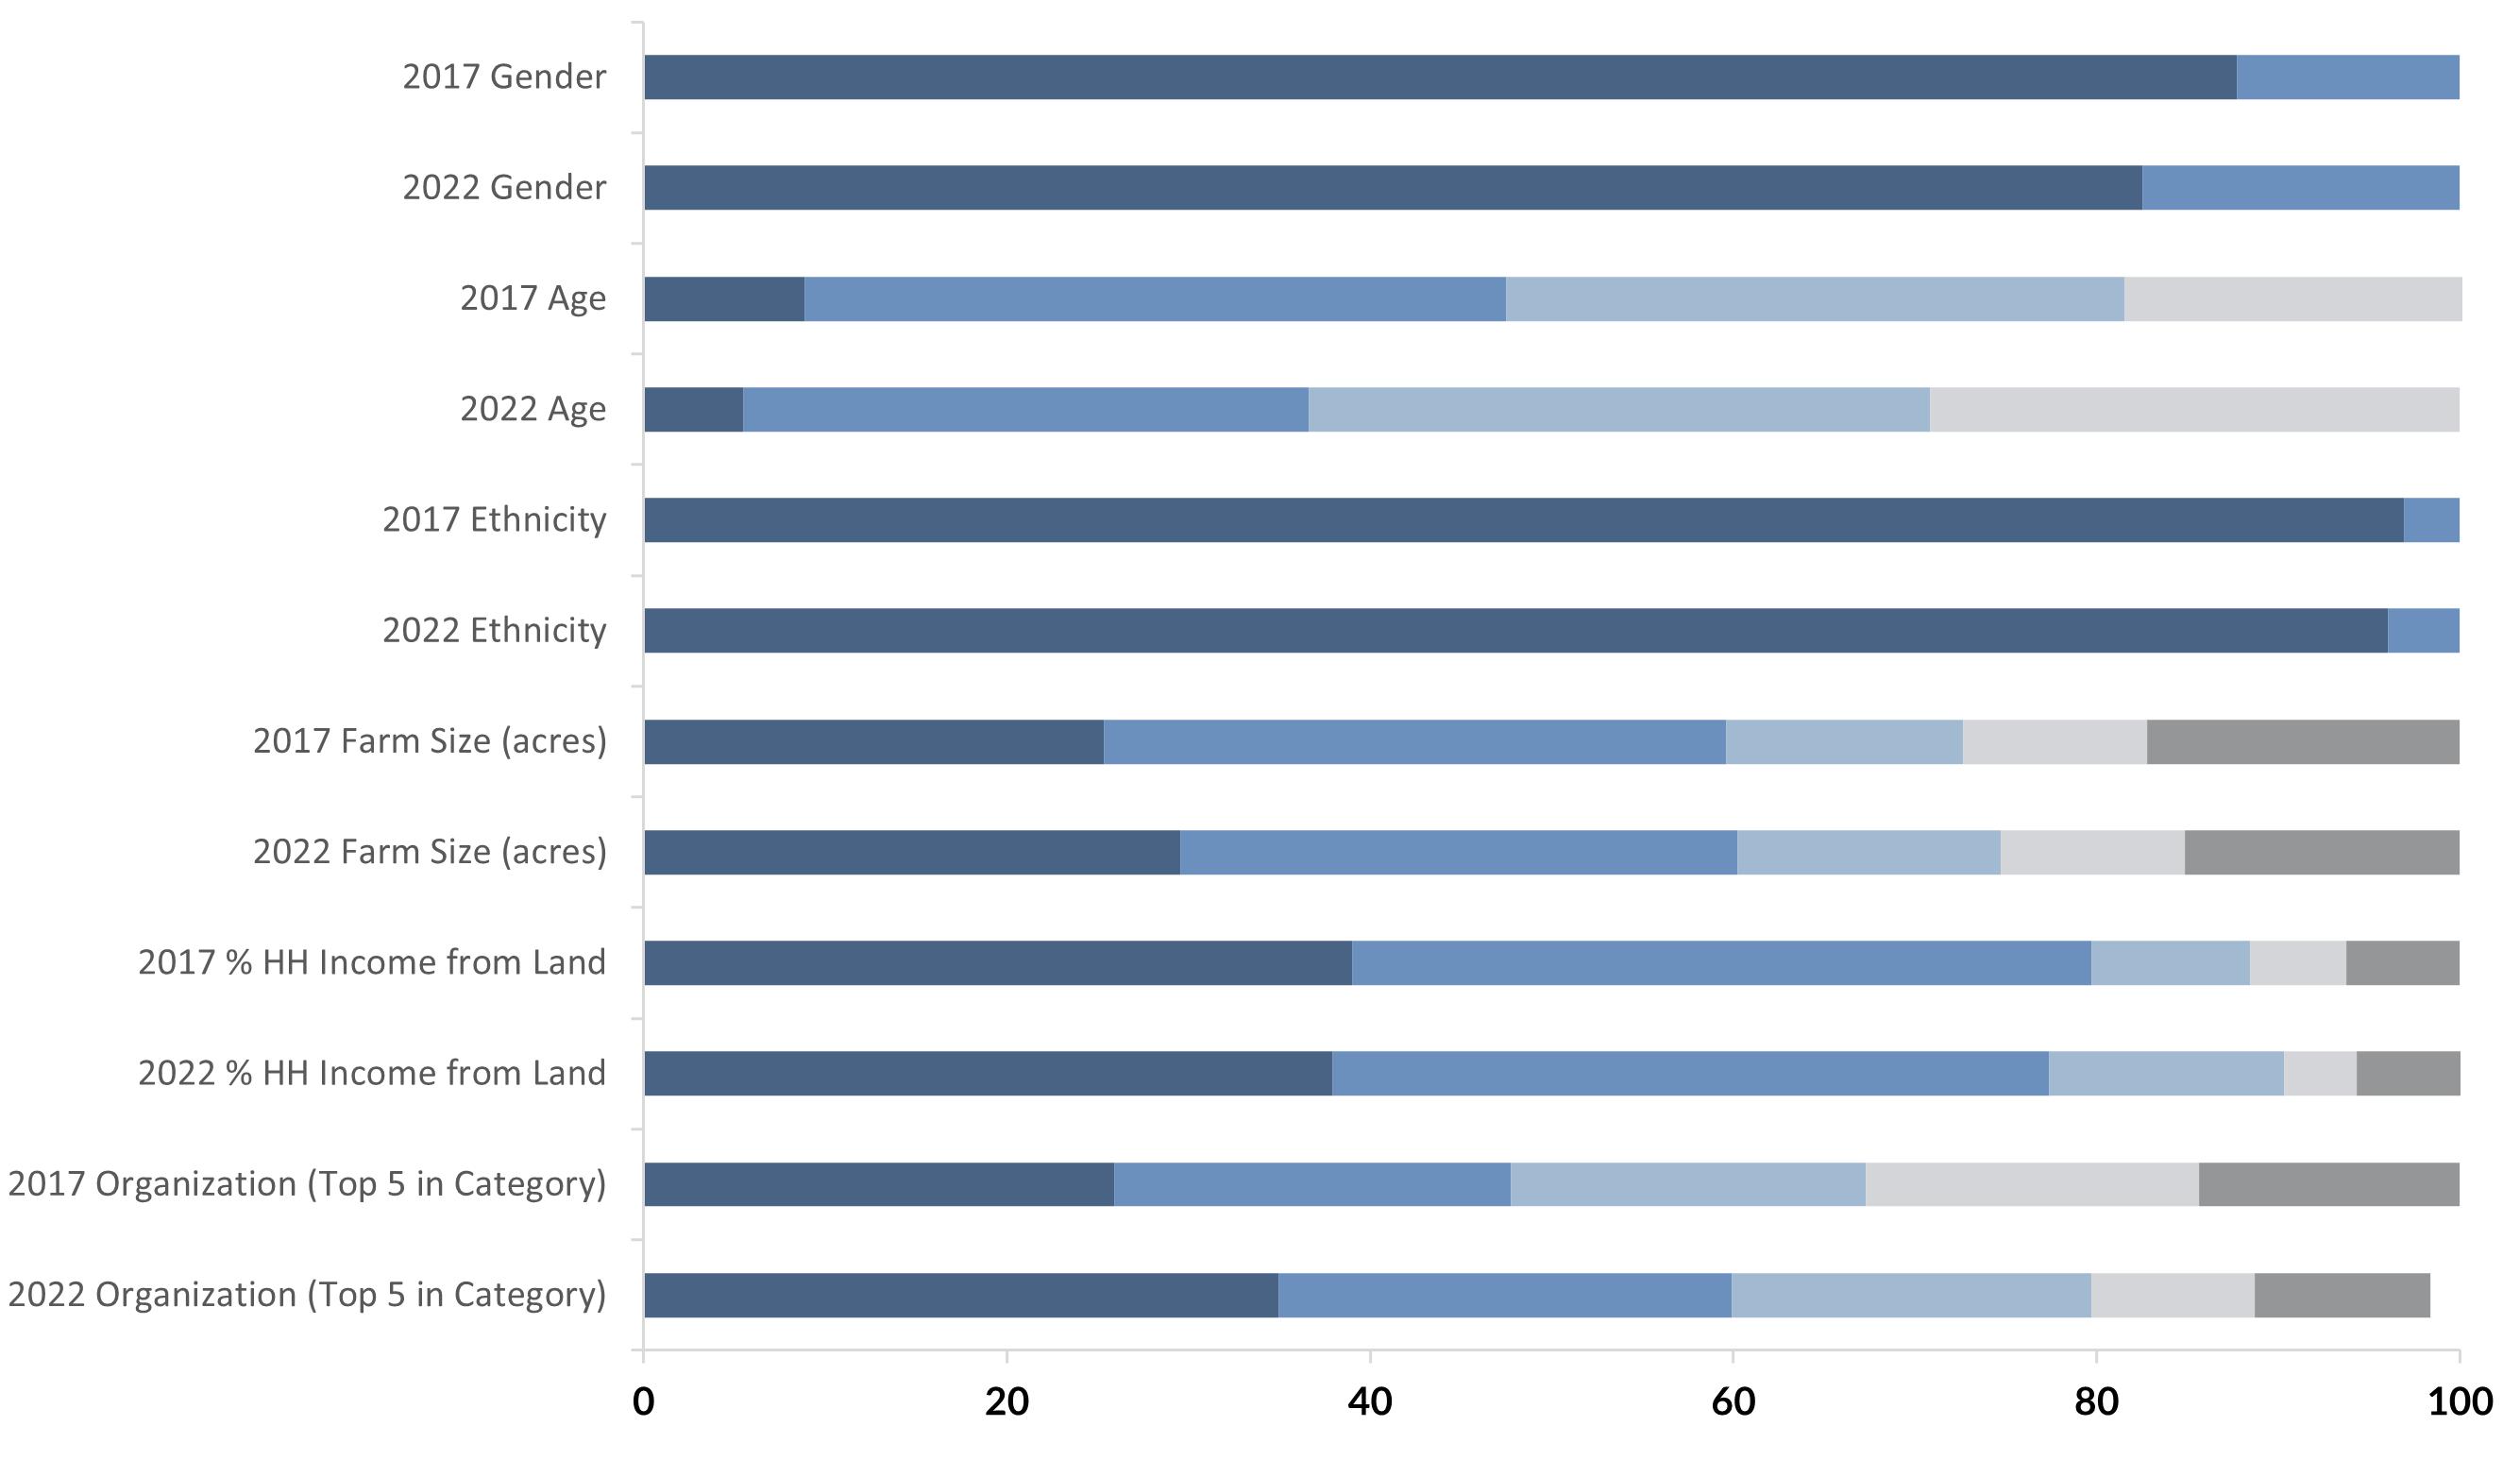
Landowner operations in Texas are diverse and the survey captured their varied characteristics (Figure 1). Operations varied by size, where approximately 60% of respondents owned <500 acres, 15% owned between 500-1000 acres, and approximately 25% owned >1000 acres. Across both survey years, most rural landowners were non-Hispanic White (96%), male, and between the ages of 4080 years. Some were in their early 20s and others were in their early 80s and 90s.
Each landowner operation had unique needs and objectives, thus, it was common for landowners to participate in professional organizations based on their operation type and interest (Figure 1). The income derived from their operations also varied across survey years (Figure 2). In 2022, landowner operations appear to derive less income compared to 2017. In both survey years, 38% (2022) and 39% (2017) of landowners indicated they did
not derive any income from their largest property. In 2017, approximately 41% derived less than 25% of their annual income from their largest property, compared to 52% in 2022, where they earned less than 30%. For those that did derive income from their land, 20% (2017) earned greater than 25% annually from their largest property, with 6% of this group earning greater than 65% from their lands.
In 2022, there was a slight decrease in earnings, where 10% of landowners earned greater than 30% annually from their largest property and only 6% of this group earned greater than 51%. Collectively, 90% of respondents earned less than 30% of their income from their lands in 2022, compared to 80% earning less than 20% in 2017. This trend towards lower economic dependence on the land could provide more opportunity for the enhancement of wildlife habitat and our natural resources going forward.

txla nds



txlandtrends org
Figure 1. Surveyed Texas Landowners At-a-Glance, 2017 and 2022.
Gender 5 | Texas Land Trends Household income derived from land 2017 2022 None None <25% 25-44% 45-64% ≥65% <10% 11-30% 31-50% ≥51% 0 20 40 60 80 100
Landowner Respondents (%)
Derived < 25% of Household Income

No Income Properties contributed ≥ 25% of Household Income
Derived < 30% of Household Income
No Income Properties contributed ≥ 30% of Household Income
≥ 500
< 500
2017 ≥ 500
< 500 acres 2022
acres
acres
acres
txlandtrends org 6 | Texas Land Trends
Figure 2. Texas Landowner Survey Income At-a-Glance, 2017 and 2022.
AN OVERVIEW OF TEXAS LANDOWNERS
Based on both Texas Landowner Survey year findings, fewer landowner respondents are deriving income from their lands, particularly within the smaller ownership size classes (i.e., < 500 acres). Collectively, small acreage landowners in Texas make up approximately 85% of the state's total operations.¹ Despite their large number, this group owns approximately 19.5M acres of operations or 16% of the 141M private working land acres in Texas. To compare, over the last 20 years, we converted almost 2.2M working land acres¹, that is almost one-tenth (10%) of all the land operated by small acreage landowners in the state, rendering those lands no longer viable for agriculture or natural resource uses Understanding that maintaining landbased operations is not an easy task, we wanted to compare our survey respondents and their responses to data on the ground that would help us
gain a more comprehensive view of landowners. USDA-NASS data was helpful to providing an overview of Texas landowners.
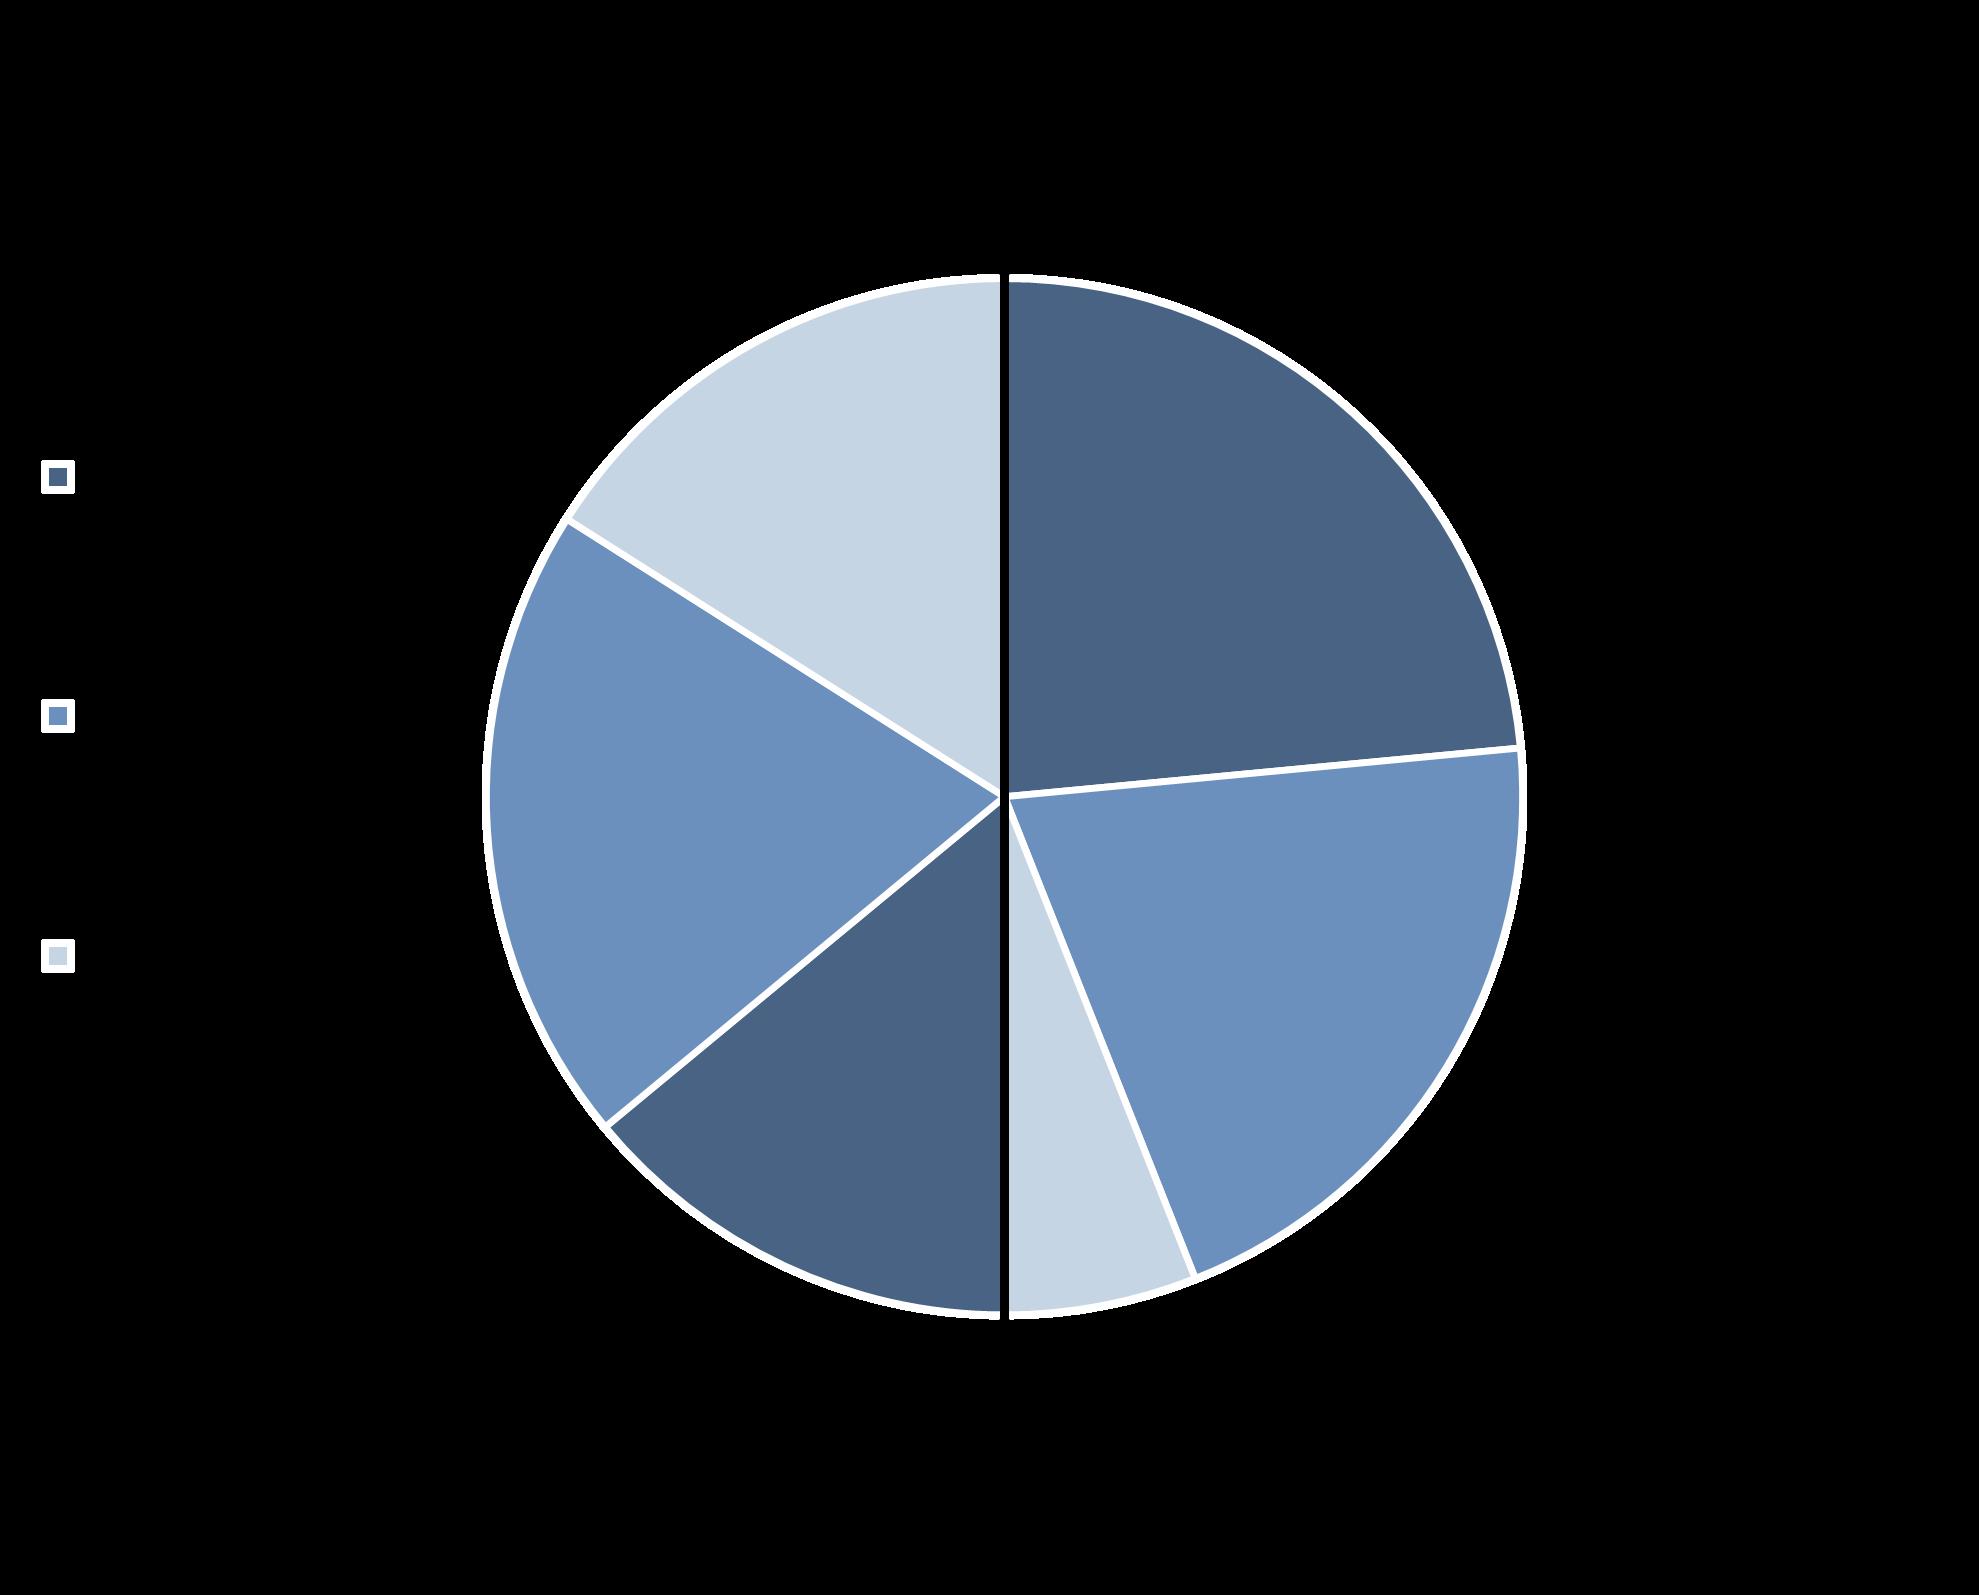
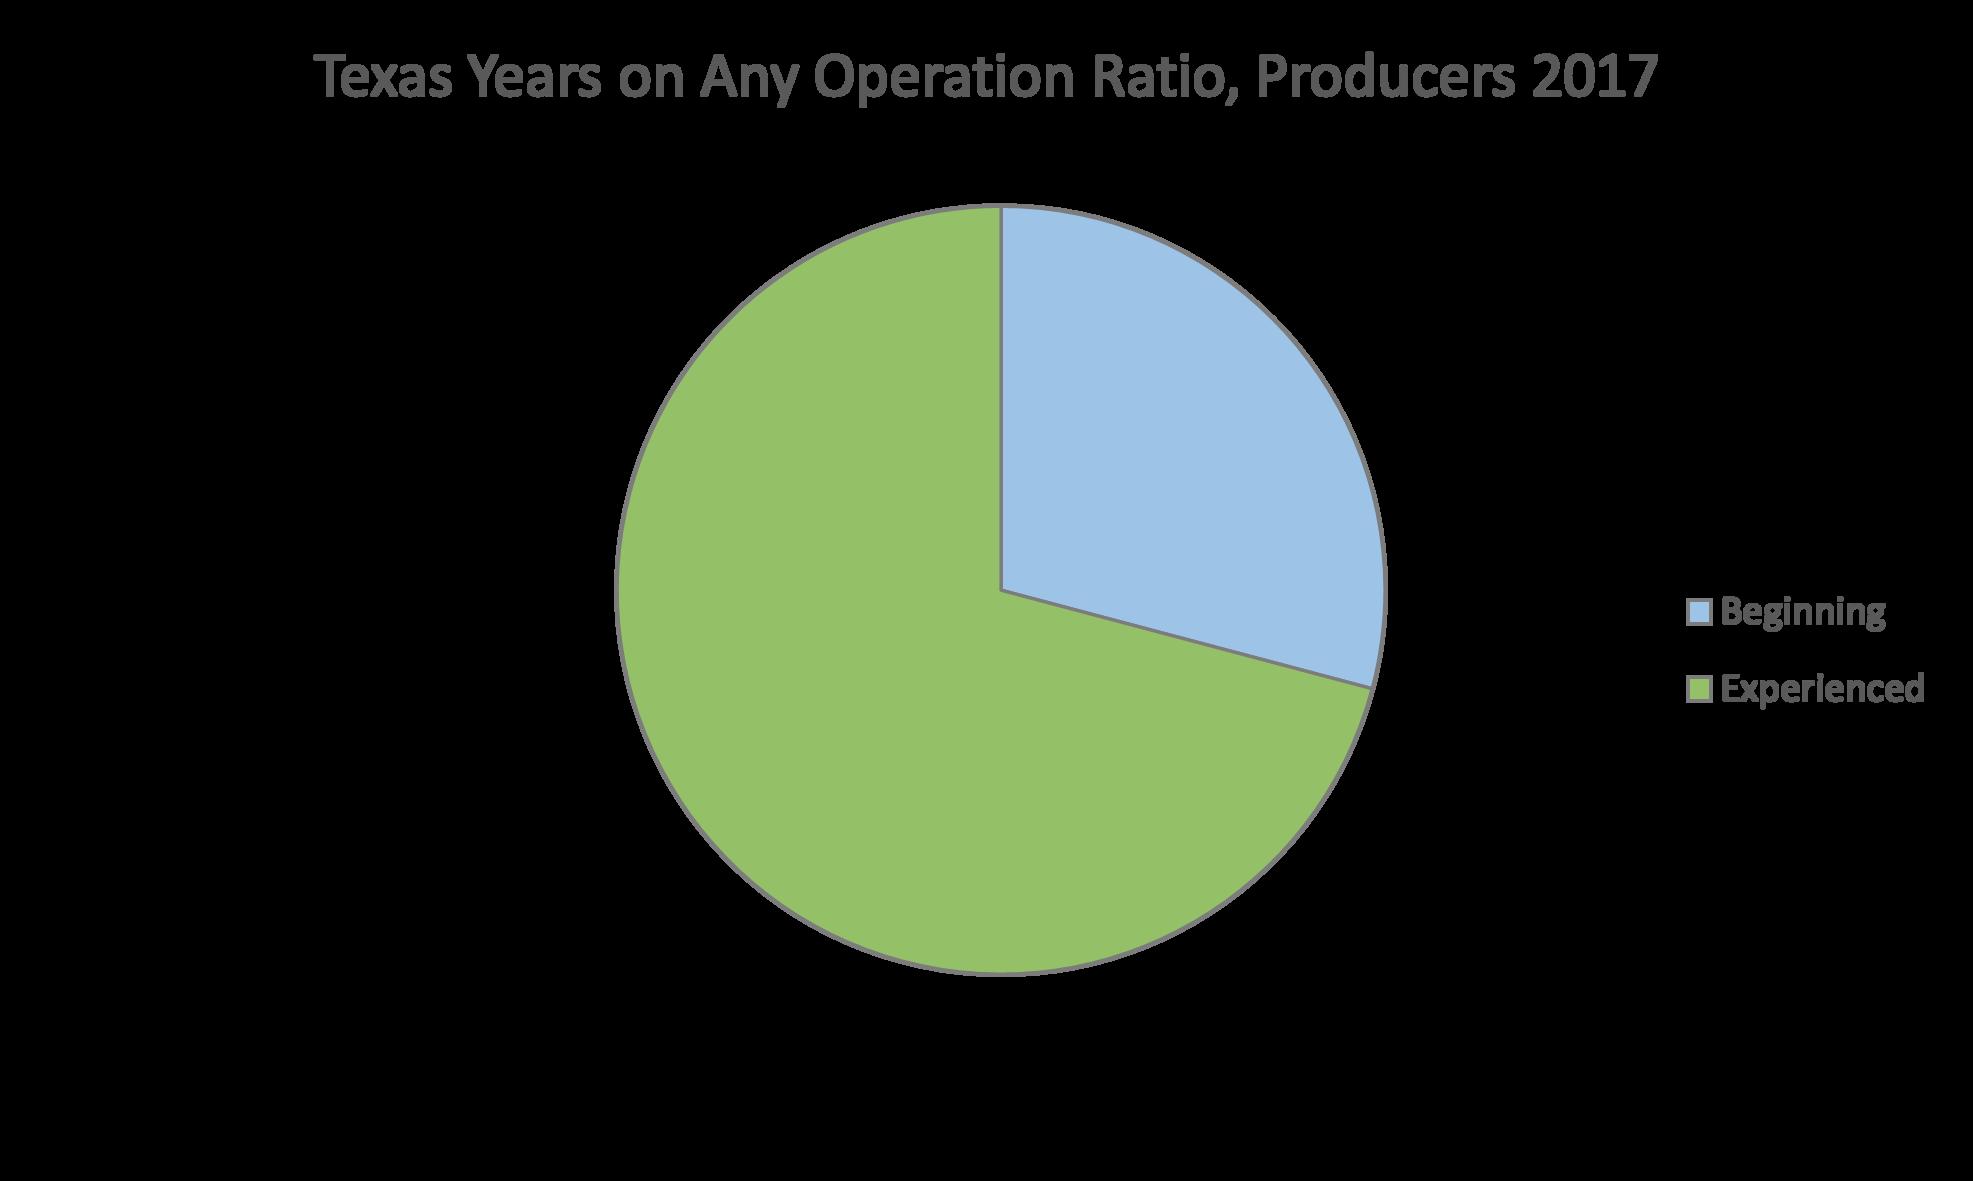
According to the USDA-NASS, in 2017, 38% of all Texas producers, hereafter referred to as landowners, worked exclusively on their operation, 72% had greater than 10 years of experience on their current operation, and 74% had greater than 11 years of experience on any operation.² See Figures 3-12 for an overview of Texas landowners and stewards based on USDA-NASS data.
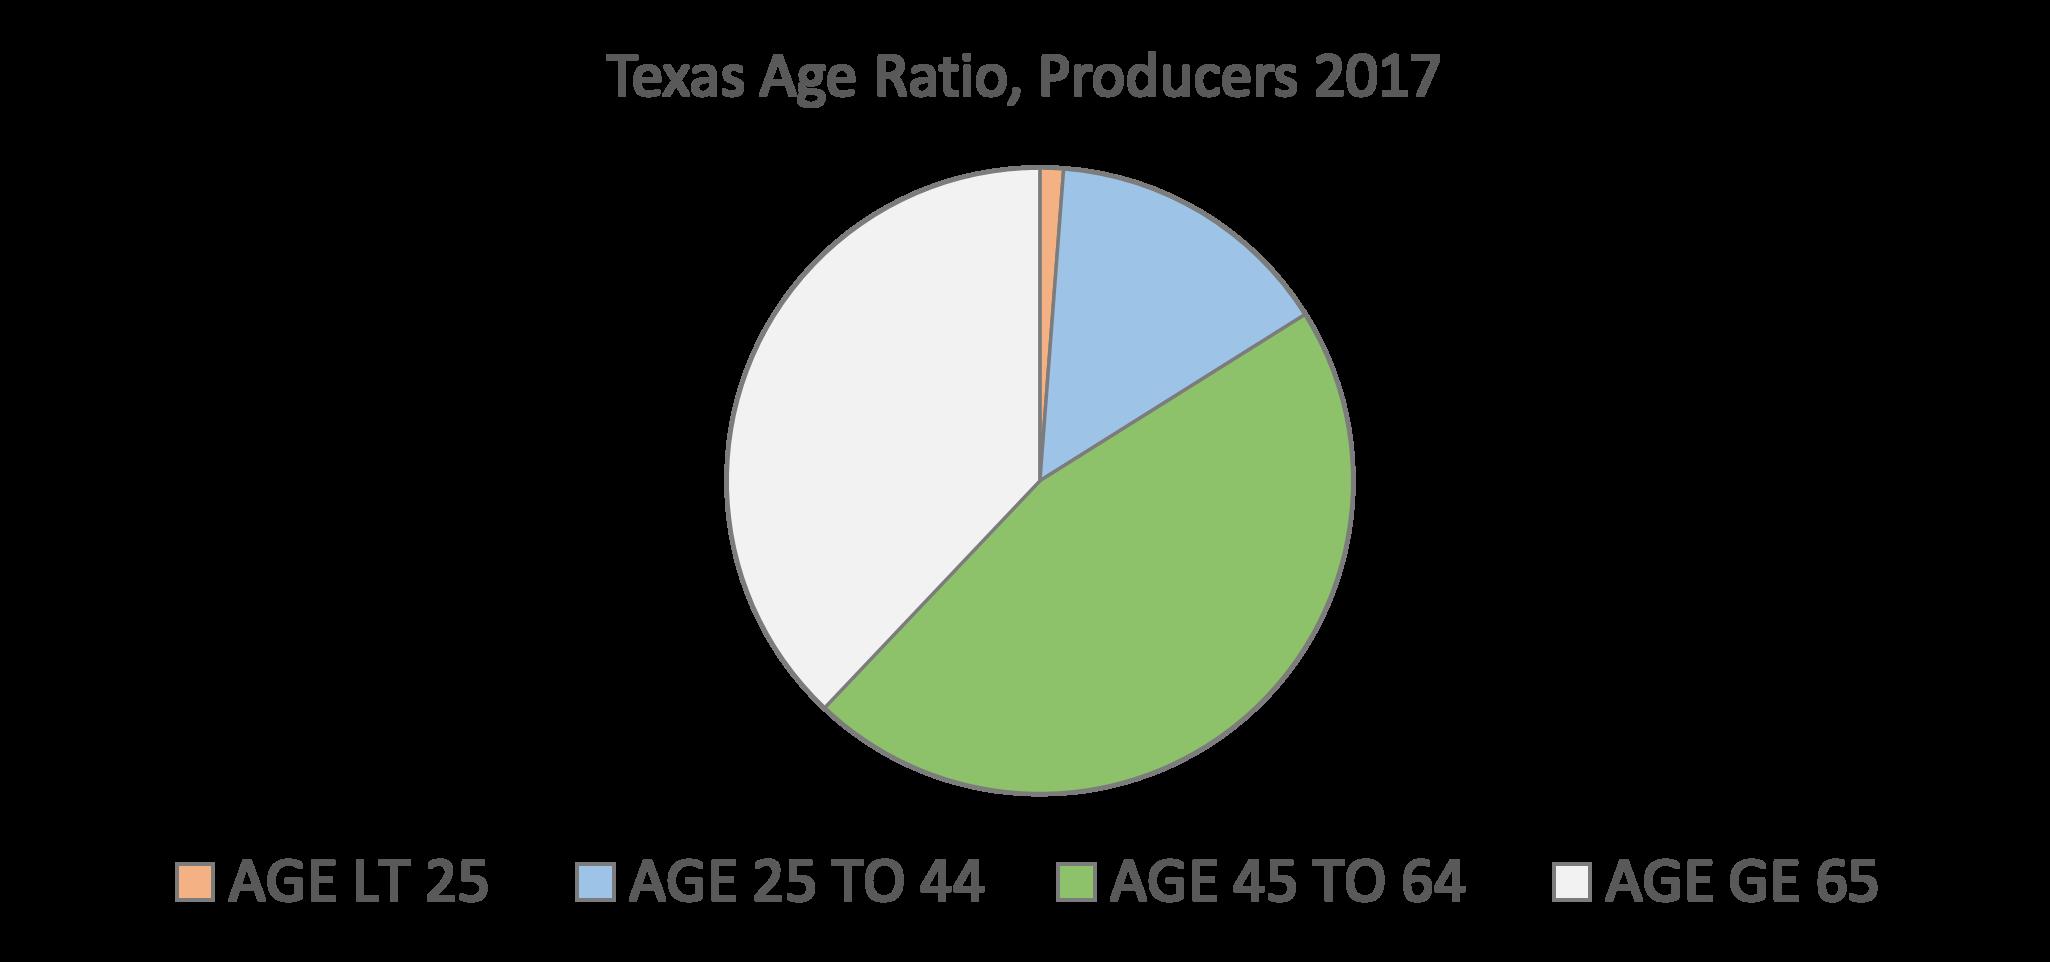
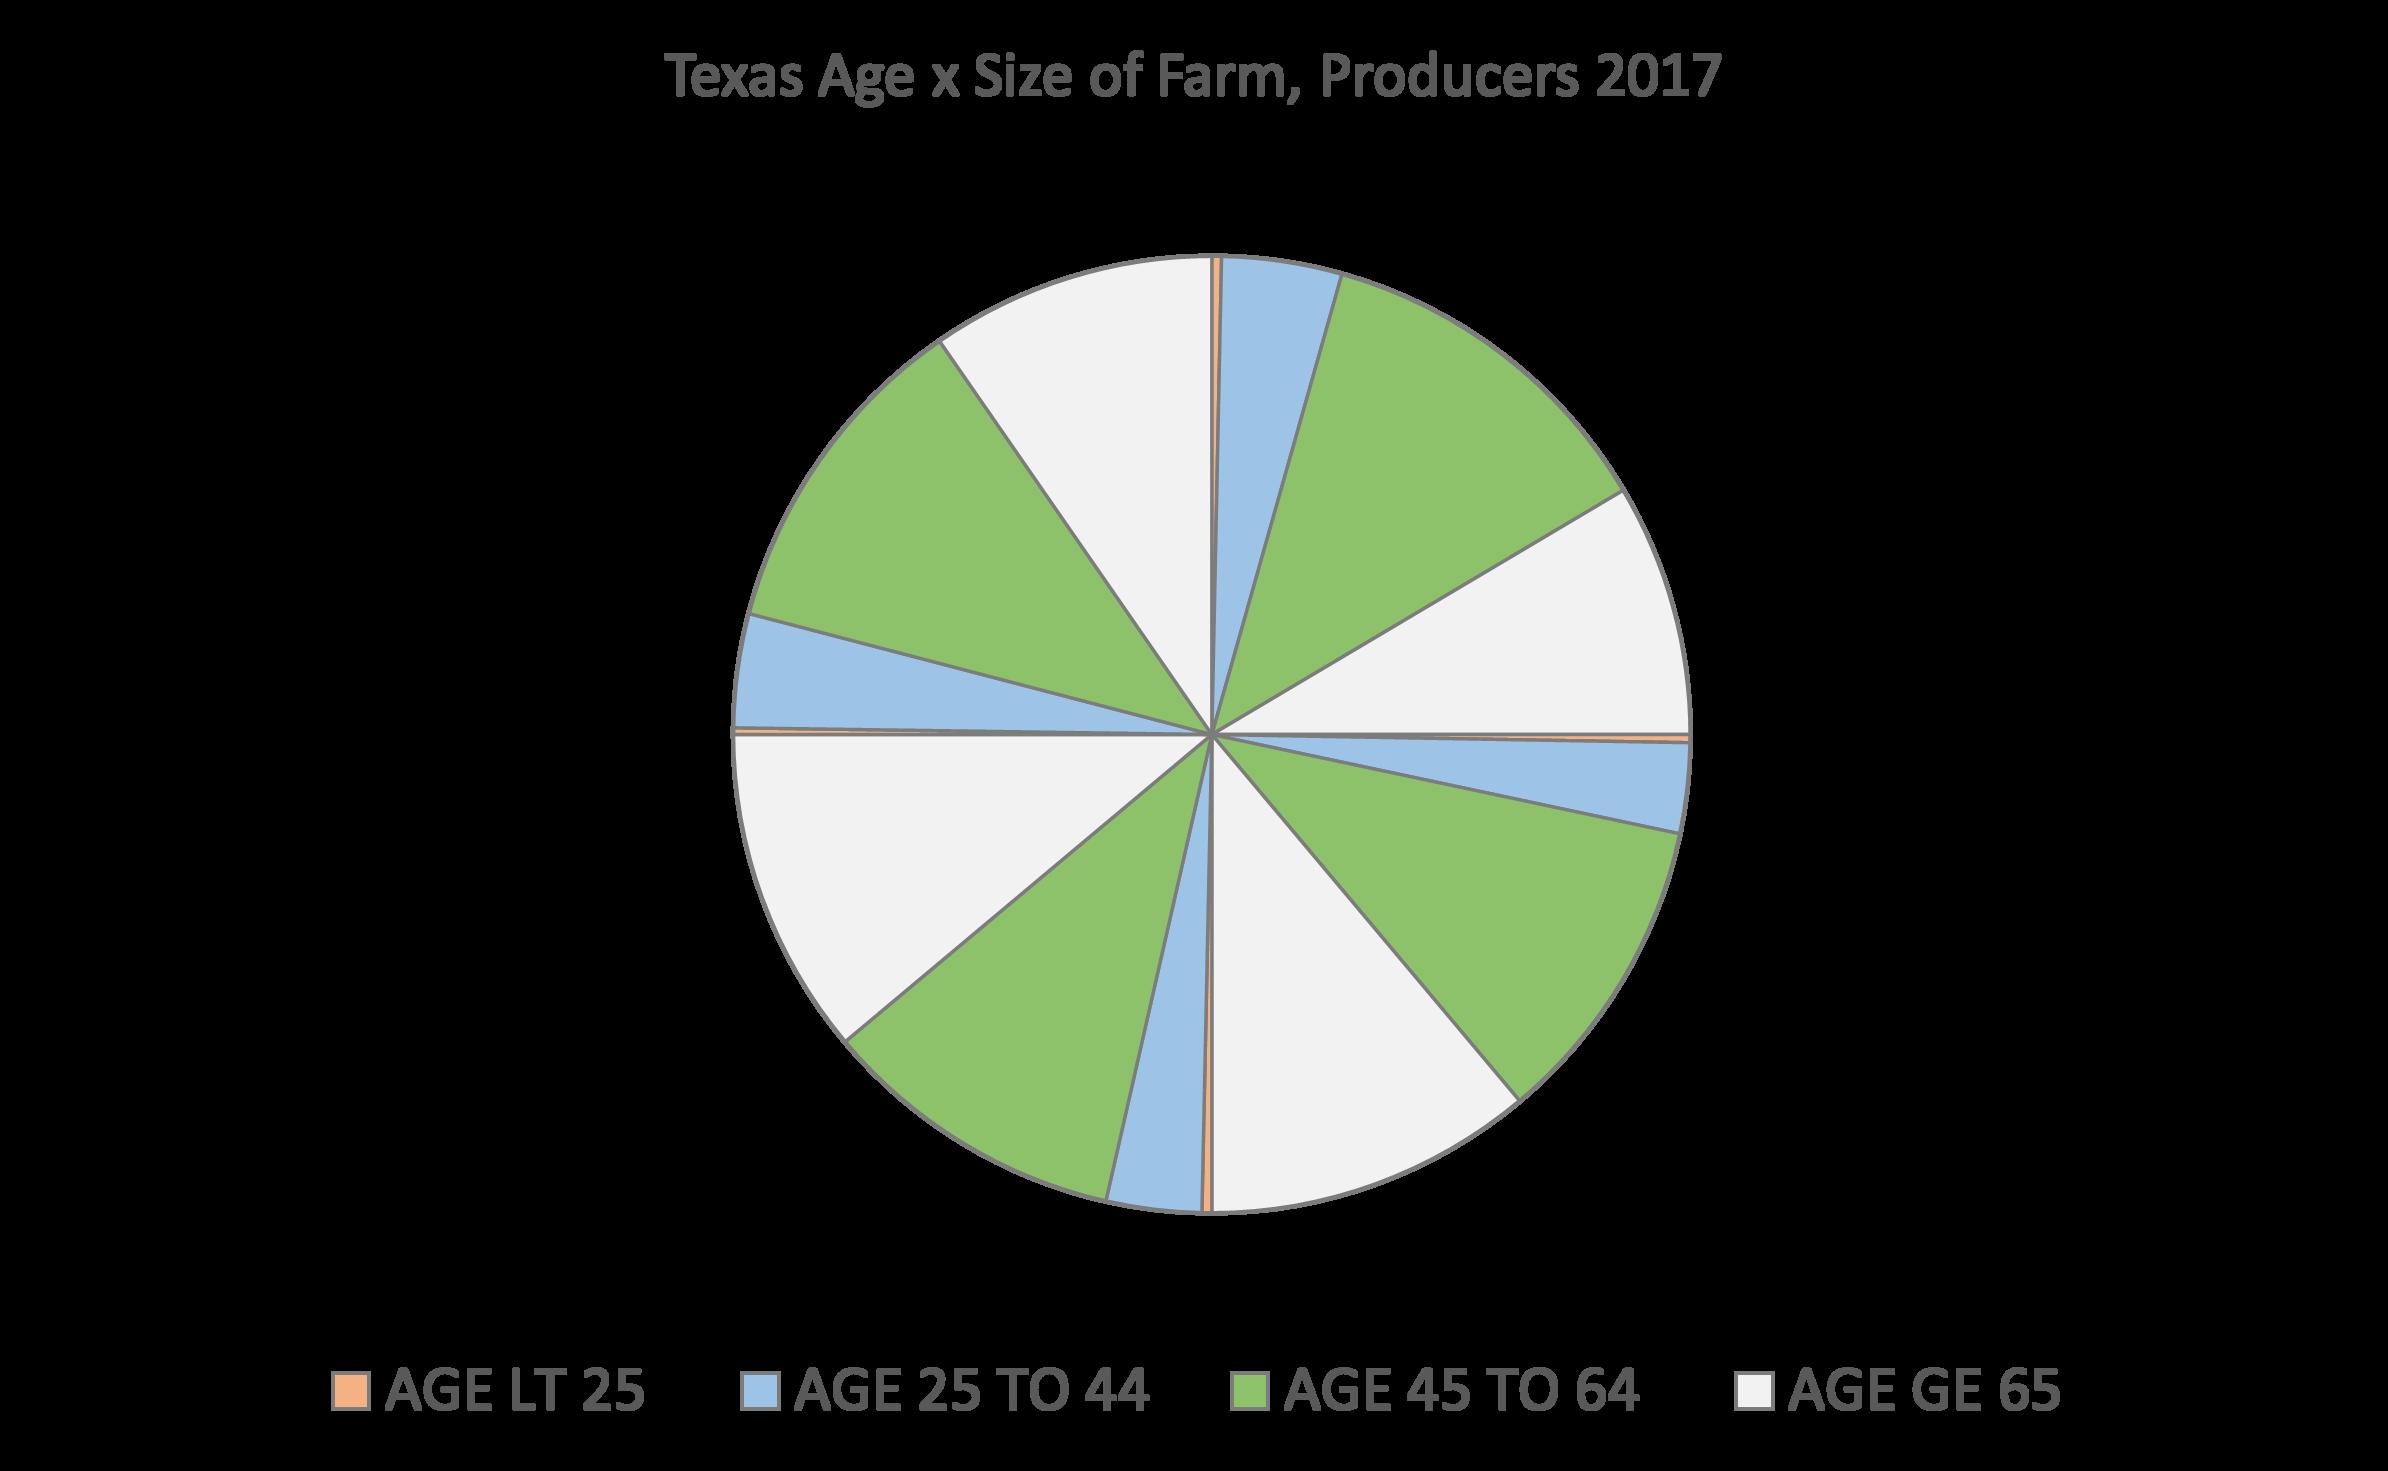
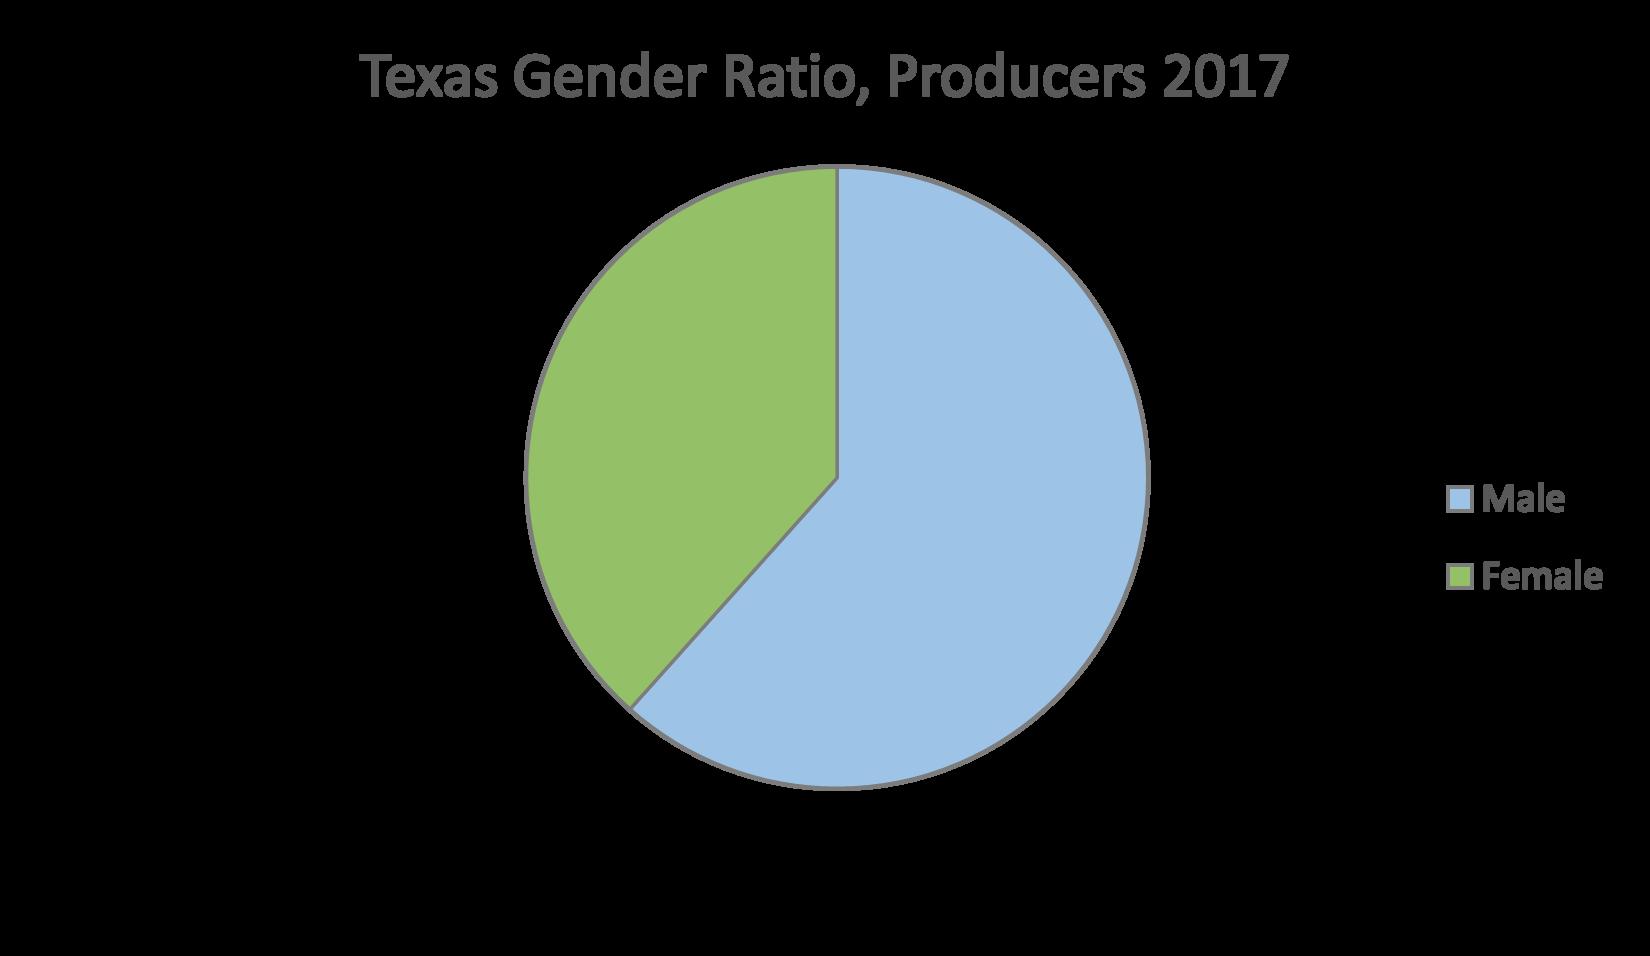
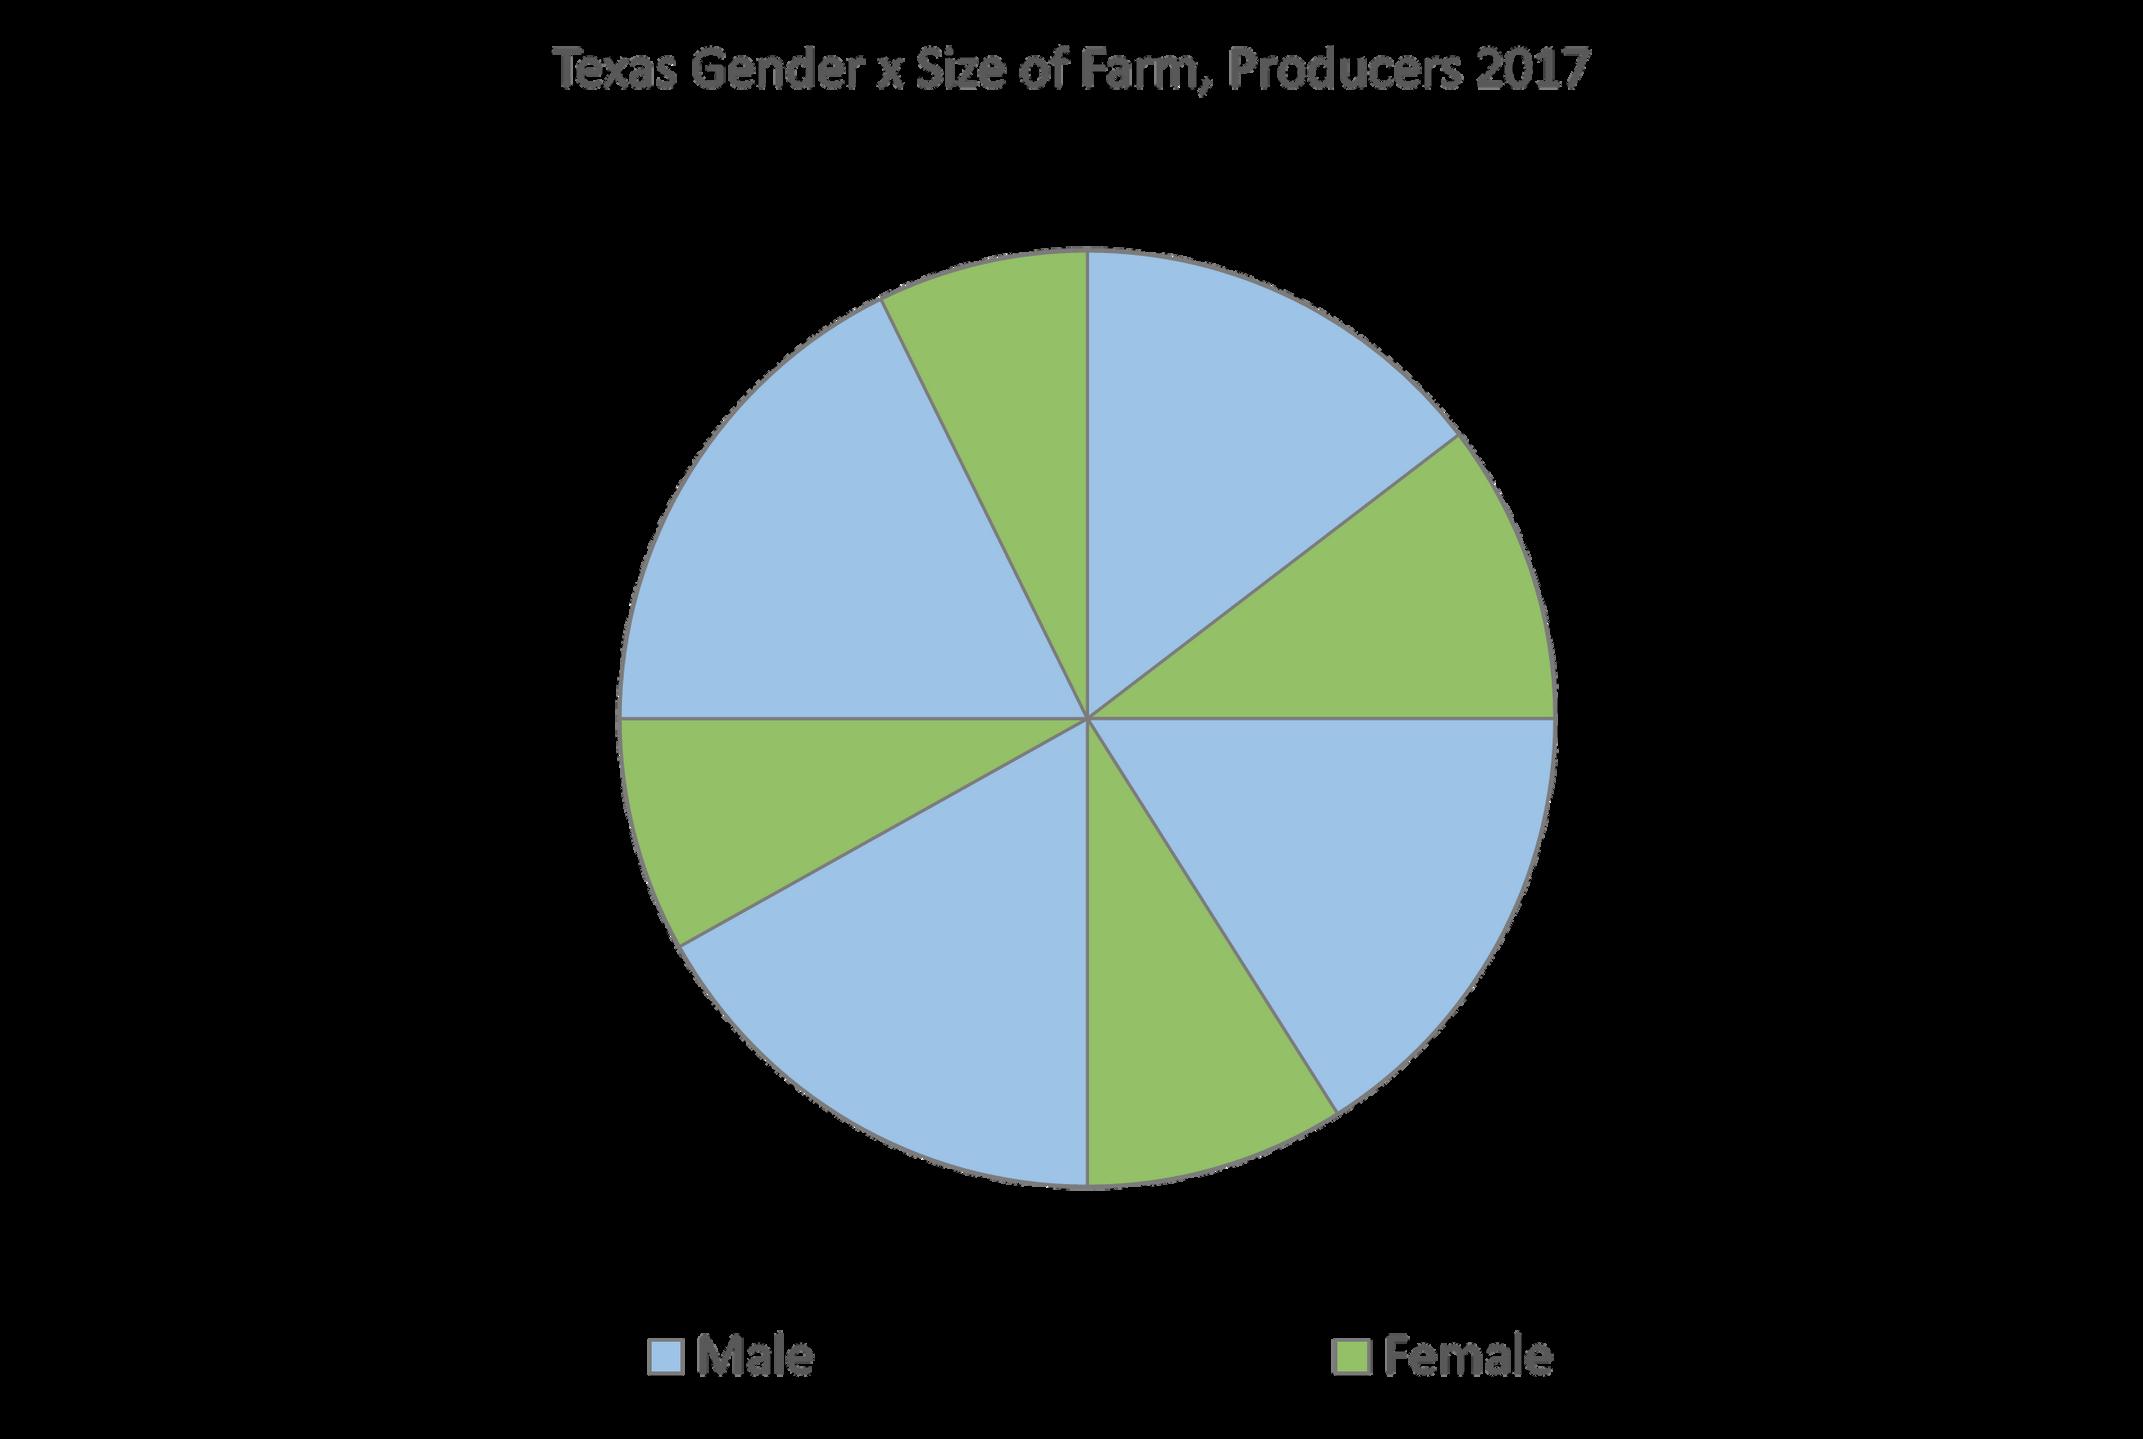
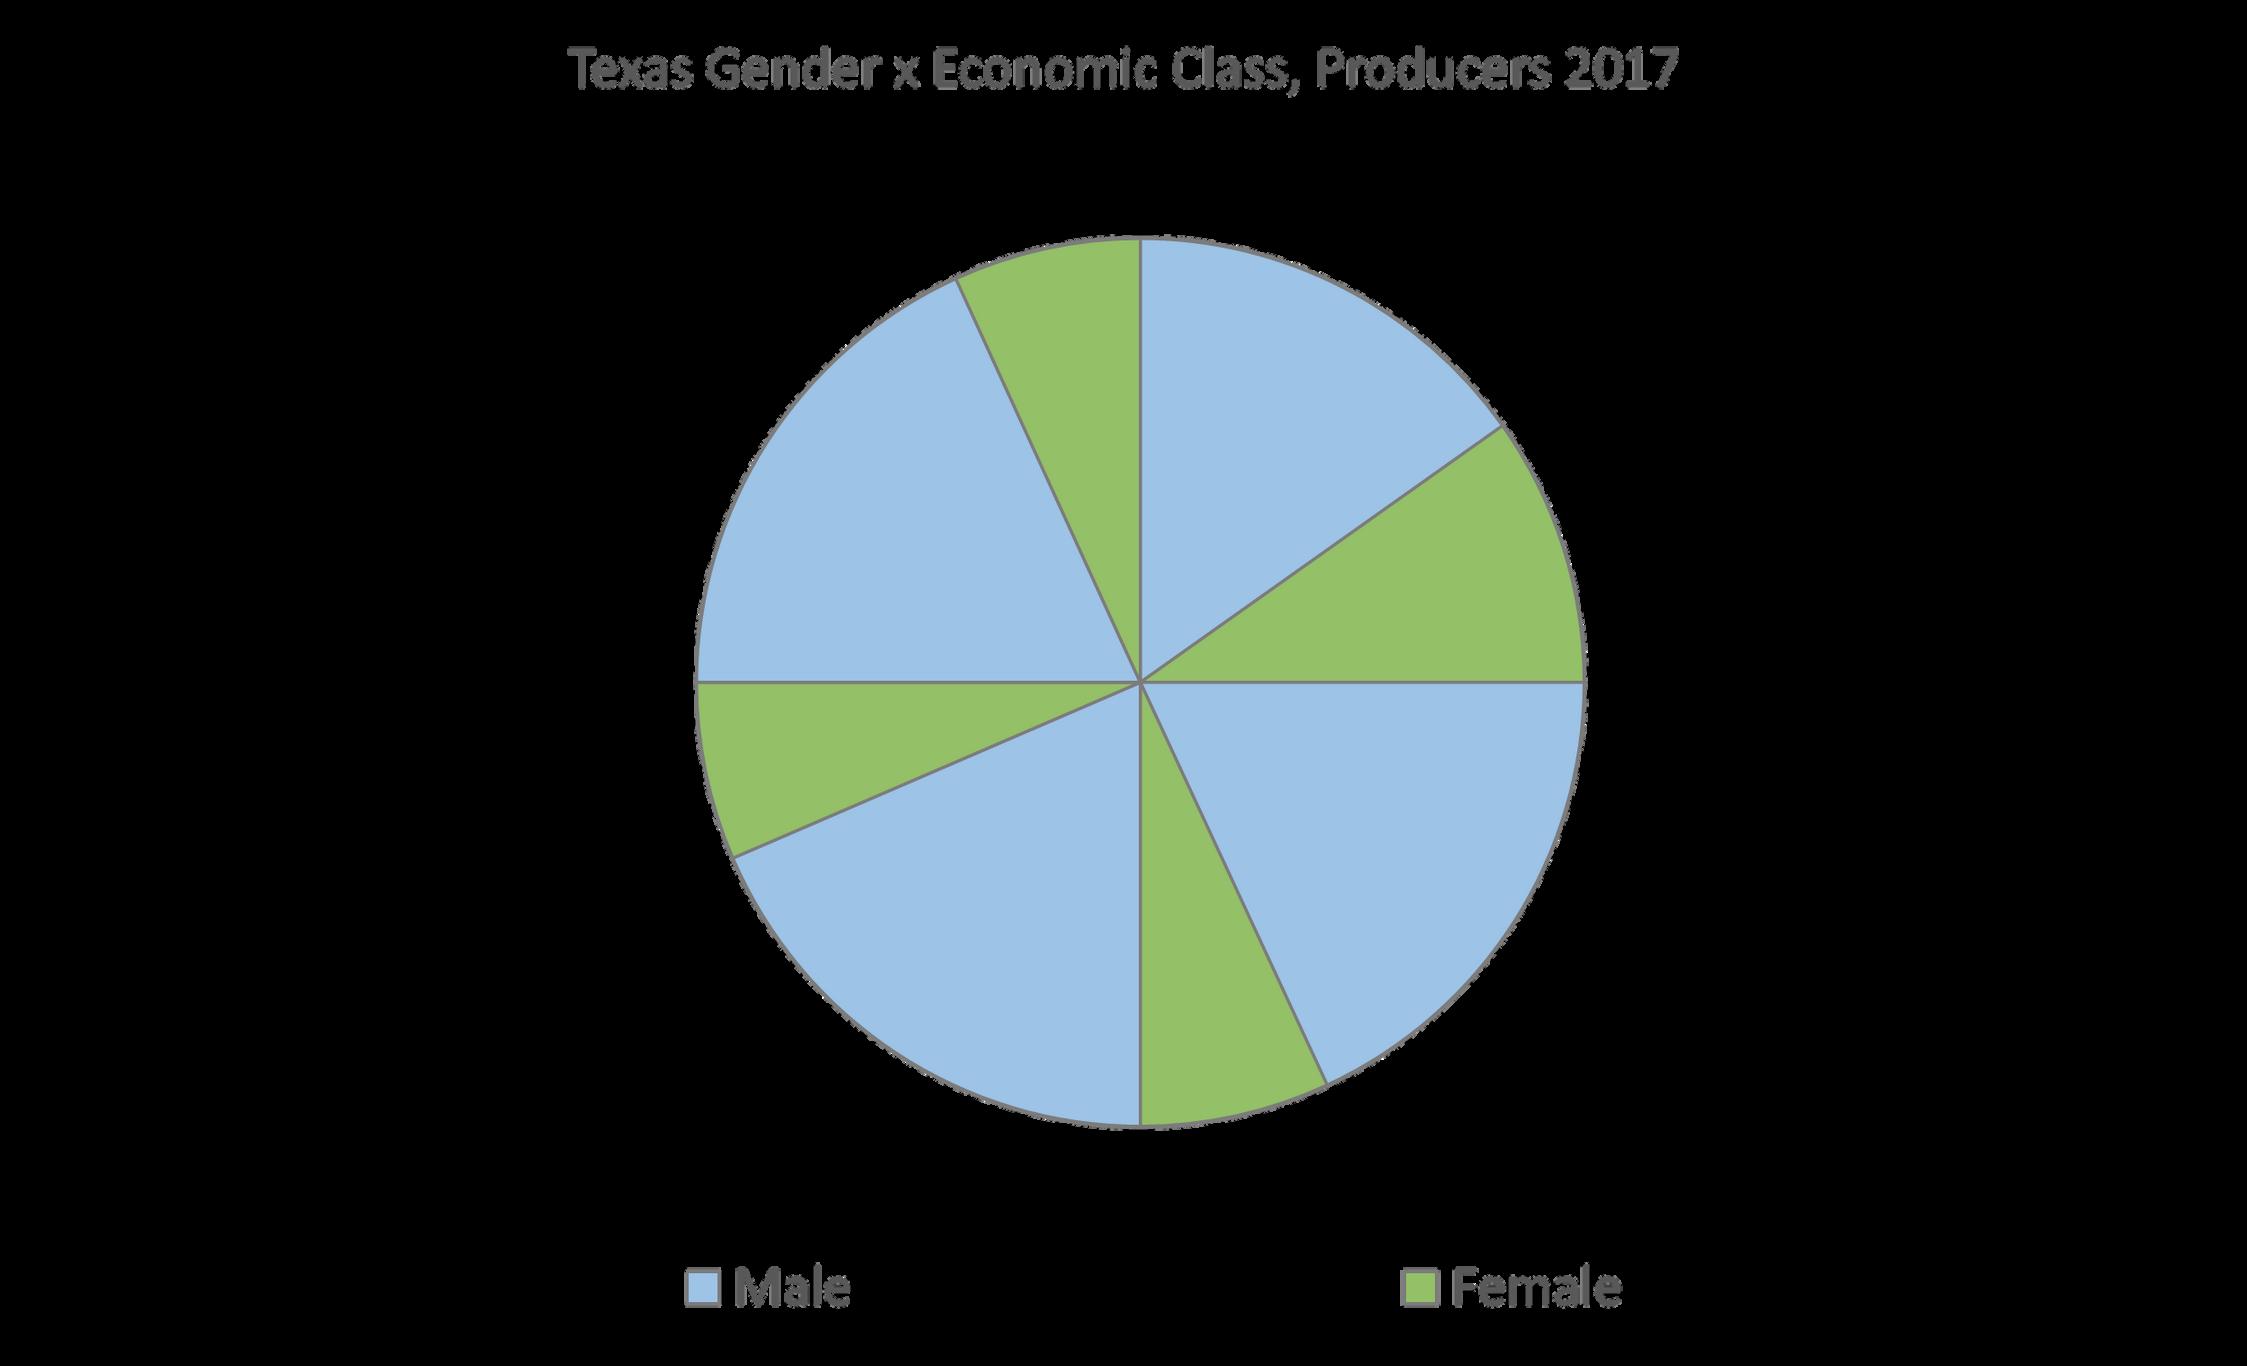
Most Texas landowners are between the ages of 46 to 64 years. Intergenerational land transfer planning and program development are items to consider With the exception of those younger than 25 years, all age groups are represented in each farm size and economic class category (Figure 3). The same is true for female landowners (Figure 4).
U S D AN A S S : T E X A S L A N D O W N E R SA TAG L A N C E 7 | Texas Land Trends txlandtrends org
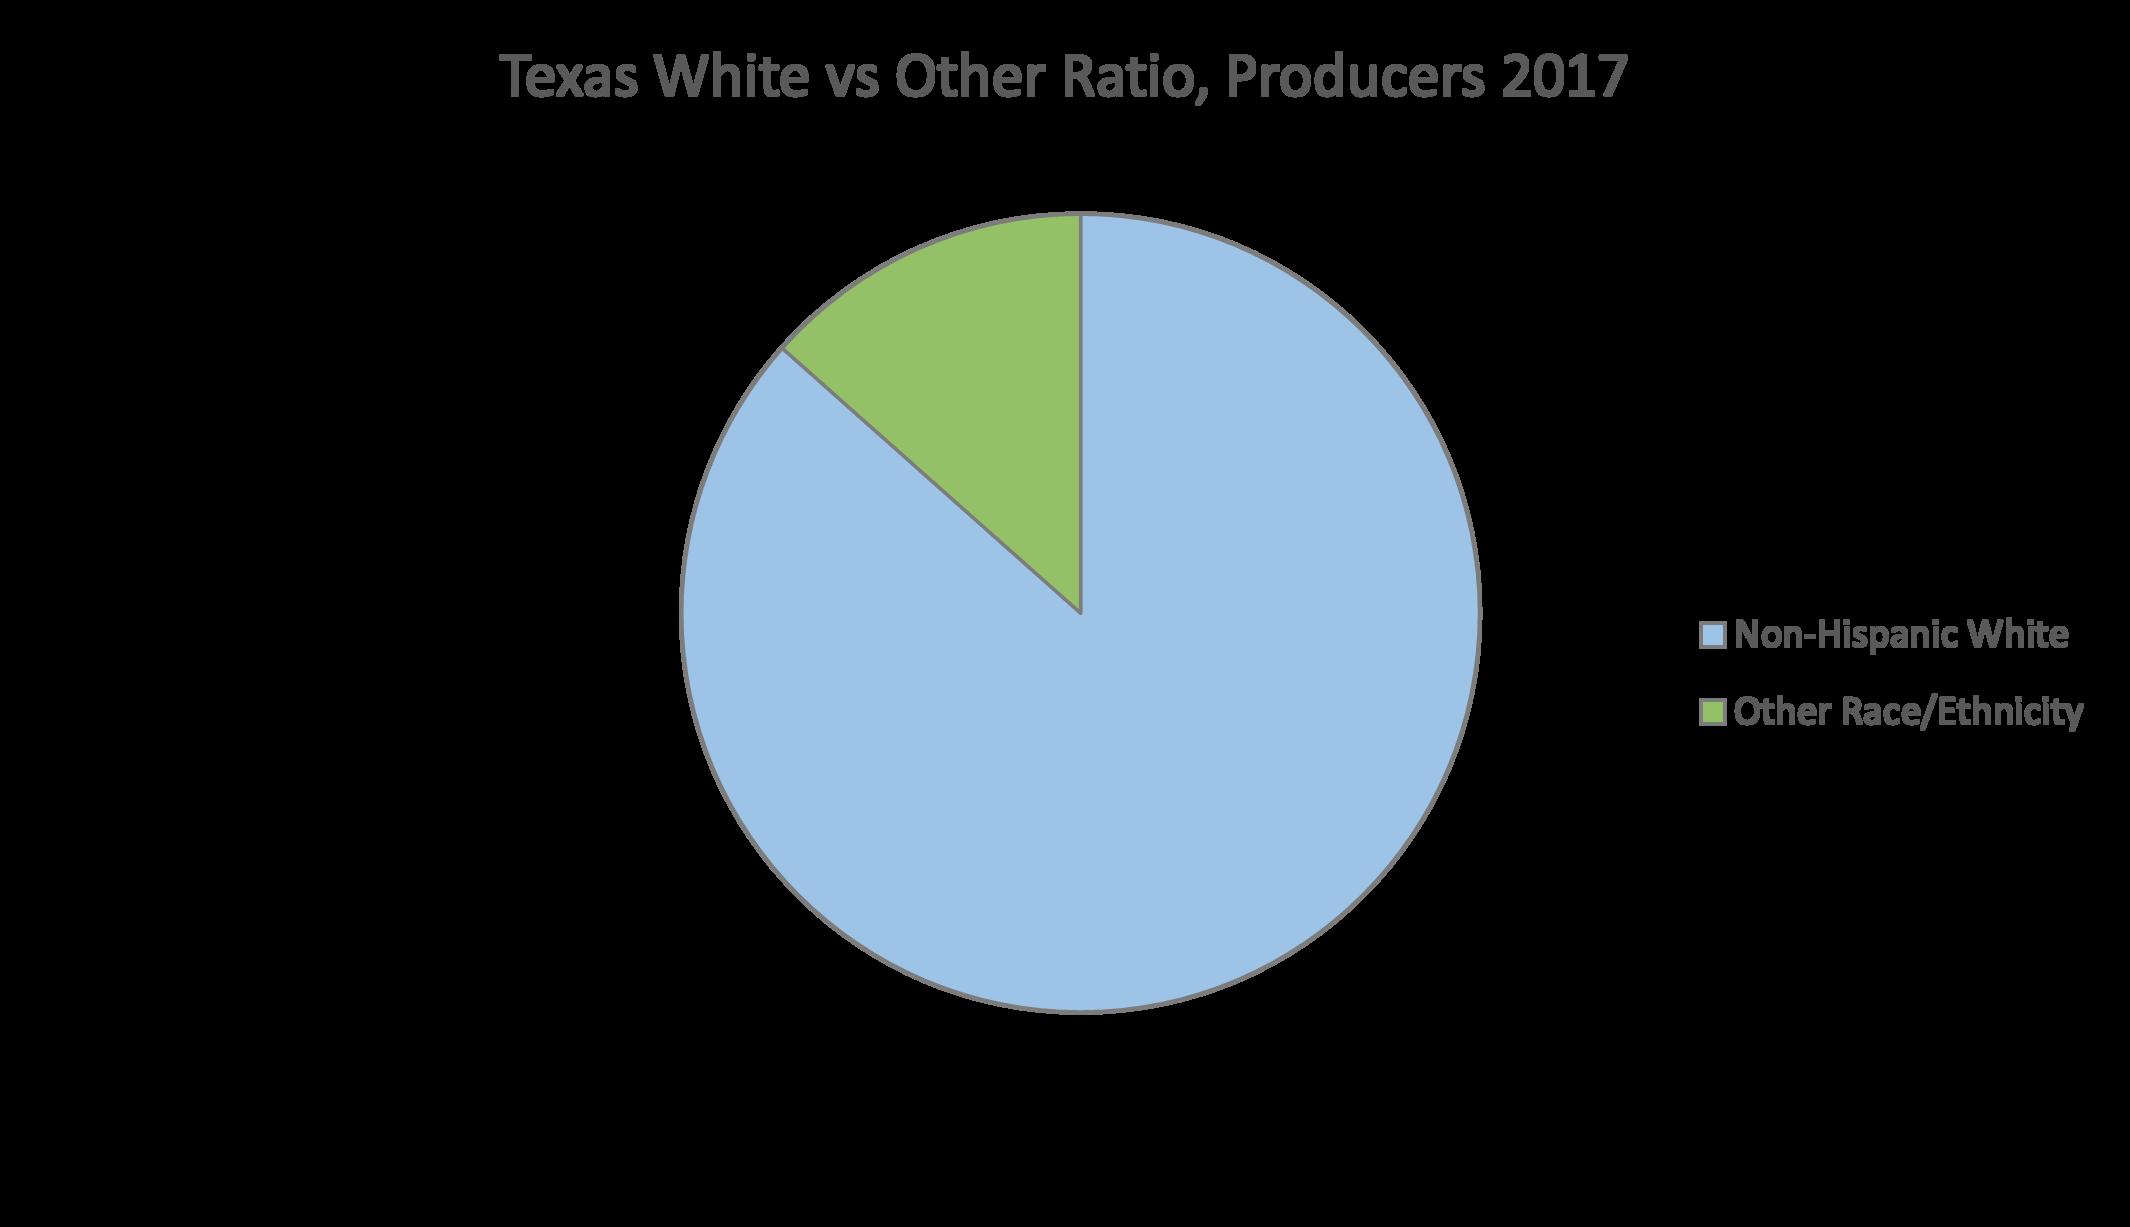
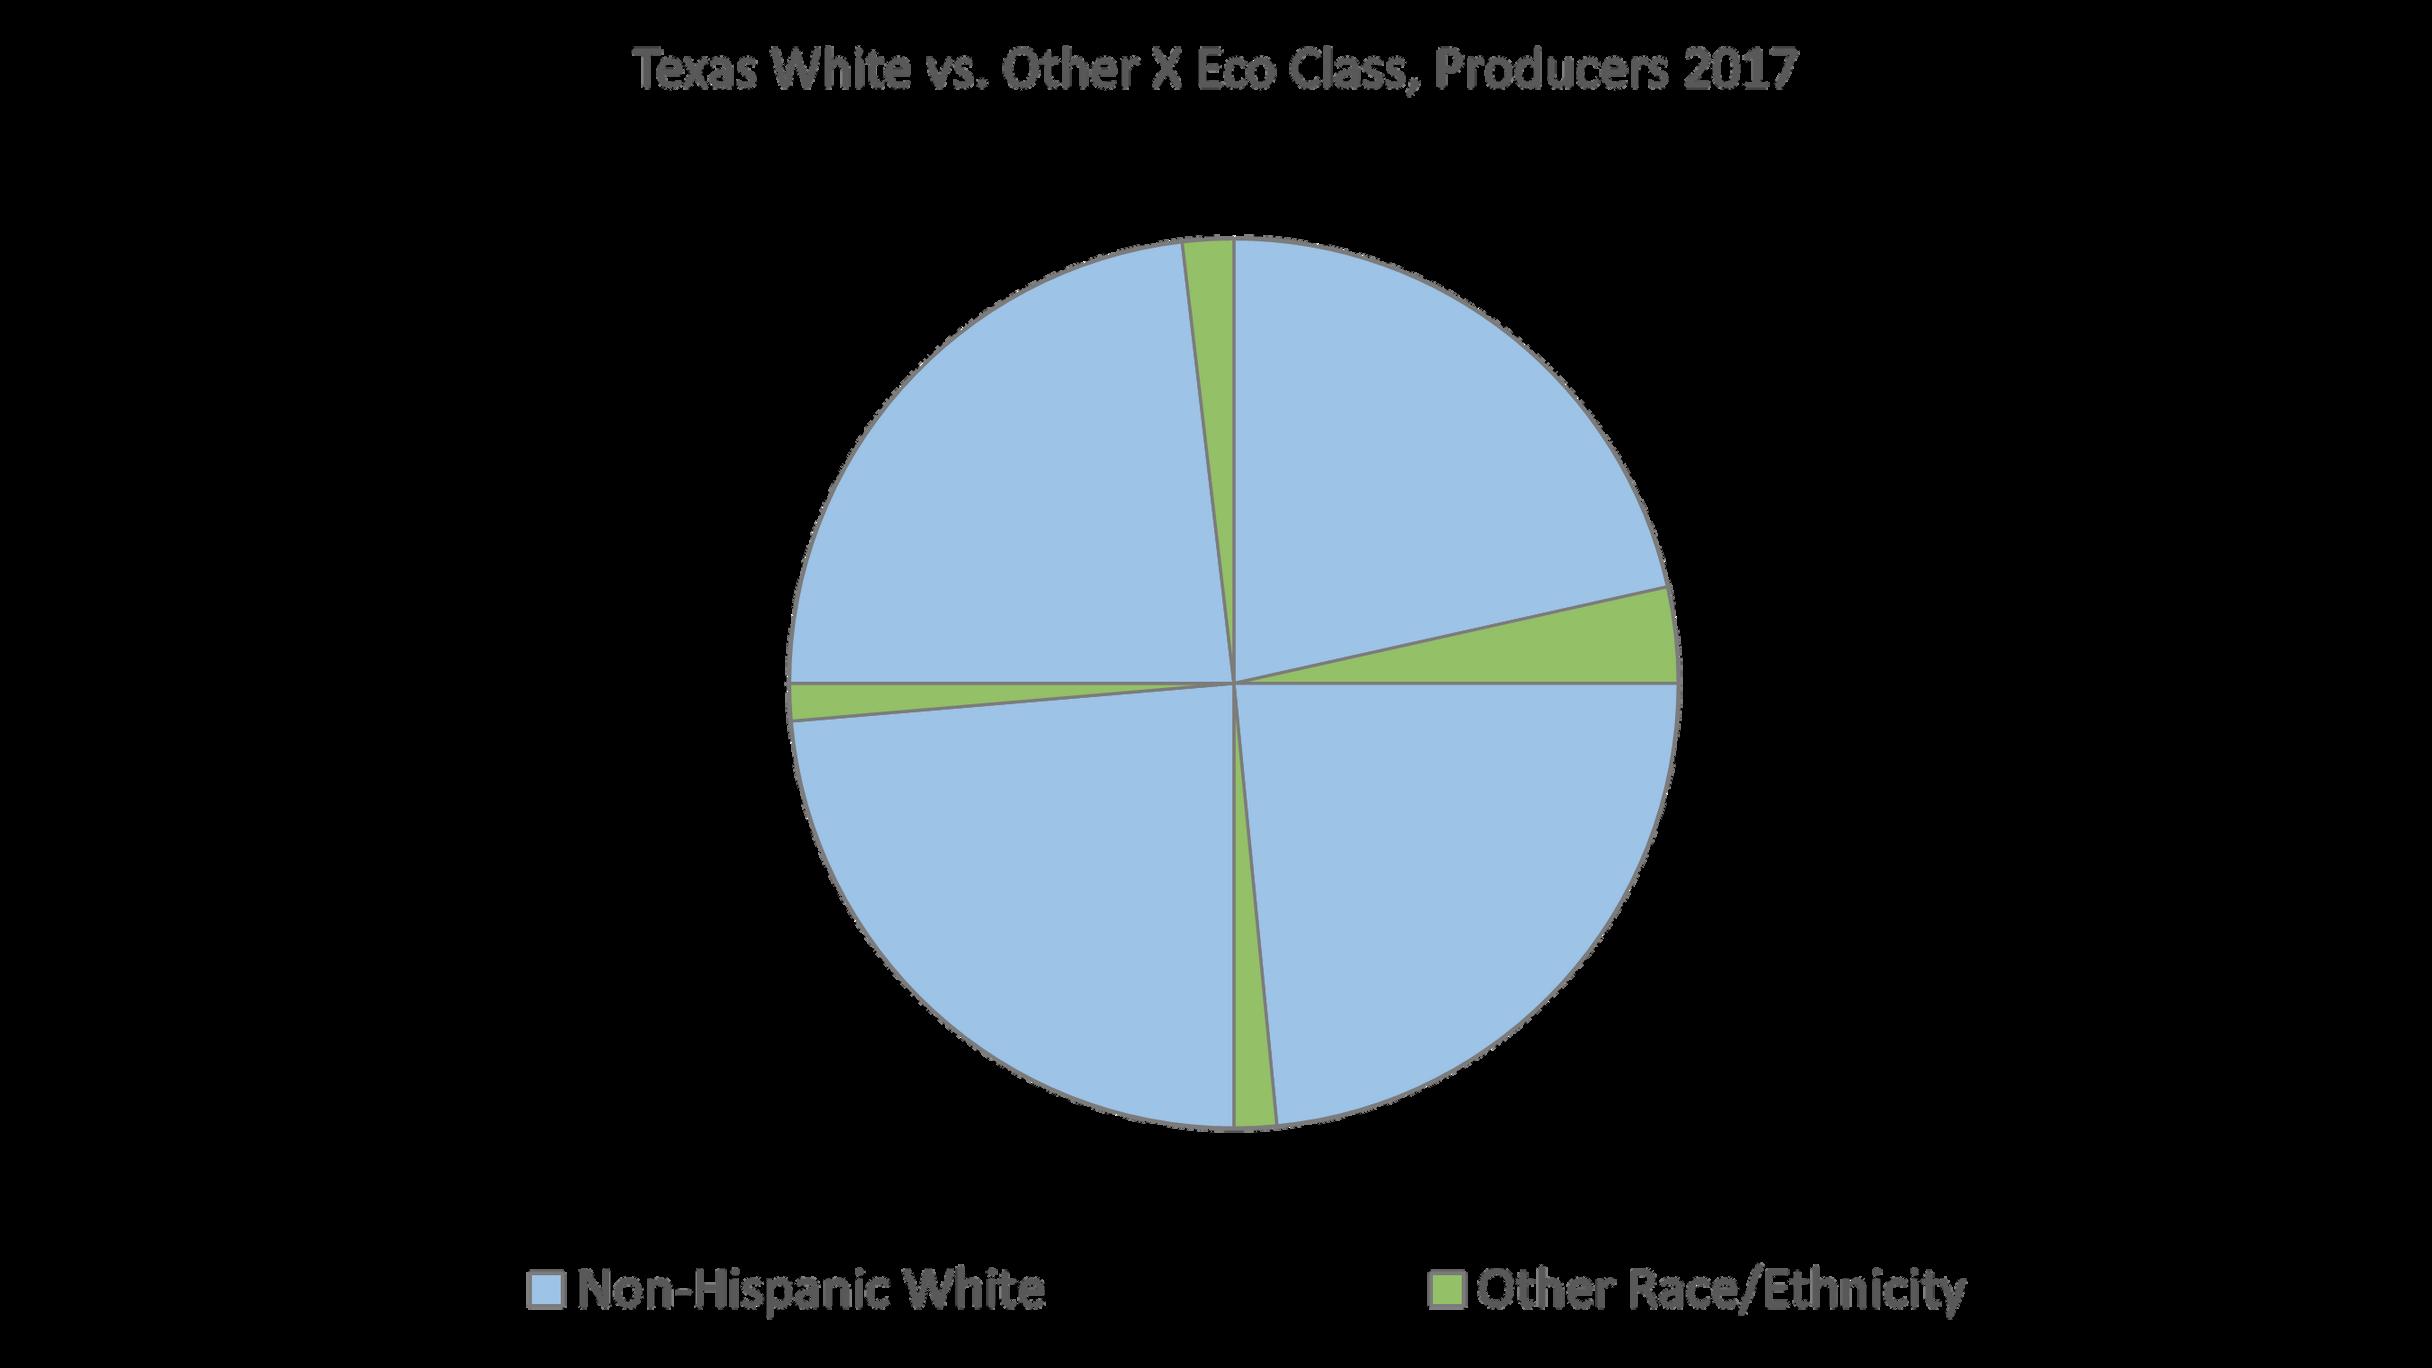
Regarding the race and ethnic characteristics of Texas landowners and stewards, approximately 87% are NonHispanic White (U.S., ~93%). Very few "socially disadvantaged (USDA)" landowners, collectively including Hispanic, Black or African American, American Indian, and Asian race and ethnic groups, own rural working lands in Texas, and a much smaller percentage of these groups operate greater than 500 acres or earn more than $99,999 from their operations (Figure 5).
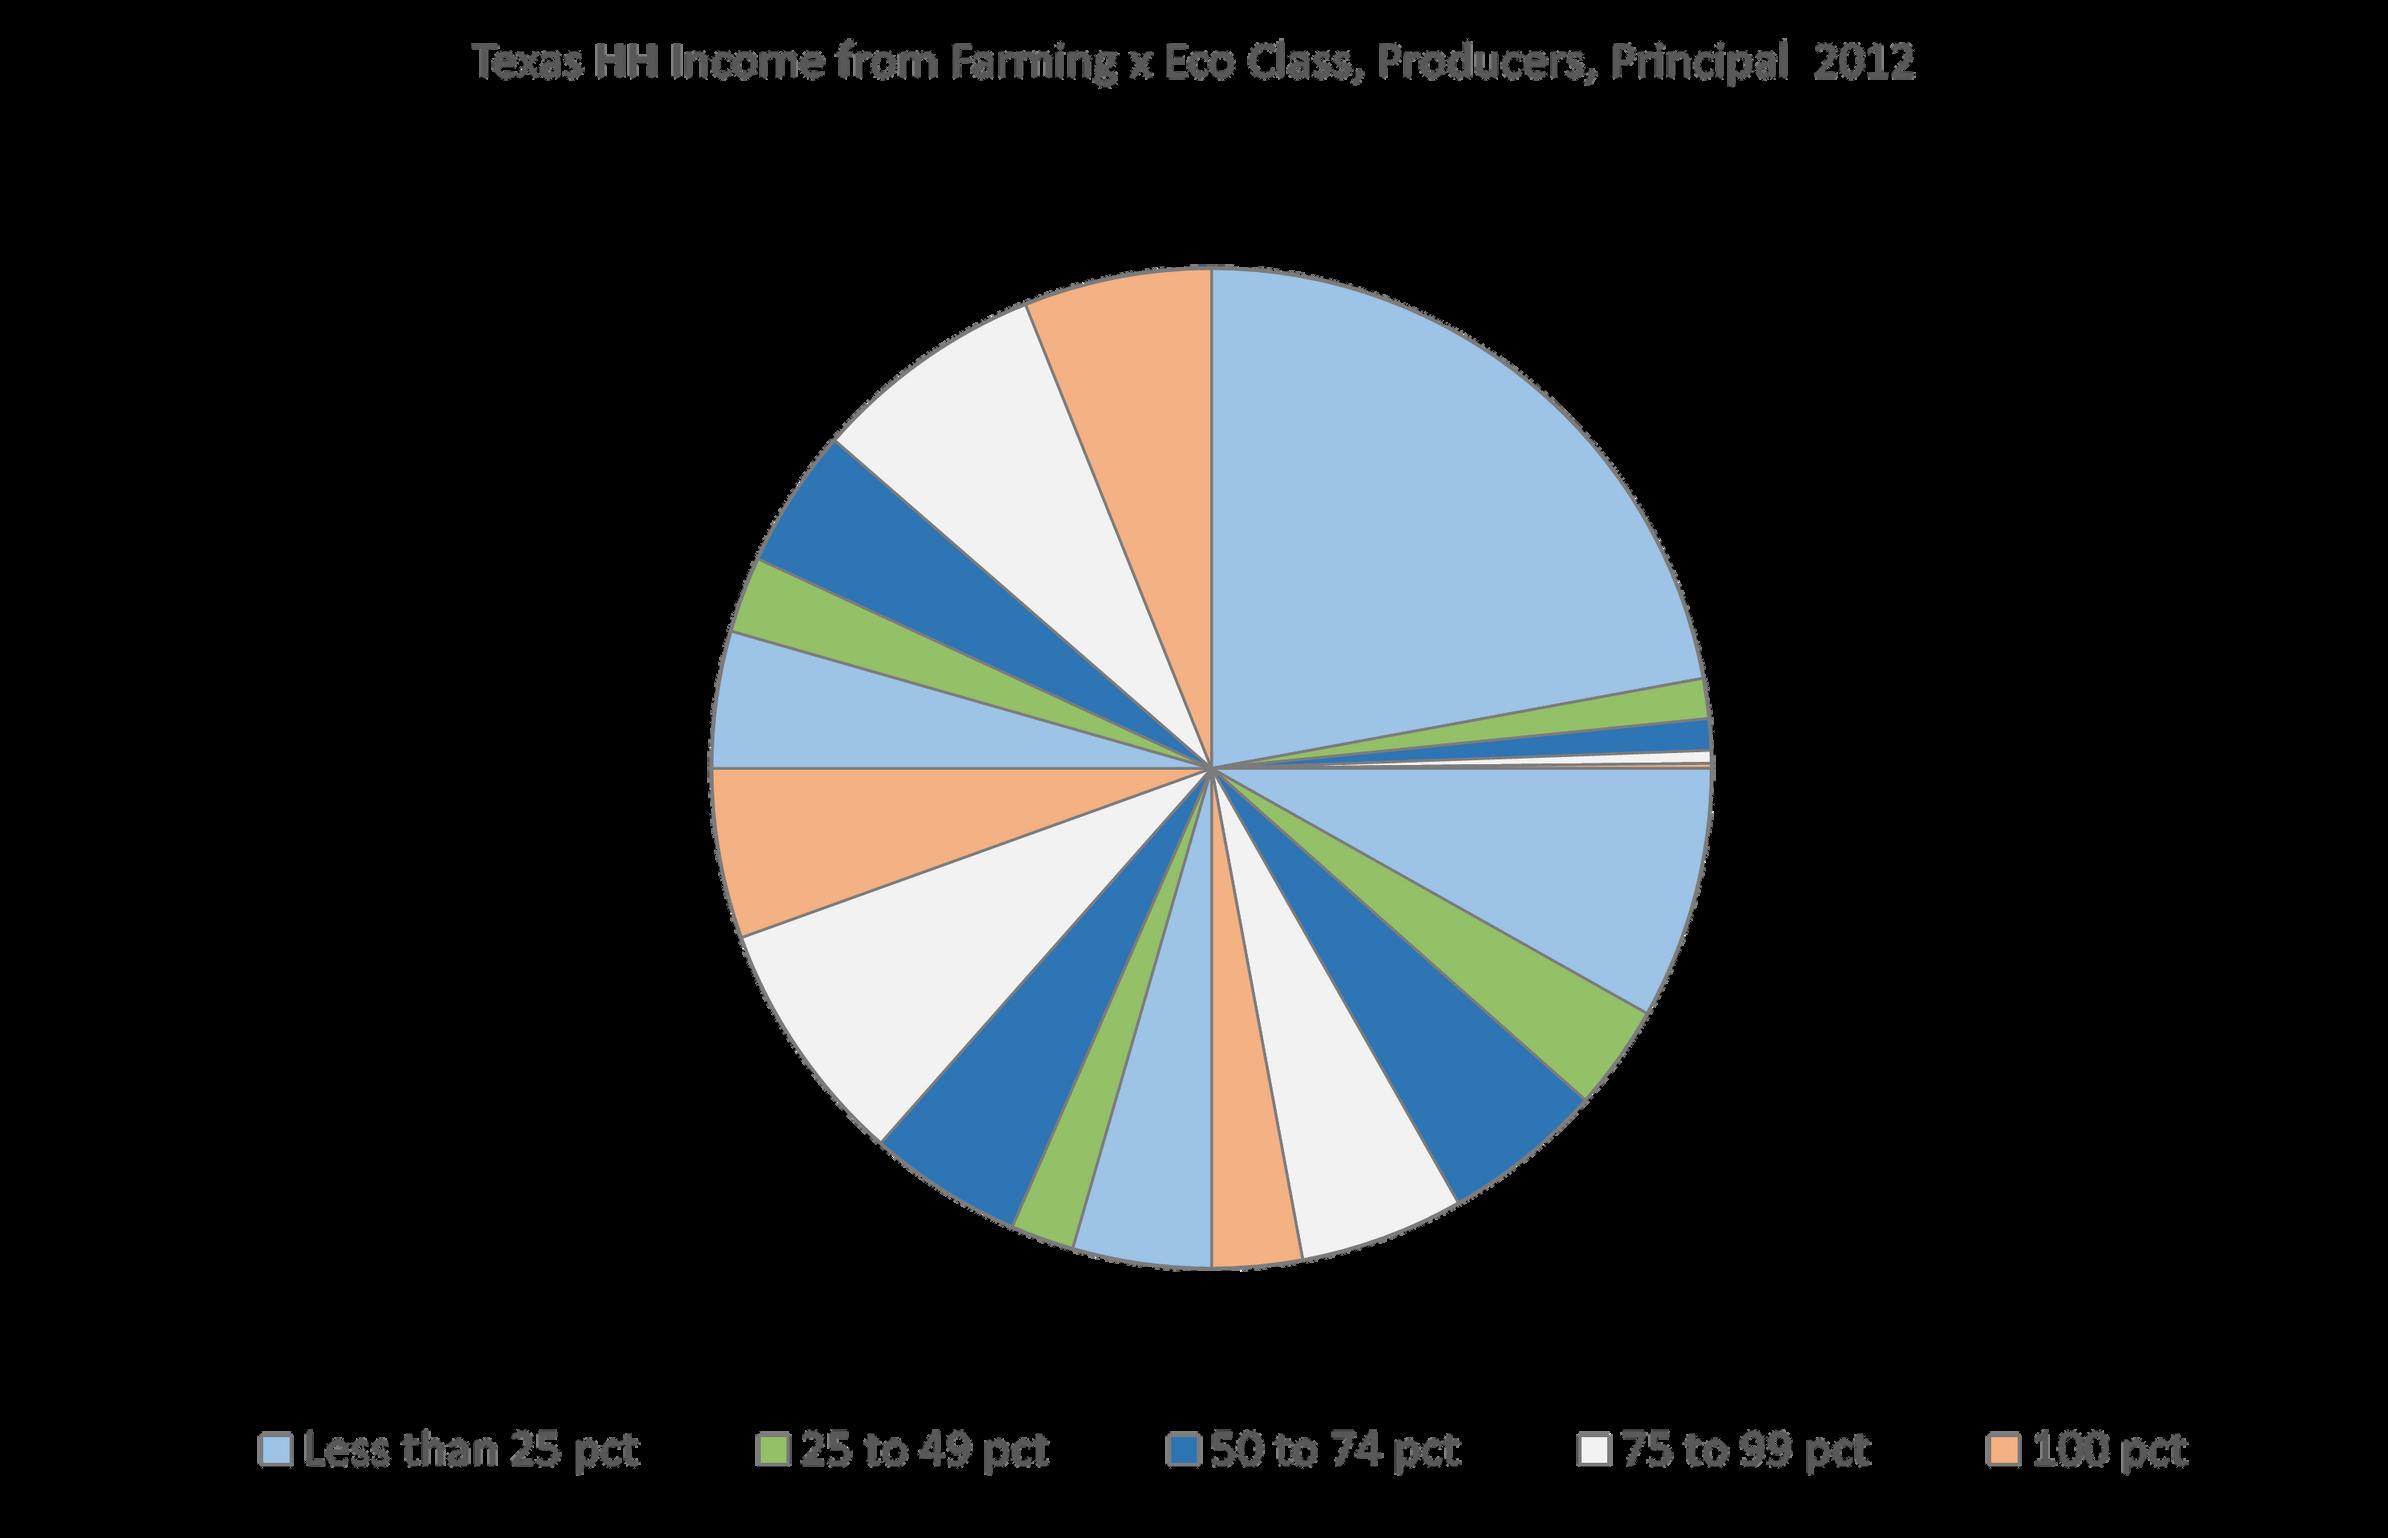
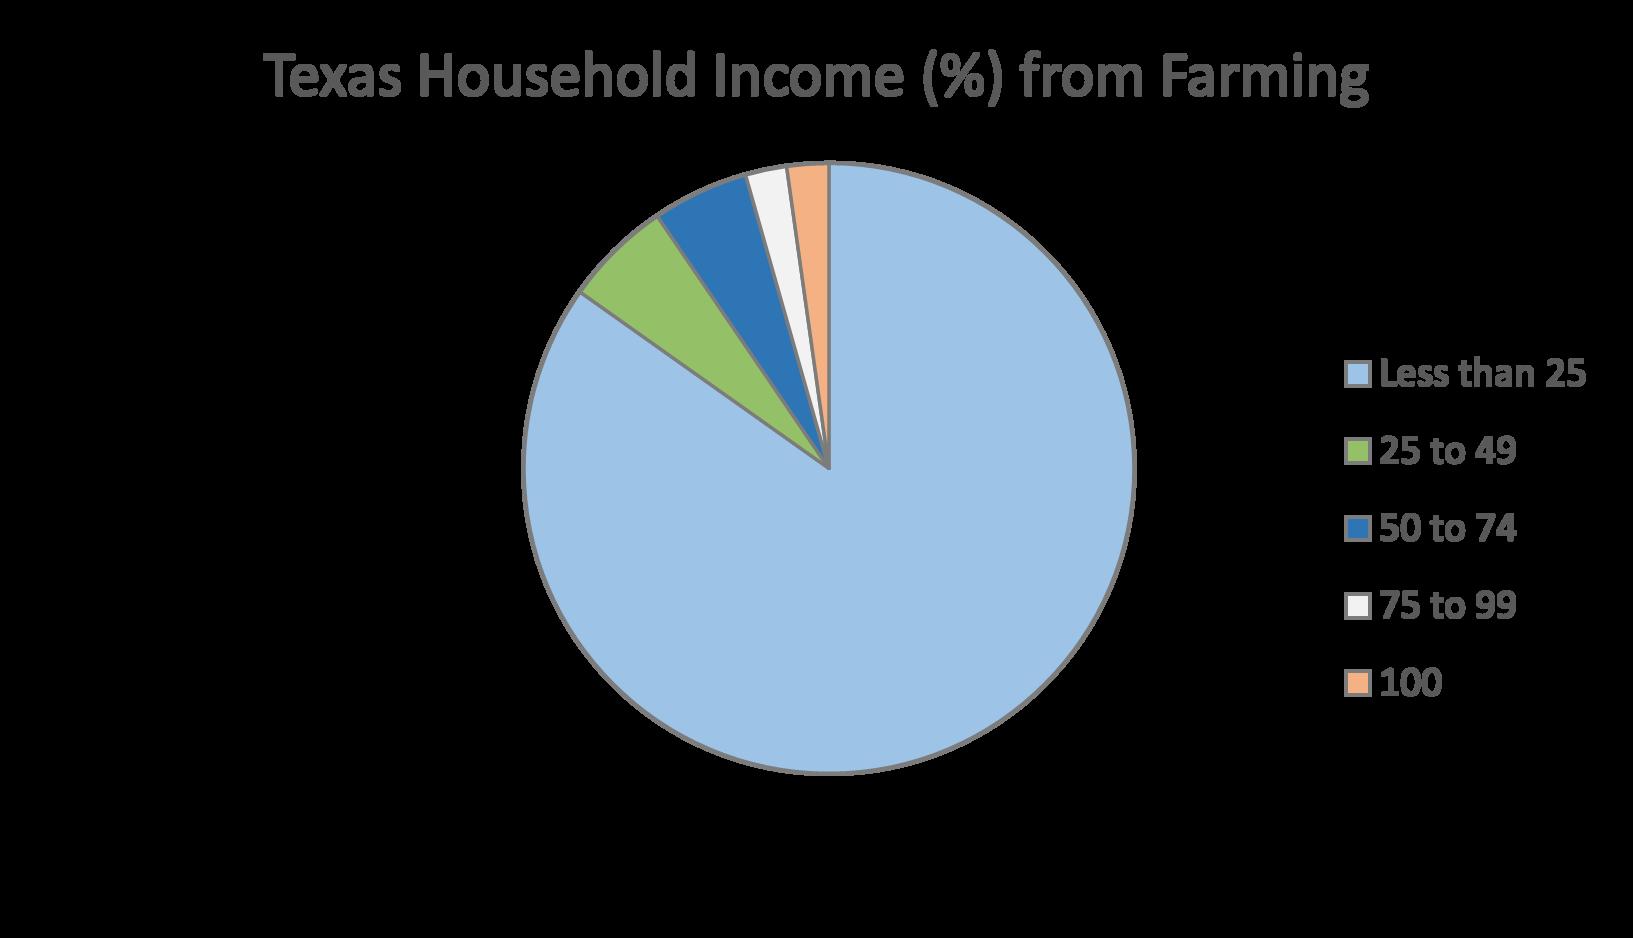
New and beginning landowners are represented in each farm size and economic class categories (Figure 6) In terms of household income, most landowners earned less than 25% of their household income from farming across each size class. The percentage of household income derived from landbased operations increased, as the economic class of the operation increased. In other words, the greater the economic class category, the greater the percentage of household income that is derived from the land-based operation. Households earning 50% or more of their annual household income from lands were more likely to be in larger economic class categories (Figure 7).
Broadband and mobile internet are the most commonly used internet resources among landowners across each farm size and economic class categories (Figure 8). Military service also is represented across all farm size and economic class categories (Figure 9).
Most Texas landowners across all size categories work outside their operation (farming is secondary employment) This decreases as operation size and economic class categories increase (Figure 10). Landowner residence has been a topic of discussion. According to USDA-NASS data, approximately 40% of Texas landowners reside off their operation Landowners, whether they reside on- or off-farm, were represented across all farm size and economic class categories (Figure 11).
A final note on farm size and economic class. When we compared farm size categories with economic class categories, most Texas operations, regardless of operation size, earned less than $99,000 from their lands (Figure 12). When we compare USDA-NASS data against Texas Landowner Survey responses, we found congruency in the datasets where survey respondents were older, non-Hispanic White males, and that many reside off-farm. For those who reside on-farm, incomes are supplemented with work off-farm. The Texas Landowner Survey supplements our current knowledge of private, rural working landowners and helps develop targeted landowner programming.
txlandtrends org 8 | Texas Land Trends U S D AN A S S : T E X A S L A N D O W N E R SA TAG L A N C E
Age < 25
Age 25 to 44
Age 45 to 64
Age ≥ 65


T E X A S
Farm Size ≥ 1,000 acres ≤ 99 acres
acres 9 | Texas Land Trends txlandtrends org
Overview
100-499
AGE
Figure 3. Texas Landowner Age (in years), Farm Size, and Economic Class, USDA, 2021.


Fe M Farm Size ≥ 1,000 acres ≤ 99 acres 500-999 acres 100 499 ends txlandtrends org GENDER U S D AN A S S : T E X A S L A N D O W N E R SA TAG Economic Class ≥ $1,000,000 ≤ $99,999 $500,000 - 999,999 $100,000 - 499,999



dvantaged Groups c White Overview Farm Size ≥ 1,000 acres ≤ 99 acres 500-999 acres 100-499 acres txlandtrends org 1
AN A S S : T E X A S L A N D O W N E R SA TAG L A N C E Economic Class ≥ $1,000,000 ≤ $99,999 $500,000 - 999,999 $100,000 - 499,999
RACE/ETHNICITY


≥ 11 Years (Exp 0-10 Years (Beg Overview Farm Size ≥ 1,000 acres ≤ 99 acres 500-999 acres 100-499 acres ds txlandtrends org EXPERIENCE U S D AN A S S : T E X A S L A N D O W N E R SA TAG L A N C E Economic Class ≥ $1,000,000 ≤ $99,999 $500,000 - 999,999 $100,000 - 499,999
HOUSEHOLD INCOME FROM FARMING

to 49% to 74% to 99% %


Overview Farm Size ≥ 1,000 acres ≤ 99 acres 500-999 acres 100-499 acres txlandtrends org g (%), .
S : T E X A S L A N D O W N E R SA TAG L A N C E Economic Class ≥ $1,000,000 ≤ $99,999 $500,000 - 999,999 $100,000 - 499,999
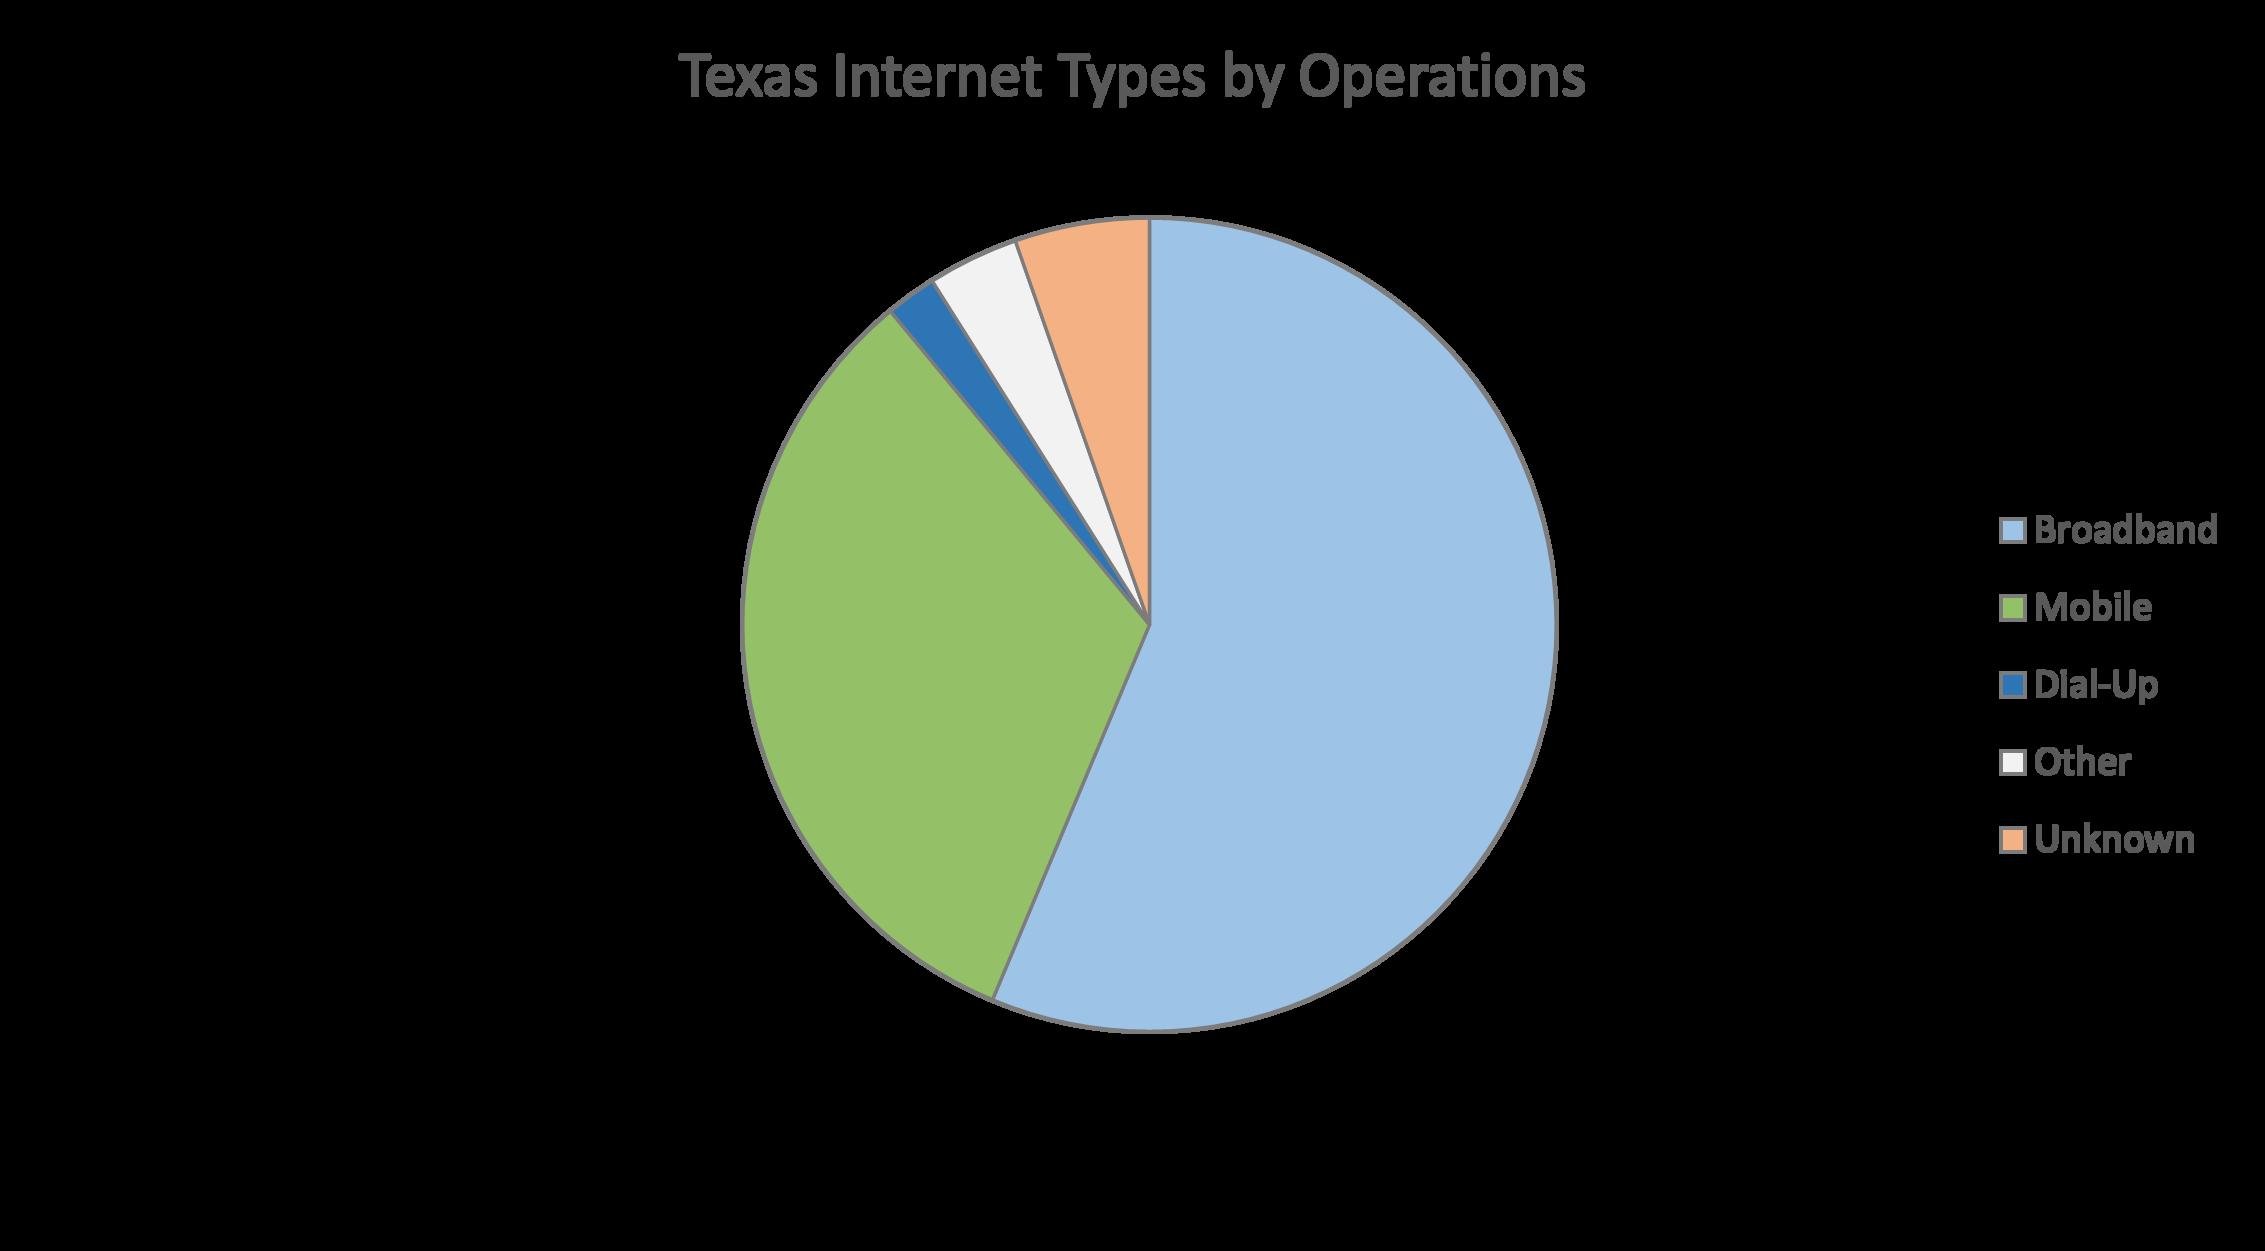


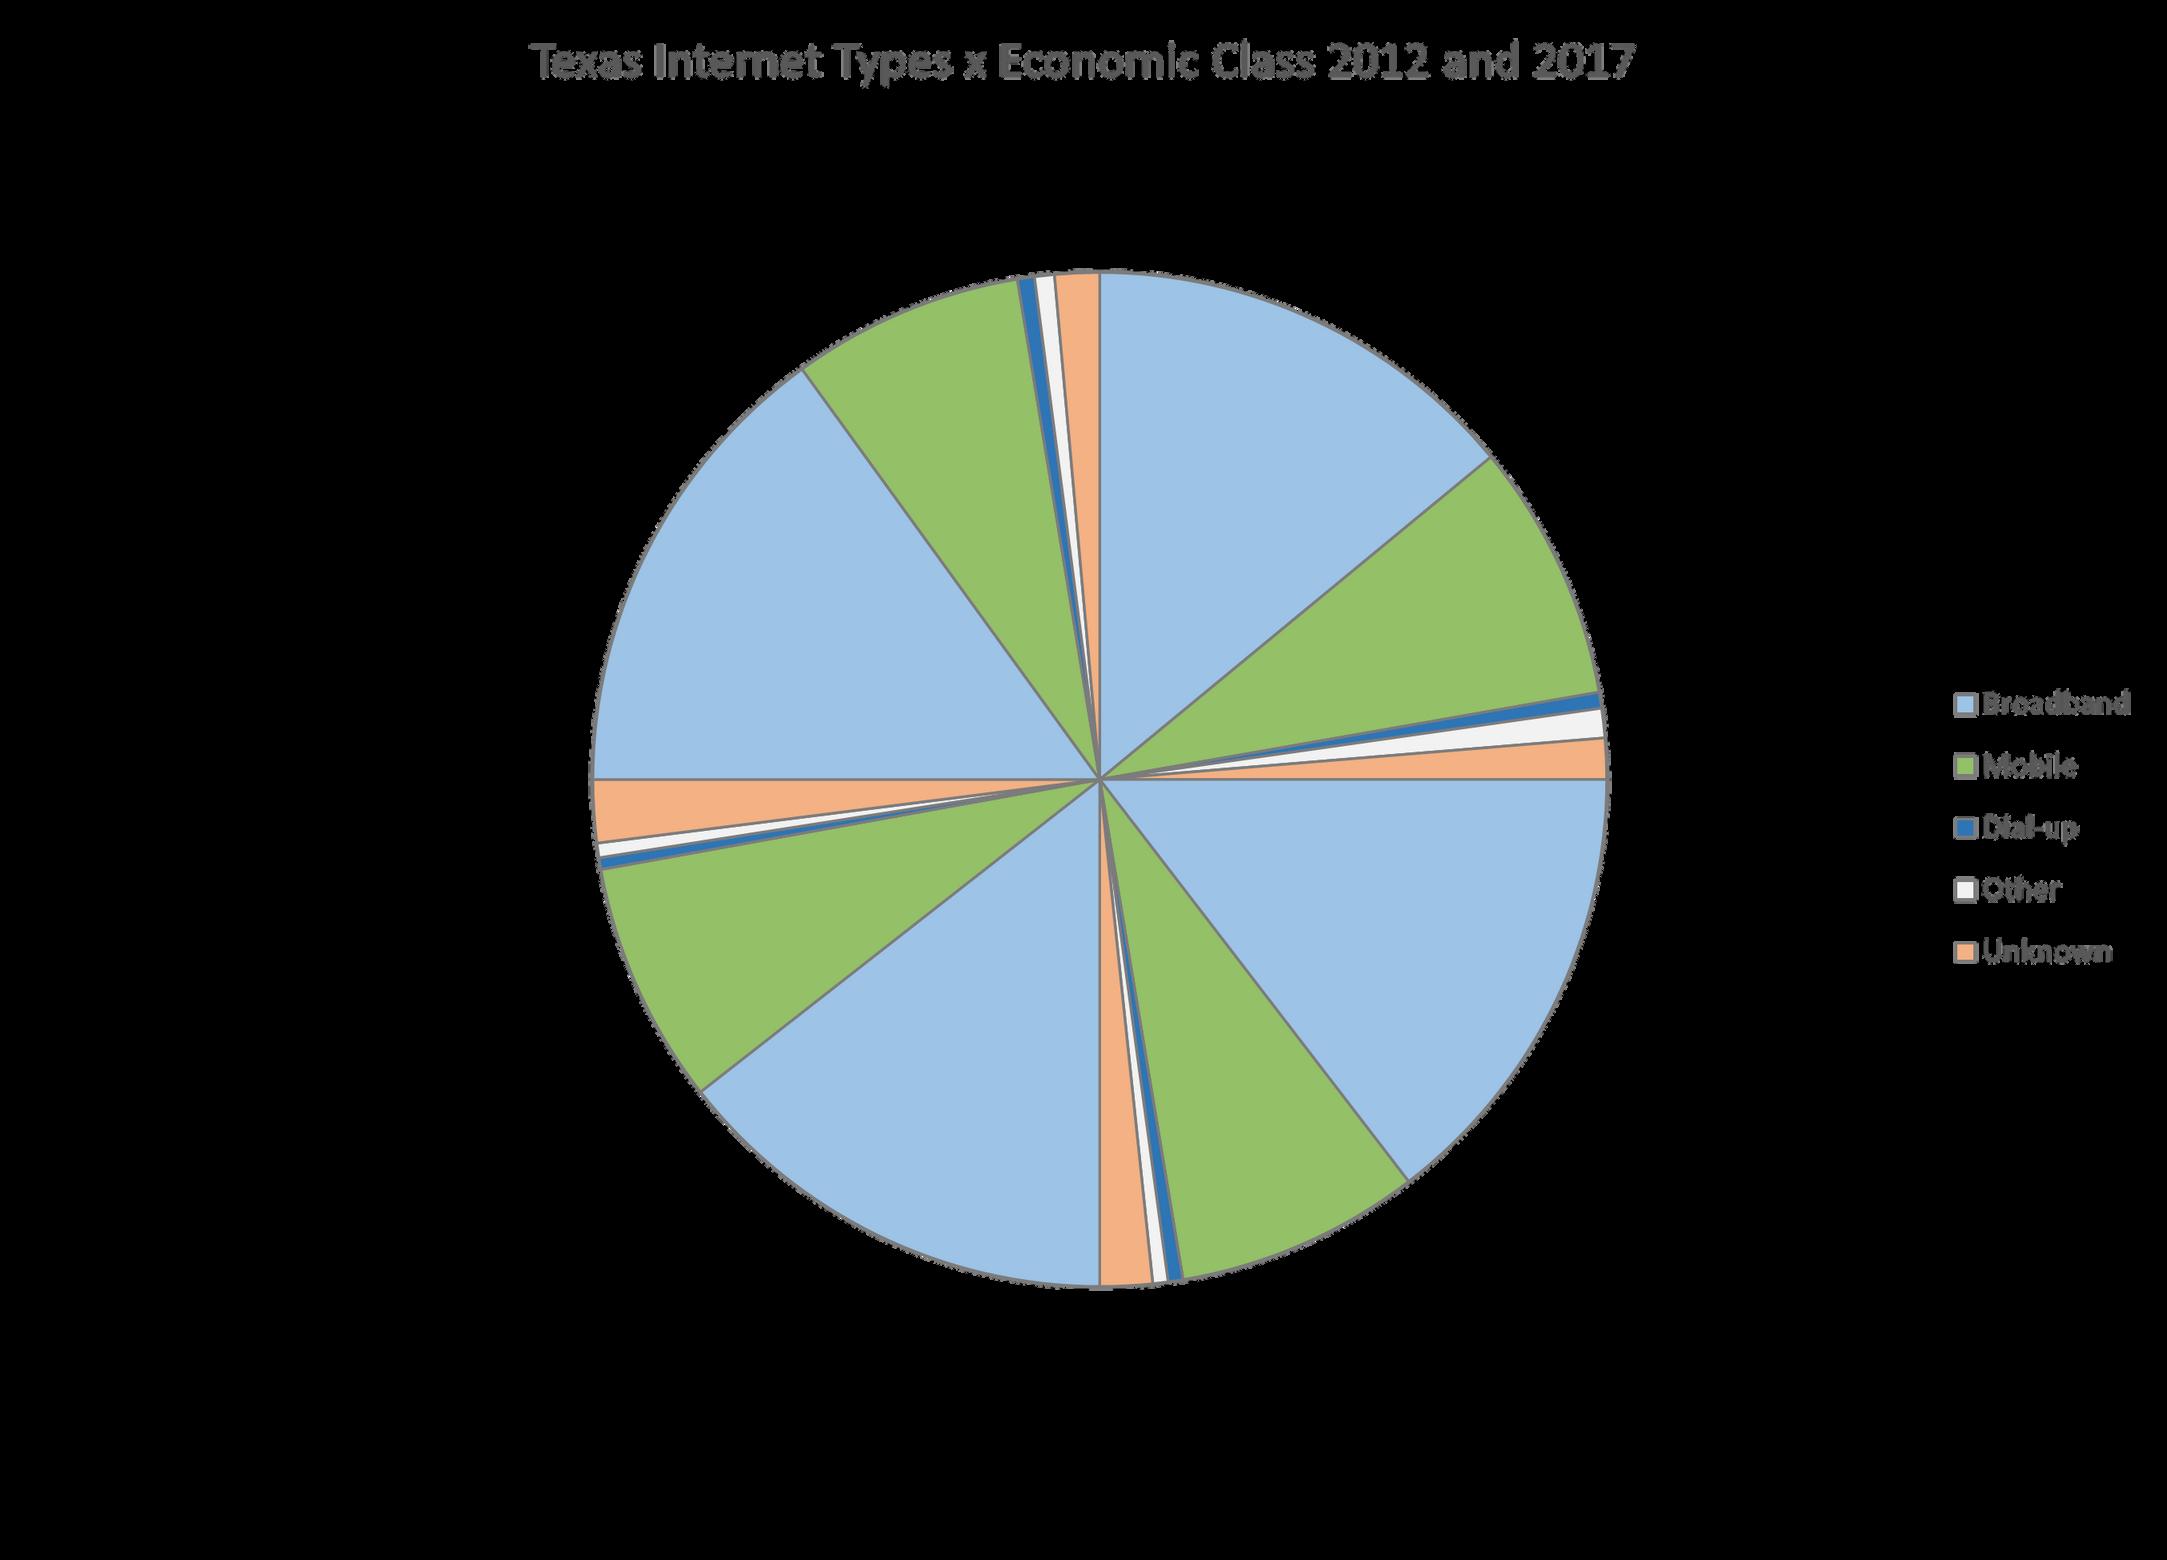

Mobil Dial-U Other Unkno Overview Farm Size ≥ 1,000 acres ≤ 99 acres 500-999 acres 100-499 acres ds txlandtrends org INTERNET RESOURCES U S D AN A S S : T E X A S L A N D O W N E R SA TAG L A N C E Economic Class ≥ $1,000,000 ≤ $99,999 $500,000 - 999,999 $100,000 - 499,999


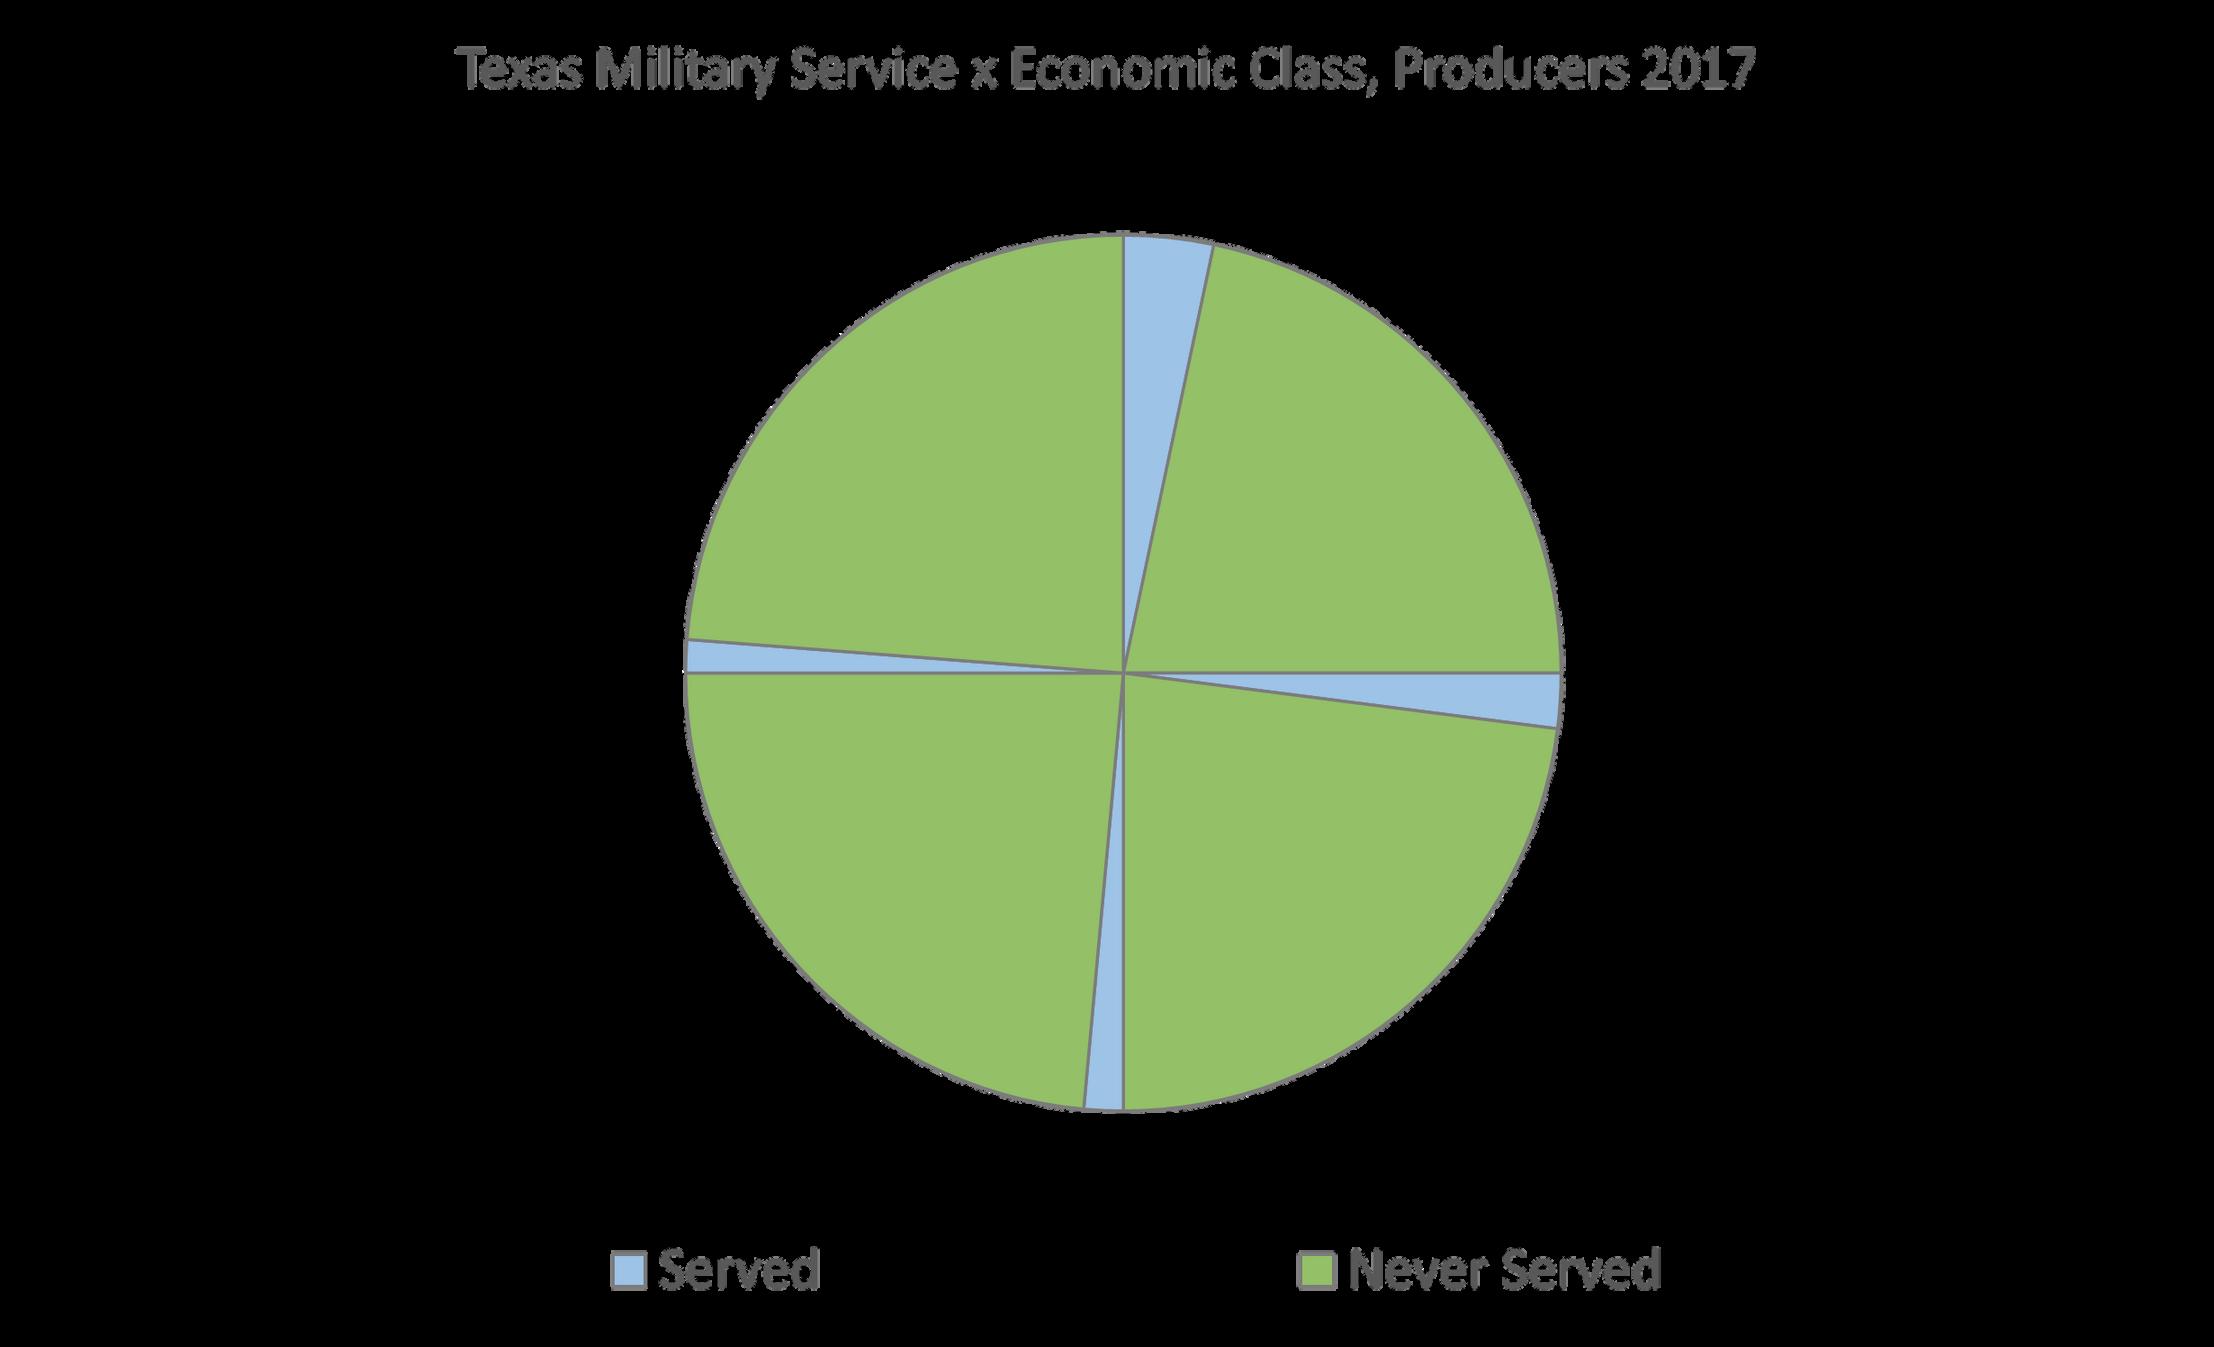

rved ver Served Overview ≥ 1,000 acres Farm Size ≤ 99 acres 100-499 acres txlandtrends org 21. MILITARY SERVICE A N A S S : T E X A S L A N D O W N E R SA TAG L A N C E Economic Class ≥ $1,000,000 ≤ $99,999 $500,000 - 999,999 $100,000 - 499,999

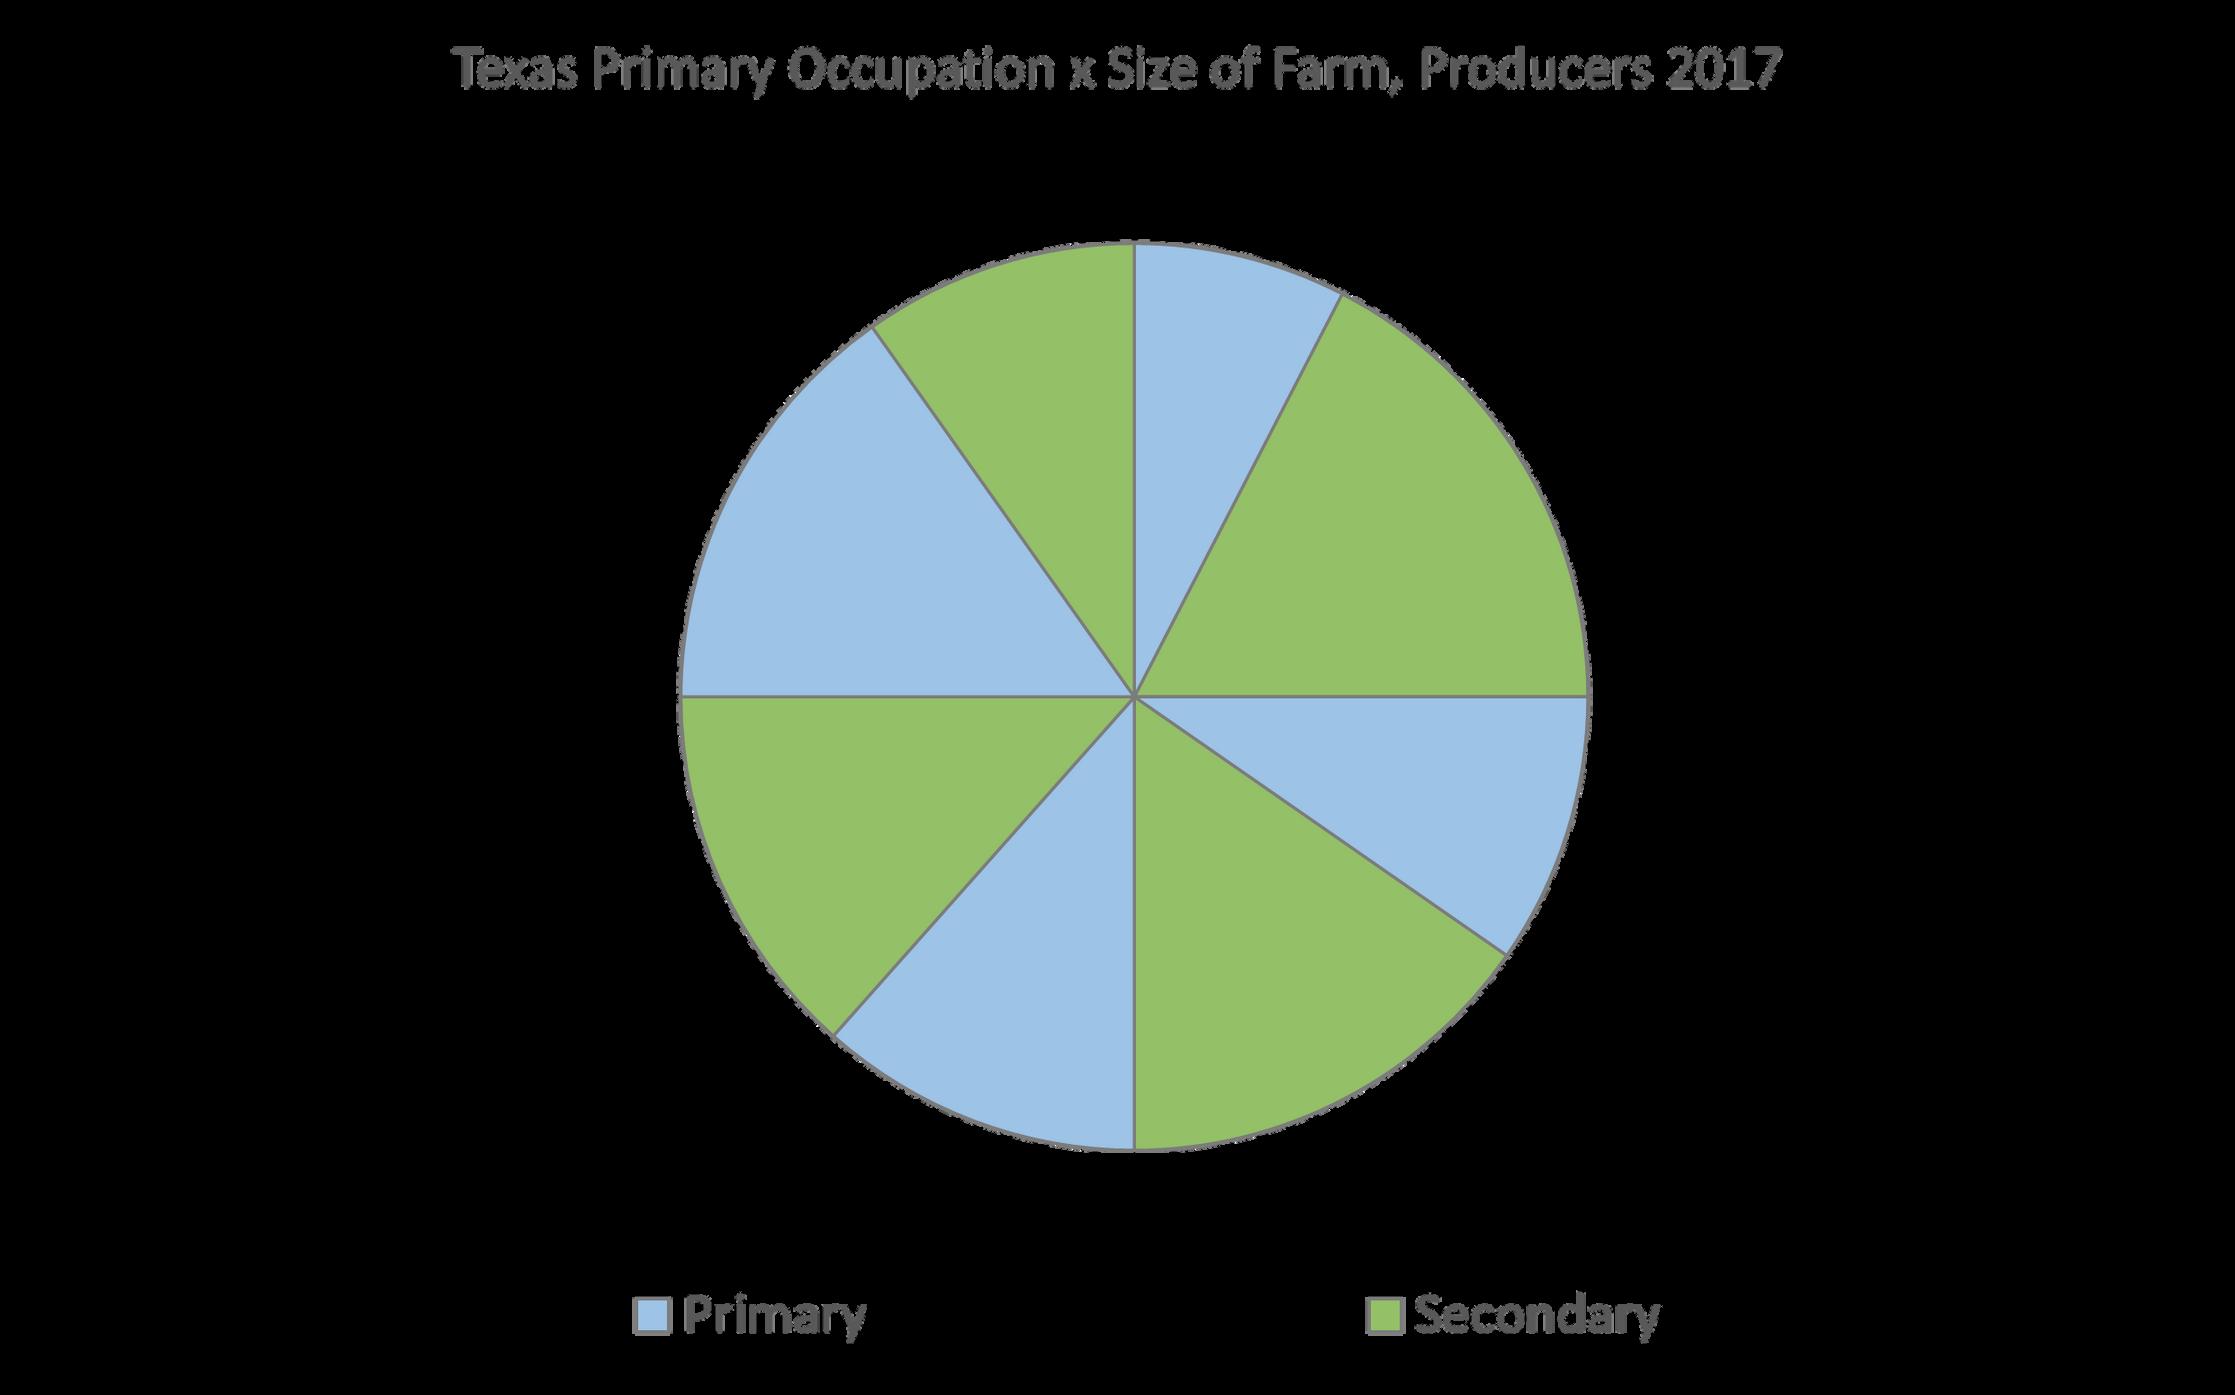


Secon Prima Overview Farm Size ≥ 1,000 acres ≤ 99 acres 500-999 acres 100-499 acres ds txlandtrends org Occ FARMING OCCUPATION U S D AN A S S : T E X A S L A N D O W N E R SA TAG L Economic Class ≥ $1,000,000 ≤ $99,999 $500,000 - 999,999 $100,000 - 499,999
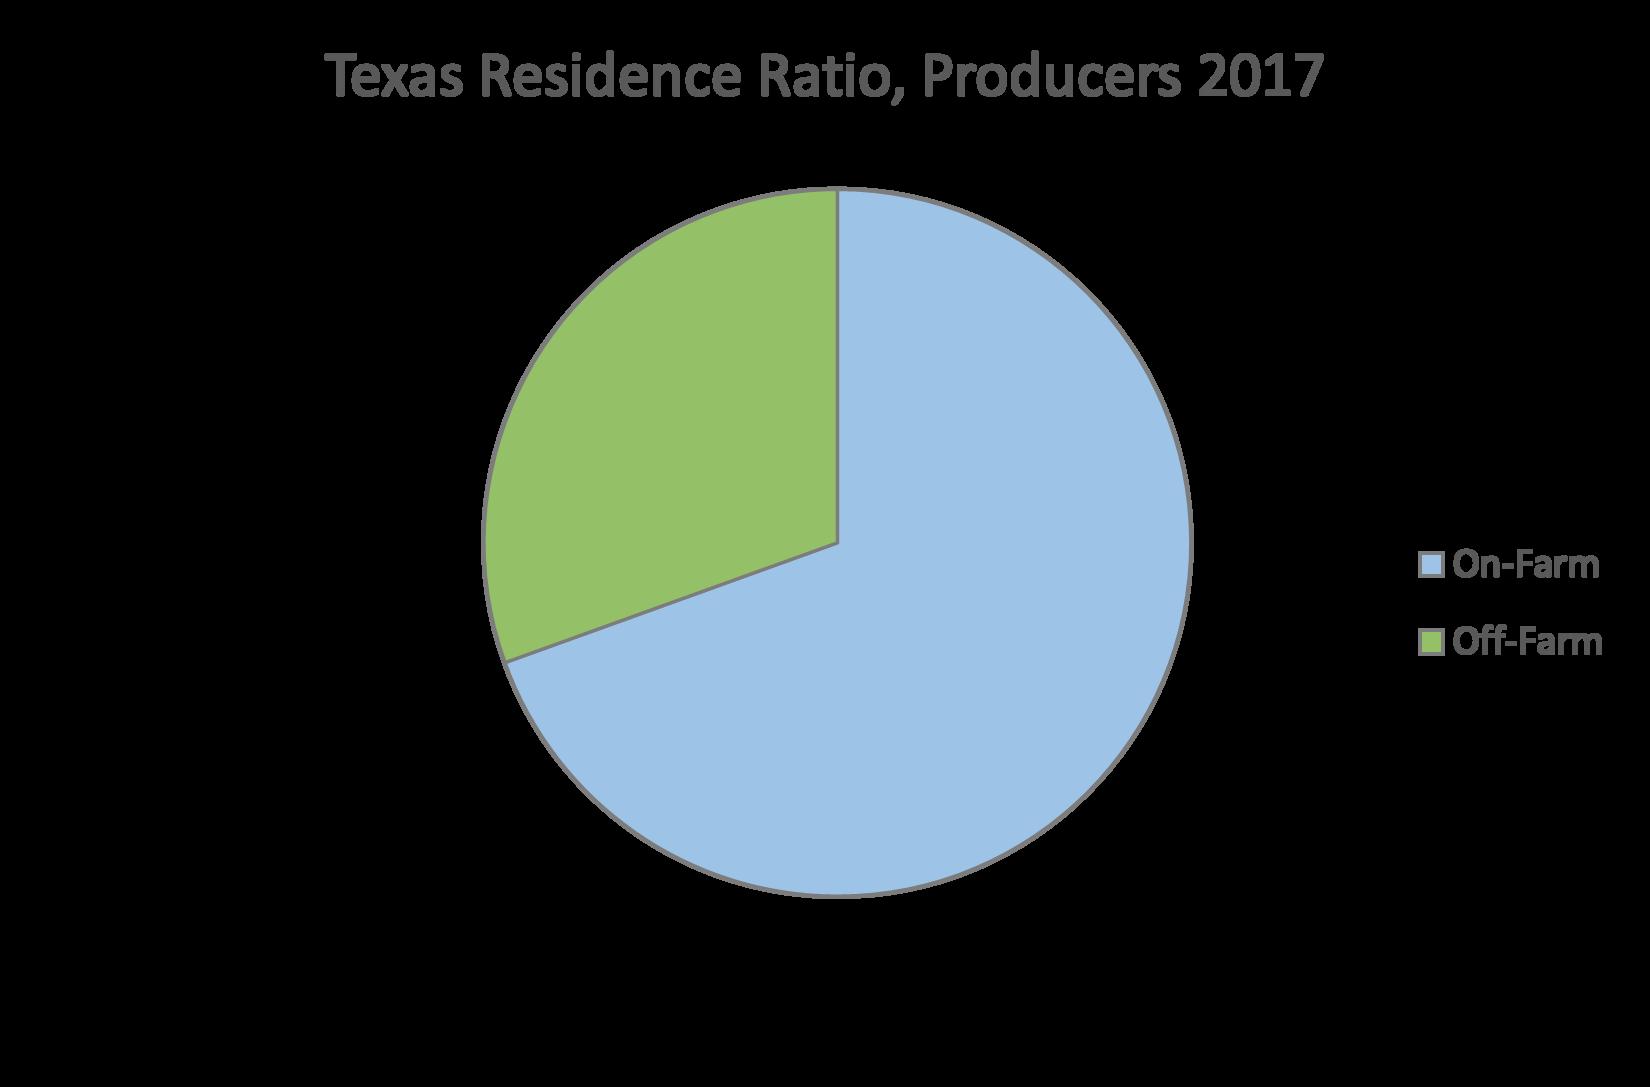
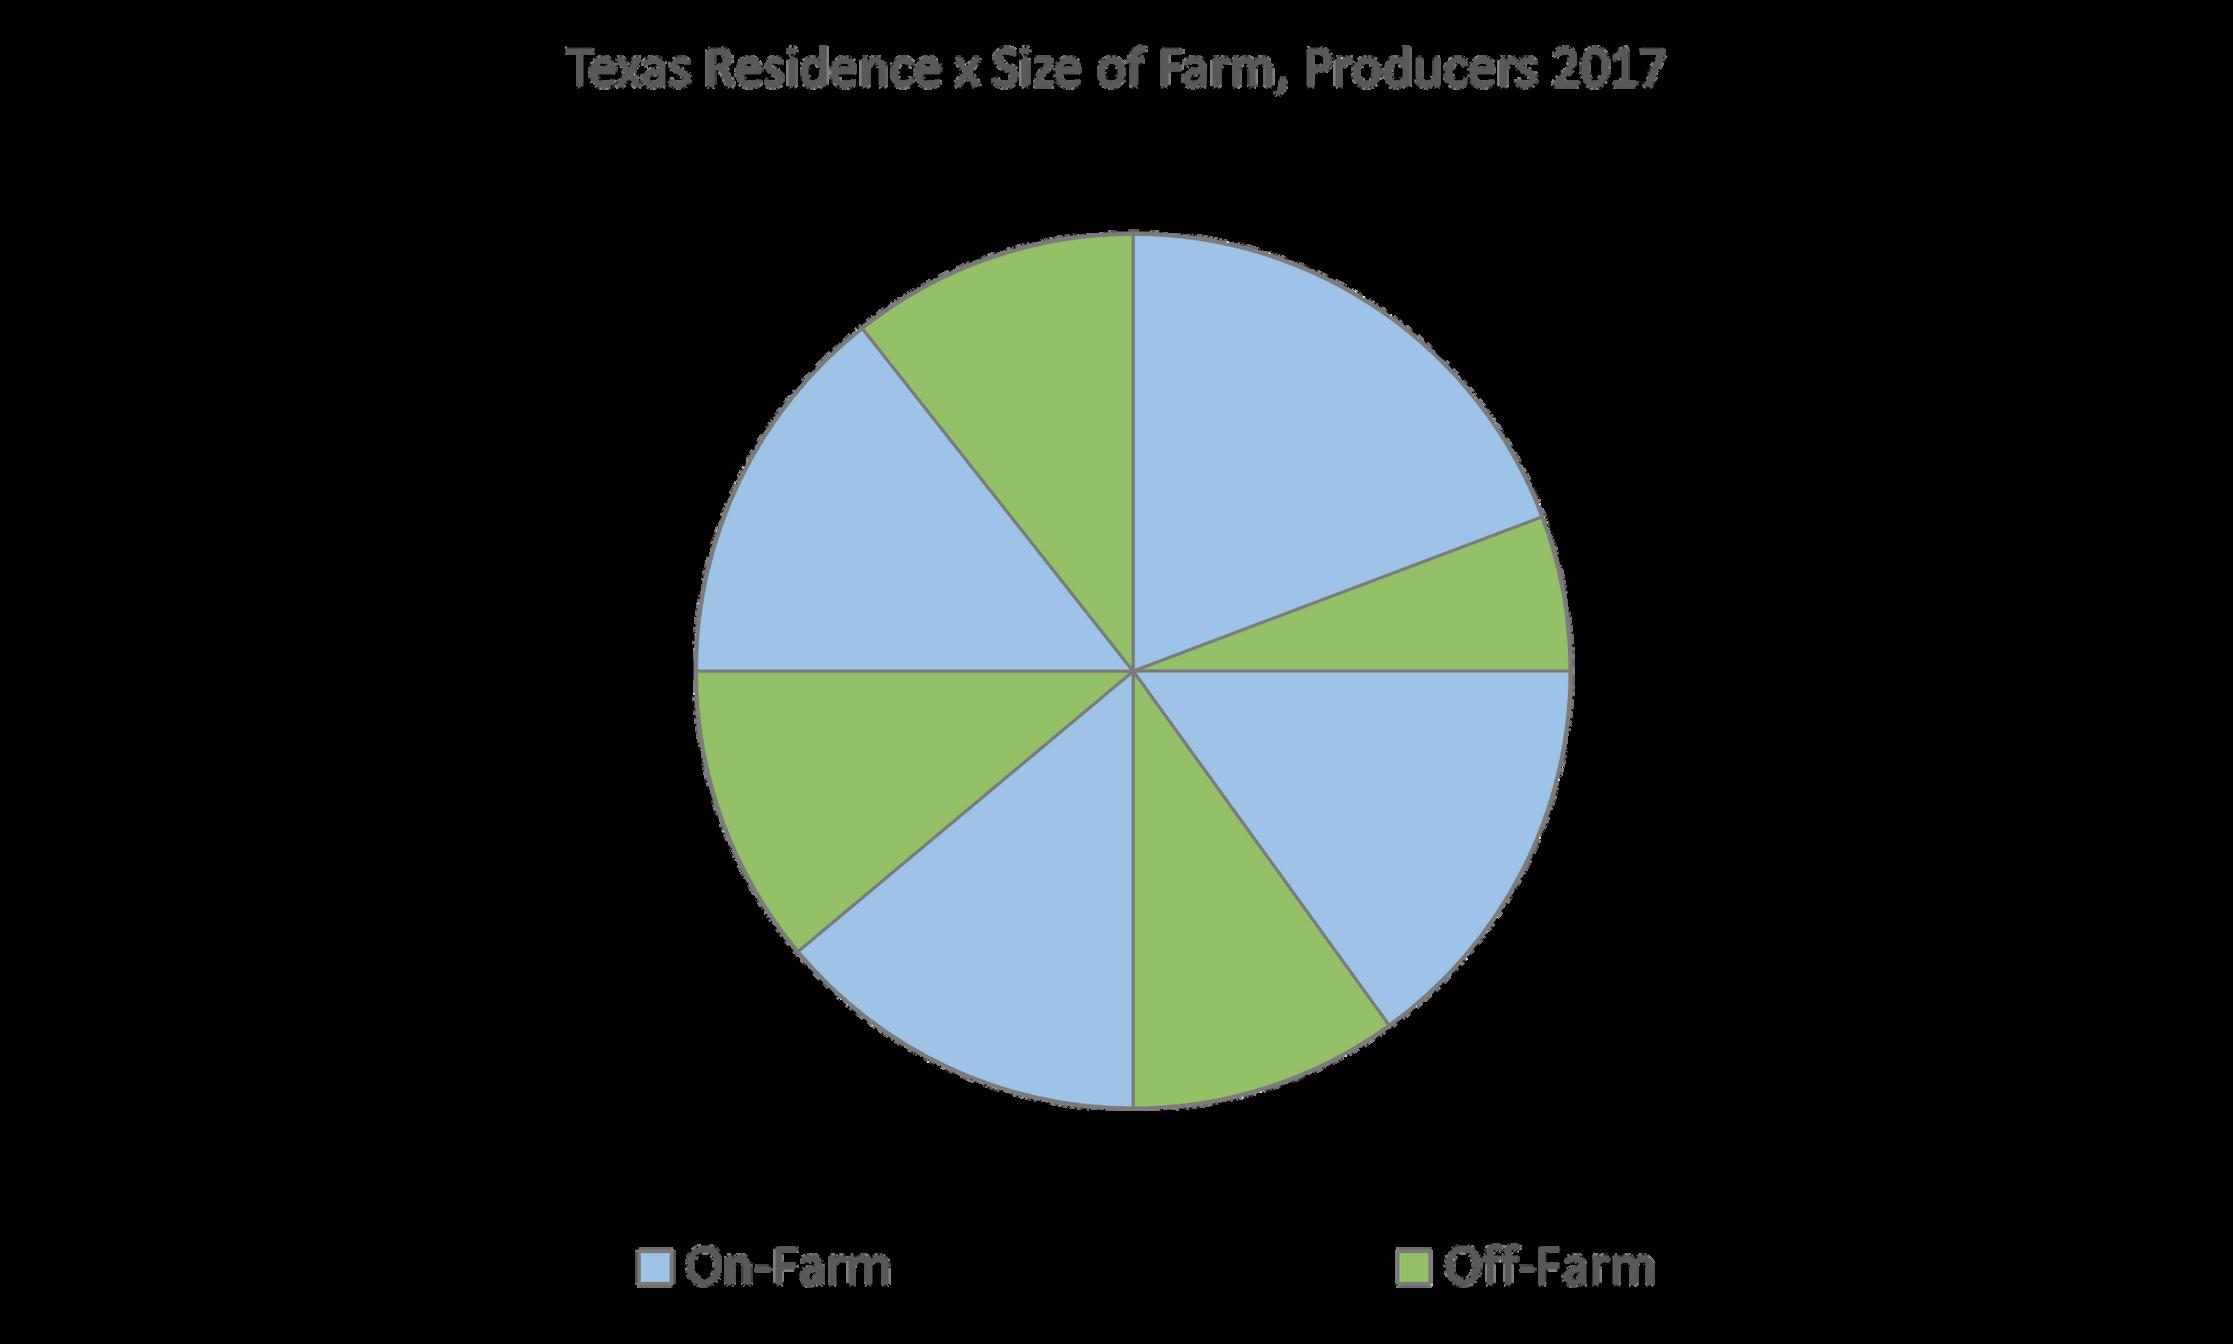


Overview txlandtrends org m RESIDENCE S : T E X A S L A N D O W N E R SA TAG L A N C E Farm Size ≥ 1,000 acres ≤ 99 acres 500 999 acres 100-499 acres Economic Class ≥ $1,000,000 ≤ $99,999 $500,000 - 999,999 $100,000 - 499,999
Off-Farm On-Farm
ECONOMIC CLASS BY FARM SIZE

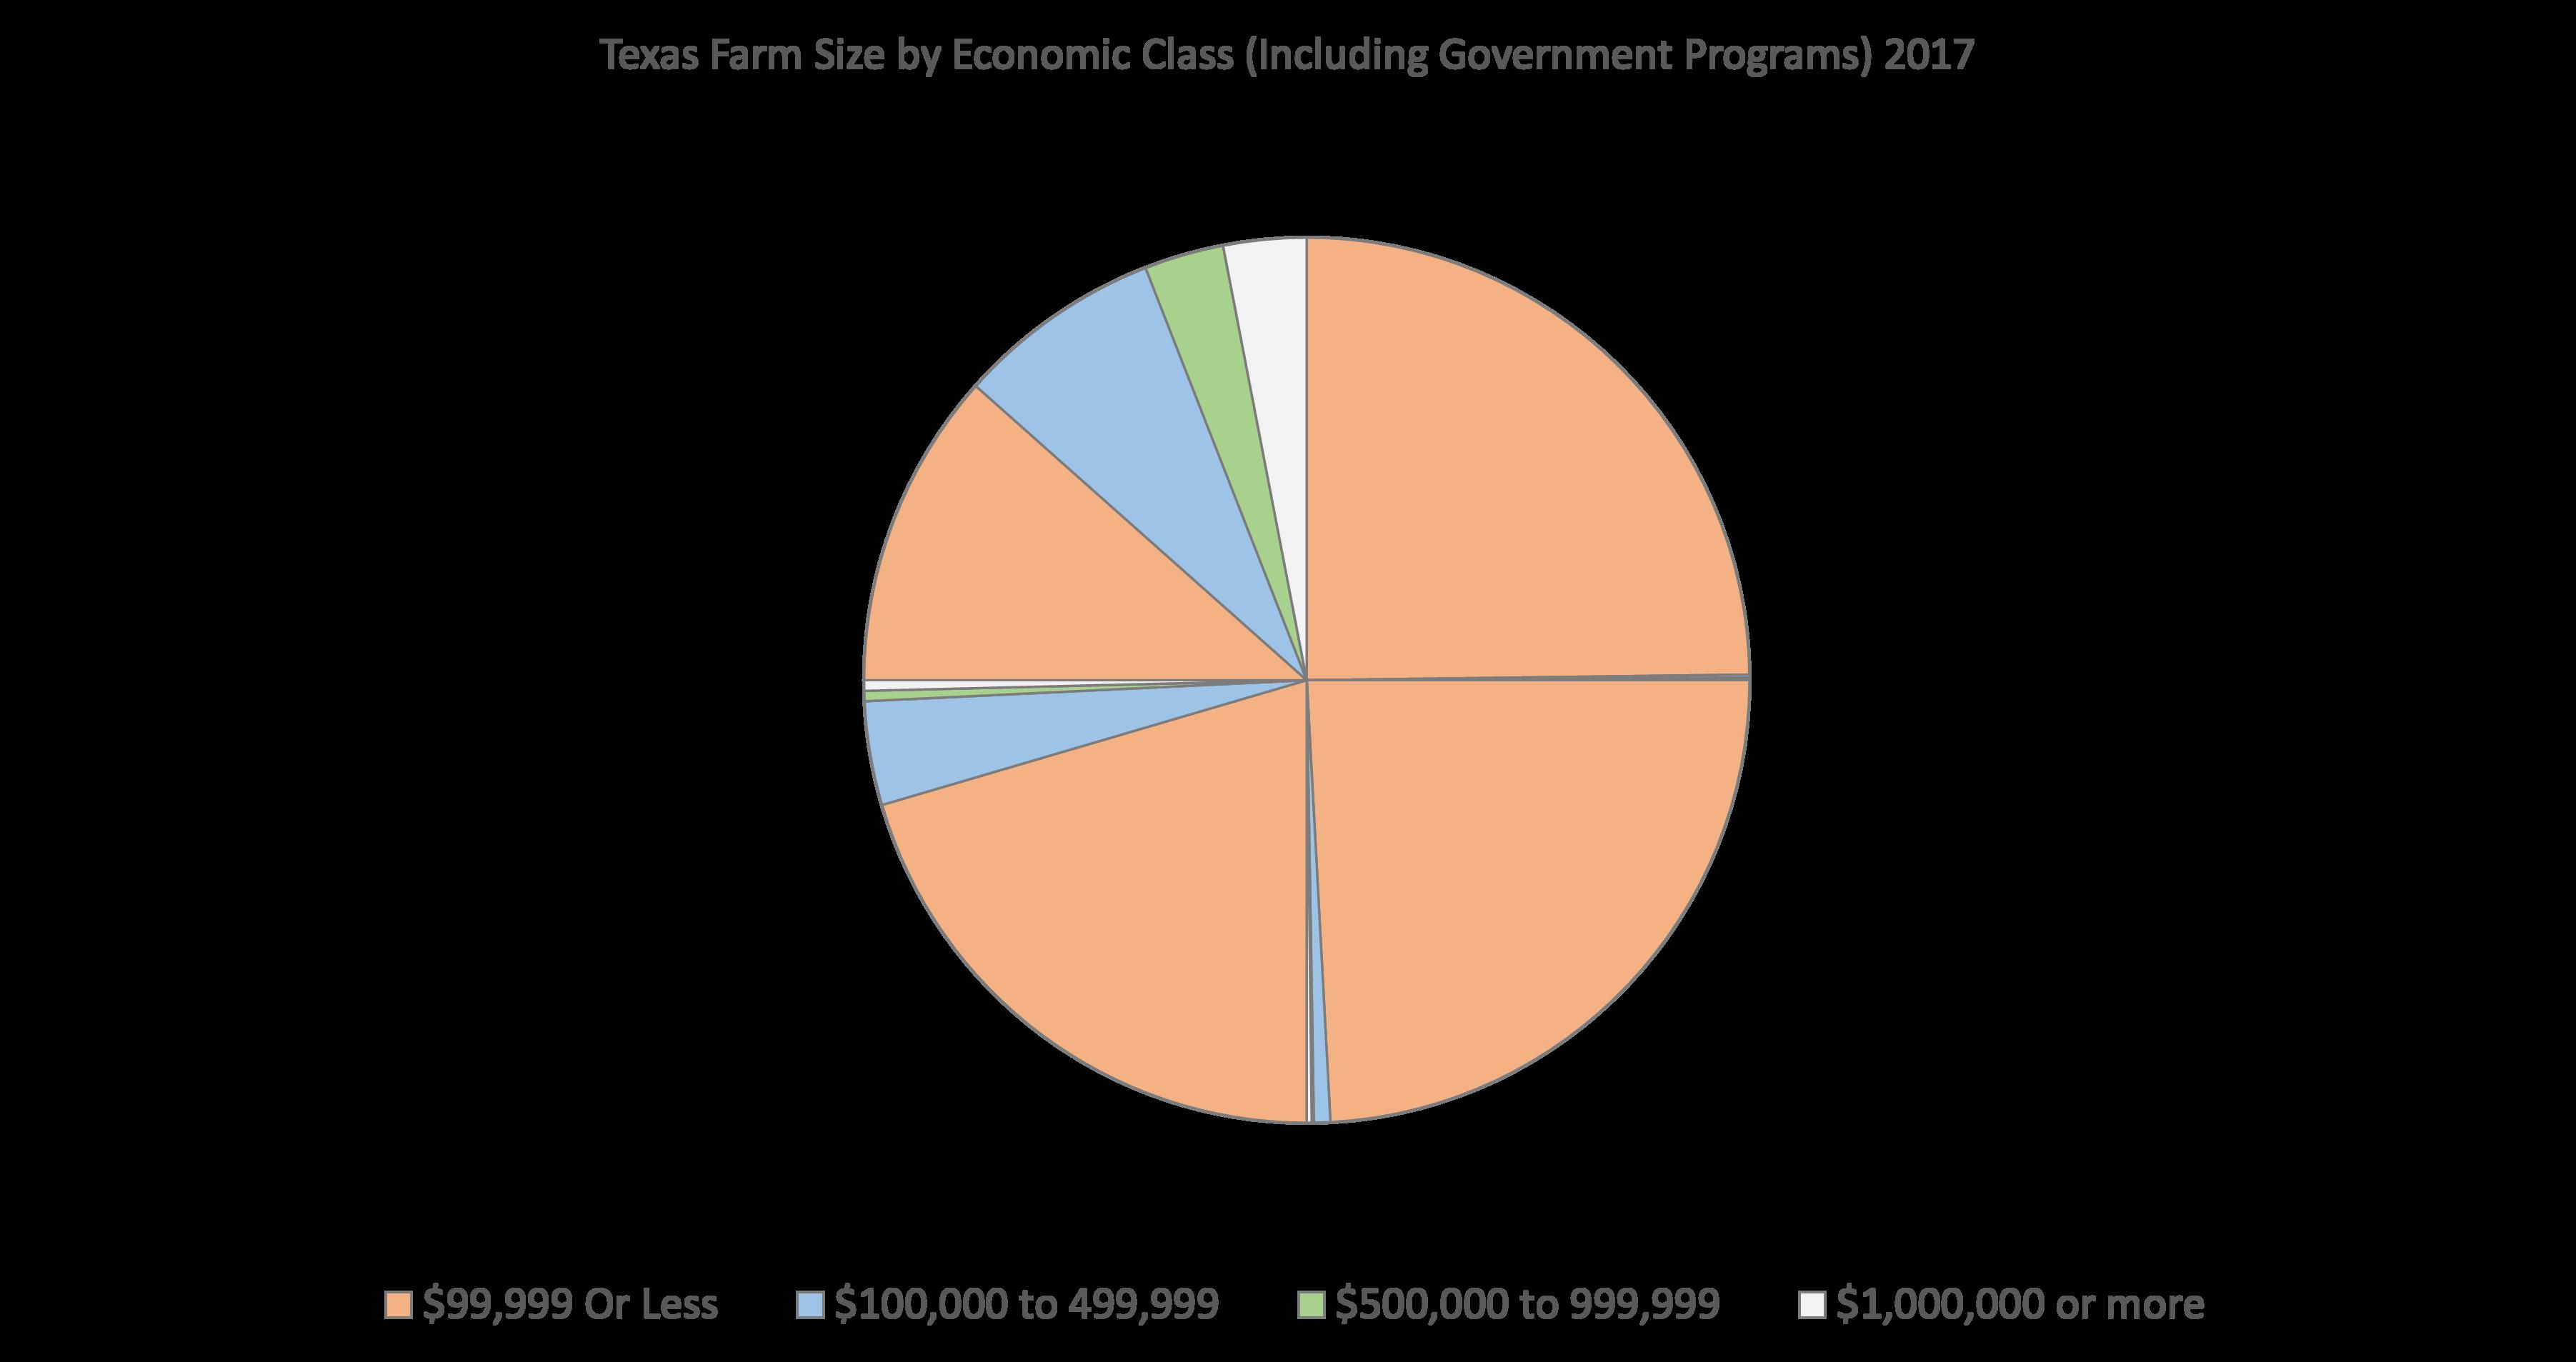 ≥ $1,000,000
≤ $99,999 $100,000 to 499,999
18 | Texas Land Trends txlandtrends org
$500,000 to 999,999
Figure 12. Texas Landowner Economic Class by Farm Size, USDA, 2021.
≥ 1,000 acres ≤ 99 acres
500-999 acres
100-499 acres
INTERESTS AND PREFERENCES
Texas Landowner Survey findings indicate that wildlife and recreational uses are important influences for owning land (Figure 13). When landowners were asked why they owned land, wildlife, family, and hunting were their top 3 reasons, closely followed by ranching and recreation, across both survey years. The most common recreational activities landowners enjoyed included hunting, wildlife watching and experiencing nature Respondents also managed their lands for a variety of game species ranging from big game, upland game birds and migratory game birds. For those who hunted, their preferred target wildlife species was overwhelmingly white-tailed deer. Based on their indicated preferences for wildlife, recreation and ranching, Texas landowners have a vested interest in stewarding lands, and when they receive information about managing their lands, they indicated a preference for email, in-person meetings and internet resources. Collectively, survey results validate that landowners have strong family ties to the land and place a high value on outdoor recreation.
2017 2022 2017 2022 2017 2022 2017 2022 2017 2022 Reasons for owning land Recreational activities Manage land for these wildlife species... Primary species hunted on land... Preferences for acquiring information Wildlife Family Hunting Ranching Recreation Hunting Wildlife watching Experience nature Ranching Fishing Big game animals Upland game birds Migratory game birds Non-game birds Pollinators White-tailed deer Feral hogs Coyotes Dove Turkey Email In person meeting Internet resources Field day/tour Print 19 | Texas Land Trends txlandtrends org
Figure 13. Texas Landowner Interests and Preferences, 2017 and 2022.
Landowner Respondents (%) 0 20 40 60 80 100
PROGRAM PARTICIPATION


Landowners carefully select programs that are beneficial to the stewardship of their properties and participate in those programs that will help them accomplish their land management objectives. The survey measured landowner willingness to participate in a variety of programs, and the top three preferred programs included tax valuations, landowner cooperatives, and technical assistance programs (Figure 14).
2022 2017 2022
txlandtrends org 20 | Texas Land Trends
Figure 14. Texas Landowner Interests and Preferences, 2017 and 2022.
Interest in participating in landowner programs
Given that approximately 40% of landowners in Texas are over 65 years of age,³ we asked respondents to consider land management planning, projecting 10 years into the future and their likelihood of engaging in a variety of proposed activities within that time frame (Figure 15). Thirty five percent (2017) and forty eight percent (2022) of respondents were over the age of 65, resembling the state’s age pattern This landowner group indicated they were more likely to transfer their land to a significant other in the next 10 years (64% in 2017 and 58% in 2022), than to not transfer their land (24% in 2017 and 30% in 2022). Given that most respondents were primarily between the ages of 40-80 across both survey years, covering pre- and post-retirement ages for many Texas landowners, estate planning and long-term land tenure transfers were topics of interest. Survey responses also suggest developing appropriate and engaging intergenerational land transfer informational materials that would encourage the conservation of rural working lands. The survey also asked landowners to consider their likelihood of participating in other land
conservation programs. At face value, approximately 50% (2017) and 70% (2022) of respondents in all age categories indicated they were not likely to implement a conservation easement. However, an opportunity exists to engage at least 15% (2017) and 13% (2022) of survey respondents, who indicated they were likely to participate in this long-term conservation program. Extrapolated to the general Texas landowner population, this suggests that approximately 37,200 (2017) and 32,240 (2022) rural landowners, whose operations may vary by size, share an interest in conserving their land via a conservation easement. Similarly, in 2017, 69% of landowners (81% in 2022) did not see themselves selling all or part of their land over the next 10 years. This suggests not only a financial but also an emotional investment in the land where landowners may want the next generation to experience the same benefits enjoyed by current landowners. These are promising results suggesting an overall interest in land stewardship programs that have the potential to transform and improve Texas lands for future generations.

21 | Texas Land Trends txlandtrends org


Landowner Respondents (%) 2017 2022 Lease land Implement a conservation easement Pay someone to manage land Sell part of land Very likely Neither likely nor unlikely Somewhat unlikely Not at all likely Somewhat likely txlandtrends org 22 | Texas Land Trends
Figure 15. Texas Landowner Activity Engagement, 2017 and 2022.
CONCERNS AND CHALLENGES

Landowner respondents expressed many concerns and challenges in the management of land (Figures 16 and 17). At a state level, there was close agreement among landowner responses that water ownership, increasing human population, invasive species, water conservation, and habitat loss or land fragmentation were the five most common challenging issues. Landowners appeared to have a general understanding that statewide natural resource challenges may impact their operations.
At a county level, throughout the state, landowners were concerned with groundwater ownership, private property rights, property taxes, estate taxes, and landowner liability (2017) or water demand and supply (2022). Landowner responses were nearly uniform across the first three categories. In a separate, independent study of county leader concerns, groundwater, water ownership and land rights also were highlighted.⁴
In the Texas Landowner Survey, some landowners offered specific examples to describe their concerns and regardless of operation size, the general themes from the survey resonated with landowners at the local level. In general terms, landowners expressed that their ownership rights were being restricted and in some instances felt a loss of control. They also expressed concern for taxes with respect to impacts on property affordability Providing landowners with program options, information, or technical assistance on these common local challenges will continue to be an important role for natural resource agencies to serve in helping landowners' continued land stewardship.
23 | Texas Land Trends txlandtrends org


txlandtrends org 24 | Texas Land Trends Landowner Respondents (%) 2017 2022
Figure 16. Texas Landowner Concerns at a County Level, 2017 and 2022.
Landowner Challenges
Landowner Respondents (%)


2017 Endangered species 0 20 40 60 80 100 25 | Texas Land Trends txlandtrends org
Figure 17. Texas Landowner Challenges at State Level, 2017 and 2022.
LAND FRAGMENTATION
Land fragmentation is occurring at varying degrees across the state, as noted in several Texas Land Trends publications that have discussed land loss, conversion and fragmentation, the potential influence these may have on landscapes, ecosystem services and operations, along with the many variables that facilitate its occurrence. Our survey sought to determine landowner perceptions of fragmentation occurring at state and local levels. In general, 60% (2017) and 72% (2022) of landowners who responded to the survey felt habitat loss and land fragmentation were challenges across the state. Understanding that all landowners are unique, we wanted to determine if there were differences in level of concern towards fragmentation among two landowner groups, on-farm landowners and off-farm landowners, using the county where their largest property was located as the point of reference (Figure 18). Both groups expressed concern. With some exceptions, on-farm landowners expressed a greater degree of concern (darker shaded areas on map) than off-farm landowners (Figure 19). In some instances, both landowner groups held differing levels of concern for similar counties. For instance, when we compare the areas south and west of San Angelo, TX, both landowner group maps have different shades for the same counties, as do some other areas of the state. One plausible explanation may be associated with differences in how each group (on-farm or off-farm landowner) perceives fragmentation, where both may agree that fragmentation is unfavorable yet they may not agree on the exact instance or level when fragmentation becomes more unfavorable (i.e., how much is too much?).

txlandtrends org 26 | Texas Land Trends
ON-FARM LANDOWNER
Private landowners whose permanent residence is located in the same county as their rural working land.
OFF-FARM LANDOWNER
Private landowners whose permanent residence is not located in the same county as their rural working land.
Houston Area Resident
Dallas-Fort Worth Area Resident
Austin-San Antonio Area Resident
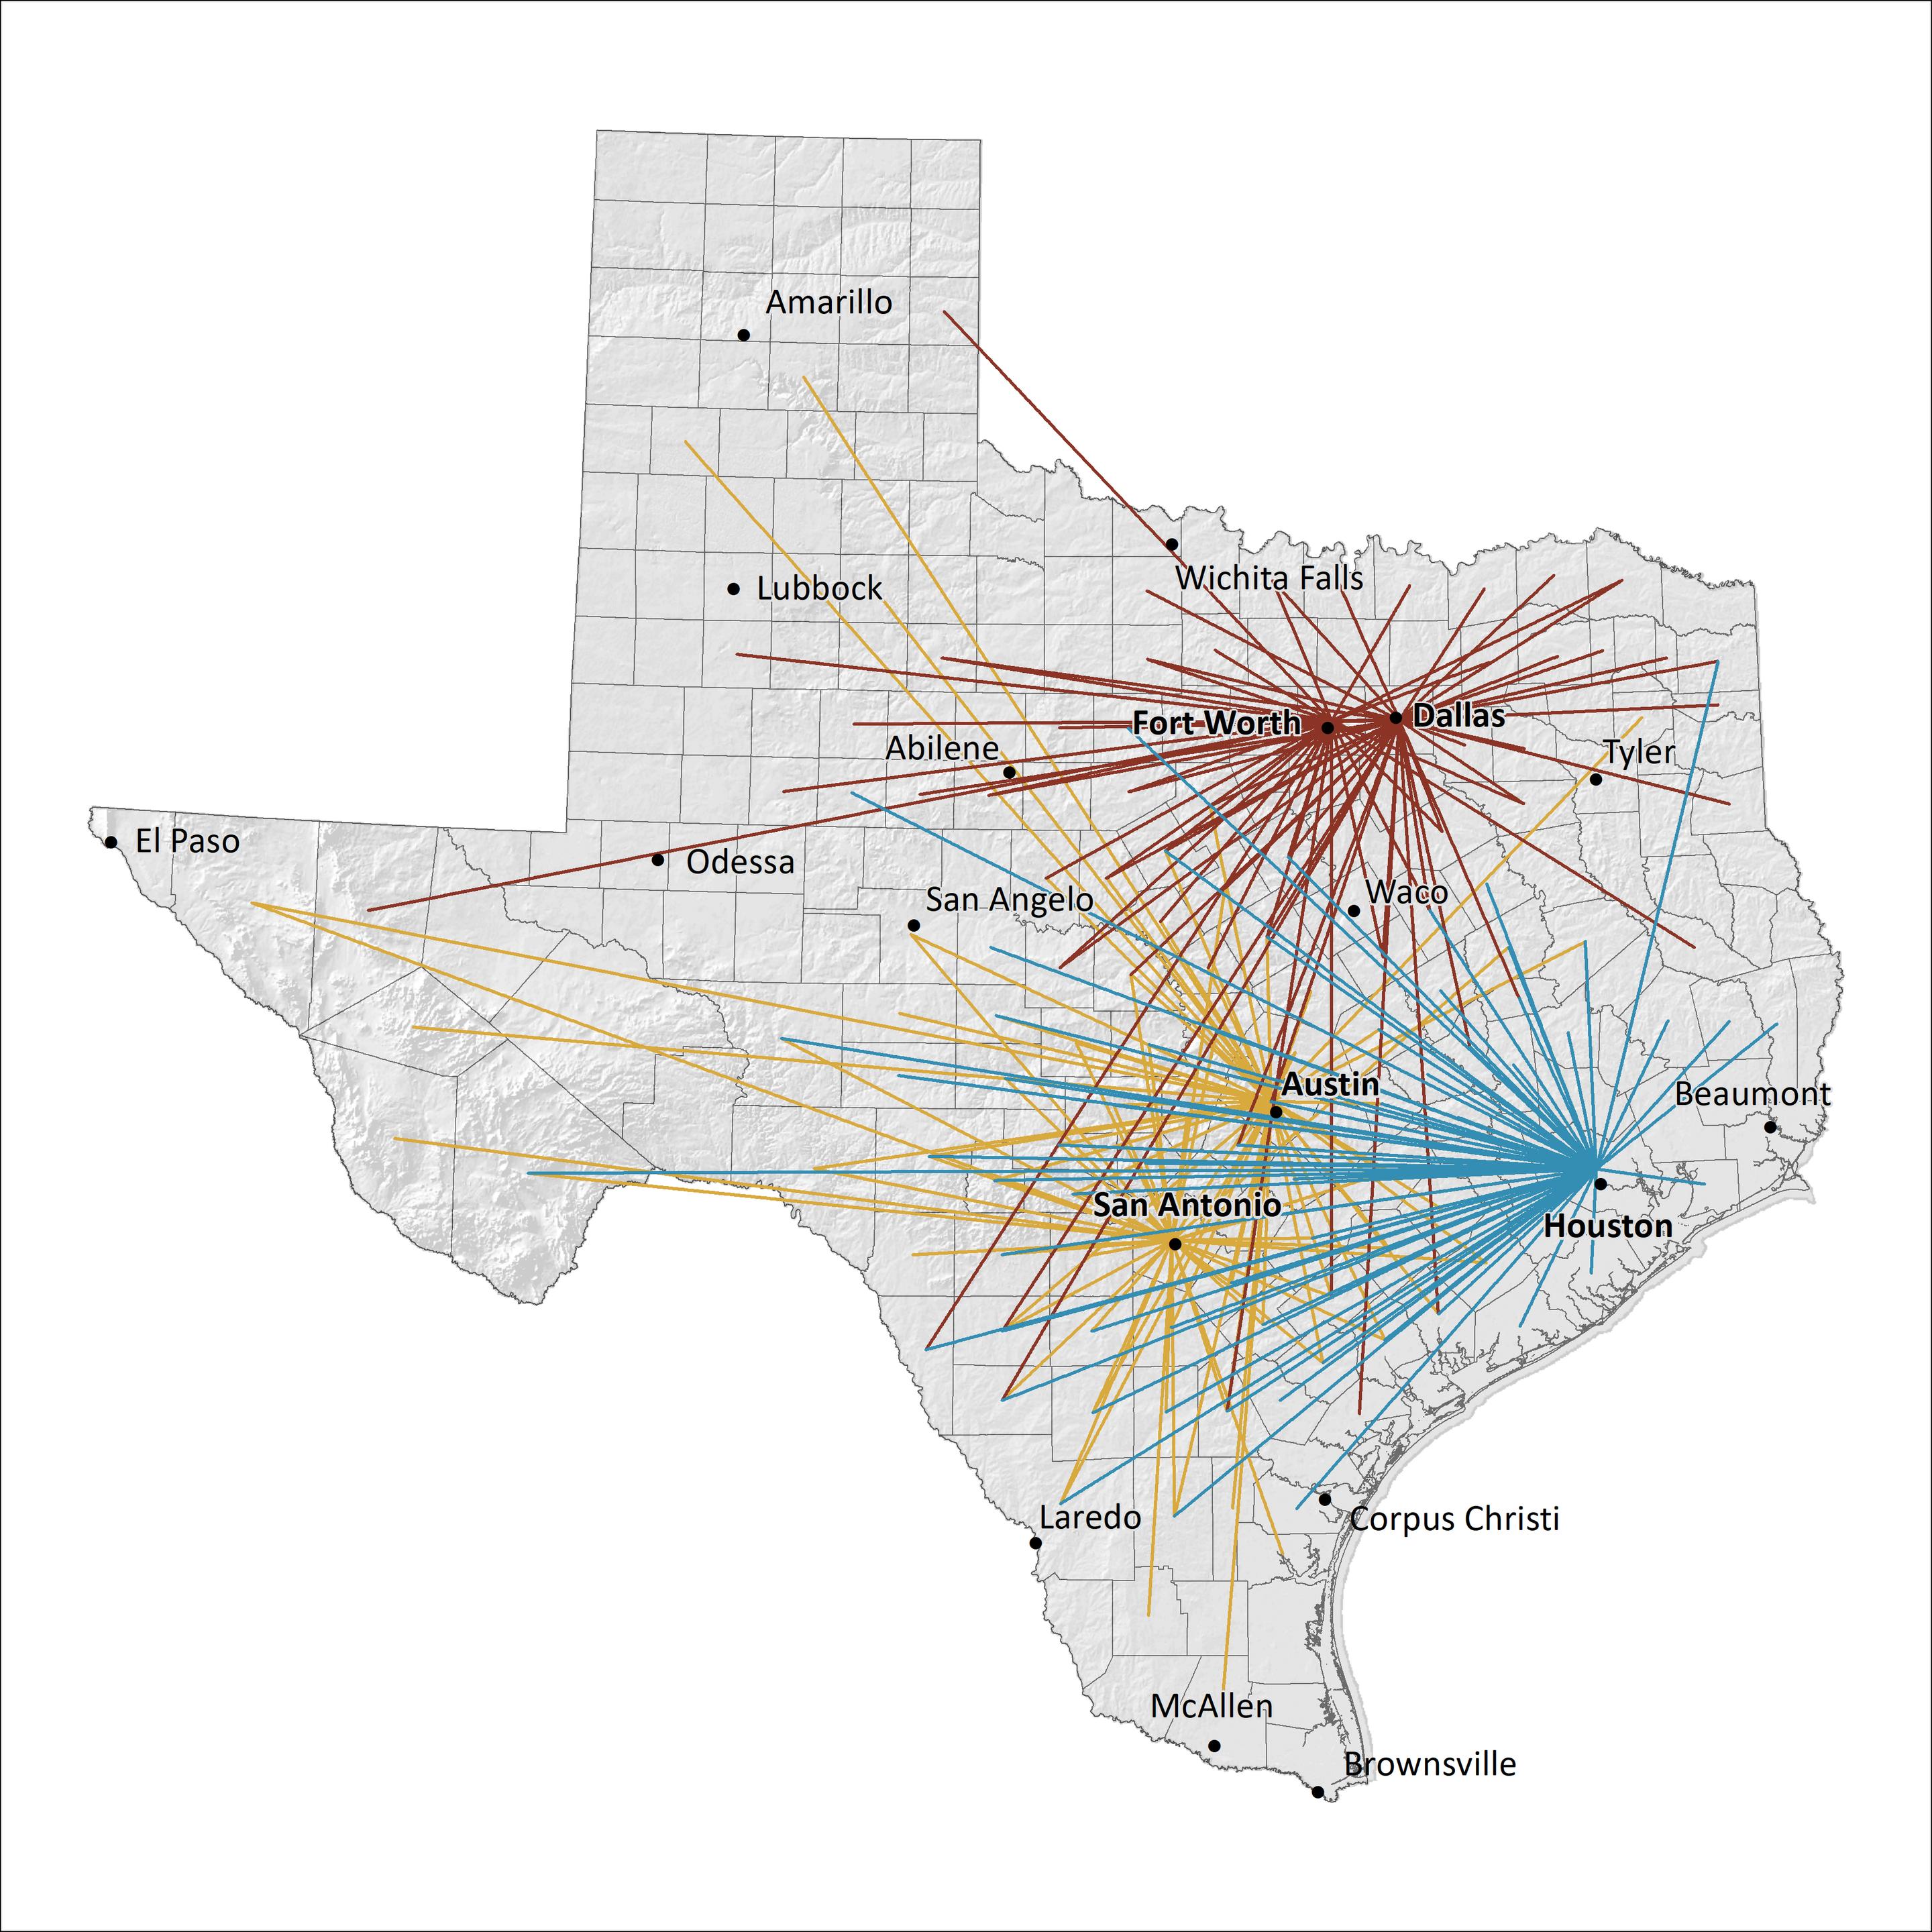 Figure 18. Distance Landowners Travel to Steward Their Land (Major Texas Metropolitan Areas).
27 | Texas Land Trends txlandtrends org
Another explanation may be associated with the level of exposure and frequency respondents had to fragmentation processes as they occurred in these counties.
We also wanted to understand how fragmentation on the ground compared with general landowner fragmentation concern in the counties where their largest property was located. To do this, we considered the projected Fragmentation Risk Index ³ ⁴ ⁵ and fragmentation concern levels of on-farm and off-farm landowners. This projected index provides a visual representation of how fragmentation associated variables are likely to impact future land uses and assigns counties a fragmentation risk value from high to low. We compared the Fragmentation Risk Index with actual county land fragmentation concern levels for both landowner groups across the state (Figure 20). As expected, on-farm
and off-farm respondents who owned land in high risk counties and surrounding counties harbored the greatest fragmentation concern, when compared to those in relatively lower risk counties. Landowners in comparatively low risk counties, despite differences, still held moderate fragmentation concern levels, approximately 52% for on-farm landowners and 44% for off-farm respondents.
According to the survey, landowners across the state appear to agree that fragmentation is a concern, and this may offer an opportunity to engage interested landowners on common ground approaches to land stewardship and conservation, particularly those they already find appealing, such as tax valuations, landowner cooperatives, technical assistance programs, and market-based incentives at county, regional and state levels.

txlandtrends org 28 | Texas Land Trends , ,
, ,
ON-FARM LANDOWNERS
OFF-FARM LANDOWNERS
County
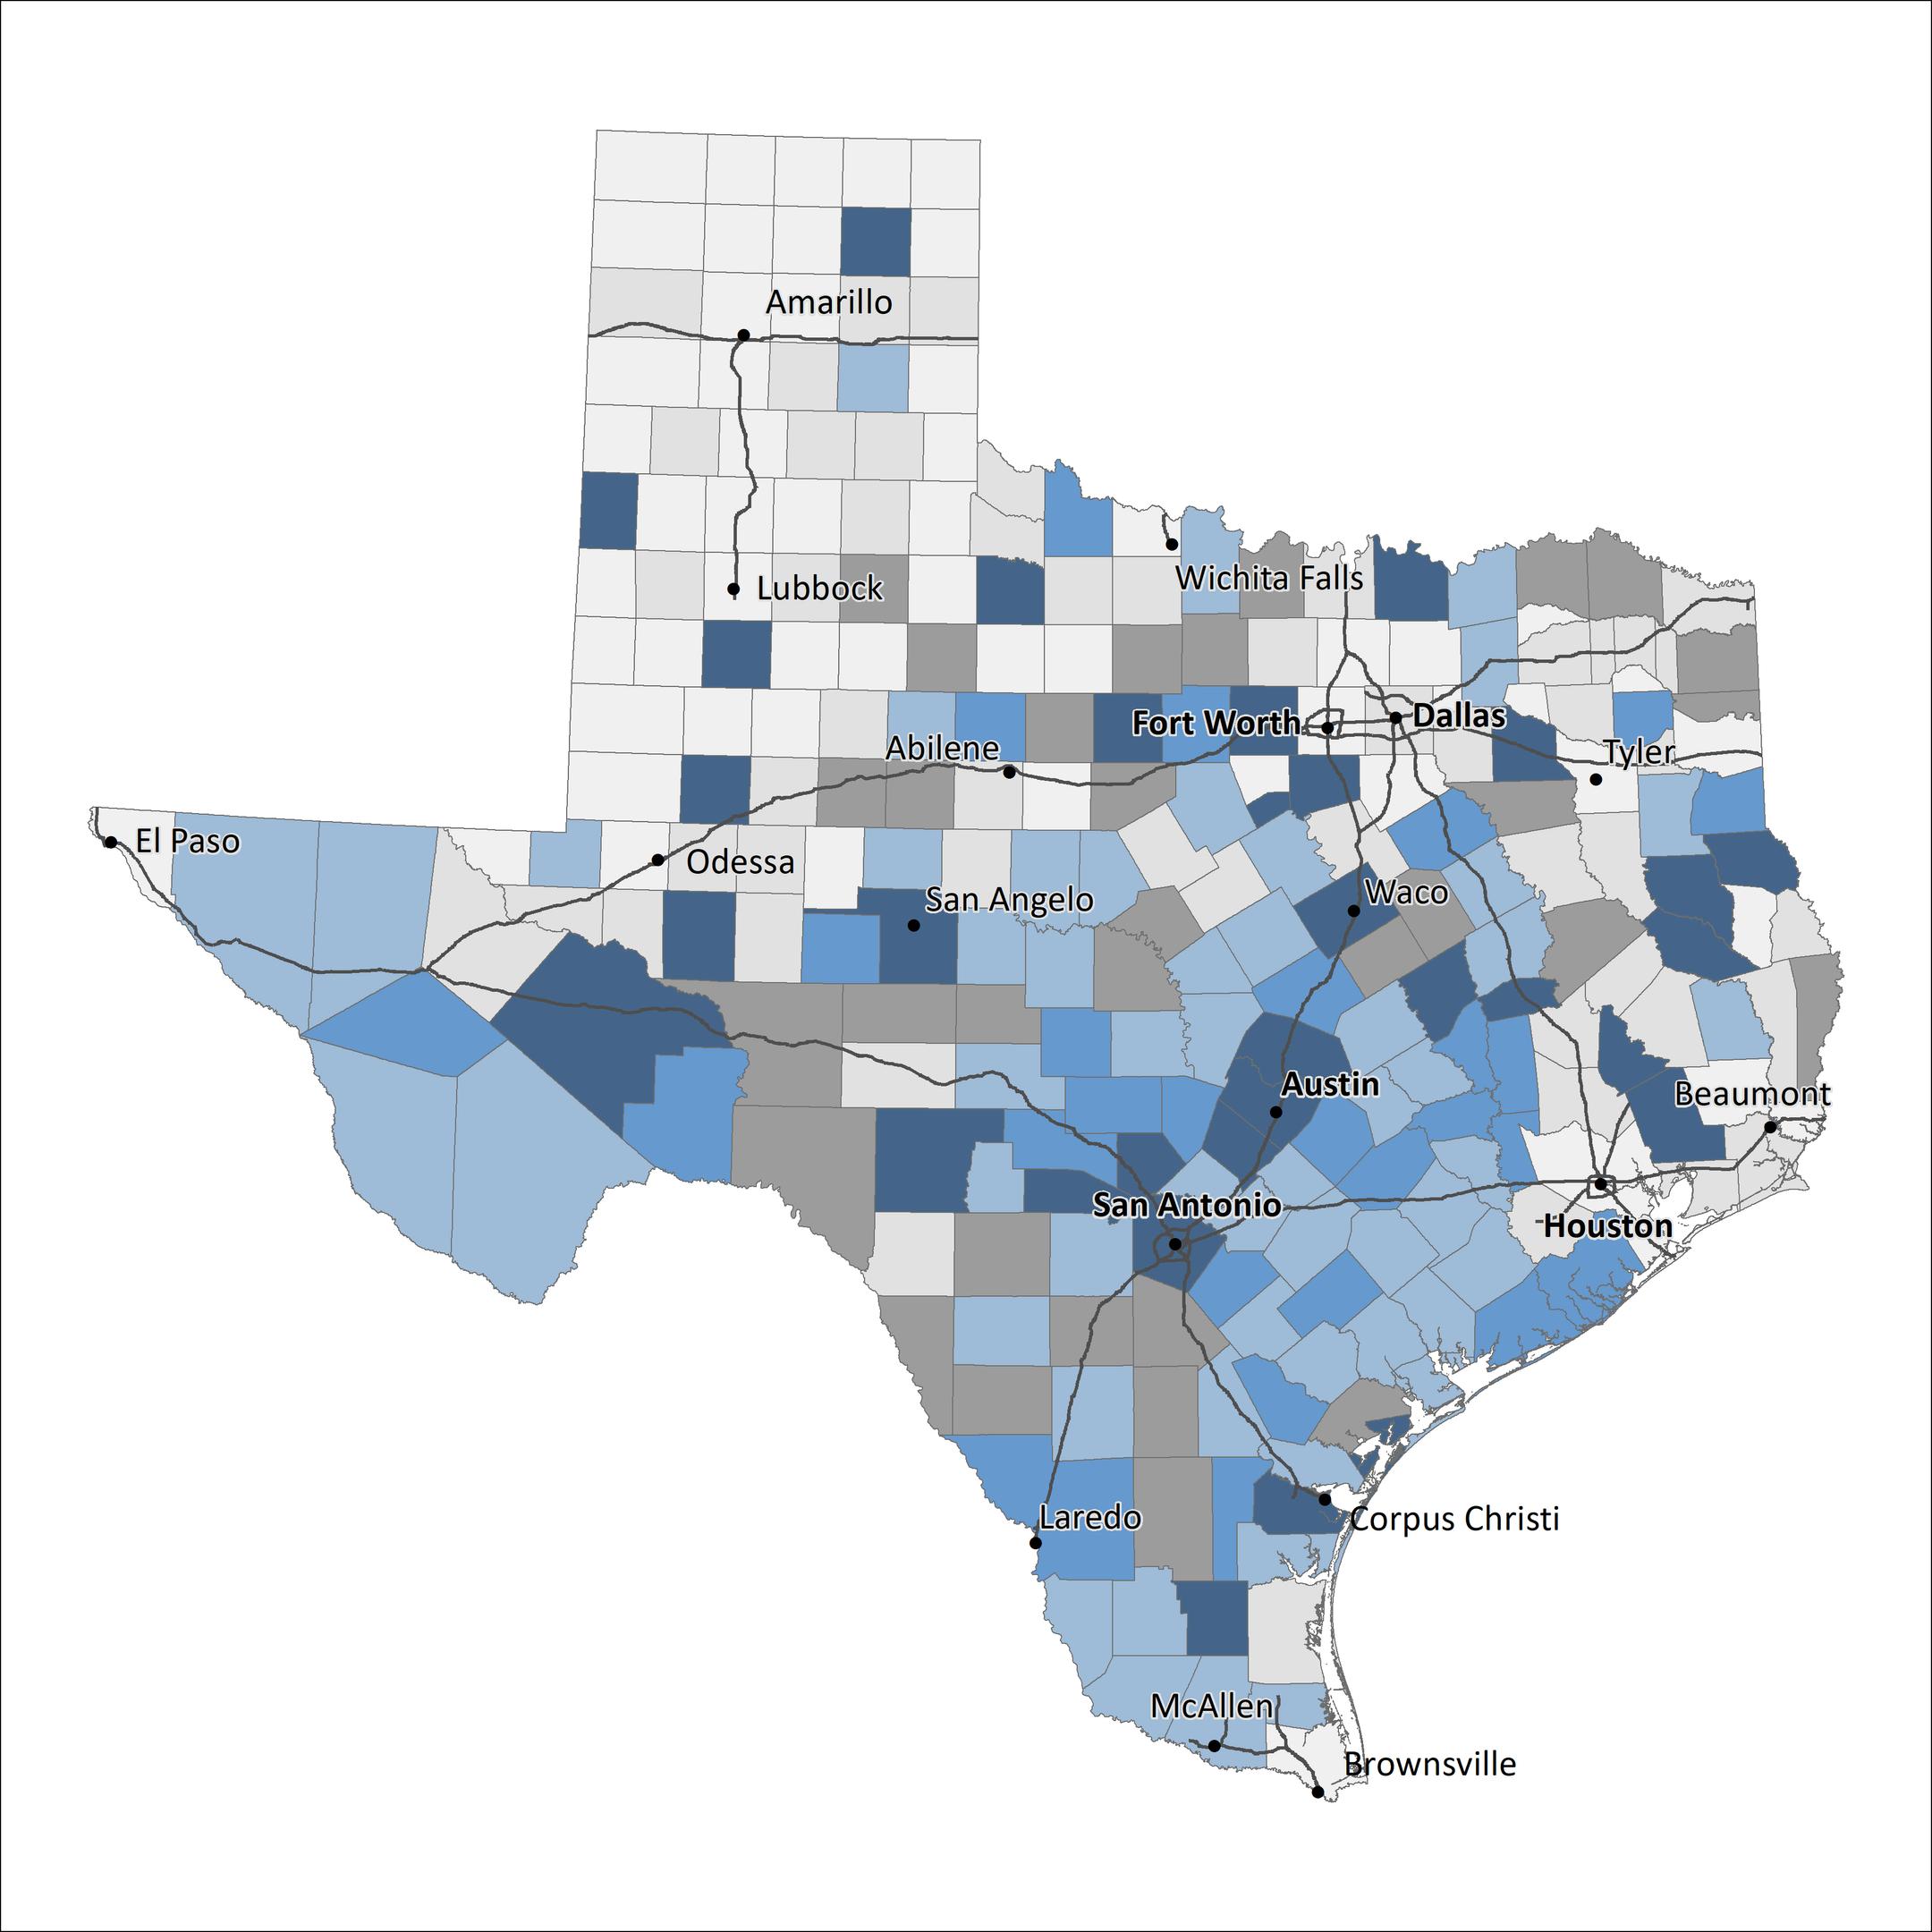

< 20% 20% - 40% 40% - 60% 60% - 80% > 80% < 20% 20% - 40% 40% - 60% 60% - 80% > 80%
Figure 19. County Land Fragmentation Concern at Location of Largest Property, by Landowner Type.
land fragmentation concern (%) 29 | Texas Land Trends txlandtrends org
County
land
fragmentation concern (%)
County
 Land Fragmentation Concern
0% 10% 20% 30% 40% 50% 60% 70% 80%
On-Farm Landowner Off-Farm Landowner
High Risk Moderate Risk Low Risk FRAGMENTATION RISK INDEX
txlandtrends org 30 | Texas Land Trends
Figure 20. Comparison Between Fragmentation Risk Index and County Land Fragmentation Concern at Location of Largest Property by Landowner Type.
FINAL THOUGHTS
The Texas Landowner Survey provides an overview of private working land stewards in action, their concerns, objectives and preferences. Texas rural lands are changing, and we are finding that landowners are generally less economically dependent on the land than they have been in the past. This characteristic offers several opportunities from an open-space land conservation perspective. First, landowners are connected to the land through family, legacy, wildlife, ranching and recreation Second, landowners are increasingly using technology to steward their land and to communicate with resource professionals. Finally, landowners are open to dedicated land steward support networks or landowner advocacy groups where various formal and informal programs and resources are made available These may assist landowners as they navigate challenges associated with maintaining their lands.

Thank you to everyone who responded to the Texas Landowner Survey!
A special thanks to USDA-NASS for all they do!
REFERENCES
1. Smith, L. A., R. R. Lopez, A. A. Lund, B. N. Wegner, J C Cathey, A Lopez, R E Anderson, G. W. Powers, K. L. Skow, M. A. Crawford 2019 Status Update and Trends of Texas Working Lands. Texas A&M Natural Resources Institute, College Station, TX, USA.
2. United States Department of Agriculture - National Agricultural Statistics Service. 2021. 2017 Census of Agriculture.
3 Lund, A A , A L Smith, A Lopez, and R R. Lopez. 2017. Texas Landowner Changes and Trends Texas A&M Natural Resources Institute, College Station, TX, USA.
4. Texas A&M Natural Resources Institute. 2018 Challenges to Rural Texas Natural Resources. Pages 133–183 in A Report for the Future of Rural Texas: a Texas Tribune Symposium. Texas Rural Funders Collaborative. Austin, TX, USA.
5. Lopez, A., A. A. Lund, M. A. Crawford, L. A Smith, K L Skow, J G Cross, L A Harveson and R. R. Lopez. 2019. Trends in Land Ownership Along Texas Borderlands Texas A&M Natural Resources Institute, College Station, TX, USA
31 | Texas Land Trends txlandtrends org


CONTACT
Questions about the report? Contact Angelica Lopez alopez@ag.tamu.edu Texas A&M Natural Resources Institute 1001 Holleman Dr. E College Station, Texas 77840 txlandtrends.org
US


 ≥ $1,000,000
≤ $99,999 $100,000 to 499,999


 Figure 18. Distance Landowners Travel to Steward Their Land (Major Texas Metropolitan Areas).


 Land Fragmentation Concern


