


Real Life Examples & Aswath’s Data

Real Life Examples & Aswath’s Data
Mergers & Acquisitions
Equity Financing
Regulatory & Accounting
Requirements
Litigation & Disputes
ESOPs & Employee
Incentives
Strategic Decision Making
Performance Measurement
Projects future cash flows and discounts them back to the present using the cost of capital. The Cost of Equity (Ke) is critical here as it directly influences the discount rate in DCF models.
Uses valuation multiples from comparable companies or transactions (e.g., P/E, EV/EBITDA) to estimate value.
Does not directly use Ke; instead, it benchmarks valuation against similar publicly traded peers or deals.
Values a company based on the fair market value of its assets minus liabilities.
•The required return that shareholders expect for investing in a company’s equity.
•Reflects the opportunity cost of capital, considering alternative investments with similar risk.
•Forms the discount rate in equity valuation models (e.g., DCF).
•Determines hurdle rates for projects, M&A deals, and strategic decisions.
•Guides capital structure choices (equity vs. debt). How to Derive Ke
Different investors (VCs, private equity, pension funds) have varying return expectations based on their own mandates, risk tolerance, and investment horizons
(Industry volatility, product concentration, or technology shifts.)
Investor sentiment, liquidity, macroeconomic environment
Startups vs. mature companies
Financial Risk
Leverage levels
The return on a theoretically riskless asset (typically long-term government bonds), representing the baseline cost of capital.
A measure of the stock’s systematic risk, quantifying its sensitivity to market fluctuations relative to the overall market.
The market risk premium, reflecting the additional return investors require for bearing the risk of the market over a riskfree investment.
“Expected return” is a long-term assumption about how an investment will play out over its entire life.
Liquidity Premium: Accounts for the higher risk of stocks or assets that are not easily traded.
Small‐Size Premium: Smaller companies often face greater uncertainty and lower liquidity, necessitating an extra return above the standard ERP.
Control Premium: If you’re buying a controlling stake, you may pay more to reflect decision‐making power and potential synergies.
Discount for Lack of Marketability (DLOM): A downward adjustment for privately held or illiquid shares that can’t be easily sold.
In real‐world valuations, analysts often layer on liquidity, size, or other risk premiums to capture unique aspects of the target or market. Additionally, control premiums and DLOMs may be applied in final deal‐level adjustments to reflect ownership structure and marketability constraints.

The risk‐free rate (Rf) is the return on an investment with effectively zero default risk, commonly proxied by stable government bond yields. Definition
Common Time Periods & Conventions
General Convention: 10 Year Government Bonds
• Frequently used due to their liquidity and a medium‐term horizon.
• It’s a general convention rather than a strict rule—shorter or longer maturities can be chosen based on the valuation’s time frame.
• U.S. Treasuries for USD‐based valuations
• 10‐Year Indian Government Bond for INR valuations
• Certain regions (e.g., Japan, parts of the EU) have zero or even negative yields.
• Practical Question: “Does a negative Rf lead to a negative cost of equity, and how do we realistically handle that?”
• Some analysts use a ‘synthetic Rf’: start with a ‘safe’ foreign bond, then adjust for local inflation or country risk.
Practical Question: “Should we rely on local government yields, or is a synthetic Rf more appropriate when dealing with volatile or illiquid bond markets?”
In cross‐border valuations, the chosen Rf typically matches the currency (and often the inflation environment) of the projected cash flows.
Damodaran’s Method for emerging markets (subtracting a credit default spread to isolate a “pure” Rf)
In some emerging markets, long‐term, liquid government bonds may not provide a trustworthy benchmark. One workaround is to start with a known foreign risk‐free rate and adjust for inflation differentials. Given Data
• U.S. Risk‐Free Rate: 3.0%
• Expected U.S. Inflation: 2.0%
• Expected Indonesia Inflation: 5.0% The approximate risk‐free rate for IDR (Indonesian Rupiah) is 6.13%.
The Equity Risk Premium (ERP) is the extra return that investors expect to earn on stocks above the risk‐free rate
In CAPM, it quantifies how much compensation the market requires for taking on average equity risk.
As on 1st Jan 2025
BSE 500 Returns ( Geometric Mean ) Practical
• Historical: Over how many years?
• Arithmetic or geometric mean (CAGR)?

Step 02
Step 01
Step 03
Select an appropriate Mean to calculate the returns.
1. Arithmetic Mean: Simple average of historical differences.
2. Geometric Mean (CAGR): Reflects compound growth rates over the observed period.
Select an appropriate Data Window. Many analysts gravitate toward 10–20 years to balance recency with capturing multiple market cycles
Decide which market index (S&P 500, BSE 500, Sensex 50 etc.) best represents the “market portfolio.”

A measure of systematic (market-related) risk. Better framed as riskiness of business in relation with Market
Why It Fluctuates: Business model changes, leverage changes, market volatility regimes.
While textbooks define Beta as the slope in a regression of a stock’s returns on market returns, in realworld valuation, Beta is the lever that magnifies the ERP.
Context Over Formula: A Beta of 1.5 might be “high,” but if the firm is in a rapidly growing sector, that might be normal.
1. Regression Method
• Uses historical stock returns versus a market index to derive Beta
• Used Primarily for listed companies with sufficient trading history
2. Bottoms Up
• Identifying comparable companies and making several adjustments to derive Beta
• Used primarily for Private Companies or when regression data is limited
In the absence of Indian comparables, consider selecting suitable peers from international markets. You can also reference Aswath Damodaran’s publicly available data as a substitute for industry Beta
Method
Perform a regression of the company’s historical returns against a representative market index (e.g., NIFTY, BSE 500, Sensex).
Sufficient Trading History: Ideally 2–5 years.
Frequency: Daily, weekly, or monthly returns; monthly is common to balance noise and data availability.
Time Window Trade‐Off:
• Too Short → Excessive noise, capturing short‐term anomalies.
• Too Long → May overlook structural changes (Ex: Reliance prior to Jio)
for
: If the company pivoted significantly, split the regression period or adjust accordingly.
Liquidity Constraints: Thinly traded stocks may produce erratic daily returns.
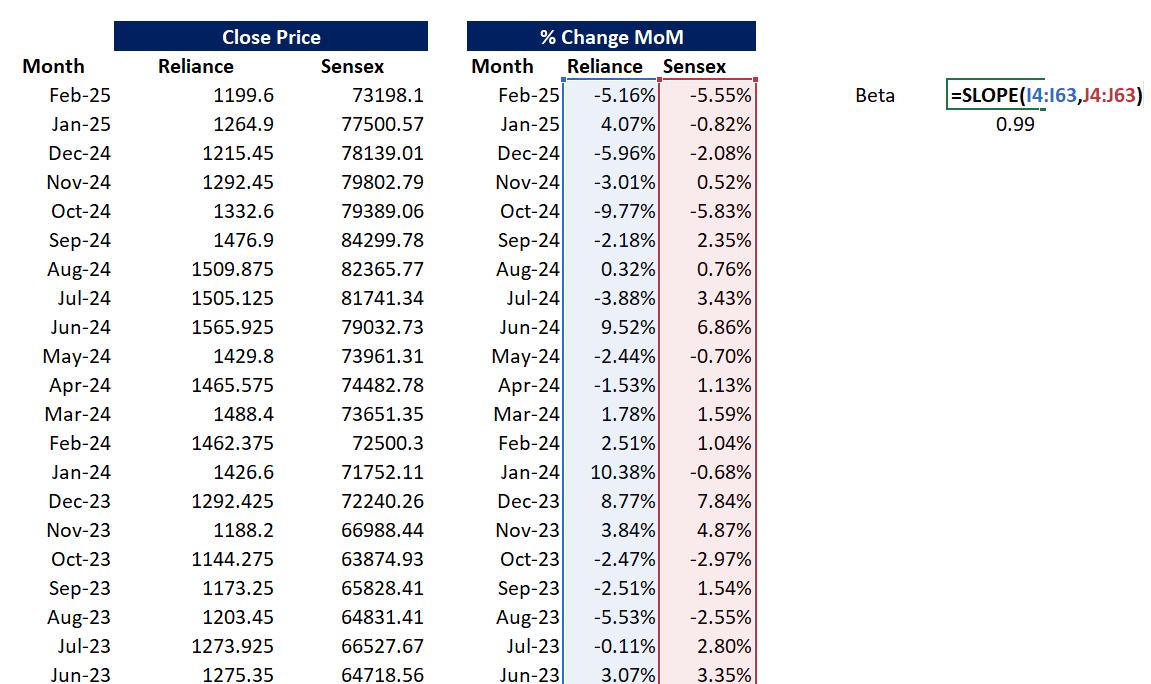
1. Get Target Index and Company Historical Data from BSE, NSE site.
2. Calculate % change over the selected time frame and plot down.
3. Use the Slope formula to calculate Beta.
Note: We have adjusted the Stock Split in the prices.
Why BottomUp?
If the stock is thinly traded, newly listed, or changed capital structure, private comp.
If you want to isolate “business risk” from “financial risk.”
Selecting Comparables Leveraging & Tax Rate Differences Segment & Geographic Variations
Often challenging to locate public companies with the same business mix, risk profile, and market exposure.

Unlevering and re‐levering Betas requires assumptions about debt ratios and tax rates
If the target operates across different industries or countries, a single “average” Beta may fail to capture all the risks
Do we use the current D/E or a target D/E for re-levering?
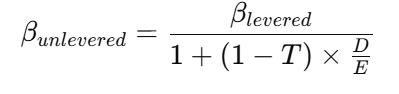
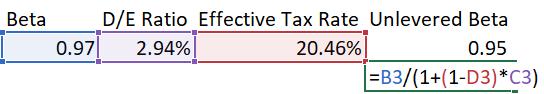
• Reflects the firm's inherent business risk by excluding financial leverage
• Ideal for comparing companies across varying capital structures, as it isolates operating risk.
• Captures both the operating risk and the financial risk from the firm's use of debt.
• The beta calculated using index returns (in the previous slide) is levered, reflecting the combined impact of business and financial risk.
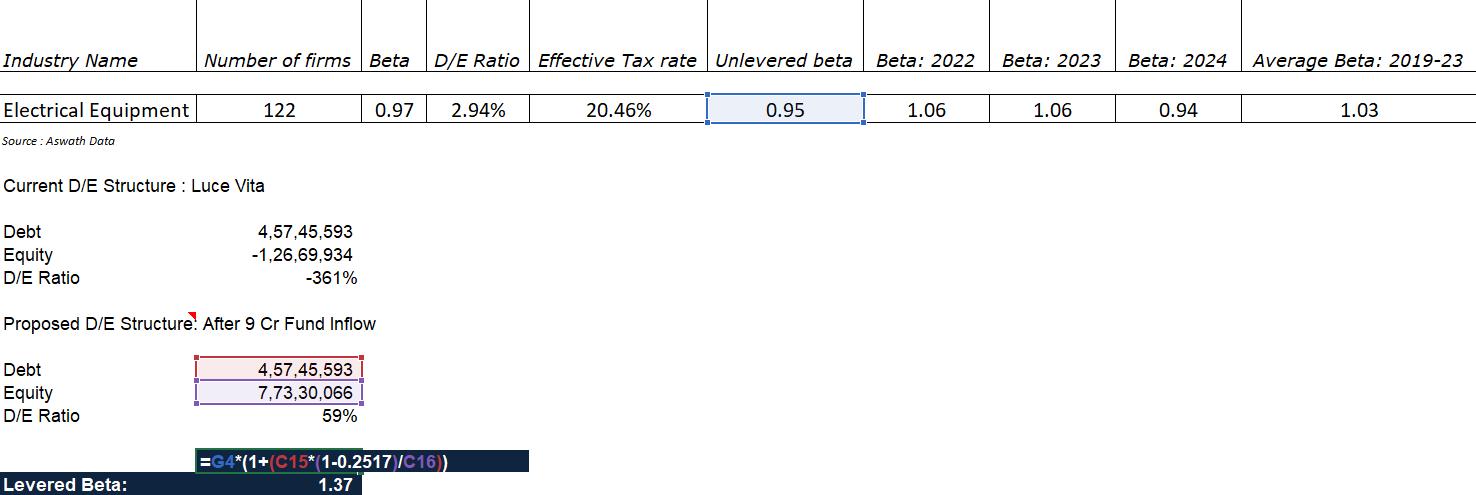
Regression-derived Beta captures both operating and financial risk. We first unlever the industry Beta to remove the debt effect, then relever it using our company's target debt-to-equity ratio to arrive at our Levered Beta.
Step 01
Step 02
Step 03
Step 04
Step 05
Compute a levered beta (equity beta) for your firm, using the market debt to equity ratio for your firm.
Compute a weighted average of the unlevered betas of the different businesses (Step 2) using weights from Step 3.
Estimate how much value your firm derives from each of the different businesses it is in.
Find publicly traded firms in each of these businesses and obtain their regression betas from previous method. Compute the simple average to arrive at average beta and then Unlever this average beta
Finding the business or businesses that your firm operates in.
Imagine an SPV that is headquartered in India, operates its core activities in Brazil, and earns most of its revenue from the UK, while planning to raise funds from a Singapore-based investor. When a Singaporean entity is tasked with valuing this business, which country's WACC (cost of capital) should be used for discounting?
Options to Consider:
•Option 1: Brazil
•Option 2: India
•Option 3: United Kingdom
•Option 4: Singapore
•Option 5: A weighted average of all these countries, adjusted for risk or other relevant criteria.
•Option 6: Any other approach – please specify!
Discussion Prompt:
Which option best captures the true cost of capital for this SPV, and why?
XYZ Electronics is a private limited company in the electronics drivers industry, catering exclusively to the Indian market. Despite rapid growth, it has a negative D/E ratio due to high leverage and limited equity base. With no publicly traded shares, you can’t directly run a regression Beta.
Additional Data:
Debt: 4,57,45,593
Equity: (1,26,69,934)
The company is planning additional equity fund raise of 9 Crore in the following years.
Question:
How would you estimate the company’s Cost of Equity (Ke) using a bottom‐up approach (or any other method), while factoring in its unusual capital structure and strictly Indian market focus?
Step 1: Beta Calculation


Source: https://pages.stern.nyu.edu/adamodar