

TORONTO,ONTARIO,May3,2024–April2024homesalesweredownincomparison toApril2023,whentherewasatemporaryresurgenceinmarketactivity.Newlistings were up strongly year-over-year, which meant there was increased choice for home buyersandlittlemovementintheaveragesellingpricecomparedtolastyear.
Greater Toronto Area (GTA) REALTORS® reported 7,114 sales through the Toronto RegionalRealEstateBoard(TRREB)MLS®SysteminApril2024–downbyfivepercent comparedtoApril2023.Newlistingswereupby47.2percentoverthesameperiod.On a seasonally adjusted monthly basis, sales edged lower while new listings were up comparedtoMarch.

Source: TRREB Market Watch

“Listings were up markedly in April in comparison to last year and last month. Many homeowners are anticipating an increase in demand for ownership housing as we move through the spring. While sales are expected to pick up, many would-be home buyers are likely waiting for the Bank of Canada to actually begin cutting its policy rate before purchasing a home,” said TRREB President Jennifer Pearce.
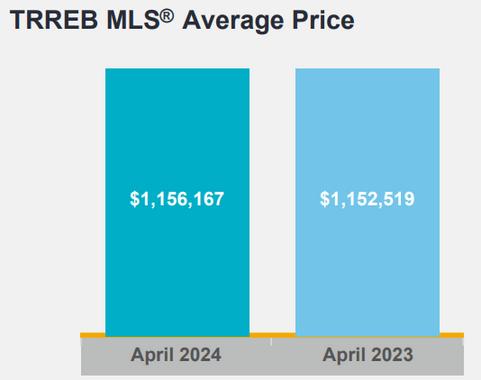
The MLS® Home Price Index (HPI) Composite benchmark was down by less than one per cent per cent year-over-year. The average selling price was up by 0.3 per cent to $1,156,167. On a seasonally adjusted month-over-month basis, the MLS® HPI Composite was up by 0.4 per cent and the average selling price was up by 1.5 per cent compared to March.
“Generally speaking, buyers are benefitting from ample choice in the GTA resale market in April. As a result, there was little movement in selling prices compared to last year. Looking forward, the expectation is that lower borrowing costs will prompt tighter market conditions in the months to come, which will result in renewed price growth, especially as we move into 2025,” said TRREB Chief Market Analyst Jason Mercer.
“All levels of government have announced plans and stated that they are committed to improving affordability and choice for residents. However, more work is needed on alignment to achieve these goals, whether we’re talking about bringing enough housing online to account for future population growth or finding the right balance between government spending and combatting inflation. We can’t have policies in opposition. Housing policy alignment is key to achieving sustained, tangible results,” said TRREB CEO John DiMichele.
Source: TRREB Market Watch
Year-Over-Year Summary April 2024

Source: TRREB Market Watch

Source: TRREB Market Watch

Source: TRREB Market Watch

Source: TRREB Market Watch

Source: TRREB Market Watch

Source: TRREB Market Watch

Source: TRREB Market Watch


Attentive, professional, and a pleasure to work with Theresa Baird and Lindsay Meadwell recently assisted us with the sale of our Port Credit condo. We had the pleasure of working with them previously and had every confidence that this time would be no different. From our initial contact to informing us of current market conditions and trends, preparing our place for sale with expert staging, and marketing, through to managing showings and offers, they were attentive, professional, and a pleasure to work with every step of the way. We highly recommend Theresa and Lindsay to anyone looking for real estate agents who go above and beyond to get the job done, efficiently and professionally. Thanks for making our sale a success!
- Michael & RandyAnyone who expects change to be comfortable hasn't been challenged enough.
Gary Keller

