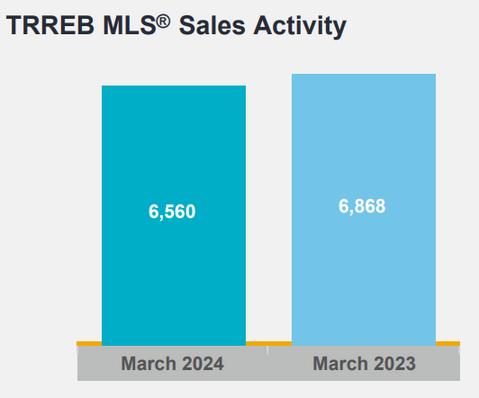


TORONTO, ONTARIO, April 3, 2024 – March 2024 home sales reported through TRREB’s MLS® System were lower than the March 2023 result, due in part to the statutoryholidayGoodFridayfallinginMarchthisyearversusAprillastyear.Despite a better-supplied market compared to last year, there was enough competition betweenbuyerstoseeamoderateincreaseintheaverageMarchhomepricecompared to last year’s level. Greater Toronto Area (GTA) REALTORS® reported 6,560 sales through TRREB’s MLS® System in March 2024 – down by 4.5 per cent compared to March2023.Newlistingswereupby15percentoverthesameperiod.Onaseasonally adjusted monthly basis, sales were down by 1.1 per cent. New listings were down by threepercentcomparedtoFebruary.Thefirstquarterendedwithsalesupby11.2per centyear-over-year.Newlistingswereupbyagreaterannualrateof18.3percent.


“We have seen a gradual improvement in market conditions over the past quarter. More buyers have adjusted to the higher interest rate environment. At the same time, homeowners may be anticipating an improvement in market conditions in the spring, which helps explain the marked increase in new listings so far this year. Assuming we benefit from lower borrowing costs in the near future, sales will increase further, new listings will be absorbed, and tighter market conditions will push selling prices higher,” said TRREB President Jennifer Pearce.
The MLS® Home Price Index (HPI) Composite benchmark was up by 0.3 per cent yearover-year. The average selling price was up by 1.3 per cent to $1,121,615. On a seasonally-adjusted month-over-month basis, the MLS® HPI Composite was up by 0.2 per cent and the average selling price was up by 0.7 per cent compared to February. “The average selling price edged up in comparison to last year as we moved through the first quarter of 2024. Price growth is expected to accelerate during the spring and even more so in the second half of the year, as sales growth catches up with listings growth and sellers’ market conditions start to emerge in many neighbourhoods. Lower borrowing costs in the months ahead will help fuel increased demand for ownership housing,” said TRREB Chief Market Analyst Jason Mercer. “As demand for ownership and rental housing increases, supply will continue to be top of mind. Governments at all levels must maintain their focus on pursuing innovative solutions to increase the amount and mix of housing supply to improve affordability. This includes removing roadblocks to non-traditional arrangements, such as co-ownership models to benefit home buyers, including first-time buyers and seniors. Encouraging gentle density, including multiplexes, is critical to helping high demand areas such as the Greater Golden Horseshoe to meet housing supply targets,” said TRREB CEO John DiMichele.
Source: TRREB Market Watch
Source: TRREB Market Watch

Source: TRREB Market Watch

Source: TRREB Market Watch

Source: TRREB Market Watch


Source: TRREB Market Watch

Source: TRREB Market Watch

Source: TRREB Market Watch


“Theresa and "The TB Realty Group", thank you for selling my condo in Toronto not only so quickly but for the best price for a unit my size. With all the building obstacles that you faced, we found a way to get around them and make it all work out so quickly. I would be pleased to share your name with all my family and friends looking to buy, sell or invest in the future.
- Jessica“Be like a postage stamp - stick to one thing until you get there”
Gary Keller

