TRENDS

TODAY’S REAL ESTATE ALONG FLORIDA’S EAST COAST
MARKET REPORT FEBRUARY 2023
CONTENTS 04 10 14 06 11 15 08 12 16 17 18 Miami-Dade County Martin County St. Johns County Broward County Indian River County Duval County Palm Beach County Brevard County Clay County Nassau County Flagler County
Our brand, your advantage
ONE Sotheby’s International Realty prides itself in being at the forefront of innovation, service, and marketing that push the boundaries within our industry. Our commitment to providing the highest caliber of expertise and dedication sets us apart as we continue to raise the standard of excellence. As real estate’s most trusted brand, our name alone opens the most prestigious doors and creates opportunities to connect sellers and buyers worldwide. That is our mission: to give extraordinary lives a home to thrive.

compares.
Nothing
© 2023 ONE Sotheby’s International Realty. All rights reserved. Sotheby’s International Realty® and the Sotheby’s International Realty Logo are service marks licensed to Sotheby’s International Realty Affiliates LLC and used with permission. #1 BEST BROKERAGE WEBSITE By South Florida Agent Magazine #1 VOTED BEST LUXURY BROKERAGE IN FLORIDA BY LUXURY LIFESTYLE MAGAZINE #1 MOST PROFILED REAL ESTATE BRAND IN THE PRESS 8x AWARD -WINNING MARKETING POWERHOUSE


Scan to Explore Your Mortgage Options Bank on Better Finance your next home with 75 years of trusted Florida-based mortgage expertise at your side. Extensive local real estate experience and market knowledge. Flexible home loans with competitive rates.1 Personalized service from application to close. Primary Residences & Second Homes Vacation Homes & Investment Properties New Construction & Land Acquisition Member FDIC NMLS#412469 1 Loan products are subject to credit approval and program requirements. Terms and conditions apply. This is not a commitment to lend. Loan programs, terms, rates, and conditions are subject to change without notice. © 2023 City National Bank of Florida 2966168977 / r07/22 DAN CAMPANELLA NMLS #459788 Senior Vice President, Mortgage Market Manager e: dan.campanella@citynational.com c: 1.877.511.4CNB
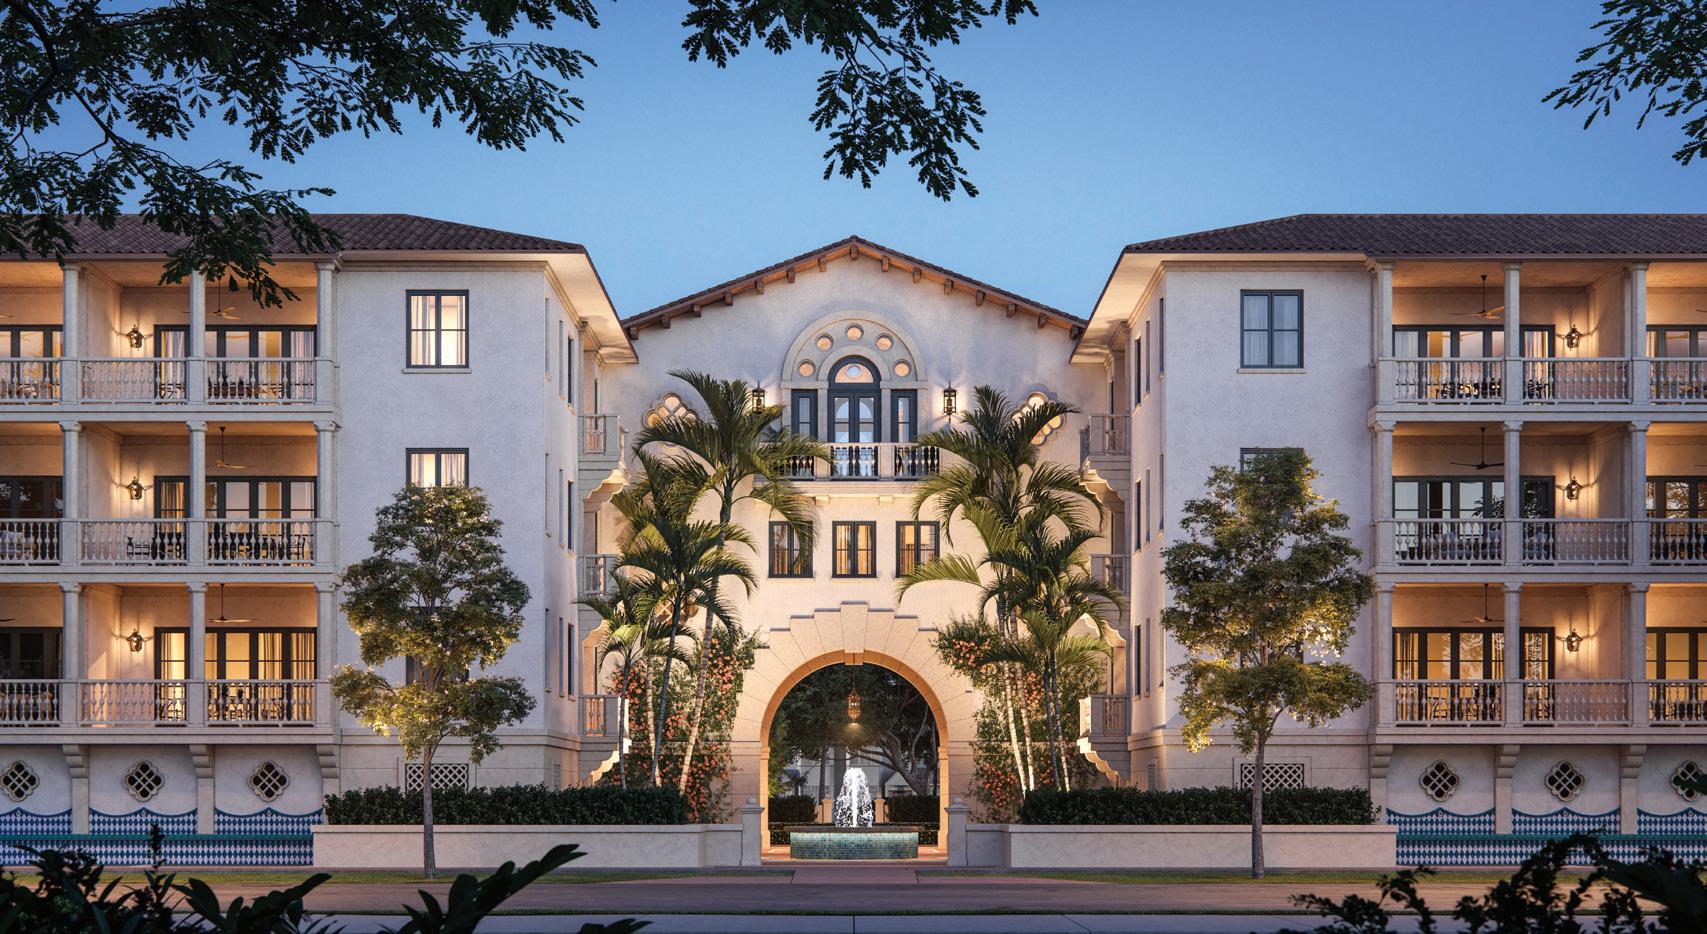

Situated within a luxurious residential enclave, The Village at Coral Gables features only forty-eight distinctive homes including Sophisticated Flats, Glamorous Townhomes, Expansive Lofts, and Private Villas. Developed by MG Developer, The Village at Coral Gables is a once-in-a-generation offering of residences in Miami’s most coveted neighborhood. IN THE HEART OF CORAL GABLES A BOUTIQUE COLLECTION OF NEW CONSTRUCTION RESIDENCES Residences Priced From $2M SCHEDULE A PRIVATE PREVIEW thevillageatcoralgables.com | sales@thevillageatcoralgables.com | 786.833.6398 @THEVILLAGEATCORALGABLES FOLLOW US ORAL REPRESENTATIONS CANNOT BE RELIED UPON AS CORRECTLY STATING THE REPRESENTATIONS OF THE DEVELOPER. FOR CORRECT REPRESENTATIONS, MAKE REFERENCE TO THE DOCUMENTS REQUIRED BY SECTION 718.503, FLORIDA STATUTES, TO BE FURNISHED BY A DEVELOPER TO A BUYER OR LESSEE. This is not intended to be an offer to sell, or solicitation of an offer to buy, condominium units to residents of CT, ID, NY, NJ and OR, unless registered or exemptions are available, or in any other jurisdiction where prohibited by law, and your eligibility for purchase will depend upon your state of residency. This offering is made only by the prospectus for the condominium and no statement should be relied upon if not made in the prospectus. The Developer (as is defined herein below) reserves the right to revise or modify, in its sole and absolute discretion, any or all improvements, designs and construction specifications depicted and all terms, conditions and statements made. All of the drawings, rendering, and photographs provided by Developer are conceptual only and are for the convenience of illustrating proposed development; said drawings, renderings and photographs should not be relied upon as representations, express or implied, of the final detail of the residences. All depictions of appliances, fixtures, counters, soffits, wall coverings, floor coverings, furnishings, closets, and other matters of detail, including, without limitation, items of finish and decoration, are conceptual only and are not necessarily the final finishes and details included with the purchase of a Unit. Consult your Purchase Agreement and the Prospectus for information on what is included with Unit purchases. The photographs contained in these materials and other brochures may be stock photography, or may have been taken off-site and are used to depict the spirit of the lifestyles to be achieved rather than any that may exist or that may be proposed, and the photographs are merely intended as illustrations of the activities and concepts depicted therein. No statements or representations have been made by Developer, or any of its agents, employees or representatives with respect to any potential for future profit, any future appreciation in value, investment opportunity potential, any rental income potential, the ability or willingness of Developer, or its affiliates, to assist any buyer in financing, renting (other than the existence of a voluntary rental program) or selling the Unit (except only in response to a direct inquiry from buyer), the economic or tax benefits to be derived from the managerial efforts of a third party as a result of renting the Unit or other units, or the economic or tax benefits to be derived from ownership of the Unit. The Developer, its agents, employees, and representatives are neither investment advisors nor tax advisors and any statement that may have been made should not be relied upon in your decision to purchase. Certain nearby attractions referenced or identified in these materials are off-site and not controlled by the Developer. The references to nearby attractions are based upon public information sources and are believed to be accurate as of the date of these materials or publication; however, there is no guarantee that such attractions will continue to exist, or that there would not be changes and/or substitutions of any of the same. The managing entities, operators, amenities and other features that may be referred to are accurate as of the date of these materials or publication; however, there is no guarantee that the managing entities, operators, amenities and other features that may be referred to will be involved at, or following, the completion of the Condominium. The Developer reserves the right to change any and all such managing entities, operators, amenities and other features that may be referred to as the Developer deems best for the Condominium in the Developer’s sole and absolute discretion. Dimensions and square footage of the Units are approximate and may vary with actual construction. The Condominium is being developed by Gables Village Propco LLC, a Delaware limited liability company (“Developer”). You will look solely to Developer with respect to any and all matters relating to the sales, marketing, and development of the Condominium or your purchase of a Unit in the Condominium. No real estate broker is authorized to make any representations or other statements regarding the project, and no agreements with, deposits paid to or other arrangements made with any real estate broker are or shall be binding on the Developer. All prices are subject to change at any time and without notice, and do not include optional features or premiums for upgraded units. From time to time, price changes may have occurred that are not yet reflected on these materials or other brochures. Please check with the Developer for the most current pricing. Concierge services that may be described are available to Unit owners who pay additional fees. Consult the Prospectus for the site plan and the location of the Unit you desire. Unless otherwise noted, this content is owned by Developer and the unauthorized reproduction, display or other dissemination of these or other materials is strictly prohibited and constitutes copyright infringement. Unless otherwise defined, capitalized terms used herein shall have the meanings ascribed to them in the Prospectus.
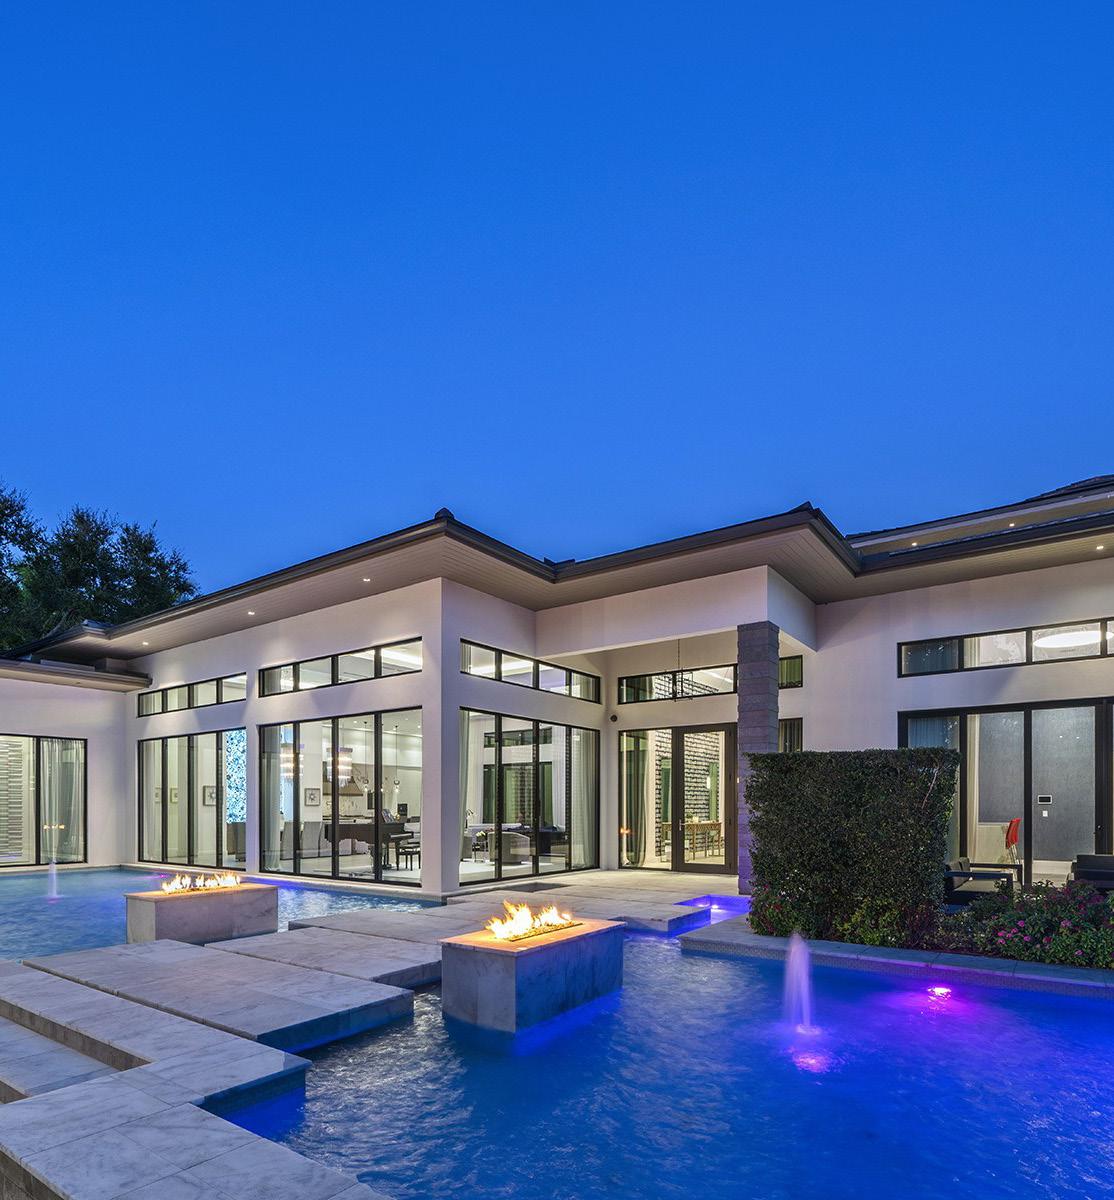
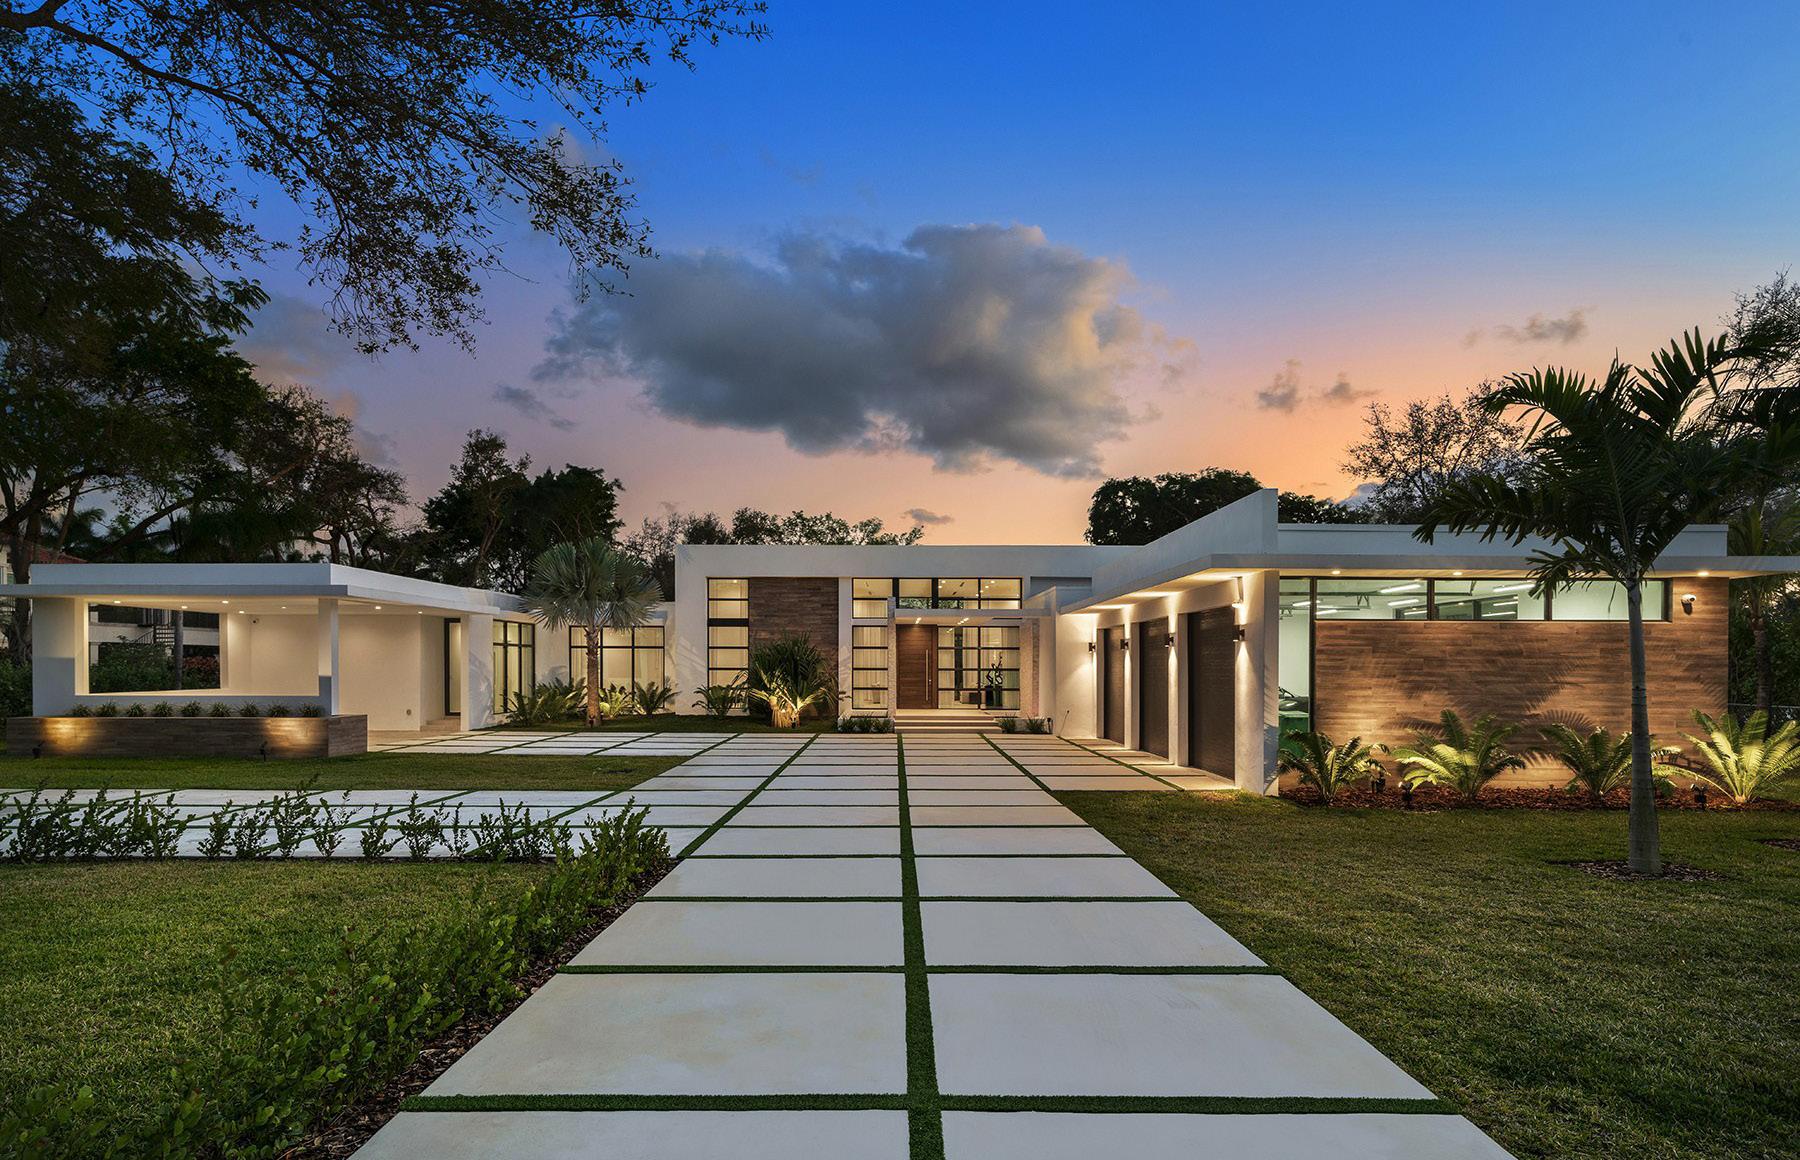
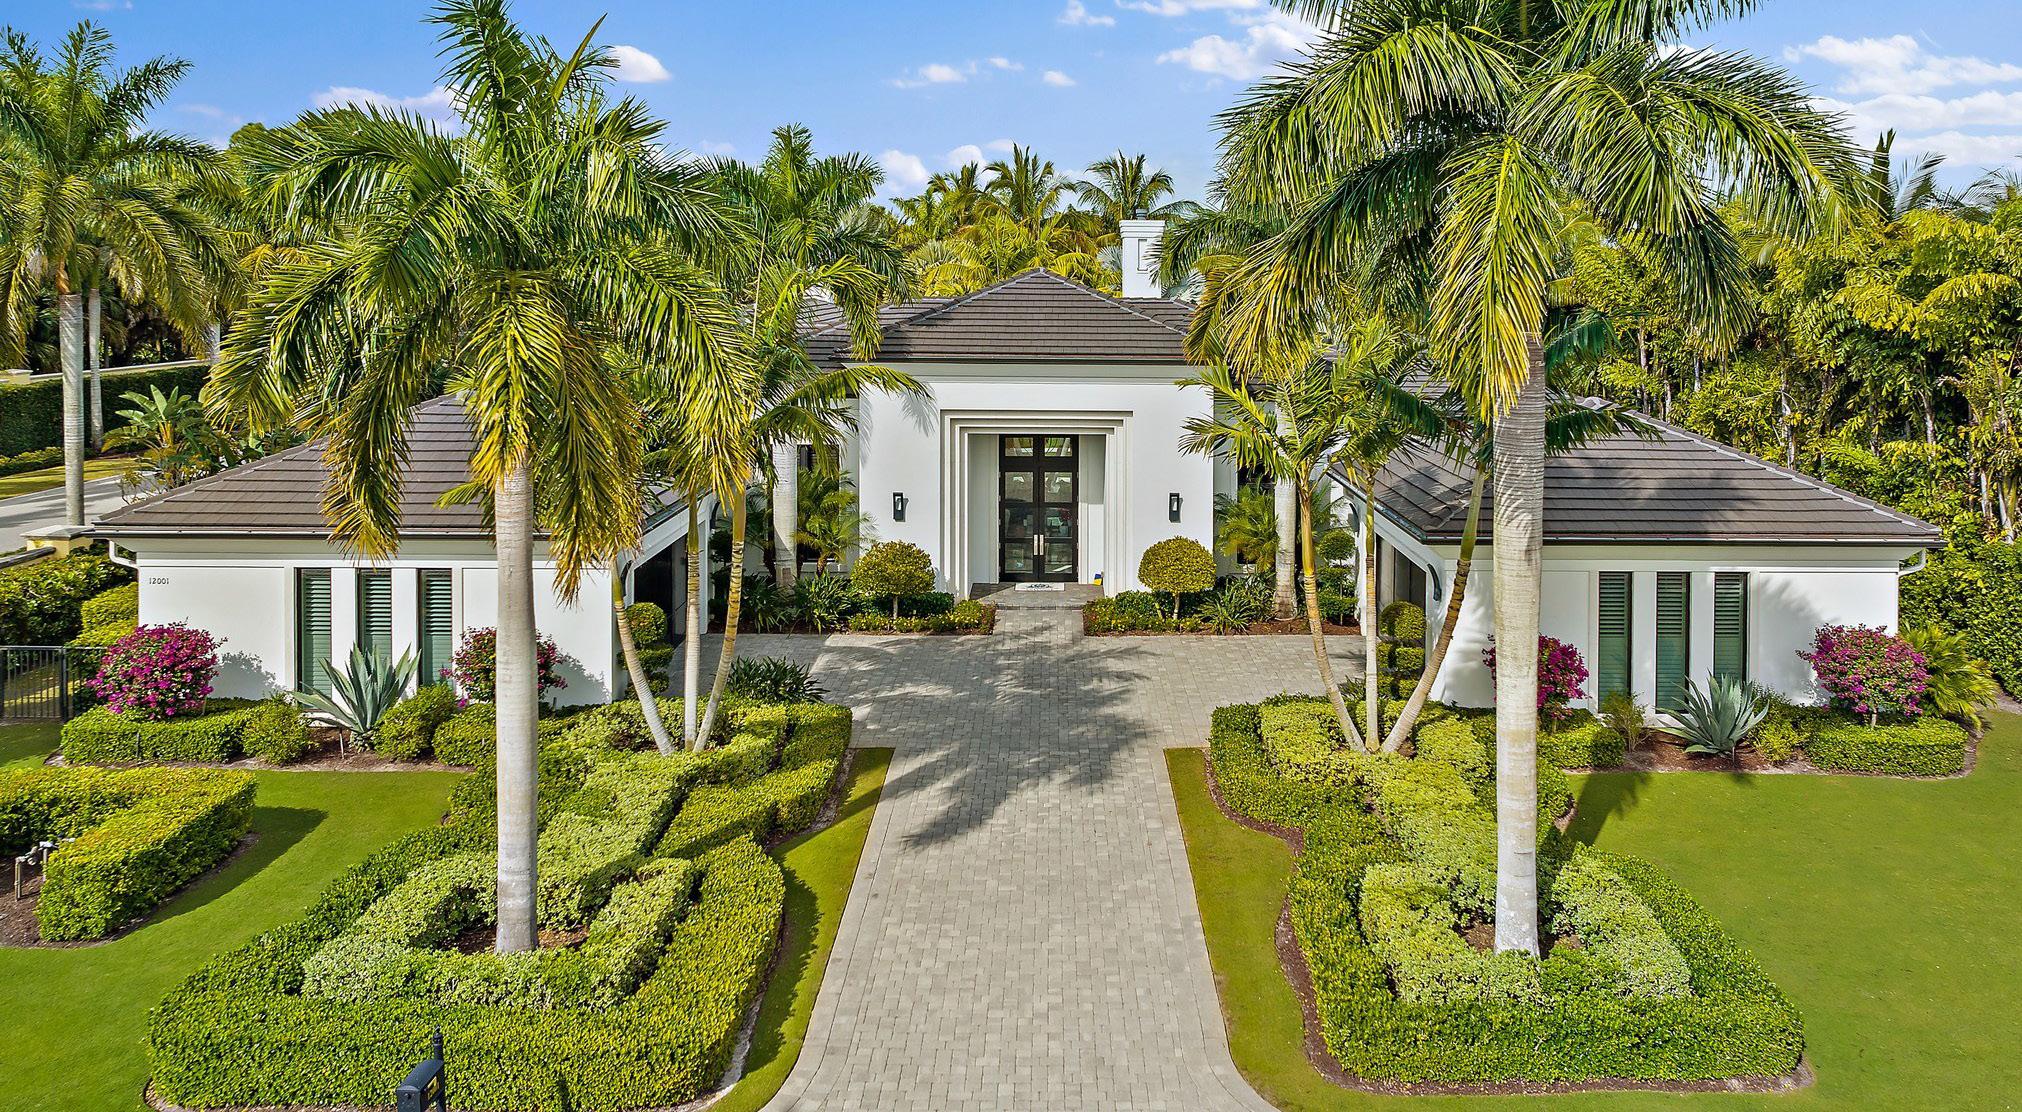
MIAMI-DADE COUNTY
SINGLE-FAMILY HOMES | FEWER HOMES FOR SALE
For-sale inventory decreased by 3% from the previous month yet remains 80% higher than one year ago. Luxury sales fared better than other price tiers, particularly homes priced above the $10 million threshold.
Neighborhood Snapshots
*ALL PERCENTAGES REFLECT YEAR OVER YEAR CHANGE.
545K 57
MEDIAN
ACTIVE
MEDIAN PPSF ↑ 4% ↑ 12% ↑ 13% ↓ 39% ↑
3,997 572 347
SALES PRICE AVERAGE DAYS ON MARKET
LISTINGS SOLD LISTINGS
80%
MEDIAN SALES PRICE MEDIAN PRICE PER SF CLOSED SALES AVG. DAYS ON THE MARKET JAN 23 JAN 22 YOY% CHANGE JAN 23 YOY% CHANGE JAN 23 YOY% CHANGE JAN 23 AVENTURA $1,300,000 $935,000 39% $638 66% 1 -88% 324 BAL HARBOUR $6,242,500 N/A N/A $1,635 N/A 1 N/A 118 BAY HARBOR ISLANDS N/A $4,800,000 N/A N/A N/A - N/A N/A COCONUT GROVE $1,800,000 $1,360,000 32% $816 27% 11 -27% 75 CORAL GABLES $1,665,000 $1,650,000 1% $740 11% 19 -50% 70 FISHER ISLAND N/A N/A N/A N/A N/A - N/A N/A KEY BISCAYNE $6,700,000 $3,225,000 108% $1,151 12% 2 -67% 230 MIAMI $562,500 $530,000 6% $351 15% 254 -42% 54 MIAMI BEACH $2,837,500 $2,175,000 30% $1,079 32% 16 -50% 103 MIAMI SHORES $1,250,000 $1,124,000 11% $606 -6% 7 75% 75 NORTH BAY VILLAGE $970,000 $1,000,000 -3% $729 42% 1 0% 6 PINECREST $2,208,500 $1,295,000 71% $686 31% 14 -7% 64 SOUTH MIAMI $980,000 $840,000 17% $372 -36% 2 -82% 15 SUNNY ISLES BEACH N/A N/A N/A N/A N/A - N/A N/A SURFSIDE N/A $1,000,000 N/A N/A N/A 3 N/A N/A
$ $
MIAMI-DADE COUNTY
CONDOMINIUMS | STRONGEST PRICE PER SQUARE FOOT GROWTH
The median price per square foot increased by 11% from last month, the largest increase in the region, and remained roughly 13% higher than a year ago. With list prices increasing, fewer homes sold at a premium in January.
Neighborhood Snapshots
*ALL PERCENTAGES REFLECT YEAR OVER YEAR CHANGE. 400K 69
789 379 MEDIAN SALES PRICE AVERAGE DAYS ON MARKET ACTIVE LISTINGS SOLD LISTINGS MEDIAN PPSF ↑ 8% ↓ 18% ↑ 13% ↓ 48% ↑ 21%
6,743
MEDIAN SALES PRICE MEDIAN PRICE PER SF CLOSED SALES AVG. DAYS ON THE MARKET JAN 23 JAN 22 YOY% CHANGE JAN 23 YOY% CHANGE JAN 23 YOY% CHANGE JAN 23 AVENTURA $435,000 $410,000 6% $374 28% 69 -49% 60 BAL HARBOUR $1,015,000 $1,192,500 -15% $904 19% 4 -75% 45 BAY HARBOR ISLANDS $625,000 $395,000 58% $453 42% 5 -74% 18 BRICKELL/DOWNTOWN MIAMI/EDGEWATER $580,000 $532,000 9% $575 13% 69 -68% 90 COCONUT GROVE $1,200,000 $846,000 42% $638 34% 10 -41% 50 CORAL GABLES $590,000 $380,000 55% $693 70% 17 -41% 88 FISHER ISLAND N/A N/A N/A N/A N/A - N/A N/A KEY BISCAYNE $1,100,000 $1,002,500 10% $1,038 51% 9 -59% 97 MIAMI $375,000 $315,000 19% $299 12% 225 -47% 65 MIAMI BEACH $477,000 $462,000 3% $568 16% 135 -38% 78 MIAMI SHORES $386,500 $325,000 19% $256 19% 1 -67% 75 NORTH BAY VILLAGE $367,500 $335,000 10% $404 32% 14 -26% 53 PINECREST $780,000 $316,500 146% $423 47% 1 -75% 117 SOUTH MIAMI $347,500 $246,750 41% $439 49% 2 0% 12 SUNNY ISLES BEACH $1,035,000 $659,000 57% $684 31% 40 -55% 131 SURFSIDE $692,500 $607,500 14% $661 31% 6 -45% 141
$ $
BROWARD COUNTY
SINGLE-FAMILY HOMES | INVENTORY TIGHTENS
The number of homes for sale fell by 5% in January. However, it remains nearly 2.5 times higher than one year ago. The median price per square foot of available homes increased by 1% from last month and was nearly 10% higher than last year.
Neighborhood Snapshots
*ALL PERCENTAGES REFLECT YEAR OVER YEAR CHANGE. 543K 52 3,312 651 314 MEDIAN SALES PRICE AVERAGE DAYS ON MARKET ACTIVE LISTINGS SOLD LISTINGS MEDIAN PPSF ↑ 6% ↑ 41% ↑ 9% ↓ 36% ↑ 142%
MEDIAN SALES PRICE MEDIAN PRICE PER SF CLOSED SALES AVG. DAYS ON THE MARKET JAN 23 JAN 22 YOY% CHANGE JAN 23 YOY% CHANGE JAN 23 YOY% CHANGE JAN 23 COOPER CITY $700,000 $650,000 8% $326 9% 11 22% 38 CORAL SPRINGS $637,500 $569,000 12% $288 5% 40 -47% 59 DAVIE $675,000 $737,500 -8% $339 5% 31 -18% 54 DEERFIELD BEACH $445,000 $425,000 5% $272 -3% 17 -60% 39 FORT LAUDERDALE $520,000 $615,000 -15% $358 1% 93 -36% 52 HALLANDALE $3,500,000 $465,000 653% $980 175% 3 -63% 130 HILLSBORO BEACH N/A N/A N/A N/A N/A - N/A N/A HOLLYWOOD $456,000 $495,950 -8% $371 15% 60 -45% 49 LAUDERDALE-BY-THE-SEA N/A $1,550,000 N/A N/A N/A - N/A N/A LIGHTHOUSE POINT $950,000 $1,659,500 -43% $530 -8% 15 -6% 63 MIRAMAR $565,500 $562,500 1% $288 12% 46 -30% 54 PARKLAND $1,110,000 $1,031,500 8% $324 3% 26 -28% 68 PEMBROKE PINES $547,500 $525,000 4% $305 11% 48 -43% 55 PLANTATION $620,000 $550,000 13% $283 4% 29 -45% 55 POMPANO BEACH $470,000 $395,000 19% $327 8% 40 -22% 54 SOUTHWEST RANCHES $1,662,500 $1,045,500 59% $470 10% 4 -33% 24 SUNRISE $465,000 $415,000 12% $306 19% 26 -21% 42 WESTON $785,000 $850,000 -8% $340 2% 20 -58% 49 WILTON MANORS $762,500 $720,000 6% $549 12% 11 -15% 40
$ $
BROWARD COUNTY
CONDOMINIUMS | PRICING STRENGTHENS
The median price increased by 4% from December, pushing the year-over-year gain to more than 10%. More than 14% of condo units sold in January did so at greater than the asking price, higher than one year ago.
Neighborhood Snapshots
*ALL PERCENTAGES REFLECT YEAR OVER YEAR CHANGE. 265K 50 4,310 843 238 MEDIAN SALES PRICE AVERAGE DAYS ON MARKET ACTIVE LISTINGS SOLD LISTINGS MEDIAN PPSF ↑ 10% ↑ 4% ↑ 15% ↓ 37% ↑ 76%
MEDIAN SALES PRICE MEDIAN PRICE PER SF CLOSED SALES AVG. DAYS ON THE MARKET JAN 23 JAN 22 YOY% CHANGE JAN 23 YOY% CHANGE JAN 23 YOY% CHANGE JAN 23 COOPER CITY $380,000 $399,000 -5% $294 3% 5 -29% 40 CORAL SPRINGS $230,500 $189,500 22% $225 16% 35 -29% 36 DAVIE $270,000 $226,000 19% $234 38% 30 -14% 33 DEERFIELD BEACH $205,000 $160,000 28% $202 30% 64 -34% 41 FORT LAUDERDALE $528,232 $403,500 31% $405 22% 124 -34% 60 HALLANDALE $294,750 $282,500 4% $286 17% 50 -52% 60 HILLSBORO BEACH $492,500 $603,000 -18% $464 -4% 6 -50% 112 HOLLYWOOD $310,000 $307,500 1% $315 15% 67 -41% 73 LAUDERDALE-BY-THE-SEA $504,500 $790,000 -36% $407 -12% 14 -26% 44 LIGHTHOUSE POINT N/A $196,625 N/A N/A N/A - N/A N/A MIRAMAR $360,000 $310,000 16% $275 17% 21 -45% 49 PARKLAND $580,000 $500,000 16% $309 6% 1 -80% 2 PEMBROKE PINES $225,000 $210,000 7% $206 17% 61 -37% 36 PLANTATION $255,000 $265,000 -4% $232 15% 29 -31% 34 POMPANO BEACH $269,950 $249,500 8% $214 4% 74 -38% 46 SOUTHWEST RANCHES N/A N/A N/A N/A N/A - N/A N/A SUNRISE $180,000 $150,000 20% $180 33% 59 -19% 67 WESTON $378,750 $270,500 40% $307 45% 14 -36% 62 WILTON MANORS $579,000 $287,500 101% $321 11% 8 0% 26
$ $
PALM BEACH COUNTY
SINGLE-FAMILY HOMES | HIGHER PRICED HOMES SELLING
More homes priced over $5 million sold than the last two months. The median price per square foot of homes listed for sale rose by more than 2% from last month and were up by a similar amount from a year ago.
Neighborhood Snapshots
*ALL PERCENTAGES REFLECT YEAR OVER YEAR CHANGE. 620K 58
696 314 MEDIAN SALES PRICE AVERAGE DAYS ON MARKET ACTIVE LISTINGS SOLD LISTINGS MEDIAN PPSF ↑ 12% ↑ 67% ↑ 12% ↓ 31% ↑ 168%
3,719
MEDIAN SALES PRICE MEDIAN PRICE PER SF CLOSED SALES AVG. DAYS ON THE MARKET JAN 23 JAN 22 YOY% CHANGE JAN 23 YOY% CHANGE JAN 23 YOY% CHANGE JAN 23 BOCA RATON $885,000 $745,000 19% $366 15% 111 -27% 65 BOYNTON BEACH $499,900 $468,500 7% $262 7% 103 70% 51 DELRAY BEACH $1,000,000 $620,000 61% $397 27% 64 -42% 60 HIGHLAND BEACH N/A N/A N/A N/A N/A - N/A N/A JUNO BEACH N/A $2,324,000 N/A N/A N/A - N/A N/A JUPITER $850,000 $862,500 -1% $392 4% 53 0% 54 JUPITER INLET COLONY $3,200,000 $8,960,000 -64% $1,278 -26% 1 -50% 38 LAKE PARK N/A $335,000 N/A N/A N/A - N/A N/A LAKE WORTH $520,000 $465,000 12% $264 7% 71 -25% 57 LANTANA $360,000 $310,000 16% $264 14% 4 -20% 54 NORTH PALM BEACH $620,000 $950,000 -35% $382 -11% 8 -47% 25 MANALAPAN $62,988,000 $3,450,000 1726% $3,792 314% 1 0% 329 PALM BEACH $7,718,715 $12,606,288 -39% $3,034 3% 4 0% 74 PALM BEACH GARDENS $840,000 $755,000 11% $355 7% 47 -36% 52 SINGER ISLAND $1,425,000 $2,987,500 -52% $775 -5% 2 0% 156 TEQUESTA $875,000 $980,500 -11% $400 -12% 5 -38% 63 WELLINGTON $656,250 $702,500 -7% $257 -4% 32 -27% 68 WEST PALM BEACH $575,000 $439,500 31% $309 25% 91 -25% 53
$ $
PALM BEACH COUNTY
CONDOMINIUMS | AVERAGE PRICE INCREASES
Pricing remained on par with the previous month but higher than one year ago, with the average price up by 13% from January of 2022. For-sale inventory increased by more than 8% from last month, one of the largest increases in Southeast Florida, and reached 2.5 times higher than one year ago.
300K 50
3,655
LISTINGS
Neighborhood Snapshots
*ALL PERCENTAGES REFLECT YEAR OVER YEAR CHANGE.
13%
668 220 MEDIAN SALES PRICE AVERAGE DAYS ON MARKET ACTIVE
SOLD LISTINGS MEDIAN PPSF ↑ 13% ↑ 38% ↑
↓ 35% ↑ 167%
MEDIAN SALES PRICE MEDIAN PRICE PER SF CLOSED SALES AVG. DAYS ON THE MARKET JAN 23 JAN 22 YOY% CHANGE JAN 23 YOY% CHANGE JAN 23 YOY% CHANGE JAN 23 BOCA RATON $302,500 $310,000 -2% $302,500 9% 144 -29% 55 BOYNTON BEACH $300,000 $235,000 28% $210 38% 57 -31% 43 DELRAY BEACH $242,000 $175,000 38% $198 38% 97 -39% 45 HIGHLAND BEACH $1,300,000 $599,000 117% $597 33% 5 -62% 27 JUNO BEACH $780,000 $635,000 23% $507 60% 5 -29% 110 JUPITER $490,000 $472,500 4% $314 -1% 32 -36% 42 JUPITER INLET COLONY N/A N/A N/A N/A N/A - N/A N/A LAKE PARK $285,000 $310,000 -8% $138 -47% 2 -33% 51 LAKE WORTH $200,000 $170,000 18% $145 12% 30 -39% 68 LANTANA $290,000 $212,500 36% $224 46% 6 -50% 40 NORTH PALM BEACH $330,000 $330,000 0% $289 0% 11 -35% 52 MANALAPAN N/A N/A N/A N/A N/A - N/A N/A PALM BEACH $1,143,000 $670,000 71% $547 27% 16 -54% 68 PALM BEACH GARDENS $348,500 $371,500 -6% $252 -6% 43 -10% 40 SINGER ISLAND $1,152,500 $770,000 50% $506 -7% 6 -54% 134 TEQUESTA $322,500 $773,500 -58% $50 -90% 4 -64% 33 WELLINGTON $432,450 $355,000 22% $275 26% 6 -60% 49 WEST PALM BEACH $250,000 $223,000 12% $192 12% 127 -27% 47
$ $
MARTIN COUNTY
SINGLE-FAMILY HOMES | INVENTORY FALLS
The number of homes for sale decreased slightly from the previous month yet remains more than four times higher than the record-low inventory in January of 2022. However, competition also slowed with only 4% of homes sold above the list price.
Neighborhood Snapshots
*ALL PERCENTAGES REFLECT YEAR OVER YEAR CHANGE. 545K 60 198 47 283 MEDIAN SALES PRICE AVERAGE DAYS ON MARKET ACTIVE LISTINGS SOLD LISTINGS MEDIAN PPSF ↑ 2% ↑ 51% ↑ 9% ↓ 10% ↑ 313%
MEDIAN SALES PRICE MEDIAN PRICE PER SF CLOSED SALES AVG. DAYS ON THE MARKET JAN 23 JAN 22 YOY% CHANGE JAN 23 YOY% CHANGE JAN 23 YOY% CHANGE JAN 23 HOBE SOUND $511,000 $489,870 4% $284 15% 4 284% 37 HUTCHINSON ISLAND N/A $4,975,000 N/A N/A N/A - N/A N/A JENSEN BEACH $525,000 $425,000 24% $274 20% 8 0% 64 JUPITER ISLAND N/A $9,600,000 -100% N/A -100% N/A -100% N/A PALM CITY $600,000 $430,000 40% $268 6% 35 0% 62 SEWALL'S POINT $930,000 $1,500,000 -38% $293 -40% 1 -75% 46 STUART $625,889 $485,000 9% $298 11% 18 29% 56
$ $
MARTIN COUNTY
CONDOMINIUMS | STRONG MEDIAN PRICE GROWTH
Martin County produced the largest median price growth in the last year, with pricing up by 17%. However, the share of units sold at a premium was the lowest in the region at 4%, down from 10% one year ago.
Neighborhood Snapshots
*ALL PERCENTAGES REFLECT YEAR OVER YEAR CHANGE. 320K 79 163 27 237 MEDIAN SALES PRICE AVERAGE DAYS ON MARKET ACTIVE LISTINGS SOLD LISTINGS MEDIAN PPSF ↑ 28% ↑ 255% ↑ 13% ↓ 34% ↑ 579%
MEDIAN SALES PRICE MEDIAN PRICE PER SF CLOSED SALES AVG. DAYS ON THE MARKET JAN 23 JAN 22 YOY% CHANGE JAN 23 YOY% CHANGE JAN 23 YOY% CHANGE JAN 23 HOBE SOUND $275,000 $216,000 27% $196 20% 2 -50% 40 HUTCHINSON ISLAND $670,000 $741,250 -10% $450 -10% 8 0% 88 JENSEN BEACH $365,000 $180,750 102% $237 33% 1 -50% 77 PALM CITY $237,500 $135,000 76% $213 137% 1 -67% 10 STUART $237,500 $250,000 -5% $203 -7% 12 -37% 77
$ $
INDIAN RIVER COUNTY
SINGLE-FAMILY HOMES | FOR-SALE INVENTORY STABILIZES
The number of homes for sale stabilized in January, yet it is more than three times higher than one year ago. The median price of homes listed for sale increased to approximately $515,000 in the last month, a 5% gain since January 2022.
Neighborhood Snapshots
*ALL PERCENTAGES REFLECT YEAR OVER YEAR CHANGE. 407K 81 780 130 237 MEDIAN SALES PRICE AVERAGE DAYS ON MARKET ACTIVE LISTINGS SOLD LISTINGS MEDIAN PPSF ↑ 12% ↑ 54% ↑ 14% ↓ 36% ↑ 220%
MEDIAN SALES PRICE MEDIAN PRICE PER SF CLOSED SALES AVG. DAYS ON THE MARKET JAN 23 JAN 22 YOY% CHANGE JAN 23 YOY% CHANGE JAN 23 YOY% CHANGE JAN 23 BARRIER ISLAND $1,200,000 $900,000 33% $441 10% 14 -44% 122 MAINLAND VERO BEACH $424,000 $363,000 17% $229 12% 55 -46% 97 SEBASTIAN/FELLSMERE $375,270 $322,500 16% $207 1% 19 -45% 64
$ $
INDIAN RIVER COUNTY
CONDOMINIUMS | MONTHS OF SUPPLY DECREASES
The months of supply fell to 5.5 months as sales increased from the December low point. The share of units sold above the list price doubled from December and was roughly three times higher than one year ago.
Neighborhood Snapshots
*ALL PERCENTAGES REFLECT YEAR OVER YEAR CHANGE. 290K 66 353 64 205 MEDIAN SALES PRICE AVERAGE DAYS ON MARKET ACTIVE LISTINGS SOLD LISTINGS MEDIAN PPSF ↑ 5% ↑ 30% ↑ 11% ↓ 18% ↑ 390%
MEDIAN SALES PRICE MEDIAN PRICE PER SF CLOSED SALES AVG. DAYS ON THE MARKET JAN 23 JAN 22 YOY% CHANGE JAN 23 YOY% CHANGE JAN 23 YOY% CHANGE JAN 23 BARRIER ISLAND $750,000 $592,500 27% $406 7% 13 -46% 60 MAINLAND VERO BEACH $225,000 $187,500 20% $181 9% 41 -13% 67 SEBASTIAN/FELLSMERE $295,000 $310,000 -5% $232 -6% 6 500% 91
$ $
BREVARD COUNTY
SINGLE-FAMILY HOMES | LOWEST DAYS ON MARKET IN THE REGION
$ $
198
42 1,620
MEDIAN PPSF
MEDIAN SALES PRICE AVERAGE DAYS ON MARKET ACTIVE LISTINGS SOLD LISTINGS 1% ↓
↑ 7% ↑ 109% ↑
*ALL PERCENTAGES REFLECT YEAR OVER YEAR CHANGE. 350K
546
23% ↑ 189%
MEDIAN SALES PRICE MEDIAN PRICE PER SF CLOSED SALES AVG. DAYS ON THE MARKET JAN 23 JAN 22 YOY% CHANGE JAN 23 YOY% CHANGE JAN 23 YOY% CHANGE JAN 23 COCOA $337,500 $292,360 15% $192 2% 65 10% 42 COCOA BEACH $577,500 $595,000 -3% $365 32% 4 -50% 52 GRANT $344,720 $673,000 -49% $193 -15% 4 33% 34 INDIALANTIC $655,000 $525,000 25% $302 9% 7 -36% 34 MALABAR $515,000 $550,000 -6% $272 8% 5 0% 72 MELBOURNE $378,750 $377,450 0% $219 3% 122 -31% 42 MELBOURNE BEACH $595,000 $676,500 -12% $355 8% 7 -13% 58 MERRITT ISLAND $438,000 $468,000 -6% $244 6% 43 -16% 47 MIMS $339,540 $235,000 44% $187 15% 27 170% 27 PALM BAY $336,490 $295,000 14% $186 6% 162 -29% 39 ROCKLEDGE $395,000 $369,000 7% $210 -1% 34 -3% 39 SATELLITE BEACH & INDIAN HARBOUR BEACH $491,750 $525,000 -6% $318 4% 18 -22% 53 TITUSVILLE $320,000 $306,900 4% $188 10% 36 -51% 60 WEST MELBOURNE $499,500 $410,000 22% $186 -8% 6 -25% 39
Neighborhood Snapshots
The average time a listing spent on the market remained the lowest in the region. The months of supply was also the lowest for single-family homes in Southeast Florida.
INDIAN RIVER COUNTY TRENDS
BREVARD COUNTY
CONDOMINIUMS | AVERAGE PRICE INCREASES
Lorem ipsum dolor sit amet, consectetur adipiscing elit. Maecenas sed commodo arcu. Mauris efficitur justo in quam faucibus pellentesque. In hac habitasse platea dictumst.
The average price in Brevard County increased by 29% from the previous year, the highest rate in the region. The share of homes sold for more than the list price increased from last month, one of the few counties where this occurred.
$ $
Neighborhood Snapshots
*ALL PERCENTAGES REFLECT YEAR OVER YEAR CHANGE. 275K 56 454 97 252 MEDIAN SALES PRICE AVERAGE DAYS ON MARKET ACTIVE LISTINGS SOLD LISTINGS MEDIAN PPSF ↑ 15% ↑ 114% ↑ 14% ↓ 32% ↑ 136%
MEDIAN SALES PRICE MEDIAN PRICE PER SF CLOSED SALES AVG. DAYS ON THE MARKET JAN 23 JAN 22 YOY% CHANGE JAN 23 YOY% CHANGE JAN 23 YOY% CHANGE JAN 23 COCOA $250,000 $240,000 4% $244 18% 2 -78% 49 COCOA BEACH $321,000 $305,000 5% $296 10% 9 -69% 38 GRANT N/A N/A N/A N/A N/A - N/A N/A INDIALANTIC $575,000 $510,000 13% $326 12% 15 275% 138 MALABAR N/A N/A N/A N/A N/A - N/A N/A MELBOURNE $204,950 $197,500 4% $195 18% 16 -36% 42 MELBOURNE BEACH $899,900 $377,500 138% $423 50% 6 50% 101 MERRITT ISLAND $140,000 $165,000 -15% $173 -18% 5 -55% 65 MIMS N/A N/A N/A N/A N/A - N/A N/A PALM BAY $199,000 $145,000 37% $218 22% 6 100% 32 ROCKLEDGE $228,000 $215,000 6% $184 14% 2 -71% 80 SATELLITE BEACH & INDIAN HARBOUR BEACH $285,000 $616,450 -54% $270 -32% 5 -64% 16 TITUSVILLE $148,750 $130,000 14% $171 19% 6 -45% 29 WEST MELBOURNE $237,000 $245,000 -3% $164 19% 3 200% 47 CONDOMINIUMS
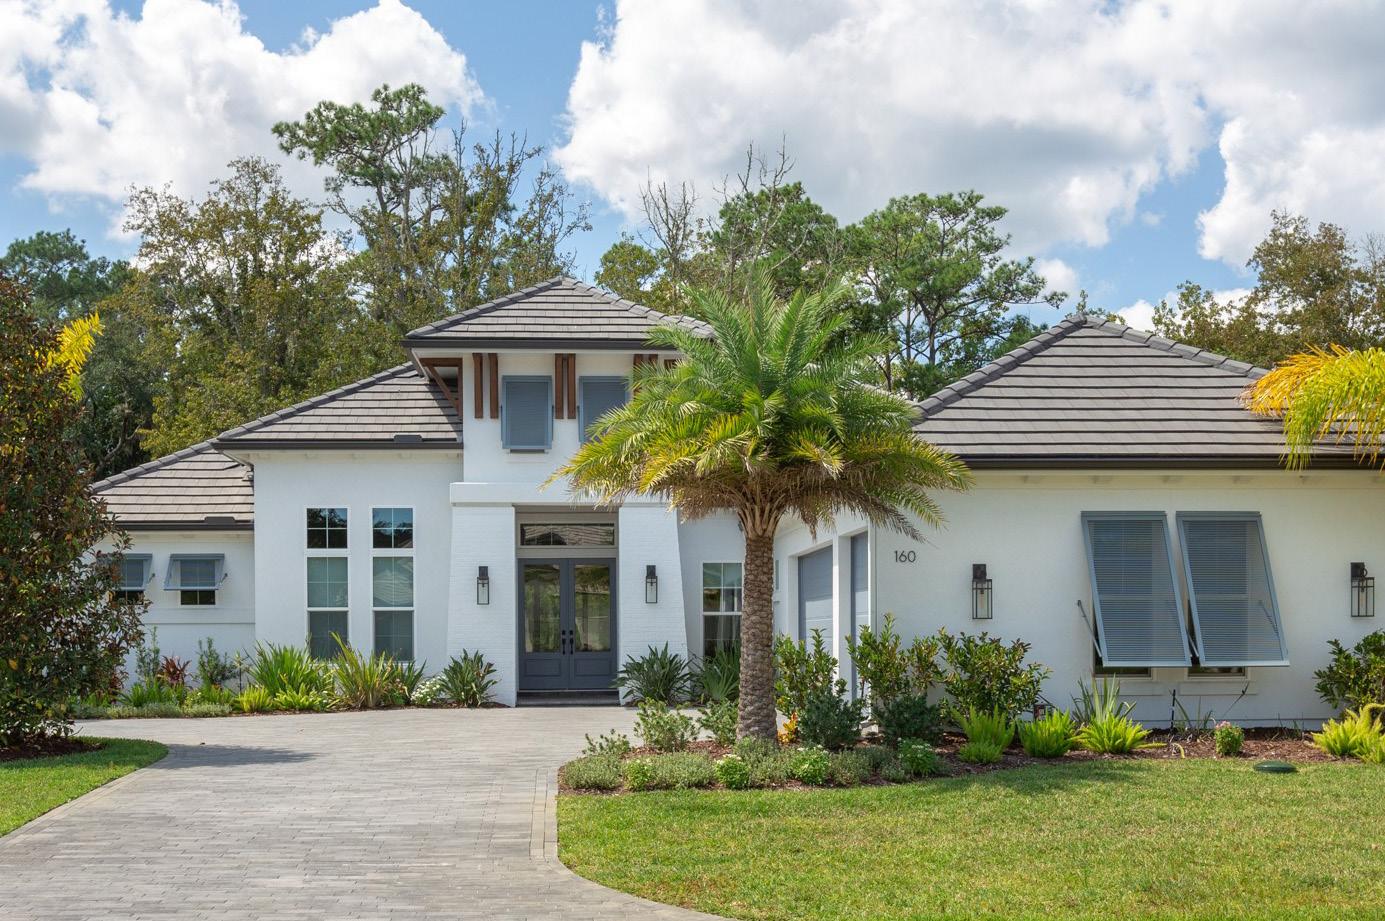
ST. JOHNS COUNTY
RESIDENTIAL | TIME ON MARKET FALLS
The average time on market decreased in January even as inventory increased throughout the county. Compared with one year ago, the average time on market increased by 76%.
Neighborhood Snapshots
*ALL PERCENTAGES REFLECT YEAR OVER YEAR CHANGE. 447K 71
238 MEDIAN SALES PRICE AVERAGE DAYS ON MARKET ACTIVE LISTINGS SOLD LISTINGS MEDIAN PPSF ↓ 1% ↑ 76% ↑ 7% ↓ 23% ↓ 5%
714 567
MEDIAN SALES PRICE MEDIAN PRICE PER SF CLOSED SALES AVG. DAYS ON THE MARKET JAN 23 JAN 22 YOY% CHANGE JAN 23 YOY% CHANGE JAN 23 YOY% CHANGE JAN 23 JULINGTON CREEK AREA $552,751 $550,000 1% $220 1% 53 -31% 80 NOCATEE $659,750 $630,000 5% $296 10% 35 -31% 58 PONTE VEDRA BEACH $700,000 $682,000 3% $335 5% 31 -42% 66 SOUTHEAST ST JOHNS COUNTY $549,900 $454,940 21% $307 -2% 35 -42% 75 ST AUGUSTINE BEACHES/ANASTASIA ISLAND $346,990 $367,615 -6% $212 7% 51 -32% 75 ST. JOHNS $451,950 $482,500 -6% $231 9% 64 10% 69 SOUTHWEST ST JOHNS COUNTY $350,000 $366,500 -5% $227 0% 17 -11% 52 ST. AUGUSTINE/VILANO BEACH $490,000 $503,500 -3% $252 -5% 26 13% 72 WORLD GOLF VILLAGE AREA/PALENCIA $450,490 $432,385 4% $233 13% 62 -39% 83
$ $
DUVAL COUNTY
RESIDENTIAL | HOMES SELLING QUICKER, YET INVENTORY GROWS
The average home sold more quickly than last month, though roughly 66% slower than one year ago, yet overall, homes in Duval County sold faster than the surrounding region. A growing number of new listings in January reversed the trend of tighter inventory and for-sale listing volume exceeded the level of one year ago.
Neighborhood Snapshots
*ALL PERCENTAGES REFLECT YEAR OVER YEAR CHANGE. 290K 59 906 785 188 MEDIAN SALES PRICE AVERAGE DAYS ON MARKET ACTIVE LISTINGS SOLD LISTINGS MEDIAN PPSF ↑ 4% ↑ 66% ↑ 9% ↓ 40% ↑ 3 %
MEDIAN SALES PRICE MEDIAN PRICE PER SF CLOSED SALES AVG. DAYS ON THE MARKET JAN 23 JAN 22 YOY% CHANGE JAN 23 YOY% CHANGE JAN 23 YOY% CHANGE JAN 23 ARLINGTON/FORT CAROLINE $270,000 $266,000 2% $179 7% 73 -46% 55 AVONDALE/RIVERSIDE/ORTEGA $350,500 $351,000 0% $246 5% 26 -45% 54 BARTRAM $345,000 $320,000 8% $198 -2% 20 -41% 56 BEACHES $587,500 $541,000 9% $334 16% 40 -38% 57 BEAUCLERC/MANDARIN $333,750 $343,750 -3% $211 9% 64 -24% 44 DOWNTOWN JACKSONVILLE $123,000 $135,000 -9% $123 3% 77 -45% 57 INTRACOASTAL $450,000 $437,900 3% $251 12% 65 -40% 50 NOCATEE (DUVAL) $400,000 $312,388 28% $259 21% 11 28% 65 NORTH JACKSONVILLE $329,900 $315,000 5% $164 5% 81 -30% 69 SAN MARCO/SAN JOSE $302,500 $325,000 -7% $207 1% 34 -13% 51 SOUTHSIDE $253,000 $234,950 8% $189 8% 109 -34% 64 WEST JACKSONVILLE $250,000 $251,074 0% $164 1% 137 -52% 69
$ $
CLAY COUNTY
RESIDENTIAL | PRICING STEADY WHILE SALES SLOW
The median price stabilized, but sales decreased from last month by 33% and by 41% from last year. Though volume was still lower, sales of homes priced greater than $500,000 outperformed the most affordable price tiers in January.
Neighborhood Snapshots
*ALL PERCENTAGES REFLECT YEAR OVER YEAR CHANGE. 340K 78 235 178 183 MEDIAN SALES PRICE AVERAGE DAYS ON MARKET ACTIVE LISTINGS SOLD LISTINGS MEDIAN PPSF ↑ 6% ↑ 129% ↑ 5 % ↓ 41% ↑ 16%
MEDIAN SALES PRICE MEDIAN PRICE PER SF CLOSED SALES AVG. DAYS ON THE MARKET JAN 23 JAN 22 YOY% CHANGE JAN 23 YOY% CHANGE JAN 23 YOY% CHANGE JAN 23 FLEMING ISLAND $426,500 $421,250 1% $191 5% 26 -38% 65 GREEN COVE SPRINGS $357,228 $315,000 13% $174 -1% 20 -41% 89 MIDDLEBURG/KEYSTONE $345,000 $305,500 13% $194 9% 47 -44% 57 ORANGE PARK $330,000 $290,320 14% $173 3% 19 -64% 63 OAKLEAF PLANTATION $277,000 $355,000 -22% $189 17% 42 -11% 120
$ $
NASSAU COUNTY
RESIDENTIAL | SALES HOLD UP BETTER THAN REGION
Sales slowed modestly in January, outperforming all other counties, yet remained 10% lower than one year ago. The number of homes sold for more than $1 million increased from the previous month and exceeded the total of last January.
Neighborhood Snapshots
*ALL PERCENTAGES REFLECT YEAR OVER YEAR CHANGE. 389K 76 258 261 206 MEDIAN SALES PRICE AVERAGE DAYS ON MARKET ACTIVE LISTINGS SOLD LISTINGS MEDIAN PPSF ↓ 6% ↑ 78% 0% ↓ 10% ↑ 105%
MEDIAN SALES PRICE MEDIAN PRICE PER SF CLOSED SALES AVG. DAYS ON THE MARKET JAN 23 JAN 22 YOY% CHANGE JAN 23 YOY% CHANGE JAN 23 YOY% CHANGE JAN 23 AMELIA ISLAND/FERNANDINA BEACH $612,500 $519,000 18% $271 4% 78 -21% 72 YULEE/WILDLIGHT $348,000 $343,500 1% $182 0% 45 18% 65
$ $
FLAGLER COUNTY
RESIDENTIAL | PRICING IS STILL HIGHER THAN LAST YEAR
The median price remained 5% higher than one year ago but fell by 4% in January. The average time on the market decreased from December but remained 65% higher than last January.
Neighborhood Snapshots
*ALL PERCENTAGES REFLECT YEAR OVER YEAR CHANGE. 356K 62 379 235 198 MEDIAN SALES PRICE AVERAGE DAYS ON MARKET ACTIVE LISTINGS SOLD LISTINGS MEDIAN PPSF ↑ 5% ↑ 65% ↑ 3% ↓ 34% ↑ 60 %
MEDIAN SALES PRICE MEDIAN PRICE PER SF CLOSED SALES AVG. DAYS ON THE MARKET JAN 23 JAN 22 YOY% CHANGE JAN 23 YOY% CHANGE JAN 23 YOY% CHANGE JAN 23 BUNNELL $315,990 $320,000 -1% $174 -8% 15 36% 44 FLAGLER BEACH $575,000 $420,000 37% $289 -9% 5 -67% 50 PALM COAST $358,900 $340,000 6% $198 3% 121 -44% 68
$ $

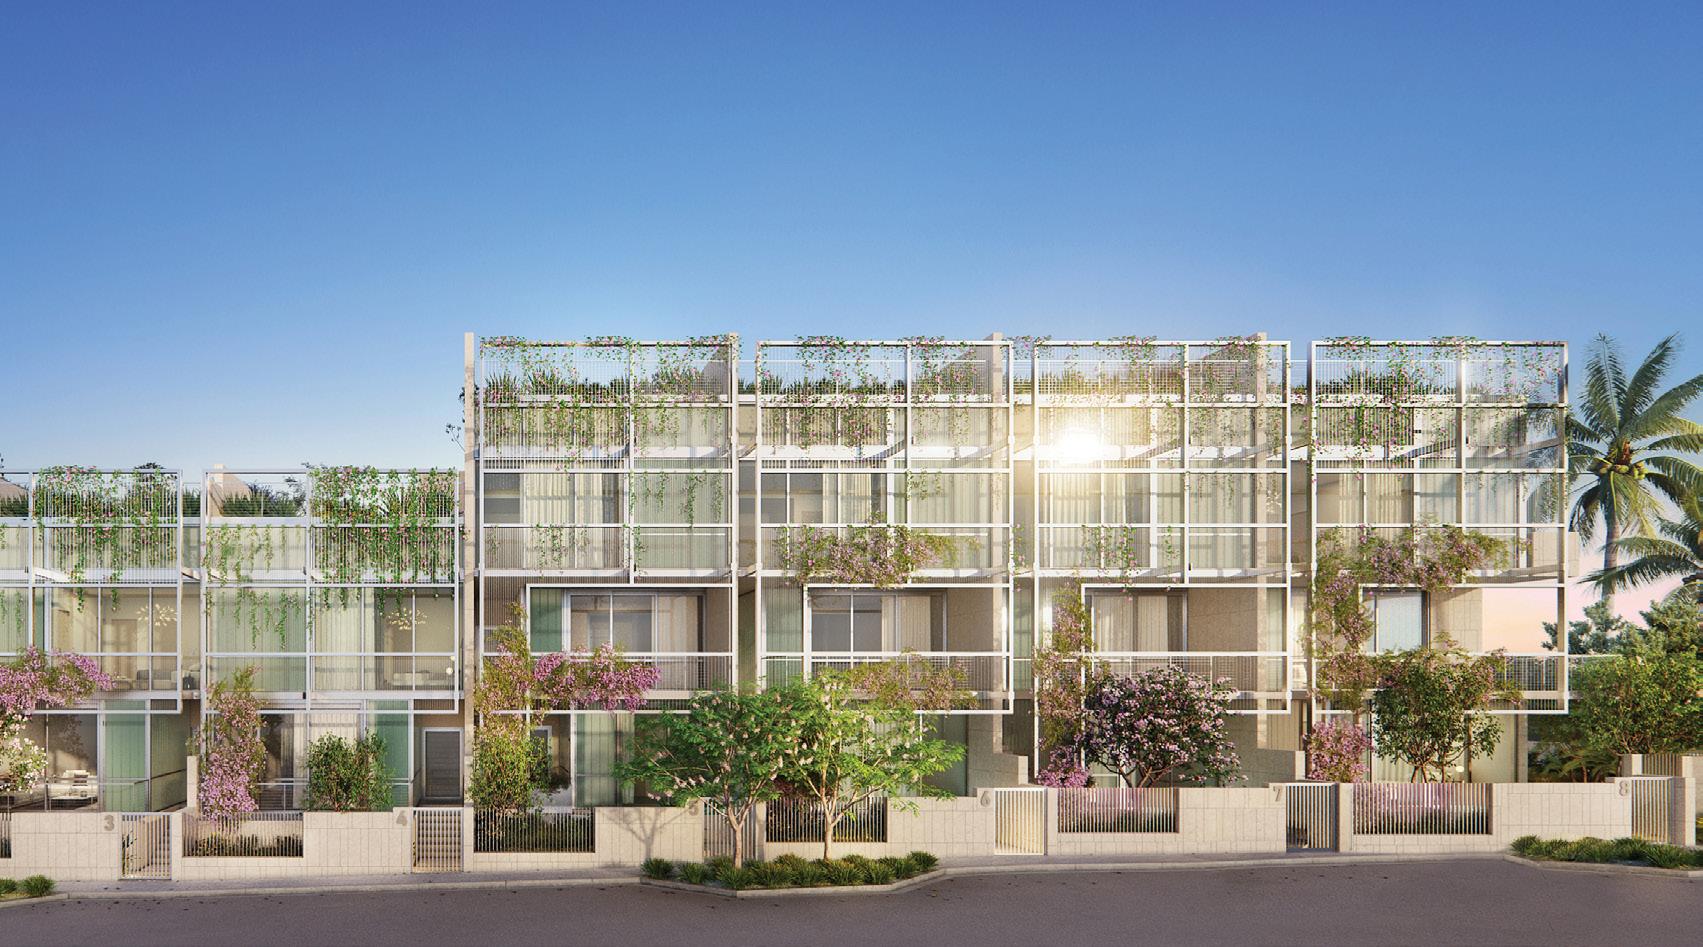

This collection of eight unique homes embraces the charming residential character of Surfside while recognizing the essentials of modern living. No two homes are identical, and a choice of three-, four- or five-bedrooms – plus a variety of bespoke options – cater to discerning tastes and the cultivated lifestyles of those who will call it home. A COLLECTION OF PRIVATE BEACH HOMES DESIGNED BY RENE GONZALEZ ARCHITECTS A NEW STANDARD OF URBAN BEACH LIVING Residences Priced From $5.7M SCHEDULE A PRIVATE PREVIEW surfrowresidences.com | surfrow@onesothebysrealty.com | (786)-288-0874 @SURFROWRESIDENCES FOLLOW US This offering is made only by the prospectus for the condominium and no statement should be relied upon if not made in the prospectus. Prices, plans and specifications are subject to change without notice. ORAL REPRESENTATIONS CANNOT BE RELIED UPON AS CORRECTLY STATING THE REPRESENTATIONS OF THE DEVELOPER. FOR CORRECT REPRESENTATIONS, MAKE REFERENCE TO THIS BROCHURE AND TO THE DOCUMENTS REQUIRED BY SECTION 718.503, FLORIDA STATUTES, TO BE FURNISHED BY A DEVELOPER TO A BUYER OR LESSEE.’
For unmatched real estate expertise © 2023 ONE Sotheby’s International Realty. All rights reserved. Sotheby’s International Realty® and the Sotheby’s International Realty Logo are service marks licensed to Sotheby’s International Realty Affiliates LLC and used with permission. ONE Sotheby’s International Realty fully supports the principles of the Fair Housing Act and the Equal Opportunity Act. Each franchise is independently owned and operated. Any services or products provided by independently owned and operated franchisees are not provided by, affiliated with or related to Sotheby’s International Realty Affiliates LLC nor any of its affiliated companies. The information contained herein is deemed accurate but not guaranteed.
