


NEP 2020 based | Technology powered
Accelerate TERM I
COMPUTER SCIENCE GRADE 8


Standing at the forefront of the digital and AI revolution, the importance of coding and computational skills has reached unprecedented heights. In today’s professional landscape, whether it’s in the fields of medicine, space exploration, education, science, or business, no sector remains untouched by this transformative wave. To not just survive but thrive in the 21st century, basic computer literacy is no longer sufficient. Learners must evolve into “digital natives” who can fluently read, write, and communicate in the languages that machines and AI comprehend.
Recognizing this imperative, the National Education Policy of 2020 (NEP 2020) has strongly recommended the integration of coding skills, computational thinking, critical analysis, and problem-solving abilities into the curriculum. Moreover, forward-looking subjects like AI, Data Sciences, Computer Applications, and IT have been introduced as elective subjects from grade 9 onwards. It wouldn’t be surprising if further transformative measures are taken even at the elementary education level.
Uolo has introduced an innovative 360-degree program for a coding-focused computer science curriculum, known as Tekie, spanning grades 1 to 8. Tekie is a significant stride towards STEM education that aims at making learners future ready—enabling them with skills needed in the ever-changing, technology-driven, and dynamic 21st-century world.
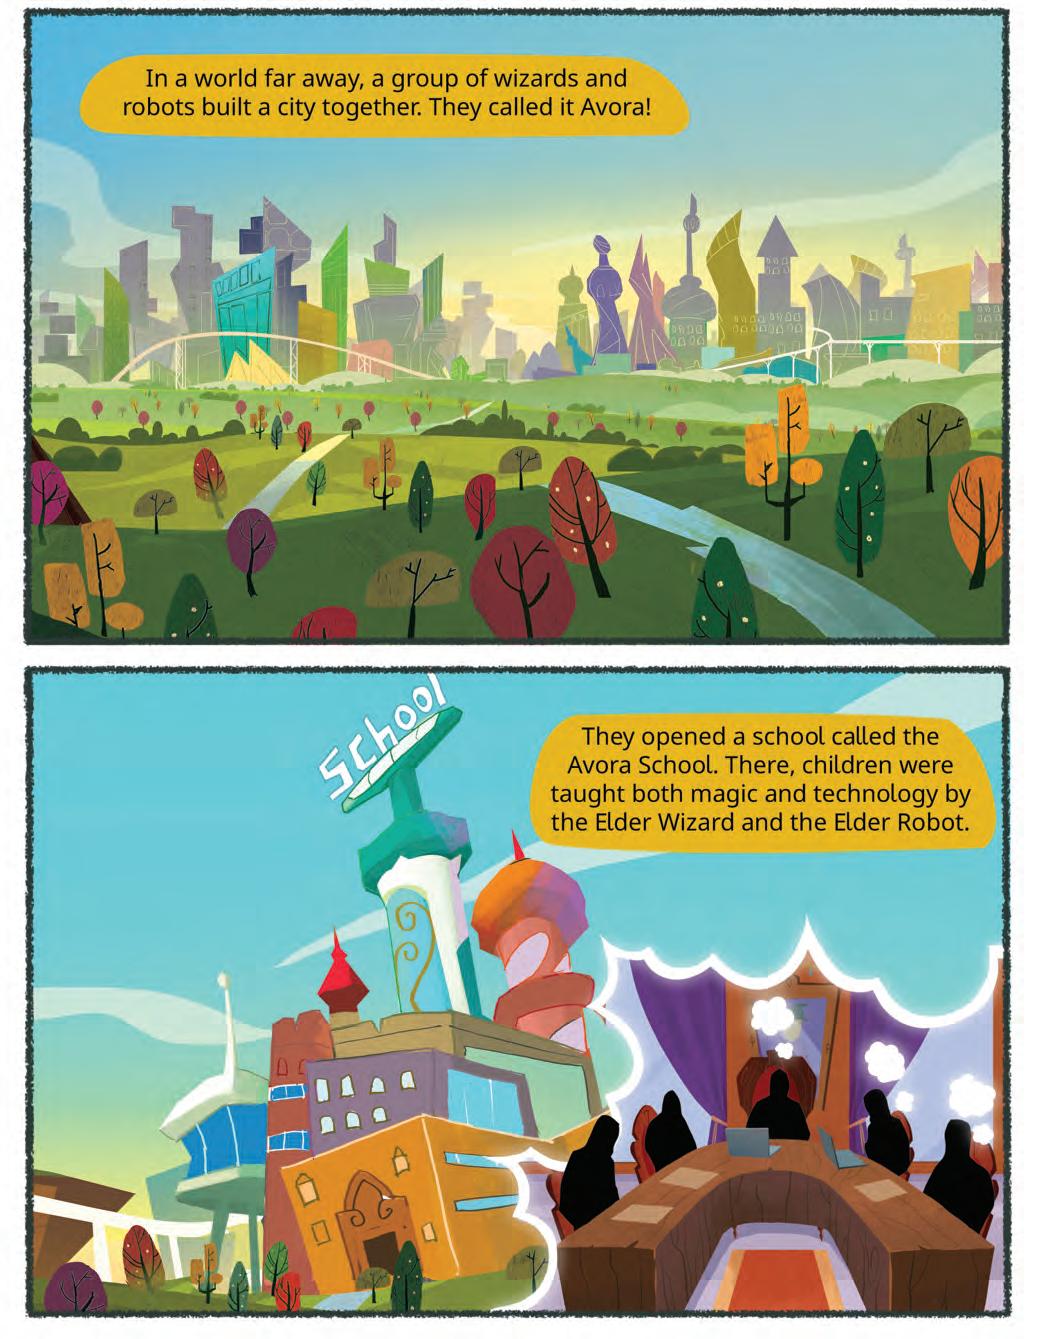
Tekie adopts a captivating and engaging approach to learning, in line with the recommendations of the NEP 2020. The curriculum is ingeniously woven into the thrilling adventures of Mel and Conji, fictional characters from the enchanting land of Avora. The Mel and Conji series epitomizes a modern method of acquiring Computer Science knowledge and honing coding skills and computational thinking.
Tekie is a technology-empowered curriculum that encompasses a few key components:
• Main Content Books: These introduce learners to the theory of computer science and the tools used in the field. Topics in AI are also covered, along with experiential and curiosity-based learning resources.
• Coding Book: Specifically designed to nurture coding skills, this booklet aligns with the experiential and contextual learning approach of the curriculum, fostering critical thinking and problem-solving abilities.
• Animated Learning Videos: The program is powered by high-quality animation-based learning videos that deliver learning in an engaging manner.
• Teacher Manual: This valuable resource supports classroom instruction, ensuring that educators can effectively deliver the curriculum.
Welcome to the captivating realm of Tekie! We hope you relish this educational journey as it equips you with the tools you need to thrive in the exciting and ever-changing world of the 21st century.
Each chapter has been divided into two key sections.
In every grade, students embark on an immersive experience in the “Adventures of Mel and Conji”. Within each chapter, in the initial section (Section A), the story unfolds, enveloping learners in an exciting journey. Through the story, students actively connect with fundamental concepts in the realm of Computer Science.
This section of the chapter focuses on the essential academic content. It provides the learning goals and assists teachers in their classroom instruction.
This section also includes the following academic assets:
HOTS questions to trigger engaging group discussions in the classroom.

Interesting facts related to the application of a concept.
Why is algorithmic thinking important? Explain with the help of an example.
Did You Know?
The smiley face emotion “:-)” created in 1982 is considered one of the earliest forms of user interface design.

Probing questions to stimulate HOTS at individual level.
Milestone exercises to practise specific concepts.

QR codes to explore an exciting application of the concept. This element builds curiosity in children and helps them grasp concepts through digital visual aids.


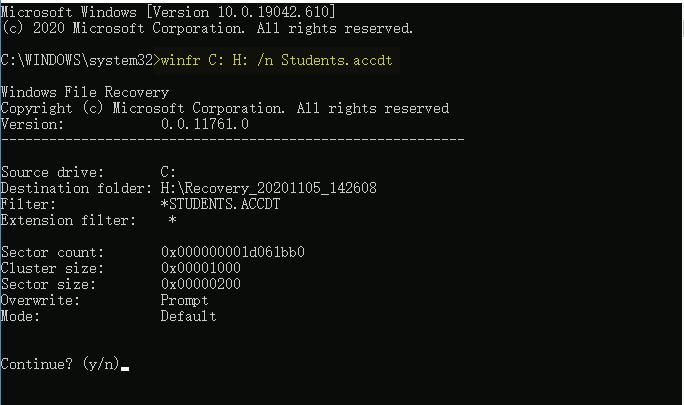
Scan the QR code to learn more about multitasking operating systems.
This is the chapter summary. It enables learners to glance through all key concepts covered in the chapter.
A pool of questions catering to all topics and skills covered in the chapter.

An operating system (OS) is an important component of a computer. It is a program that controls and manages computer hardware. An OS acts as an interface between a user and a computer system. The OS gives the facility to smoothly run programs like games, word processors, and web browsers to its users. The operating system controls various activities like organising and storing files on your computer’s storage device effectively and efficiently.


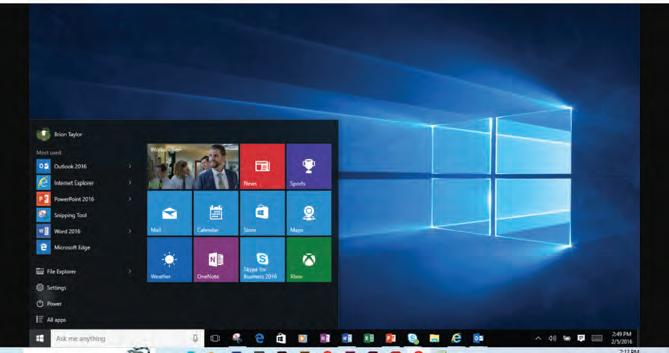
An operating system ensures that users can work on multiple programs simultaneously. It also helps you interact with the computer through devices like mouse, keyboard, printer, and monitor. Some examples of operating systems include Microsoft Windows, macOS, Linux, and Unix. Each of these operating systems has its own features, user interfaces, and characteristics, but they all serve the fundamental purpose of managing computer resources and providing an environment for running applications smoothly.
The original name of Microsoft Windows was “Interface Manager”. Microsoft eventually changed the name to “Windows” because of the rectangular windows that were a prominent feature of the graphical user interface (GUI).

An operating system is like the boss of the computer that makes sure everything runs smoothly, keeps things organised, and helps us use the computer easily and safely.
Operating system handles the following responsibilities:
It controls and manages all the computer resources.
It provides an interface to users.
It hides the complexity of software.
It supports multiple execution modes.
It monitors the execution of user programs to prevent errors.
The first computer operating system called General Motors-North American Aviation Input/Output System (GM-NAA I/O) was created in the 1950.
An operating system carries out various important functions that help in the smooth running of a computer. Here are a few functions of an operating system:
An operating system manages everything on a computer. It makes sure that all the games, apps, programs, applications, and files work together.
It allocates and deallocates memory space to running processes, ensuring efficient use of RAM.
It is easy to use. You can click icons and buttons because the operating system gives you a friendly way to talk to the computer.
An operating system protects a computer from viruses and hackers. It checks who is allowed to use it.
An operating system detects and handles errors or crashes, preventing a single application or hardware issue from crashing the entire system.
Write T for True and F for False.


1 An operating system allows viruses to enter your computer system.
2 An operating system deallocates memory space to running processes, ensuring efficient use of RAM.
Following are the different types of operating system:
A single-user operating system is designed for personal use and allows one person to use the computer at a time. This operating system provides a user-friendly interface, supports various applications, and can be customised to suit individual preferences. It is the type of operating system most people use on their personal laptops or desktop computers. Following are the functions of a single-user OS.
1. In a single-user operating system, only one individual can log in and use the computer at a time. This ensures that the computer’s resources, such as the CPU, memory, and storage, are dedicated to a single user’s tasks and processes.
2. The user of a single-user operating system has the authority to install and run software, manage files and folders, and configure system settings according to their preferences.
A multiuser operating system is a computer system that allows multiple users that are on different computers or terminals to access shared resources and data at the same time. Following are the functions of a multiuser OS.
Unlike single-user systems where only one user can use the computer at a time, a multiuser operating system allows several users to log in and work on the same machine simultaneously. Each user has their own login credentials and can perform tasks independently.
The operating system efficiently manages and allocates computer resources to different users and their respective processes. This ensures that every user gets a fair share of the available resources.
To maintain privacy and security, a multiuser operating system ensures that one user’s data and activities are isolated from others. Users cannot access each other’s files without proper authorisation.
Fill in the blanks.
Scan the QR code to learn the differences between single-user and multiuser operating systems.
1 In an operating system, many users can access the resources of the computer simultaneously.
2 A operating system can be customised to suit individual preferences.
A multitasking operating system is a type of operating system that allows a computer to run and manage multiple tasks or processes simultaneously. In context to multitasking operating system, some key points are:
1. In a multitasking operating system, simultaneous tasks are like a computer juggling multiple activities at once, such as running different programs or serving multiple users, ensuring everyone can work without interruption.
2. This type of operating system helps your computer effectively manage its resources such as the CPU and memory. The operating system ensures that these resources are used wisely, so your computer can switch between tasks quickly without slowing down.
3. Multitasking operating systems boost your computer’s productivity. They allow you to work more efficiently, making it easier to complete multiple tasks and get things done faster.
Multitasking operating systems are the reason you can listen to music, browse the web, and chat with friends on your computer or smartphone all at the same time, just like having multiple superpowers for your device!
A real-time operating system (RTOS) is a specialised computer operating system designed for tasks that require extremely precise and predictable timing and responsiveness. In context to RTOS, some key points are:
1. A RTOS is engineered to provide rapid and consistent responses to processes or tasks. It ensures that critical actions occur without delay, making it suitable for applications where timing is crucial, such as controlling machinery and instruments.
2. RTOS ensures that tasks start and finish at a specific time, which is essential for applications such as data acquisition, where data must be sampled at fixed intervals without deviation.
3. A RTOS guarantees that tasks are executed with precise and consistent timing. This reliability ensures that critical operations, such as controlling machinery or processing data, occur predictably and within specified time constraints, which is crucial for applications like industrial automation.
A distributed operating system is a type of operating system that manages multiple computers or devices that are connected to each other via a single communication channel, to work together seamlessly as if they were a single, coordinated entity. In context to a distributed operating system, some key points are:
A distributed operating system allows computers to cooperate on tasks, share resources, and communicate over a network. This networked collaboration enhances the efficiency and capabilities of the entire system.
It facilitates the sharing of computing resources such as CPU power, storage, and data across various computers within the network.
It ensures efficient communication between various computer systems, enabling them to work in harmony and perform tasks that would be challenging for a single computer.
Fill in the blanks.
1 A distributed operating system enables computers to work together seamlessly.
2 There is a communication channel in a distributed operating system.
A user interface (UI) works as a bridge that allows people to communicate with computers, smartphones, and various digital devices in a manner that is simple and easy to use. A UI encompasses all the elements and design components that users see and interact with on their monitor screens.
A UI includes various graphical and interactive elements, such as buttons, menus, forms, icons, text, images, and more. Its primary purpose is to make user interactions with the software efficient.
The smiley face emotion “:-)” created in 1982 is considered one of the earliest forms of user interface design.
Let us discuss the following UIs in this chapter.
Character user interface
Graphical user interface
A character user interface, also known as a command line interface (CLI) is a user interface that requires users to type text commands to interact with the computer system. These commands are handled by command-line interpreters.
Examples of operating systems that use CUI are DOS, Windows Command Prompt, and Unix.
A GUI is a user interface that employs graphical elements such as icons, buttons, windows, and menus, to enable users to interact with computers and software applications. It provides an intuitive and visual based means of navigating, controlling, and accessing digital content, making computing more user-friendly for individuals who may not have extensive technical knowledge.
Windows is the most popular GUI-based operating system.
Let’s learn about the striking differences between the two interfaces.
Appeal
Ease of Learning
Interaction Elements
Command Learning
Multitasking
Input Devices
Feedback
Attractive and appealing Relatively less appealing
Easier to learn and user-friendlyRequires expertise
Icons, menus, buttons, etc.Text-based commands
No need to learn complex commands
Requires memorisation of commands
Supports multitasking with windows Limited multitasking capability
Supports mouse and keyboardKeyboard only
Provides immediate visual feedback of the action performed
Limited or no visual feedback of the action performed
Have you ever wondered why a computer mouse is called a ‘mouse’? Well, it is because the inventor, Douglas Engelbart, thought the cord of the first mouse looked like a tail. So, just like a mouse scurrying around with its tail, the computer mouse helps you move things around on a computer screen!
Explore the icons and symbols you see on your device. What do these symbols represent, and how do they make using apps and devices easier?

1 Operating system is a program that controls and manages computer hardware. It acts as an interface between the user and computer system.
2 There are different types of operating systems like the single-user, multiuser, multitasking, real-time, and distributed operating systems.
3 In a single-user operating system, one user has exclusive control over the computer’s resources.
4 A multiuser operating system allows multiple users to work on the same computer simultaneously.
5 A multitasking operating system allows a computer to run and manage multiple tasks or processes simultaneously.
6 A real-time operating system (RTOS) is designed for tasks that require extremely precise and predictable timing.
7 A distributed operating system manages multiple computers that are connected to each other via a single communication channel.
8 A character User Interface, also known as a Command Line Interface (CLI), is a user interface that requires the user to type text commands to interact with a computer system.
9 A GUI is a type of user interface that employs graphical elements such as icons, buttons, windows, and menus, to enable users to interact with computers and software applications.
A. Fill in the Blanks.
Hints complex multitasking operating system GUI single-user
1 is a program that controls and manages computer hardware.
2 The user of the operating system has the authority to install and run software according to their preferences.
3 operating systems boost your computer’s productivity.
4 A is a type of user interface that employs graphical elements such as icons, buttons, windows, and menus.
5 A graphical user interface doesn’t require you to remember commands.
1 I have the authority to install and run software, manage files and folders, and configure system settings according to my preferences.
2 I can get you anything at a click of a button, you don’t need to remember any complicated commands.
3 I ensure efficient communication between various computers so that they can work in harmony.
4 I am deployed in applications where split-second timing and timely-responsiveness are paramount.
1 The distributed operating system doesn’t allow computers to share resources.
2 A GUI is simple and doesn’t require knowing a lot of computer technicalities.
3 An RTOS guarantees that tasks are executed in a predictable and deterministic manner.
4 Microsoft Windows is an example of an operating system.
5 A GUI does not provide feedback to users to let them know what is happening.
1 What is the need of an operating system?
2 What is UI?
3 What is GUI? How does it make our work easier?
4 Give one difference between the single and multiuser operating systems.
5 What are the features of a real-time operating system?
1 Mohini’s mother got herself a new computer. Mohini excitedly interacts with the computer through its graphical elements such as icons, buttons, and menus. What type of interface is she using?
2 Shehnaz is working on a device that allows her to only type the commands using a keyboard. Name the interface that she is working on.
3 Rohit has an operating system on his laptop that is designed for personal use and allows one person to use the computer at a time. Name the type of operating system he has on his system.
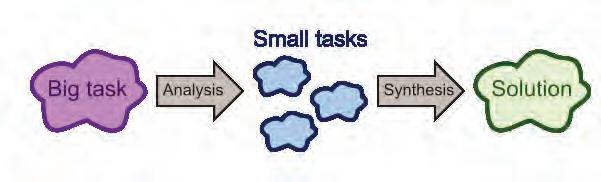
Computational thinking (CT) is the process of conceptualising problems in such a way that the resulting solutions can be viewed as computational operations and algorithms. In simple words, it’s like turning a big problem into small, easy-to-understand pieces that you can solve. It’s the first thing you do before you start telling a computer what to do. You break the problem into tiny steps, like giving the computer a recipe to follow. Using computational thinking, you can solve puzzles, play games, do homework, break big problems into smaller steps, or find patterns.
In order to carry out computational thinking, there are four essential skills/pillars that must be acquired. Let us discuss them one at a time.
• Decomposition
• Pattern recognition
• Abstraction
• Algorithmic design
4 Pillars of Computational Thinking
Decomposition Pattern Recognition Abstraction
Algorithmic Design
Decomposition is the process of dividing a difficult activity or problem into smaller, easier-to-solve components or sub-problems.
Through independent analysis and treatment of each smaller component, this method makes problemsolving more feasible.
The stages you usually take while decomposing a problem are as follows:
Identify the Problem Clearly state the objectives and conditions of the issue you are trying to solve.
Break It Down
Separate the main issue into smaller issues or jobs. Each minor issue ought to be a stand-alone solution that aids in resolving the main issue.
Suppose you want to go on a trip to Nainital. Before the trip, you need to ensure that everything is arranged.
Here, the problem statement is to check if all the arrangements for a trip to Nainital are done.
Now, let us break down this problem into smaller subproblems:
1. How many travellers are there?
2. When is the departure date?
3. When is the arrival date?
4. How long will the trip last?
5. What are the places to visit?
Pattern recognition is a data analysis method that uses machine learning algorithms to automatically recognise patterns and regularities in data. This data can be anything from text and images to sounds or other definable qualities. Pattern recognition systems can recognise familiar patterns quickly and accurately.
Now, to identify the places to visit in Nainital, we need to identify the pattern of people frequently visiting places.
The technique we use to identify the most visited places is pattern recognition. Pattern recognition is also applied when we observe our current problems and check if a previously identified solution can solve them.
Abstraction means focusing on the most important parts and ignoring the details that don’t matter.
Imagine you want to go on a hike during your trip. You can bring a map of the hiking route with you. Maps are a great example of abstraction. You can just focus on the hiking route you will take. This way, you can leave out all the unnecessary details on the map that you don’t need to know to go on this hike.
In computer science, the set of steps that solves a specific problem is called an algorithm.
Algorithmic design is a critical problem-solving skill. It strengthens the ability to create a process for finding a solution as opposed to focusing on the answer itself.

While trekking, when we reach the top, we need to set up a tent to spend the night there.
Let us look at the steps to set up the tent:
1. Find a clean, flat spot.
2. Lay out the tent and its parts.
3. Connect the sticks and put them through the tent.
4. Attach the cover and secure it with pegs.
5. Double-check everything to make sure it’s set up right.
This set of steps makes the task of building the tent much easier.
One of the main reasons that algorithmic thinking is important for students is because it enhances a student’s ability to think critically. It broadens their minds to the additional capabilities of a particular solution and helps them see a problem more holistically.
After understanding the computational thinking approach and its usage for problem-solving, let’s explore algorithms and flowcharts.

In what ways can computational thinking be integrated into various subjects, such as mathematics, science, or social studies, to enhance problem-solving skills and critical thinking?
An algorithm is a step-by-step process to complete a task or solve a particular problem.
The key characteristics of a good algorithm are:
Clear Inputs and Outputs: A good algorithm specifies what information is needed at the beginning (inputs) and what it will produce at the end (outputs).
No Ambiguity: Its instructions must be crystal clear, avoiding any confusion.
Precise Steps: It should offer specific steps for problem-solving, eliminating uncertainties.
Efficiency: A good algorithm should solve problems quickly and efficiently.
Termination: It must end after a finite number of steps, preventing endless loops.
Universal: Algorithms should work across various programming languages, ensuring versatility.
These qualities make algorithms effective and reliable for solving a wide range of problems.
The steps to develop an algorithm are:
1. Understanding the Problem: Clearly understand the problem to be solved.
2. Defining Inputs and Outputs: Identify what information the algorithm will take as an input and what it will produce as an output.
3. Designing the Algorithm: Plan the step-by-step process to solve the problem.
4. Testing and Debugging: Testing is the process of evaluating a software application or code to identify and fix issues or bugs. Debugging is the process of identifying, analysing, and fixing errors or bugs in the code that cause the software to behave incorrectly.
How can computational thinking concepts, such as algorithms and problem-solving, be applied to everyday life situations outside the classroom?
Here is an example of an algorithm.
Example: Algorithm to go to school:
Step 1: Wake up.
Step 2: Get ready.
Step 3: Have breakfast.
Step 4: Check your bag.
Fill in the Blanks.
Step 5: Keep your lunch and bottle.
Step 6: Leave home.
Step 7: Travel to school.
Step 8: Stop.
1 Computational thinking involves breaking down complex problems into steps.
2 is a process of simplifying a problem by removing unnecessary details.
Algorithms can be written in various forms, including natural language, pseudocode, or programming languages like Python. Some samples of how an algorithm can be expressed in various forms are:
Algorithm: Calculate the sum of two numbers.
Step 1: Start
Step 2: Get the first number
Step 3: Get the second number
Step 4: Add the first number to the second number
Step 5: Display the result as the sum
Step 6: Stop
Algorithm: Calculate the sum of two numbers.
START
INPUT firstNumber
INPUT secondNumber result = firstNumber + secondNumber
OUTPUT result
END
Python
Algorithm: Calculate the sum of two numbers
# Input
num1 = float (input (“Enter the first number: “))
num2 = float (input (“Enter the second number: “))
# Calculate the sum sum_result = num1 + num2
# Display the result print (“The sum of”, num1, “and”, num2, “is:”, sum_result)
These samples illustrate how the same algorithm, which calculates the sum of two numbers, can be expressed in natural language, pseudocode, and the Python programming language. Each form provides a way to describe the steps involved in solving a problem, catering to various levels of detail and specificity.
A flowchart is a visual representation of an algorithm or process, using symbols and arrows to illustrate the sequence of steps.
To learn more about algorithmic thinking, scan this QR code.
Think and Tell
Imagine you are a chef, and your job is to bake a perfect chocolate cake. Just like following a recipe, you have to follow a set of step-by-step instructions. What do you think would happen if you mixed up the steps or left some out? How important is it to follow the ‘algorithm’ (recipe) correctly when baking a cake?
Flowcharts use symbols such as rectangles, diamonds, ovals, and arrows to represent various elements and actions, such as processes, decisions, and the flow of control of an algorithm.
The following figure shows the symbol, its name, and its description:
SymbolSymbol Name Description
Start/stop terminalThis symbol is used to represent the start and stop of the flowchart.
Input/outputThis symbol is used to represent the input and output of the flowchart.
ProcessingThis symbol is used to represent the processing like arithmetic operations, data assignments, etc.
Decision This symbol is used to check whether condition is true (yes) or false (no).
Flow lines (arrows) This symbol is used to connect the symbols. It indicates the direction of the flow.
From simple calculations to complex decision-making processes, flowcharts are employed to address a wide range of problems. They help visualise solutions and dissect challenges into manageable steps.
Here is an example of a flowchart that calculates the sum of two numbers.
Input variables num1, num2, and sum
Read num1 and num2
sum = num1 + num2
Print sum
If you want to determine whether the sum of two numbers is even or odd, you need to use a decision block (often represented by a diamond shape in flowcharts). Here is an updated flowchart that includes a decision block:
Input variables num1, num2, and sum sum = num1 + num2
Read num1 and num2
In a real-world scenario, think about how you would apply computational thinking elements like decomposition, pattern matching, abstraction, and algorithm design to plan and organise a school event, such as a science fair. Describe how you would use these elements to ensure that the event runs smoothly and efficiently.
1 Computational thinking is a strategy for solving problems that is used to handle complex problems.
2 Decomposition is the process of breaking problems into smaller ones in order to make them easier to solve.
3 To establish detailed problem-solving techniques, algorithms are built.
4 A fundamental idea is an abstraction, which focuses on important aspects while discarding unimportant details.
5 Pattern recognition simplifies the identification of recurring themes within problem solutions.
6 Algorithmic thinking is a component of computational thinking. It emphasises creating step-by-step algorithms to solve specific problems.
7 An algorithm is a step-by-step process to complete a task or solve a particular problem.
8 A flowchart is a visual representation of an algorithm or process using symbols and arrows to illustrate the sequence of steps.
A. Fill in the Blanks.
Hints pattern algorithmic simpler solving flowchart
1 Computational thinking is a strategy for problems that is used to handle complex problems.
2 A is a visual representation of an algorithm or process using symbols and arrows to illustrate the sequence of steps.
3 The four pillars that define computational thinking are decomposition, pattern recognition, abstraction, and design.
4 Decomposition is the process of breaking down complex problems into parts.
5 recognition simplifies the identification of recurring themes within problem solutions.
1 What is computational thinking?
a A type of computer programming language
c A hardware component of a computer
b A strategy for solving problems
d A type of computer virus
2 Algorithmic thinking involves:
a Creating random steps to solve a problem
b Developing a step-by-step process for problem-solving
c Drawing pictures to represent solutions
d Ignoring data and patterns
3 Which of the following is NOT a pillar of computational thinking?
a Decomposition
c Abstraction
b Pattern recognition
d Flowchart
4 When you break down a complex problem into smaller, manageable parts, you are using:
a Pattern recognition
c Decomposition
5 An algorithm must be:
a Ambiguous and open to interpretation
c Well-defined and unambiguous
b Abstraction
d Algorithmic design
b Written in natural language
d Complex and lengthy
1 I focus on the most important parts and ignore the details that don’t matter.
2 I am a step-by-step set of instructions for solving a specific problem.
3 I involve recognising patterns and similarities in data to make sense of information.
4 I am a fundamental concept in computer science, involving the development of efficient problem-solving strategies.
5 I am the visual representation of an algorithm or process using symbols and arrows to illustrate the sequence of steps.
1 Abstraction is one of the key pillars of computational thinking.
2 An algorithm is a step-by-step procedure for solving a problem.
3 Algorithms should work across various programming languages, ensuring versatility.
4 Computational thinking is only applicable to computer science and programming.
5 A good flowchart should solve problems quickly and efficiently.
1 What is computational thinking, and how does it differ from algorithmic thinking?
2 Why do you use the decision box in a flowchart? Explain.
3 Write the names of any two symbols that are used in a flowchart. Also, draw their symbols and write their functions.
4 Write any three characteristics of an algorithm.
5 What is the benefit of using an algorithm and a flowchart together?
1 Pari wants to design a step-by-step algorithm to plan a trip. Help her do so.
2 Roop has been given the task of drawing a flowchart to calculate the area of a circle. How can she do it?
3 Lakshay wants to create a flowchart for calculating the average of a list of numbers. Help him by discussing all the symbols used to create a flowchart.
4 Shaurya wants to display a condition X < Y while creating a flowchart. Suggest her the correct shape to put the statement.
5 Pihu has drawn a flowchart, but she used a wrong shape to display the statement Z = A + B + C. Suggest her a correct shape to put the statement.
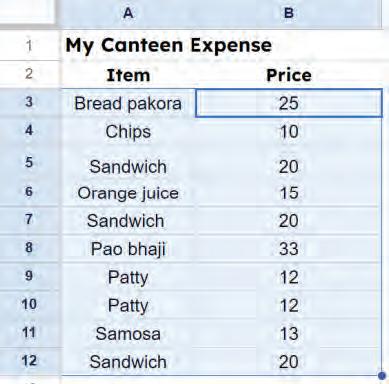
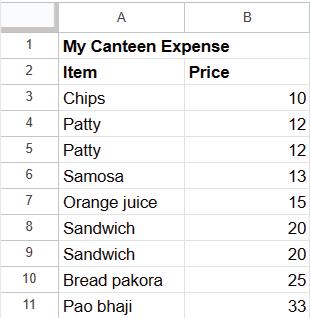
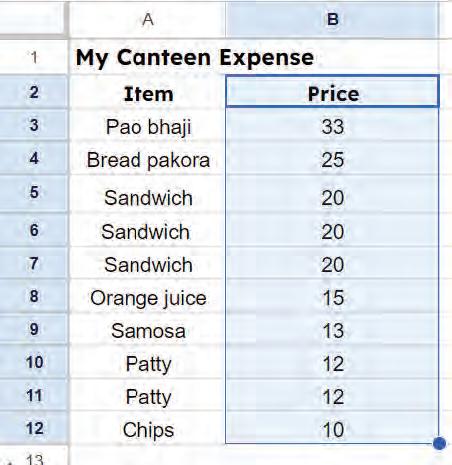
Let us say your parents allow you to have lunch with your friends in the school canteen.
Yes, you can with the help of a spreadsheet!

Can you find out how much money you and your friends spent in the canteen altogether?


A spreadsheet is a tool that helps you organise data in rows and columns and do calculations.


There are many spreadsheet software options available, such as Microsoft Excel and Google Sheets.
While Excel is a licenced software, whereas Google Sheets is free. Google Sheets lets you create spreadsheets online and collaborate with others.


Let us create a spreadsheet to track how much money you have spent eating in the canteen. To do this:
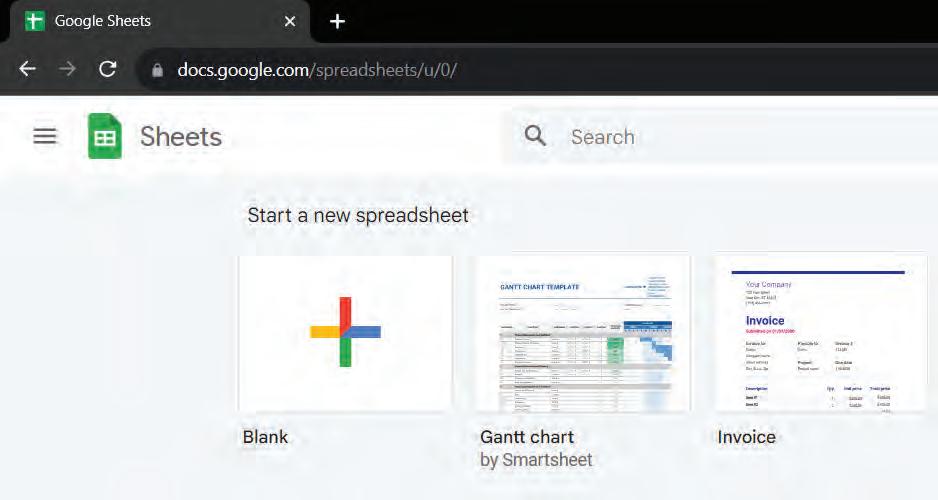
1. Open the Google Chrome browser and visit the link: https://docs.google.com/spreadsheets/
2. The home page appears, as shown below. Click the plus ‘+’ sign to open a blank spreadsheet.
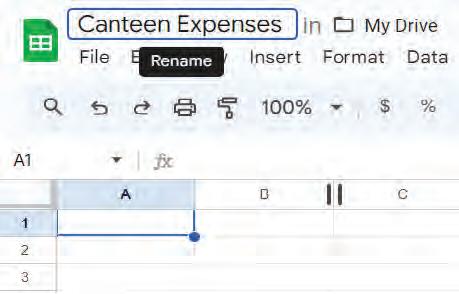
3. In your new spreadsheet, go to the Rename textbox given at the top left corner of the sheet and rename the spreadsheet file “Canteen Expenses”.
A spreadsheet consists of a grid-like structure. The various components of a spreadsheet are discussed as follows:
Row: The horizontal set of boxes is called a row or record.
Column: The vertical set of boxes is called a column or field.
Cell: The intersection of a row and a column is called a cell.
A cell is a rectangular block in the sheet that can hold data. Data can be numbers, strings, or symbols.
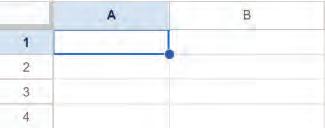
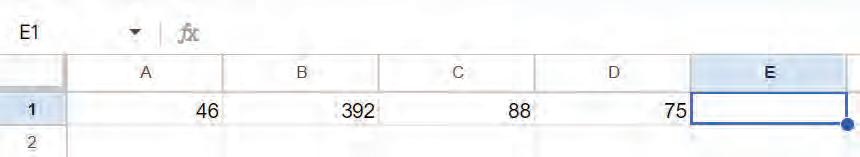
To refer to a cell, we use cell names. A cell name is a combination of letters and numbers Letters represent columns, and numbers represent rows.
For example, look at this image. The first cell is called A1, where A stands for the column and 1 stands for the row where the cell is.
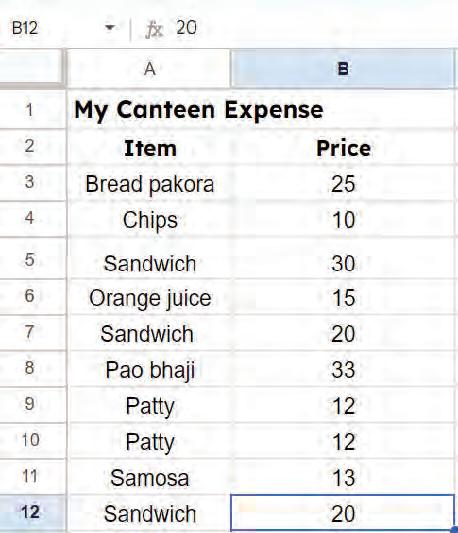
Now, let us start entering the data in the sheet. Follow these steps:
1. Select a cell where you want to add data using the mouse or the arrow keys.
2. Type in numbers, text, or any other information you want, to add data.
3. Press the Tab key to move to the next cell in a row.
4. Press the Enter key to move to the next cell in a column. Now, type the data as shown in this image.
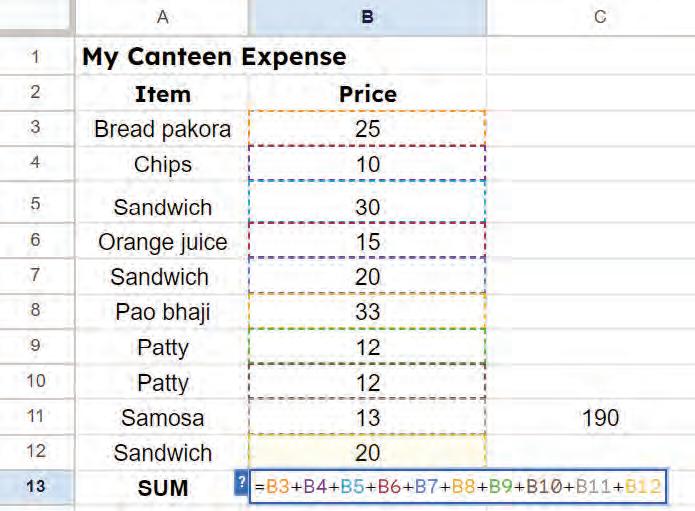
Now that you have added the details of your expenses, let us apply a formula to find the total expense. To do so:
1. Select the cell where you want the total to appear, for example, cell B13.
2. Type the equals sign ‘=’.
3. Now, click on the cell B3, type a plus ‘+’ symbol, and click on cell B4.
4. Repeat this process up to cell B12 and then press the Enter key. The sum of cells B3 to B12 will appear in cell B13.
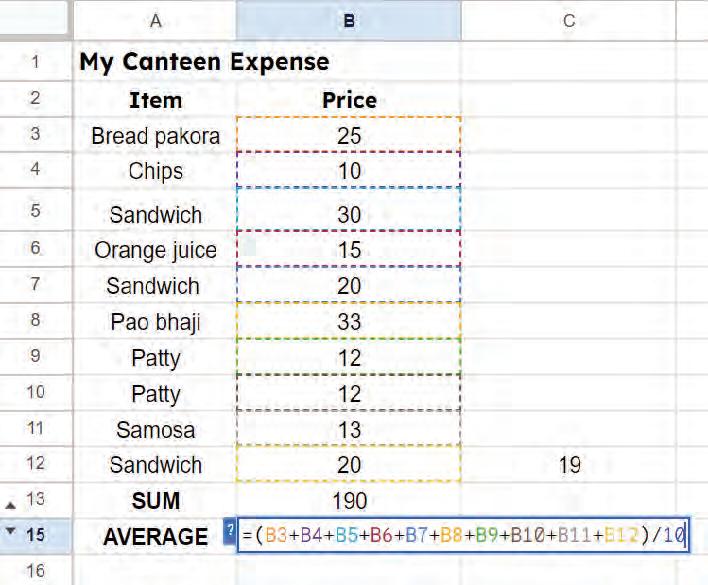
Similarly, to find the average price, you need to divide the total amount of expenses by 10, as there are 10 cells that have the “Price” data.
To do so:
1. Select the cell where you want the average to appear. For example, B14.
2. Type the equals sign ‘=’.
3. Now, click on the cell B13, type ‘/’ symbol after 190, for division; and then type “10”.
4. Press the Enter key. The average of values will appear in the cell B14.

You have learnt in the previous section how to calculate the sum and average price of items using formulas. However, formulae are longer ways of calculation.
Now, let us learn a quicker way to find the sum and average using functions. Functions allow you to calculate more efficiently, using cell ranges instead of typing the name of each cell.
A cell range is a group of cells selected together. We can apply functions to cell ranges.
Functions are like in-built formulae in Google Sheets. They perform calculations, handle data, and analyse information.
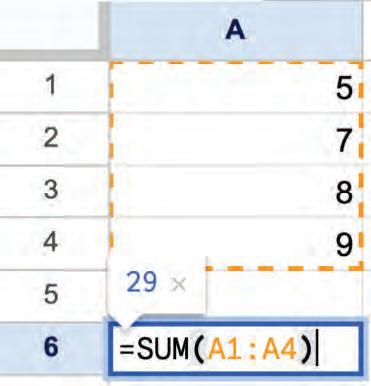
When we want to use a function on a range of cells, we type the range instead of typing the name of each cell. To type a cell range, first, we type the name of the first cell, a colon (:), and then the name of the last cell. For example, A1:A4.
To use a function, first type the ‘=’ sign, then the function name, followed by cell names or cell ranges inside the brackets.
For example, =SUM(A1:A4)
Let us try functions in place of formulas to find the total expense and average of items.
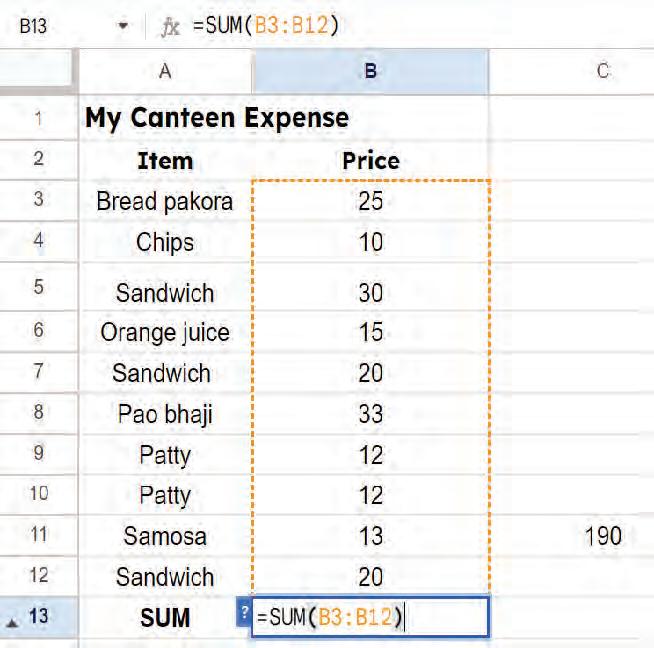
The SUM( ) function is used to add the values given in a specific cell range. To use the SUM( ) function:
1. Click on the cell where you want the sum to appear, for example, cell B13.
2. Type an equal to symbol ‘=’ and then the function name SUM.
3. Type the opening parentheses ‘(‘ after the function name.
4. Inside the brackets, add the cell range for which you want to calculate the total. For example, B3:B12.
5. Press Enter to complete. You can see the result in the cell B13.
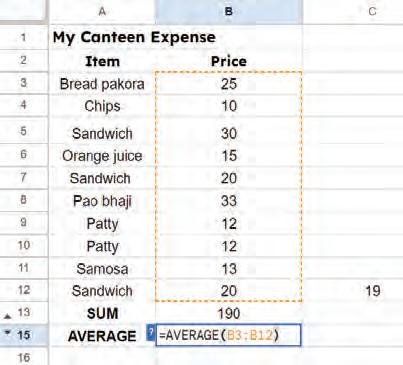
The AVERAGE() function is used to find the average of a set of numbers. To use the AVERAGE() function:
1. Click on the cell where you want the average to appear, for example, cell B14.
2. Type symbol ‘=’ and then the function name “AVERAGE”.
3. Type the opening parentheses ‘(‘ after the function name.
4. Inside the brackets, add the cell range for which the average is to be calculated, that is, B3:B12.
5. Press Enter to complete. You can see the result in cell B14.
Let us look at some more functions that are used in Google Sheets. Refer to the cell addresses used in the chapter for the examples given.
PRODUCTMultiplies the values in the specified range of cells=PRODUCT(B3:B5) Output: 7500
MODReturns remainder when the dividend is divided by the divisor. =MOD(Dividend, Divisor) =MOD(B3,B12)
Output: 5
SQRTReturns the square root of a number =SQRT(B3) Output: 5
INTRounds the number to an integer value =INT(number) =INT(3.2) Output: 3
POWER Returns the result of raising a number to a specified power =POWER(cell, power) =POWER(B4, 2)
Output: 100
ABSReturns the absolute or non-negative value of a given number =ABS(number) =ABS(-23) Output: 23
COUNT Returns the count of the number of values in a range of cells =COUNT(B3:B12) Output: 10
MINReturns the lowest value in a range of cells =MIN(B3:B12) Output: 10
MAXReturns the highest value in a range of cells =MAX(B3:B12) Output: 33
IFVerifies if the provided condition is met. It returns the value 1 when the condition is true or the value 2 when the condition is false.
=IF(condition, value_if_true, value_if_ false)
=IF(B3>18, “Affordable item”, “Costly item”)
Output: Affordable item
CONCATENATECombines multiple text strings into one =CONCATENATE(A4, A10)
Output: ChipsPatty
LENReturns the length of the text string =LEN(A2) Output: 4
UPPERConverts the text into uppercase =UPPER(A12) Output: SANDWICH
LOWERConverts the text into lowercase =LOWER(A6) Output: orange juice
TODAY Returns the current date =TODAY()
NOW Returns the current date and time =NOW()
How are formulas and functions different?
1
Label the parts of the given function.
a
a
b
2
Think and Tell
You are tracking the number of hours you study, for different subjects, in a Google Sheet. Which function would you use to find the subject that you have studied the longest? Hint: Refer to the table given above.
=MIN(B1:B6)
b
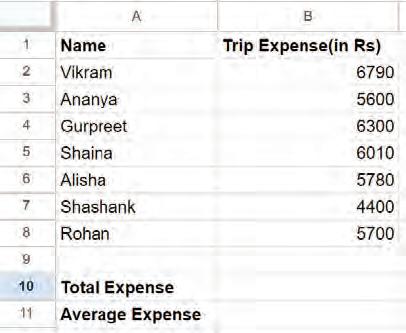
A group of friends went on a trip. Their individual expenses are given in the table below. Calculate the total and average expense of the trip in the cells B10 and B11, respectively.
To create your own Random Number Generator game, scan this QR code.
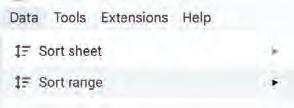
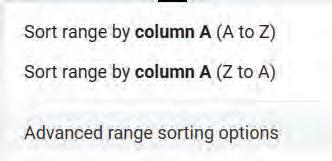
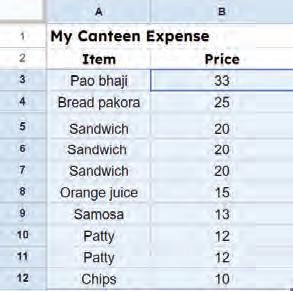
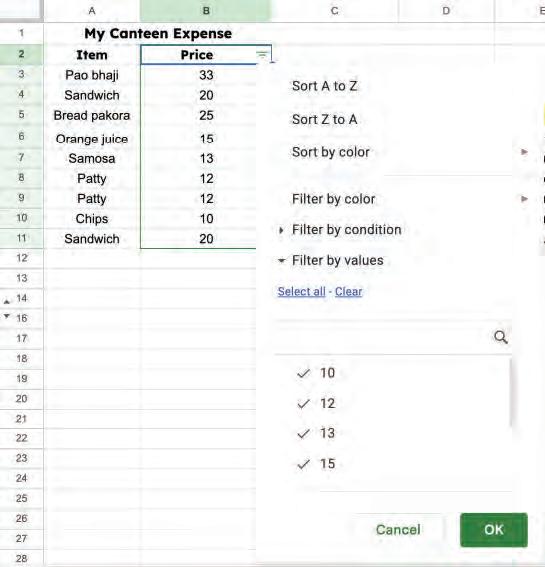
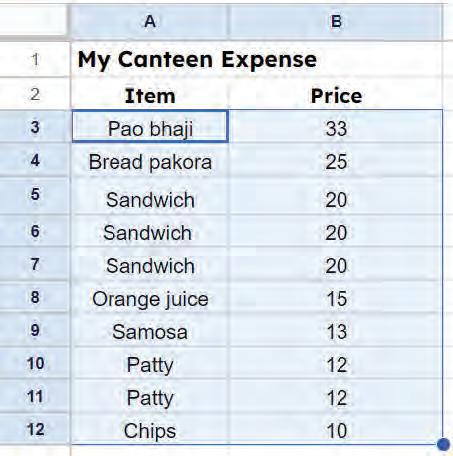
Sorting means to arrange data in a particular sequence based on specific criteria. It allows us to reorganise data in rows or columns, making it simpler to locate, analyse, and understand. Let us again consider the example of the canteen expense sheet. Suppose you want to find out which item is the most expensive. Then, you can sort the data of the sheet in descending order. To do so:
1. Choose the range of cells that contains the data you want to sort.
2. Go to the Data menu.
3. Select Sort range > Advanced range sorting options from the menu.
4. A dialog box appears. In the Sort by drop-down, select Column B and then check Z to A checkbox to arrange data in column B in the descending order.
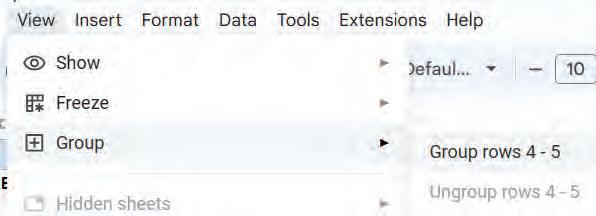
Suppose you are interested in finding how many items have the same price in the canteen expense sheet. This way, you can display each snack item just once, without repeating it multiple times. This is done with the help of grouping of data
In Google sheets, grouping means putting similar things together. Grouping keeps things tidy and helps you find what you need faster.
Follow the steps to group data of the canteen expense sheet:
1. Sort the data in ascending order by column B in the canteen expense sheet.
2. Select the rows that you want to group. Then, go to the View menu.
3. Select the Group option > Group rows 4-5.
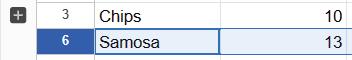
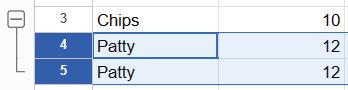
4. Use the plus ‘+’ button to show the group and the minus ‘−’ button to hide the group.
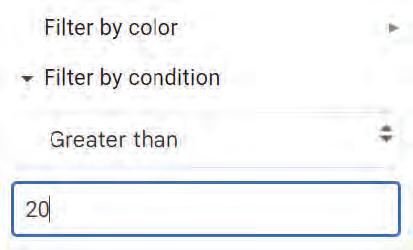
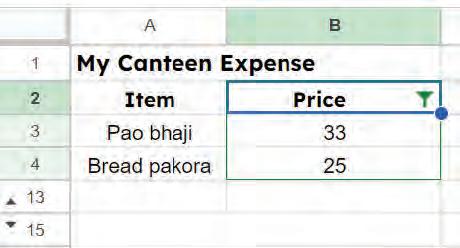
Suppose you want to see only those items that cost more than ₹20. To resolve this, another powerful feature called Filters is used.
Filters are a useful feature used in Google sheets that enables you to display data according to specific criteria. Filters can help narrow down the options to what we want and hide the rest. Filtering allows us to focus on specific parts of our data that meet certain conditions.
By using filters in spreadsheets, you can easily find specific data, answer specific questions, and understand information in a better way. Let us try to filter data to find items that cost more than ₹20 in the Canteen Expense sheet.
1. Select the range to which you want to apply the filter.
2. Go to the Data menu and choose Create a filter option.
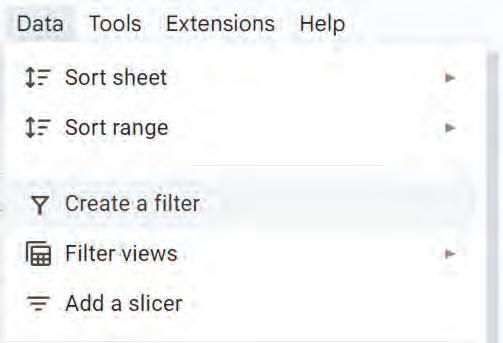

3. Click on the Filter symbol , select Filter by condition and then choose your rule.
4. After selecting the required rule, click OK.
5. The spreadsheet hides unmatched rows, showing only the data that fits the chosen criteria.
1 2
You have a list of animals in a spreadsheet, and you want to see only the ones that are mammals. What should you use?
a Sorting
b Filtering
c Formatting
d Deleting
Write T for True and F for False.
How is filtering different from grouping?
List of Animals
Animals Class
Lion Mammals
Crocodile Reptiles
Shark Fish
Tortoise Reptiles
Giraffe Mammals
Elephant Mammals
Kangaroo Mammals
a You have created a list of cars and their speeds in a Google Sheet. You can use the sorting feature to put them in order from the highest to lowest speed to view the fastest car at the top.
b Grouping data is only useful when working with numbers, and it doesn’t apply to other types of information.
Charts help us look at data in the form of pictures. This helps us to understand the data in a better way.
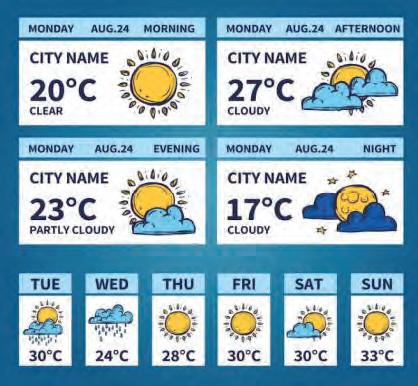
Charts are common in everyday life, such as weather forecasts on TV. These charts use images and colours to display daily temperatures or chances of rain. Just like looking at the weather without too many numbers, charts help us see information in pictures, making it easier for our eyes and brains to quickly understand.
In Google Sheets, there are various types of charts available to visually represent data. Let us explore some common types of charts:
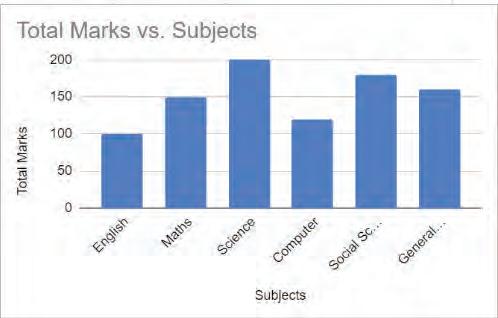
Column Chart: It uses vertical bars for comparing data or showing quantities. Each bar represents a category, and its height shows the value or amount.
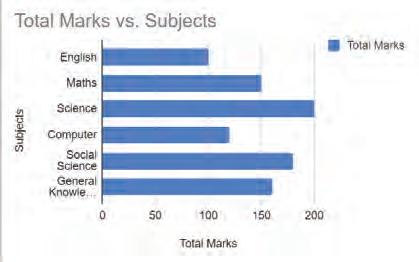
Bar Chart: It is similar to a column chart but with horizontal bars.

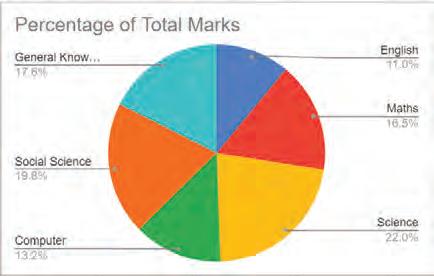
Pie Chart: It displays parts of a whole as slices of a pizza. Each slice represents a category, and its size shows the proportion or percentage.
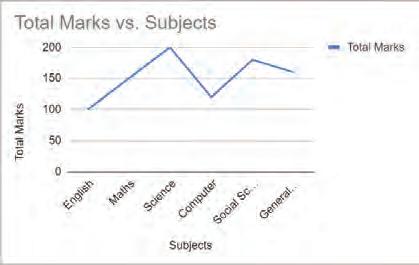
Line Chart: A line chart uses lines to show how something changes over time by connecting dots. This helps us spot trends, such as temperature changes throughout a year or the progression of a plant’s growth.
1. Choose the cells that contain the data you want to present using a chart.
2. Go to the Insert tab and select the Chart option.
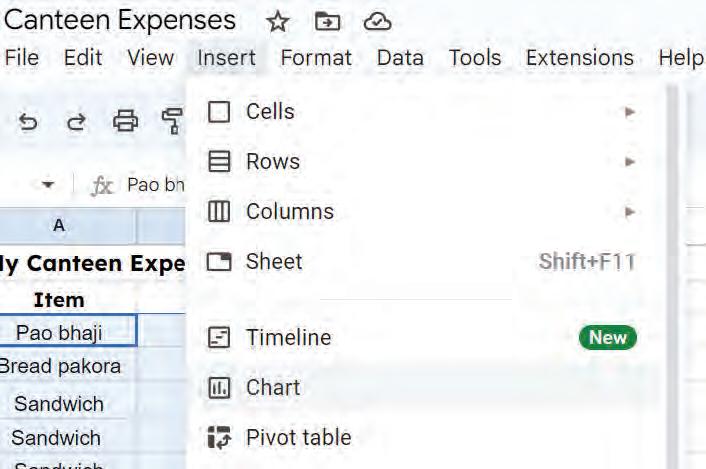
3. A chart appears along with a Chart editor menu on the right-hand side of the page.
4. Select the appropriate type of chart from the Chart editor menu. In this example, we are creating a stacked column chart.
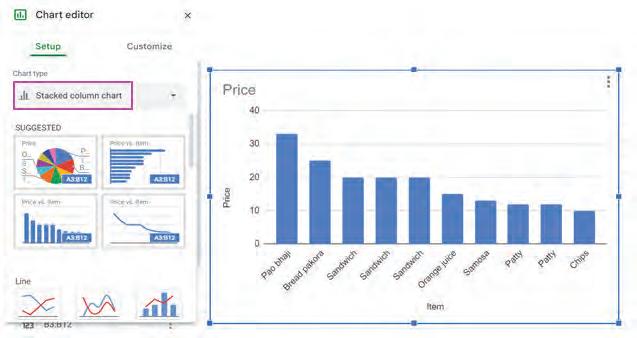
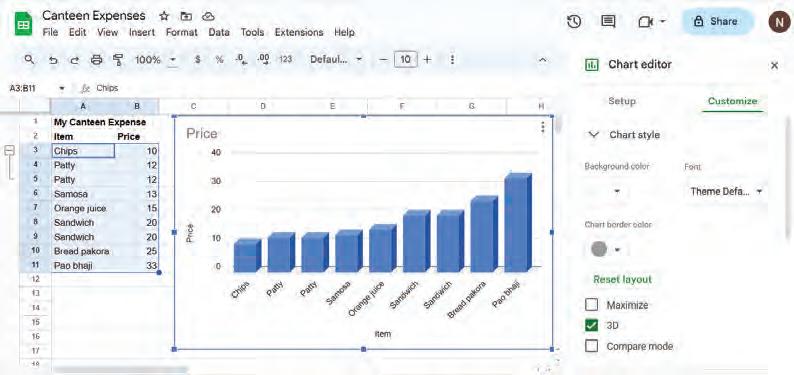
5. After selecting a chart type, you can customise it from the customise section in the Chart editor menu. As you can see in the image, the background is changed to grey and the 3D version of the chart is enabled.
So far, you were working on the Canteen Expense sheet. If you want to track your subject marks throughout the year, you need not to create a new spreadsheet. Instead, you can keep adding new sheets in the same spreadsheet.
To add a new sheet tab in Google Sheets:
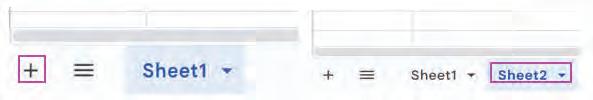
1. Click on the plus ‘+’ symbol at the bottom left corner of the Google sheet.
2. A new sheet tab will appear, ready for you to work on.
Colouring sheet tabs in a Google Spreadsheet means assigning different colours to the names of the sheets. Let us colour-code the sheet tabs to organise the spreadsheet, making it easier to find the information you need.
The steps for colouring sheet tabs are:
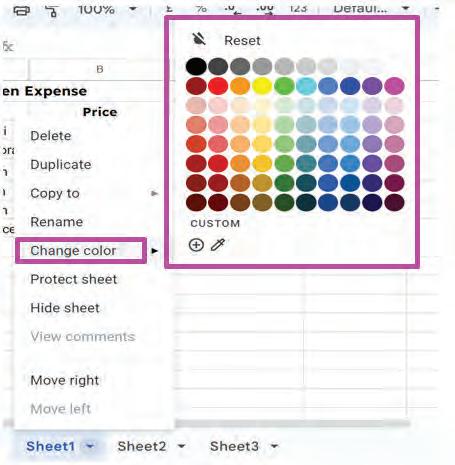
1. Right-click on the tab you want to colour.
2. Click on the Change color option.
3. A palette of colours will be displayed. Select the colour you like by clicking on it. The sheet tab will be coloured.

Tick () the correct answer.
1 Why do we use charts in Google Sheets?
a To make the data look fancy
b To make the numbers bigger
c To help understand and analyse data more easily
d To hide the data from others
2 Which type of chart looks like a pizza divided into slices?
a Bar chart
c Pie chart
b Line graph
d Scatter plot
A spreadsheet is a tool that helps you organise data and do calculations.
A cell is a rectangular block in the sheet that can hold data.
A cell name is a combination of letters and numbers.
Functions are pre-built formulas that you can use to perform various calculations or operations on your data.
A cell range is a group of cells selected together.
Some functions are: SUM (adding numbers), AVERAGE (finding the mean value), MAX (finding the highest value), MIN (finding the lowest value), and COUNT (counting the number of cells with numbers).
Sorting refers to arranging data in a particular sequence based on specific criteria.
In Google Spreadsheets, grouping means putting similar things together.
The purpose of filters in Google Sheets is to help you view and analyse specific subsets of data within a larger dataset.
Charts are a method of presenting data as visual representations that make understanding information easier.
Column Chart uses vertical bars for comparing data or showing quantities.
Bar Chart is similar to a column chart, but with horizontal bars.
Pie Chart displays parts of a whole as slices of a pizza.
A line graph uses lines to show how something changes over time by connecting dots.
Colouring sheet tabs in a Google Spreadsheet means assigning different colours to the names of the sheets.
Hints
1
2 3
4 5
A1:A5 letters, numbers length average visual
A bar chart is like a graph made up of colourful rectangular bars, where each bar represents a category, and its shows the value or amount.
The function helps us to find the mean of multiple numbers in spreadsheets.
Charts are representation of data.
A cell name is a combination of and .
The SUM function helps us add numbers together. To find the sum of a group of numbers, we can use the formula “=SUM(A1:A5)”. Here, represents the range of cells.
1
Consider a list of toys and their prices. What function will you use to view the price of the most expensive toy?
a AVERAGE
c MAX
2
Grouping in spreadsheets refers to:
a Colouring sheet tabs
c Combining related rows or columns together
3
What do charts do in spreadsheets?
a Perform calculations.
c Sort data alphabetically.
What do functions do in spreadsheets?
a They organise your files.
c They do specific tasks with data.
Formulas in spreadsheets are used for:
a Changing the font style of cells
c Applying filters to data
1 2 3
I am a special command in spreadsheets that automatically handles complex calculations or data tasks.
I am a function in spreadsheets that gives you the number of cells in a range containing data.
b SUM
d COUNT
b Arranging data in a specific order
d Creating formulas to perform calculations
b Show data visually and help understand it.
d Change the font style of the spreadsheet.
b They make spreadsheets look colourful.
d They create fun animations.
b Performing calculations and handling data
d Grouping rows and columns
I am a type of chart that uses colourful and rectangular vertical bars to compare quantities or values.
I am a process in spreadsheets that involves arranging data in a specific order based on certain criteria.
I am a feature in spreadsheets that allows users to change the appearance of sheet tabs by adding colours.
D. Write T for True and F for False.
Pie charts are suitable for comparing quantities or values, whereas line graphs are used to show changes over time.
Filtering data in spreadsheets permanently removes hidden rows or columns from the dataset.
Sorting in spreadsheets refers to arranging data in a specific order based on certain criteria, making it easier to locate and analyse.
4
The COUNT function in spreadsheets counts both numerical values and empty cells within a range.
1 2 3 4 5
What is the basic element of a spreadsheet called, and what does it hold?
What formula would you use if you want to multiply all the values in cells B1 to B7?
What are the different criteria for arranging data?
Why are functions used in spreadsheets? Name any five basic functions.
What type of chart would be appropriate to display the names of TV shows and the number of students who like each show?
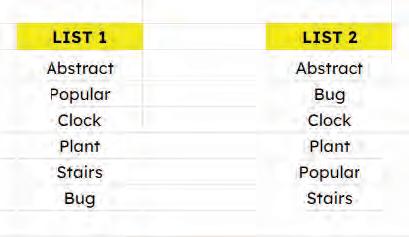
Ishita has to organise a list of words in dictionary order. What methods should she use to convert List 1 into List 2? 1
2
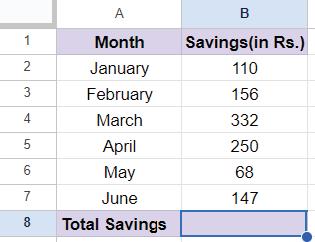
Arjun gets ₹400 as pocket money every month. He spends some money and saves the rest. He uses spreadsheets to list his savings for each month. Using the spreadsheet given below:
a. Which formula should he apply to get his total savings per month?
b. What is the cell name where he can get the total value at?
3
4
Somya wrote the text in small letters instead of capital letters. What function should she use to convert the text to all capital letters?
my name is somya arora. MY NAME IS SOMYA ARORA.
Raj has created several tricky questions for his friends to guess the function he has used in the result column. Write down the formulas in the blank boxes.
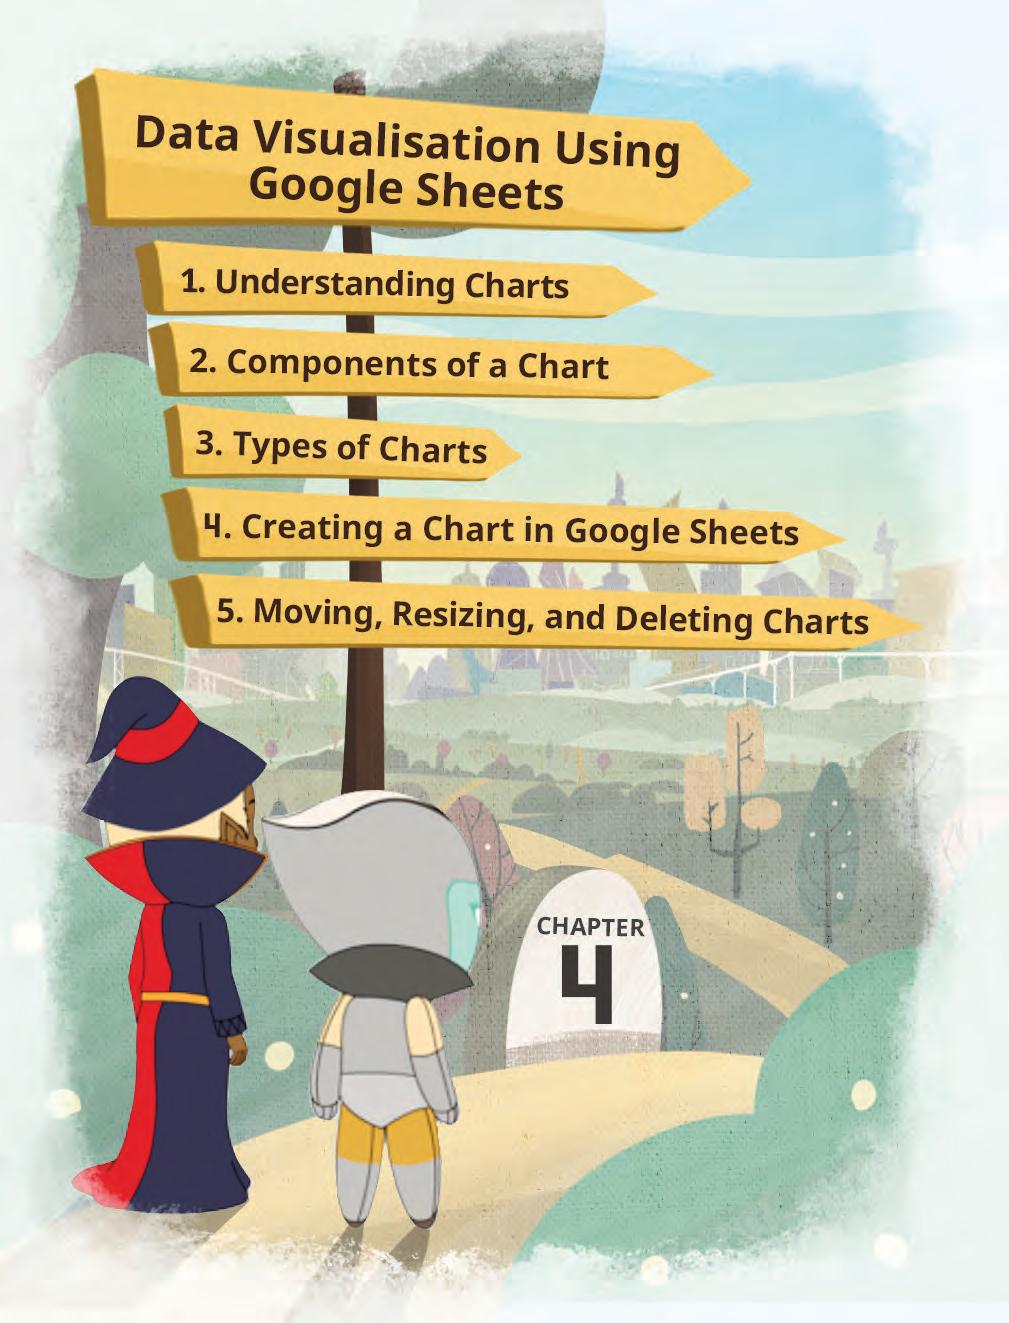
Effective data interpretation and presentation is an essential talent in today’s data-driven environment. Data visualisation is the process of graphically presenting data to reveal patterns, trends, and insights. In Google Sheets, powerful features are available for making many types of charts and graphs. In this chapter, we will explore the world of data visualisation with Google Sheets.
Google Sheets is a spreadsheet program developed by Google as part of the Google Workspace productivity suite. It is a web-based application that allows you to create, edit, and store spreadsheets online.
Charts are visual representations of data that help you understand information more easily. They provide a clear and concise way to display numerical data, making it easier to identify patterns and trends. Charts are widely used in business, science, and various other fields to convey information effectively.
Charts are vital for data visualisation because they simplify complex information, making it easy to understand. They also look visually appealing, which keeps us interested. Charts help with comparing data, making decisions, and communicating effectively. When included in reports and presentations, they make the information more engaging and easier to grasp.
Google Sheets allow you to create collaborative charts and dashboards in real-time. Multiple users can work on the same spreadsheet simultaneously, making it easy to update and share visualisations in a collaborative environment.
Following are the components of a chart:
Chart Title: The title of a chart provides a brief description of the data it represents. It should be clear and concise, summarising the chart’s purpose.
Axes (X-axis and Y-axis): Axes serve as the reference lines for the data points on the chart. The X-axis represents categories or time, whereas the Y-axis represents values or measurements.
X-Axis Title: The X-axis title is a label added to the horizontal axis of a chart.
Y-Axis Title: The Y-axis title is a label added to the vertical axis of a chart.
Data Series: Data series are the actual data points or values plotted on the chart. These are often represented as bars, lines, or other symbols, depending on the chart type.
Legends: Legends are used to label different data series on the chart. It is useful when there are multiple data series in the chart. Labels display the data series with predetermined colour and series name.
Data Labels: Labels are applied to individual data points that shows their values or other relevant information.
Gridlines: Gridlines are the same as the lines on graph paper. They help you see where different points on the chart are located. These lines make it easier to read the value of each data point on the chart more accurately. They create a grid-like pattern on the chart.
Chart Area: The chart area includes the whole area and objects in the chart.
Plot Area: A plot area is a window within a chart area. It contains the main chart. It’s that area in the chart where all your data and visual elements are shown.
Google Sheets offers a variety of chart types to help you visualise your data effectively. Here are some of the most commonly used chart types available in Google Sheets:
Column charts are used for comparing values across different categories. They consist of vertical bars. It is suitable for showing trends over time or comparing items.
Bar charts are used to compare different categories or groups of data. They consist of horizontal bars, with the length or height of each bar representing a value. Bar charts are ideal for showing comparisons between items or tracking changes over time.
Line charts are commonly used to display data trends over a continuous range, such as time. They are created by connecting data points with lines, making it easy to visualise how values change over a specific time.
Pie charts represent data as slices of a circle, where each slice represents a proportion of the whole. They are useful for showing the composition of a whole, where the total sum equals 100%. Pie charts can help visualise percentages or parts of a whole.
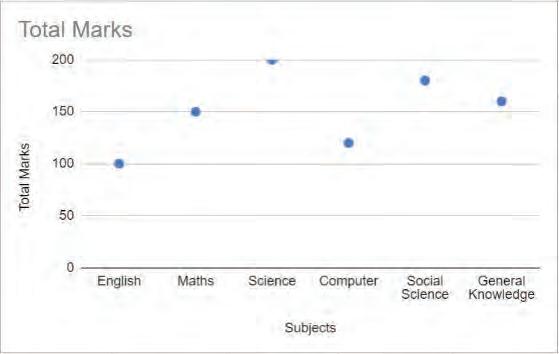
A scatter plot is a type of graph that uses dots to show the relationship between two variables in a dataset. The independent variable is plotted on the X-axis, and the dependent variable is plotted on the Y-axis. The positions of each dot on the horizontal and vertical axes indicate values for an individual data point.
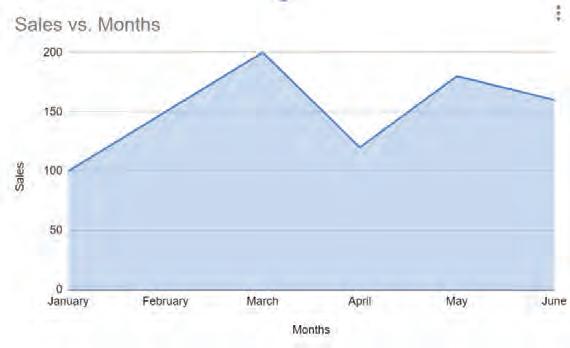
An area chart is a visual representation of data that contains both lines and filled areas to convey information. This type of chart is effective in representing data trends and variations over a specified period or across different categories.
Creating a chart in Google Sheets is a simple process, and it is a useful skill for every student to learn as it helps to visualise the data in an understandable way. Steps to create a basic column chart in Google Sheets are as follows:
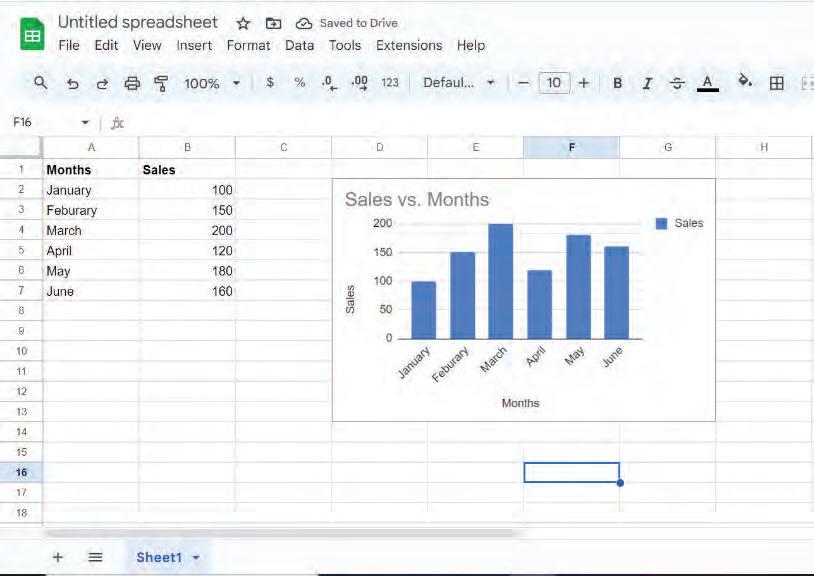
1. Open the Google Sheets spreadsheet.
2. Enter the data into Google Sheets. In this case, we have entered the following data:
3. Select the data in the spreadsheet for creating a chart. In this case, select the “Months” column and the “Sales” column data.
4. Go to the Insert menu in the Menu bar of the Google Sheet and click on Chart
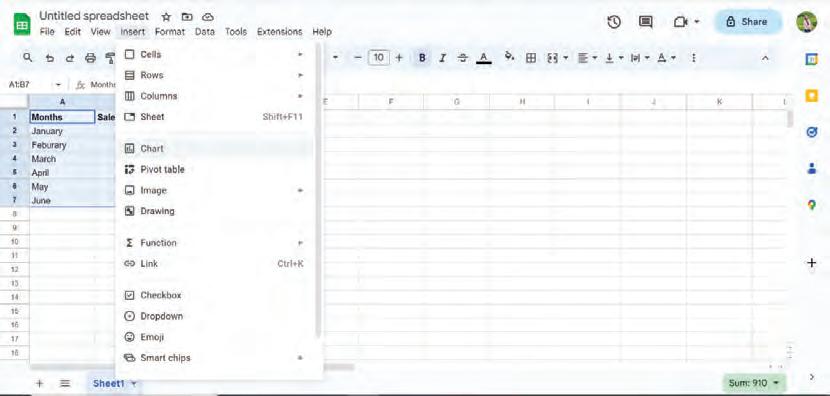
Click
5. A column chart is created by default and displayed on the spreadsheet. Also, the Chart editor panel will appear on the right side of the screen.
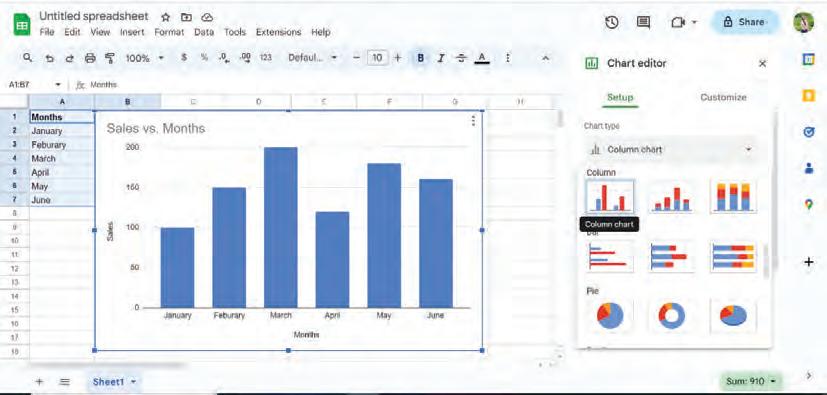
editor panel
6. Click on the Chart type list box. A drop-down list appears. Select the desired chart type from the dropdown menu that you want to create.
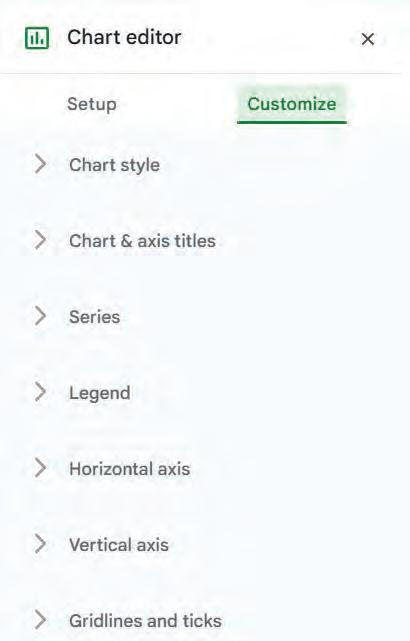
7. You can customise your chart by adjusting various options available under the Customize tab in the Chart editor. For example, you can provide a title for your chart, modify the axes labels, and change the colours and style of your chart.
As you make changes in the Chart editor, you can preview your chart in real time to see how it will look.
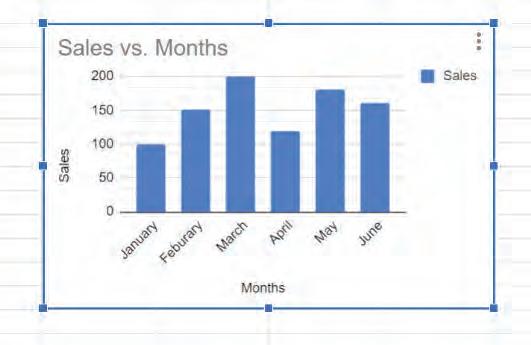
8. Click and drag the chart to the desired location within your spreadsheet.
9. Give your spreadsheet a suitable name.
Chart shifted to the right
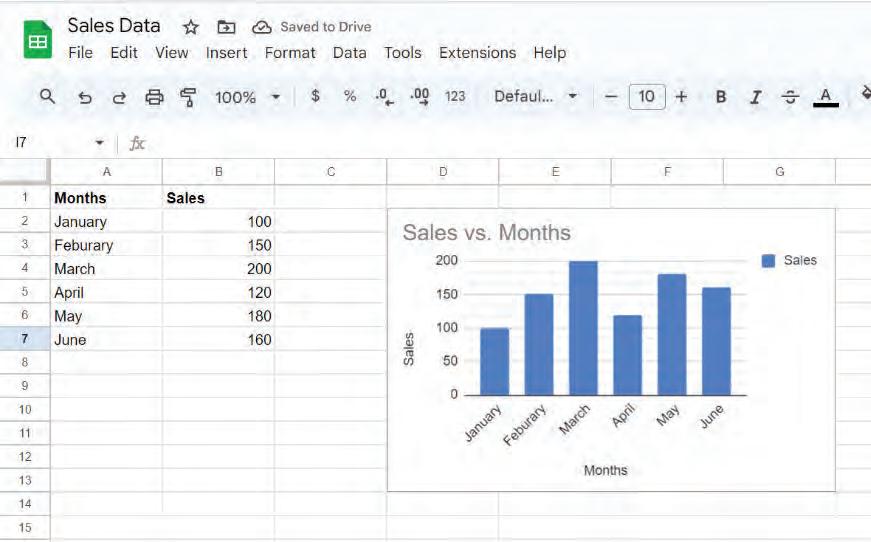
This process of creating charts can be used for any chart type by selecting a different chart type in steps 6 and 7.
Describe a real-world situation where effective data visualisation could improve decision-making. Explain the data, suitable chart type, and benefits.
In Google Sheets, you can create charts from your data to help visualise and analyse information. You can easily move, resize, and delete charts within a spreadsheet.
To reposition a chart:
1. Click on the chart where you want to move.
2. Drag it to the desired location. You can also move a chart to a different sheet within the same file by using the Cut and Paste options.
To resize a chart:
1. Click on the chart that you want to resize.
2. Drag its corner or edge handle to make it larger or smaller. You can maintain the aspect ratio of the chart by holding down the Shift key while resizing.
To delete a chart:
1. Click on the chart.
2. Then, click on the three dots in the top right corner and select Delete chart
The deleted charts can often be restored through the Undo option in the Edit menu or by using the Ctrl + Z key combination.
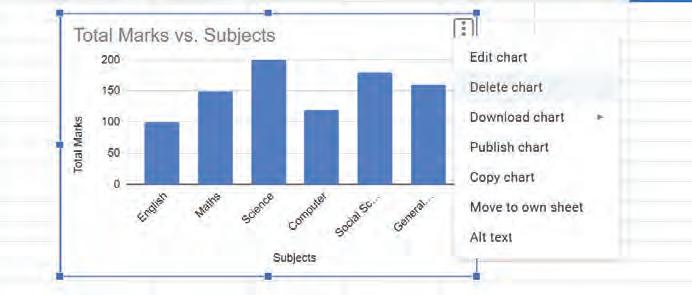
Click here to delete the chart.
Share your experience with creating a chart or graph using Google Sheets. What were the challenges you faced, and how did you customise the chart to effectively present your data?
1 Data visualisation is the process of presenting data in a graphical format to reveal patterns and trends.
2 Charts are visual representations of data that help to understand complex information and aid in effective communication.
3 Components of a chart include the chart title, axes, data series, legends, data labels, gridlines, plot area, and chart area.
4 Google Sheets offers various chart types, including column chart, bar chart, line chart, pie chart, and scatter plot.
5 Creating a chart in Google Sheets involves entering data, selecting the data, choosing a chart type, customising the chart, and positioning it within the spreadsheet.
Hints drag pie dots charts categories
1 are visual representations of data that help to understand complex information.
2 The X-axis in a chart typically represents or time.
3 charts are useful for showing the composition of a whole, where the total equals 100%.
4 A scatter plot is a type of graph that uses to show the relationship between two variables in a dataset.
5 To reposition a chart within a Google Spreadsheet, click and it to the desired location.
1 What is the primary purpose of data visualisation?
a To make data more complex
c To simplify data and reveal patterns
b To hide patterns and trends in data
d To confuse the audience
2 The component of a chart provides a brief description of the data it represents.
a Axes
c Chart Title
b Data Series
d Gridlines
3 The type of chart is ideal for displaying data trends over time by connecting data points with lines.
a Column chart
c Line chart
b Pie chart
d Scatter plot
4 How can you reposition a chart within Google Sheets?
a Right-click and select “Move”.
c Click and drag it to the desired location.
b Use the arrow keys on your keyboard.
d Double-click on it and move.
5 When resizing a chart in Google Sheets, which key should you hold down to maintain the aspect ratio of the chart?
a Shift
c Alt
b Ctrl
d Tab
1 I am a visual representation of data that consists of vertical or horizontal bars and is used for comparing values across categories.
2 I am a type of chart ideal for displaying data trends over time in coloured areas that are filled in beneath the data lines.
3 I am used to represent data as slices of a circle, with each slice showing a proportion of the whole.
4 I am a key element in explaining data or symbols in various visual representations.
1 Charts are primarily used for making data more complex to understand.
2 Data labels in a chart provide specific information about each data point.
3 Legends in a chart help viewers understand which data series corresponds to which category.
4 Pie charts are suitable for comparing values across different categories.
5 Resizing a chart while holding down the Shift key maintains its aspect ratio.
1 Why is data visualisation important in today ’s data-driven environment?
2 What are the key components of a chart?
3 Name three commonly used chart types in Google Sheets and briefly describe each of them.
4 What are the steps to resize a chart in Google Sheets?
5 How can you delete a chart from your Google Sheets spreadsheet?
1 Imagine you have a data with monthly expenditure data for a year. Which type of chart would you choose to visualise this data, and why?
2 You have created a chart in Google Sheets, but it doesn’t accurately represent the data. What steps can you take to customise the chart and improve its effectiveness in conveying the intended information?
Computers are incredible and powerful machines. Today, they are everywhere, be it a shop, a bank, a school, government offices, or malls. But they don’t do anything without our instructions. They are helpful, but deep down, they are not smart. The instructions we give to a computer are sets of commands to perform a task; these sets are collectively referred to as a program.
Programming is the process of creating a set of instructions that tells a computer how to perform a task. A task is a piece of work to be done. In a program, it may represent a section of the program.
We need a language to instruct computers to carry out a task, just as we use English to communicate with one another. As computers are machines, they can only understand machine language. As machines are electrically powered devices, they listen to two signals, on and off, which are represented by 0s and 1s, respectively.
A language that is formed using 0s and 1s is called a low-level language (LLL). As it is based on only two digits, it is also known as a binary language.
A high-level language (HLL) is a human-friendly programming language like Java, Python, C, or C++. It is intended to make computer programming simpler for programmers, as it is not feasible for programmers to remember the 0 and 1 codes for everything. Later, these high-level language programs are translated into low-level language programs to make computers understand them.
Java is a widely used programming language and software platform that runs on billions of devices, including notebook computers, mobile devices, gaming consoles, medical devices, and many others. It is used to develop mobile apps, web apps, desktop apps, games, and much more.
A platform is where a program runs. Java is a platform because it includes the Java Virtual Machine (JVM), the Java runtime environment (JRE), and the Java Development Kit (JDK). Java provides a runtime environment (JRE) and an application programming interface (API), but the term 'Java platform' covers more, including the JVM and JDK, for developing and running Java applications.
Java was developed by Sun Microsystems (which is now a part of Oracle) in 1995. James Gosling is known as the father of Java.
Below are the reasons why we should learn Java:
1 Java is based on the “Write Once, Run Anywhere” principle, which makes it a platform-independent language.
2 Java is beginner-friendly and gives you a competitive edge, as it is one of the leading programming languages in the industry.
3 Java has strong memory management, which makes it robust.
4 Java takes less execution time, as it is a compiled language.
5 Java is secure and dynamic.
6 Java is used on a large scale around the world, covering many sectors.
7 Java offers a variety of job roles, expanding career options such as software developer, web developer and application developer.
Java is a high-level language, so any program written in it must first undergo a two-step conversion to a machinelevel language.
Any Java program is initially translated into bytecode, a type of machine-independent code. This bytecode is then executed on a machine-specific Java Virtual Machine (JVM).
A compiler is a computer program that converts high-level program instructions into machine language. This program reads the source code, decodes it instruction by instruction into machine-readable bytecode, and then provides a machine-independent Java file that can run on any machine, like Windows, MacOS, and Android, with the help of a JVM.
Some of the commonly used Java compilers are javac (an official Java compiler), the GNU Compiler for Java (GCJ), the Eclipse Compiler for Java (ECJ), and Jikes.
The JVM acts as a run-time engine to run Java applications. It runs the Java code. It provides a runtime environment in which Java bytecode (a compiled Java program) can be executed. JVMs are available for platforms like Windows, MacOS, and Android
So, the Java compiler first compiles the program into machine-independent bytecode, which is then executed by the JVM, a platform-independent interpreter, to produce the final output. Compile Time
Object-Oriented Programming (OOP) is a programming paradigm that is widely used in Java and many other programming languages. In Java, OOP is based on the following core principles:
Objects: In OOP, everything is treated as an object. An object is a self-contained unit that represents a real-world entity or concept and contains both data (attributes) and the methods (functions) that operate on that data. Objects are instances of classes
Classes: A class is a blueprint or template for creating objects. A class defines the structure and behaviour of objects. In Java, classes are used to create objects by defining their attributes and methods.
Consider a real-world scenario of a factory producing cars. Think of the Car class as a blueprint or template for manufacturing cars in a factory. This blueprint defines what each car should have and how they should behave. In the class, you specify attributes (Make, Model, Year) and methods (Start, Stop) that all cars produced from this factory should possess.
Using the prototype of a car, you can create many objects that possess the attributes and methods of the Car class. Car
Car Class
Attributes:
Make Model Year
Methods: Start Stop
Advantages of OOPs
1 OOP can lead to faster development of programs.
2 OOP gives the programmes a clear structure.
3 OOP helps keep the code easier to maintain, modify, and debug.
4 OOP makes it possible to create fully reusable applications with less code and a shorter development time.
Java tokens are the smallest elements of a Java program. These are the basic building blocks, which can be put together to make a program. Java tokens can be identifiers, keywords, constants, punctuators, or operators.
Identifiers
An identifier is any name assigned to various components of a Java program. Identifiers are used to name classes, methods, and variables. Identifiers can be short names, like x and y, or more descriptive names, like age, sum, choice, or result. It is better to use descriptive names in order to make your programs easy to understand and maintain.
Keywords
Keywords are reserved words in Java that have a special meaning and can only be used for that purpose. We cannot use keywords to name any variable, class, or method in Java, as doing so will show an error. A few keywords in Java are public, static, void, class, int, float, char, if, while, for, etc.
Constants
They are the fixed values that do not change during the execution of a program. Constants can be numeric constants or character constants.
Numeric Constants: 12, -5, 2334, -786, 1.55, 0.756, etc.
Character Constants: They can be single character constants, like “P”, “a”, and “B”, or multicharacter (string) constants, like “Uolo”, and “Welcome”.
Punctuators
Punctuators are the symbols used to separate other tokens. They are also known as separators. There are 9 punctuators in Java which are ; , . ( ) { } [ ].
In Java, we write programs using classes and objects. A typical structure of a Java program includes the following:
1 Documentation statement
2 Class Definition statement
3 Main method
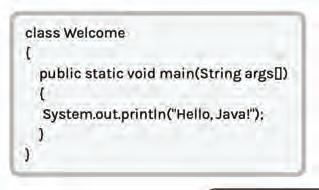
Documentation
//Program to print “Hello World!”.
class Welcome{ public static void main (String args[])
System.out.printIn(“Hello, Java!”);
Let us understand the meaning of each part in detail.
Documentation Statement
Class Definition
The main Method
We start a Java program with a documentation statement that tells what the program is about. We use comments to add documentation about a program. A comment is a line of code that is ignored by the Java compiler.
In Java, we have three types of comments:
• Single-line comment
• Multi-line comment
• Documentation comment
Single-line comments are added using a pair of forward slashes (//). A multi-line comment starts with /* and ends with */. A documentation comment starts with /** and ends with */.
In the example above, we have created the class named Welcome. We call this statement a class definition. The opening curly braces at the end of the line indicate the start of the class.
Inside the class, we have the main method, which is the execution point of the program when we run it. A Java program must have a main method else it will not execute. The name of the program should be the same as the name of the class which has the main method.
Here, the class Welcome has the main method, so the name of the program should be Welcome.java. A main method can be public, static, and void.
public: It indicates that the main method can be called from anywhere outside or inside the class. Calling a method is nothing but asking Java to execute the code written inside a method.
static: It indicates that the main method will remain the same in all the objects that are created from the class. For example, let us say we create the objects Welcome1, Welcome2, and Welcome3 from the class Welcome, the main method will remain the same in all the three objects, that is, it will have only one instruction (line 3) inside it.
void: It indicates that the main method will not return any result other than executing the instruction present inside it.
The open curly bracket at the end indicates the beginning of the main method.
The instruction System.out.println() is a print instruction in Java that will display the message written inside the parentheses, which is “Hello, Java!” We end an instruction with a semicolon at the end.
The first closing curly bracket indicates the end of the method, and the second closing curly bracket indicates the end of the class.
A Java compiler will convert this Welcome.java program into Welcome.class, which will be the bytecode. Then, a JVM will execute the main method inside this Welcome.class bytecode, where it will run the System.out.println() statement to display the message, “Hello, Java!”
Welcome.java
//Program to print “Hello, Java!” class Welcome{ public static void main(String[] args) { System.out.println(“Hello, Java!”); }
Output
Hello, Java!
Example 1.1
Program to display names.
Names.java Output
//Program to print “Hello, Java!”
class Names{
public static void main(String[] args)
System.out.println(“My name is John.”); System.out.println(“My best friend’s name is Adam.”);
Example 1.2
Program to print the sum of two numbers.
My name is John. My best friend’s name is Adam.
Sum.java Output
class Sum{
public static void main(String[] args){
System.out.println(24 + 26);
In Example 1.1, the + operator is used to add two numbers. You will learn more about operators later in this chapter.
Example 1.3
Program to display two messages in a single line.
Welcome.java Output
class Welcome{
public static void main(String[] args){
System.out.print(“Welcome to the world of Java!”); System.out.print(“Hope you are having fun!”);
Welcome to the world of Java!Hope you are having fun!
Whenever we display a message using the method System.out.println(), it first displays the message in the output then moves the cursor in the output to a new line. That is why, in Example 1.1, the messages are displayed in two separate lines. But the method System.out.print() does not move the cursor to a new line and that is why in Example 1.3, the messages are displayed in the same line.
Example 1.4
Program to display the product of two numbers.
Product.java Output
class Product{
public static void main(String[] args){
System.out.println(“30 x 50 = “ + 30 * 50);
Example 1.5
30 x 50 = 1500
Program to calculate the area of a rectangle whose width is 5 and height is 10.
Area.java Output
public class Area{
public static void main(String[] args){
System.out.print(“Area of rectangle = “ + 5 * 10);
Syntax
Area of rectangle = 50
Syntax refers to the set of rules defining how a program should be written. Every programming language has its own syntax. Similarly, the syntax of Java also defines all the main rules, commands, and constructions to write programs that the Java compiler understands.
A few of the syntax rules in Java are:
• Every Java code has to be written inside a class, as it is one of the main principles of object-oriented programming that Java strictly follows.
• The main() method should be defined inside a class.
• In Java, we end all the instructions with a semicolon (;). That is, each individual statement should be ended with a semicolon. It informs the compiler where an instruction ends and the next instruction begins.
• Java is case-sensitive, which means the names “showData” and “showdata” are two different names.
Syntax errors are mistakes in the code, such as spelling mistakes and punctuation errors. It indicates that the programmer has written an invalid statement. If the program contains any syntax errors, the compiler will display them after compiling it.
Two common types of syntax errors are:
• Missing double quotes in print statements
Think and Tell
Do you think knowing syntax is required for learning every language?
Main.java
class Main{ public static void main(String[] args){ System.out.print(Hello!);
Output
/tmp/cGx28261UN/Main.java:3: error: ’)’ expected System.out.print(Hello!);
1 error
}
• Missing the semicolon symbol at the end of any instruction.
Main.java
public class Main { public static void main(String[] args) { System.out.print(“Hello”)
Data Types
Output
/tmp/cGx28261UN/Main.java:3: error: ’;’ expected System.out.print (“Hello!”)
1 error
Data types allow us to define what type of data a memory location can hold. The main data types in Java are as follows:
Data Type Size Description
byte 1 byte Stores whole numbers from -128 to 127.
short 2 bytes Stores whole numbers from -32,768 to 32,767.
int 4 bytes Stores whole numbers from -2,147,483,648 to 2,147,483,647.
long 8 bytes Stores whole numbers from -9,223,372,036,854,775,808 to 9,223,372,036,854,775,807.
float 4 bytes Stores fractional numbers. Sufficient for storing 6 to 7 decimal digits.
double 8 bytes Stores fractional numbers. Sufficient for storing 15 decimal digits.
boolean 1 bit Stores true or false values.
char 2 bytes Stores a single character/letter or ASCII values.
Apart from these data types, one more commonly used data type is String. It helps us store multiple characters in a variable, like “John”, “4 kilograms”, and “$ 50”.
Variables
A variable is a memory location on a computer which can hold any value and can also change over time, as needed.
To understand it in an easy way, think of it like a box in which you can store a number and later can replace that number with another number.
In simple words, variables are names given to the memory location where your value is stored.
The figure below illustrates three variables with their respective values. The three variables used in the figure are “name”, “winner” , and “score”. The variable “name” holds the value “Bob”, the variable “winner” holds the value “True”, and the variable “score” holds the value “35”.
Therefore, whenever the variable “name” is used in a program, this variable refers directly to its value, “Bob”.
5

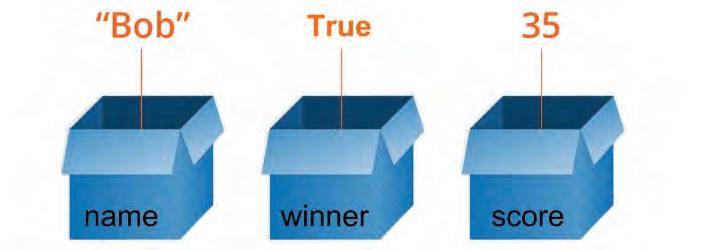
Variable Name Variable
Variable Name num
Declaring a variable means creating a variable. If we want to use a variable in Java, we need to create it in advance. To create or declare a variable, we need to specify the data type of the variable along with the variable name. A data type refers to the type of value the variable is going to hold.
Syntax: <data type> <variable name>;
Data type Variable name
Semicolon int count ;
Say, we want to create a variable to store a count. As the value of count will be a number, we use the keyword int, which means integer (a non-decimal number), to declare the type of the variable, and we can use count as the name of the variable.
Examples
String name; int count;
In the example above, the variable “name” should hold characters or words within it and the variable “count” should hold an integer value.
Syntax: <data type> <variable name> = <value>;
Data type Variable name
Semicolon int count = 4 ;
Initial value
Initialisation of the variable includes the following three components:
Data type : Type of data the variable will store.
Variable name : Name of the memory location where the value will be stored.
Initial Value : The value the variable will be initialised with.
Example int x; x=10;
In the above example, the first line, “int x”, is declaring the variable and specifying that the value stored in the variable is of the integer type.
The second line, “x = 10”, gives the initial value to the variable x, which is of data type int. Therefore, whenever the variable x is used in the program, it refers to the value stored within it, which is 10.
Example 1.6
Program to store number 5 in a variable and display it.
Main.java Output
class Main{
public static void main(String[] args){ int number; number = 5; System.out.println(“Number is “ + number); }
Number is 5
In the program above, we have initialised the number variable with 5 in line 4, and in line 5, we display the value of the variable using the print instruction.
We can group Java variables into the following categories, based on the data types we learnt:
• String variables : Store letters and numbers within double quotes.
• Integer variables : Store numbers without decimal values.
• Float variables : Store numbers with decimal values.
• Character variables : Store a single character such as “a” or “b”.
• Boolean : Stores only true or false values.
Example 1.7
Program to store three numbers 5, 6, and 10 in different variables and display the sum of the numbers.
Sum.java Output
class Sum1{
public static void main(String[] args){ int number1, number2, number3; number1 = 5; number2 = 6; number3 = 10; int sum = number1 + number2 + number3; System.out.println(“Sum is “ + sum); }
Sum is 21
In the above program, three integer variables number1, number2, and number3 are declared in line 3. In lines 4, 5, and 6, the variables are initialised with their respective values using assignment statements. Then, the sum is calculated in line 7 and line 8 displays the sum.
In Java, the scope of a variable is defined as its visibility or accessibility within a class, method, or block of code. The variables declared inside a block or method are not visible or accessible outside it. If you try to do so, you will get a compilation error.
Based on their scope, the following are the types of variables in Java:
1 Local
2 Instance
3 Static
Local Variable
A variable that is defined and created within a method, constructor, or function in Java is called a local variable. These variables are created when the function or method is created and destroyed after the control comes out of the block. Therefore, the scope of the local variable lies within the function or method for which it has been created. The variable cannot be used outside the block it has been initialised to.
Example 1.8
Example.java Output
class example{
public static void main(String[] args){
int var = 10; System.out.println(“Local Variable “ + var); }
Local Variable 10
A variable declared inside a class but outside the body of methods is called an instance variable. It is not declared static. Instance variables cannot be accessed directly. You have to create an instance of the class. The new operator is used to create an instance of the class, which is used to access the instance variables. You will learn more about it in the next chapter.
Example 1.9
Simple.java Output
class Simple{
int a = 10; float f = a; public static void main(String[] args){
Simple obj = new Simple(); System.out.println(obj.a); System.out.println(obj.f);
A variable that is declared static is called a static variable. It cannot be local. You can create a single copy of a static variable and share it among all the instances of the class. Memory allocation for static variables happens only once when the class is loaded into memory.
The general rules for naming a variable in Java are:
• Names can contain letters, digits, underscores, and dollar signs.
• Names must not begin with a number.
• Names cannot contain blank spaces.
• Names are case sensitive, so “myVar” and “myvar” are two different names in Java.
• Java keywords, such as int or boolean, cannot be used as names.
• Names in Java can be of any length.
• Variable names can also begin with $ and _.
A few examples of valid variable names are count, name, _num, num1, num_1, $name, etc. However, names like 1num, tile count, and value #1 are invalid variable names.
Example 1.10
Main.java Output
class Main{
public static void main(String[] args){
int 1num = 5; }
/tmp/cGx2826UN/Main.java:3: error: not a statement int 1num = 5;
ᴧ
/tmp/cGx2826UN/Main.java:3: error: ‘;’ expected int 1num = 5;
ᴧ 2 errors
When we have two or more distinct words in a variable name, we can write them without spaces in between and capitalise the first letter of each new word.
For example: “Name of the company” can be written as “nameOfTheCompany”. As this represents the camel’s hump, we call it Camel-case.
Example 1.11
first word lower case camelCase
Program to store whole numbers in byte, short, int, and long variables.
Main.java Output
class Main{
public static void main(String[] args){ byte numByte = 64;
System.out.println(“A byte-sized number is “ + numByte); short numShort = 32000;
System.out.println(“A short-sized number is “ + numShort); int numInt = -2010097456;
System.out.println(“A int-sized number is “ + numInt); long numLong = 1956789034264578326L; System.out.println(“A long-sized number is “ + numLong);
Example 1.12
A Java program to store decimal numbers in float and double variables.
Main.java
class Main{
public static void main(String[] args){ float numFloat = 645.6743f; System.out.println(“A float-sized decimal number is “ + numFloat);
double numDouble = 3229.006538971d; System.out.println(“A double-sized decimal number is “ + numDouble);
capitalise the first letter of all the following words
A byte-sized number is 64
A short-sized number is 32000
A int-sized number is -2010097456
A long-sized number is 1956789034264578326
A float-sized decimal number is 645.6743
A double-sized decimal number is 3229.006538971
Example 1.13
A Java program to store your name in a variable and display it in the output.
Main.java Output
class Main{
public static void main(String[] args){
String myName = “John”; System.out.println(“My name is “ + myName);
My name is John
Operators are special symbols that are used to perform calculations. We can use operators with variables and constants to form expressions.
These operators work on a single variable or constant. They are used to increase or decrease the value stored in a variable by 1.
Arithmetic operators in Java are used along with the integer or float values and variables to perform mathematical operations on them.
They are used to compare two values (or variables). This is important in programming, because it helps us to find answers and make decisions. The result of a comparison is either true or false.
< Less than x < y
>= Greater than or equal to x >= y
<= Less than or equal to x <= y
They are used to compare the result of two or more expressions in Java and give the result as true or false.
&& Logical and Returns true if both statements are true.
|| Logical or Returns true if one of the statements is true.
! Logical not Reverse the result, returns false if the result is true.
BEDMAS Rule
Java performs the following operations in order to solve a mathematical expression:
1 Brackets (B)
4 Multiplication (M)
Example
9 + 7 * (8 − 4) / 2 − 3
= 9 + 7 * 4 / 2 − 3
= 9 +7 * 2 − 3
= 9 + 14 − 3
= 23 − 3
= 20
Example 1.14
2 Exponents (E)
5 Addition (A)
3 Division (D)
6 Subtraction (S)
(First, the brackets are solved.)
(Then, division is solved.)
(Then, multiplication is solved.)
(Then, addition is solved.)
(Finally, subtraction is solved.)
Program to calculate the area and perimeter of a square with the side as 5.
Main.java Output
class Main{
public static void main(String[] args){
int side = 5; int area = side * side; int perimeter = 4 * side; System.out.println(“Area: “ + area); System.out.println(“Perimeter: “ + perimeter); }
Area: 25
Perimeter: 20
Program to show the difference between using a unary operator before and after a variable.
class Main{
public static void main(String[] args){
int num1 = 5;
System.out.println(“Value of num1++ is “ + num1++);
System.out.println(“Value of num1 is “ + num1);
System.out.println();
int num2 = 5;
System.out.println(“Value of ++num2 is “ + ++num2);
Value of num1++ is 5
Value of num1 is 6
Value of ++num2 is 6
In the above program, when num1++ is used, Java first displays the value of num1 and then increases its value by 1. So, line 5 displays 5 as num1 is 5, then Java increases the value of num1 to 6 (5 + 1) and displays the new value in line 6. However, when ++num2 is used, Java first increases the value by 1 and then displays the value of num2. So in line 8, Java increases num2 to 6 (5 + 1) and displays the new value.
A Fill in the Blanks.
Hints logical class instance arithmetic block of code
1 In Java, a is a blueprint for creating objects.
2 A variable that is associated with an instance of a class is called a/an variable.
3 The scope of a local variable is limited to the in which it is declared.
4 operators perform mathematical operations in Java.
5 In Java, the “&&” operator is an example of a/an operator.
B Tick () the Correct Option.
1 Which keyword is used to create a class in Java?
a define b class
c create d make
2 What type of variable is declared with a static keyword in Java?
a Local variable
c Static variable
3 The == operator in Java is an example of a:
a Arithmetic operator
c Logical operator
b Instance variable
d Dynamic variable
b Comparison operator
d Assignment operator
4 Which of the following symbols is used to end the statement in a Java program?
a ;
c ||
C Who Am I?
b :
d *
1 I’m a programming construct used to create objects from a class in Java.
2 I’m a rule in Java to make calculations.
3 I’m an operator in Java that is used for comparing values.
4 I’m a logical operator in Java that returns true if both statements are true.
5 I’m a type of operator that work with a single variable.
D Write T for True and F for False.
1 Local variables have a class-wide scope.
2 An instance variable is associated with a specific instance of a class.
3 The scope of a static variable is limited to a specific method.
4 The “!=” operator is a logical operator.
5 Java supports object-oriented programming (OOP) principles.
E Answer the Following.
1 Explain the difference between a local variable and an instance variable in terms of scope.
2 List three types of arithmetic operators in Java and provide an example of each.
3 Describe the purpose of the variables in Java.
4 Provide an example of a relational operator in Java and explain its use.
5 How do logical operators like && and || help in decision-making in Java?
F Apply Your Learning.
1 Create a Java class called “Person” with instance variables for name, age, and address.
2 Write the main method for the “Person” class in question 2 that calculates the birth year based on the current year and age.
3 Implement a Java program that uses the “Person” class in question 2 to calculate the total marks obtained in five subjects.
4 Compare the marks obtained in two subjects, using a relational operator and print the result.
5 Display the result of the person based on the total marks obtained in question 3.
This book embodies the principles outlined in the National Education Policy (NEP) 2020. It unveils the world of computer science through a unique and captivating pedagogical approach—seamlessly integrating curriculum content into the mesmerizing adventures of Mel and Conji, fictional figures hailing from the enchanting world of Avora. Our aim is to prepare learners for the dynamic and technology-driven landscape of the 21st century, equipping them with the essential skills they need to thrive in an ever-evolving world.

• Explore More: QR codes to explore an exciting application of the concept. This element builds curiosity in children and helps them grasp concepts through digital visual aids.
• Discuss: Questions to trigger engaging group discussions in the classroom.
• Think and Tell: Probing questions to stimulate thinking at an individual level.
• Did You Know? Interesting facts related to the application of a concept.
• Points to Remember: Chapter end summary.
• Do It Yourself: Milestone exercises to practice specific concepts.
• Chapter Checkup: A pool of questions catering to all topics and skills covered in the chapter.
Uolo partners with K-12 schools to bring technology-based learning programs. We believe pedagogy and technology must come together to deliver scalable learning experiences that generate measurable outcomes. Uolo is trusted by over 10,000 schools across India, South East Asia, and the Middle East.
hello@uolo.com
�275