EXPLORING MATERIALITY THROUGH AI AND GENERATIVE MODELS FOR 2D TO 3D CONVERSION [ EXHIBITED IN VENICE BIENNALE, 2023]
SANDSTONE

Sandstone is a popular building material due to its strength, texture, natural appearance, porosity, and durability. While sandstone can be sustainable if processed using energy-efficient and water-saving methods, its environmental and social impacts should be carefully evaluated, and alternatives such as recycled or reclaimed materials should be considered. The compressive strength of sandstone depends on the strength and even distribution of its cementing substance, which determines its ability to withstand compression stresses.
CONCEPT
During the Gothic period, the Gothic column was developed and typically comprises the base, shaft, capital, and sometimes a decorative plinth. Its ornamental motifs, such as intricate carvings of leaves and flowers, are arranged in a way that accentuates the column’s verticality, granting it a sense of grandeur and height. The Gothic column is a significant element of Gothic architecture and remains an object of admiration and study by architects and historians alike. The Gothic column is subject to two primary forces: compression and tension, which push and pull the column, respectively. These forces work together to produce a robust and stable structural component that can endure the weight of the building and withstand any lateral or horizontal forces that might arise.


WORKFLOW
MIDJOURNEY
As part of my research, I conducted experiments to explore the capability of AI systems to accurately replicate and distinguish depths of architectural structures with additional details in a 2D image. I experimented with various parameters such as dimensions, proportions, and materials to create images with different stone measurements.

The first experimental image was generated using an AI tool called “Mid-Journey”. This prompt engine software utilizes correct grammar to produce an image that combines gothic architectural details, sandstone substance, and square proportions. The resulting image represents a parametric column structure. ZBrush, an AI technology method for producing high-resolution conventional modeling, was used to create this model. Instead of a drafted model, the purpose of this research was to utilize AI to construct the 3D. The resulting 2D image was produced from “Mid-Journey” and created in ZBrush. Each model created using this approach represents a new AI tool that can generate an abstract representation from a distinct notion.
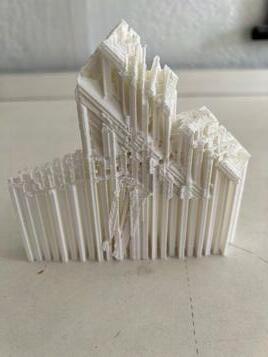


I created an image as part of the project, which combined elements of gothic and baroque architecture, along with ghost home detailing. My aim was to explore the evolution of details in the image and create a 3D print using PLA filament. To achieve this, I used a single picture and imported it in various directions to construct an abstract structure that appeared unique from every aspect. This process resulted in a new AI model.

3D printing with support and without support


3rd ITERATION


The “Mid Journey Prompt” is a tool used for generating accurate prompts. It was used to produce an image representing a Gothic structure with Baroque detailing, made of sandstone material, featuring geometric shapes and topology. The image was created using ZBrush, a high-resolution conventional modeling AI technology. The aim of this research is to explore the potential of AI tools for constructing models from abstract concepts. Each model provides a new approach for generating visual representations of distinct notions.


FABRICATION AND OPTIMIZATION AND MATERIAL SIMULATION


This project focused on fabrication and optimization, as well as material simulation through an evidence-based design approach. The project used computational fluid dynamic simulation, environmental simulation and optimization, structural simulation and optimization, and material simulation and optimization to develop an integrated project through software. The project included the development of customized materials and material composites for 3D and 4D printing and robotic materials that react to stimuli. The applied research exercises focused on a single material-based construction system, a single structural typology, and a single environmental condition, using computational design based on simulation and optimization.
SHELL STRUCTURE - FORM FINDING

SHELL STRUCTURE - STRUCTURAL SIMULATION


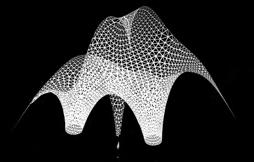


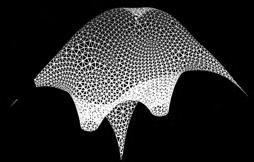

 Form Finding (Kangaroo) Stress Lines (Milipede) Reconstruct mesh based on stress lines
Mesh Triangluation Mesh Topology based on structural anallysis Stress diagram structural analysis (Milipede)
Form Finding (Kangaroo) Stress Lines (Milipede) Reconstruct mesh based on stress lines
Form Finding (Kangaroo) Stress Lines (Milipede) Reconstruct mesh based on stress lines
Mesh Triangluation Mesh Topology based on structural anallysis Stress diagram structural analysis (Milipede)
Form Finding (Kangaroo) Stress Lines (Milipede) Reconstruct mesh based on stress lines
TOPOLOGY SURFACE SIMULATION, 2D TO 3D TRAINING NEURAL NETWORK


TOPOLOGY SURFACE

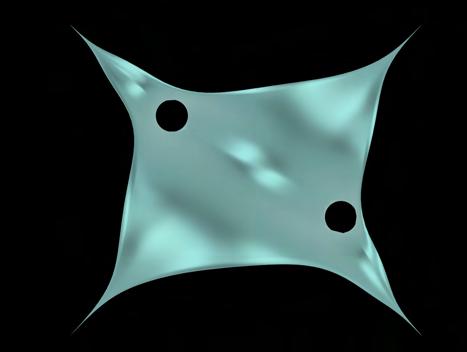
Analysing the typological surface using script from Wolfram Mathematica - Initial Intersection of a self intersecting surface.
This computational design studio focuses on the simulation of topology surfaces using U and V curves. The use of U and V curves allows for the creation of complex shapes and surfaces that can be seamlessly integrated into architectural and industrial design projects. The simulation of topology surfaces using U and V curves involves the manipulation of control points to create intricate geometries and shapes that can be precisely controlled and refined through iterative design processes. This approach to surface simulation offers a high degree of flexibility and precision in the design process, allowing designers to create highly customized and unique forms that can be translated from 2D to 3D models. Through the exploration of U and V curves, this design studio aims to push the boundaries of computational design and generate innovative solutions to design challenges.

Analysing the typological surface using script from Wolfram Mathematica - Sefl Intersecting surface which cannot be projected as plane.

UV Analysis
Understanding the U & V direction in a surface. Relationship to typology surface.
AI Generated Images
2D-3D Point Cloud

Understanding the concept of typology complex surface and using midjourney to explore shell structure and manipulating in point-e to get 3D.


Abstract: This research focuses on the development of a neural network for converting 2D images into 3D models using Point-E, an AI-driven software. The project aims to explore the potential of AI in generating 3D models from 2D images and to train a neural network to recognize patterns and shapes in the images. The software will be trained using a dataset of various 2D images, and the resulting 3D models will be evaluated for accuracy and detail. The research aims to demonstrate the effectiveness of using AI in generating 3D models and its potential applications in various industries, including architecture, gaming, and product design.



M.S.ARCHITECTURE – HEALTH AND DESIGN (VENICE BIENNALE 2023)

NYIT – SOAD
GITHUB
Credits:
Project Direction: Athina Papadopoulou, Christian Pongratz, Mengni Zhang
ProjectTeam: Tharoonaskar Baskaran, Paul Biswayan, Mohammed Furqaan Khan, Mahima Kulkarni, Joel Stuart
CONCEPT
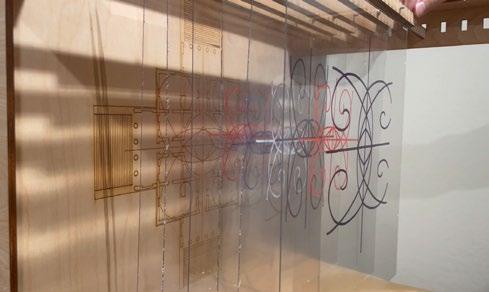
Architects have for centuries been designing for an ideal typical user. Classical and modern drawings have mostly been following different kinds of standardized measurements typically reflecting ideal proportions of a male figure based on the golden ratio, other constructed harmonic scales, or simply an idealized statistically derived average. Architecture based on typical users reinforces assumptions on size and gender and excludes the neurodiverse, and the differently abled. Mismeasured takes the visitors’ body measurements as a starting point to question assumptions that have dictated the measurements of architectural spaces for centuries. The exhibit utilizes visitors’ measurements of navel height and total height to personalize spaces. The Vitruvian Man’s height is equal to the extension of his arms and the extension of all his limbs can be inscribed in a circle centered on his navel. Le Corbusier’s Modulor man’s height ratio to his navel height is 1.618 following the golden ratio. Visitors’ body measurements are being used as an input for a machine generated computational drawing depicting rescaled versions of Villa Rotonda, each adapted to a user’s dimensions. Through the superimposition of various visitors’ inputs throughout the exhibit duration, the drawing will be a dynamically evolving palimpsest of human diversity, a manifestation of elegant disproportions and mismeasured beauty.

VITRUVIAN PROPORTIONS : EXPLORING THE RELATIONSHIP BETWEEN HUMAN ANATOMY AND ARCHITECTURAL DESIGN


SETUP
The initial exhibition requirement of using a cubic space of 50 by 50 by 50 cm was taken as a challenge to create an exhibit that would integrate the computational mechanism, drawing machine and drawing output in a box. The box was made from wood and was designed to integrate a camera to capture visitors’ proportions, a raspberry Pi that runs OpenCV for image recognition and Processing software for the generation of drawings, and a pen plotter which can execute the drawings using G code. The plan drawing of Villa Rotonda was engraved on a vertical wooden sheet to act as a base for the superimposed drawings. Villa Rotonda was chosen due to the significant use of the golden ratio in its design. Each time visitors stand in front of the box, their body measurements get captured by the camera. Based on each visitor’s body proportions, the Villa gets rescaled and redrawn on a transparent acrylic sheet. After completion, each rescaled Villa drawing is hung inside the box in front of the original Villa Rotonda engraving, allowing for active user participation in the inclusive drawing palimpsest.
THE GOLDEN HARMONY: UNVEILING THE INTRIGUING CONNECTION BETWEEN HUMANS, VILLA ROTONDA AND THE TRANSFORMATIVE ROLE OF TECHNOLOGY
EXPLORING HUMAN FIGURE VARIATIONS : ITERATIVE ANALYSIS OF RATIOS AND PROPORTIONS


WORKFLOW



As a major metropolitan city with a highly dense population, New York faces a significant challenge of noise pollution. Noise has a negative impact on the environment, and it is an essential problem for those living in such an environment. While several techniques can minimize noise pollution, it is often unavoidable. This project aims to explore noise reduction and create noiseless cities by leveraging computational methods and noise manipulation using point data.

SITE
Location: Vessel, Hudson Yards, NYC
DATA VISUAL
To achieve this goal, a site was chosen to assess the impact of noise on the environment. Vessel, Hudson Yards, was selected, and a survey was conducted using a camera to capture data. The data was converted into a point cloud that represented the site’s 3D form visually.
NOISE DATA


Noise data was captured using noise dosimetry in and around the streets of Hudson Yards, and this audio data was represented with spheres that move and bounds. The points were controlled by the frequency of the sound data, and the big data with a variable of frequency makes the particles move with speed. These particles are referred to as flow field particles.
INITIAL SIMULATION
The initial sound simulation was conducted using point data that was visualized in cells, allowing them to bounds in that space according to the noise data. Using computational tools, the point cloud’s behavior was altered depending on the sound value.


SIMULATING DATA AS FLOW FIELD DIRECTION

To simulate data as a flow field direction in Unity 3D, a grid of directions was created, and objects were spawned within the grid. The grid’s directions told the objects which direction to apply a force in movement. The simulation demonstrated how the point cloud responds to frequency and moves in a particular direction.


NOISE AFFECTING THE BUILDING
Using this method, it was possible to investigate the impact of sound on the structure and how the shape deforms without observing the sound, which was just audible. The strength of the sound wave rapidly left an impression on the surface at street level, but when the height was increased, the impact faded. This method enabled us to see how the sound emerges on the surface and how long it lasts there.
PARTICLE SIMULATION IN RESPECT TO AUDIO

Using this method, it was possible to investigate the impact of sound on the structure and how the shape deforms without observing the sound, which was just audible. The strength of the sound wave rapidly left an impression on the surface at street level, but when the height was increased, the impact faded. This method enabled us to see how the sound emerges on the surface and how long it lasts there.

CONCLUSION
In summary, this project leverages computational methods to explore noise reduction and create noiseless cities. It showcases how sound data can be used to manipulate point clouds and alter their behavior according to sound values. The resulting deformation of structures provides insights into how noise impacts the environment, making it a useful tool for architects and urban planners.

INTRODUCTION
Here are some key points about the project:
Purpose: The project aims to develop a model that accurately detects the brain states of students based on their levels of relaxation, focus, and neutrality during learning tasks.
Techniques: The model will be developed using big data analytics techniques such as machine learning algorithms and data visualization tools.
Data: The model will be trained on a large dataset of brainwave data collected from students in different learning environments.
Benefits: The NeuroCheck project has the potential to revolutionize the field of education by providing real-time feedback to teachers and students about the cognitive state of learners. This feedback can be used to optimize learning environments and improve learning outcomes.
Future implications: The project may also have implications beyond education, including in fields such as healthcare, where brainwave data can be used for diagnosis and treatment of various conditions.
WHY WE THINK IT’S IMPORTANT

Improved understanding of student emotions: By analyzing brainwave data, you can gain insights into the brain states associated with different emotions. This can help educators and students better understand the relationship between emotions and cognitive function, which can in turn improve student well-being and academic performance.
• Personalized learning: By detecting the brain states of individual students, it may be possible to personalize learning experiences based on their unique needs. For example, if a student is in a relaxed state, it may be more effective to teach them new material, while if they are in a more focused state, it may be more effective to have them engage in problem-solving activities.
• Early detection of learning difficulties: Certain brainwave patterns may be associated with learning difficulties or cognitive disorders. By analyzing brainwave data, educators may be able to detect these issues early on and provide targeted interventions to support struggling students. • Advancements in neurotechnology: The field of neurotechnology is rapidly advancing, and by working with brainwave data, you can contribute to the development of new technologies that can help individuals better understand and regulate their own brain activity. This has potential applications in a variety of fields, including mental health, education, and sports performance.
OUR DATA
We used a dataset from kaggle named: EEG brainwave dataset: mental state.

• The data was collected from four people (2 male, 2 female) for 60 seconds per state - relaxed, concentrating, neutral.
• It used a Muse EEG headband which recorded the TP9, AF7, AF8 and TP10 EEG placements via dry electrodes.
PLOTTING
is a project that aims to accurately detect the brain states of students during learning tasks.
The

OUR OBJECTIVE
• Techniques: The model will be designed using big data analytics techniques such as machine learning algorithms and data visualization tools.
• Data: The model will be trained on a large dataset of brainwave data collected from people in various environments.
• Primary objective: The project aims to provide educators with a tool to better understand and respond to individual student needs, improve teaching strategies, and enhance learning outcomes.
• Real-time feedback: The model’s real-time feedback on student cognitive and emotional states can help educators tailor their teaching strategies to better meet the needs of individual students.
• Contributing to the understanding of the relationship between brain states and learning: Another objective of the project is to contribute to the understanding of the relationship between brain states and learning. The insights gained from the data collected and analyzed through the model could lead to new discoveries about how to optimize learning environments and practices.
• Mental Health: The project could also have implications for mental health and understanding of brain states beyond the context of education. The accurate detection of brain states using the model may contribute to the development of tools and strategies for the diagnosis, treatment, and management of mental health conditions that are associated with specific brainwave patterns.
UNDERSTANDING THE DATA
• Dataset: (2479,989)
• After variance and correlation technique: (2479,374)

• After z-score: (819,100)
• After PCA: (819,20) The high-dimensional datasets, why they are challenging to analyze, and the importance of feature selection and Dimensionality reduction techniques in machine learning?
• As the number of features increases, the likelihood of finding spurious correlations or noise in the data also increases. This can lead to overfitting.
• High-dimensional datasets are computationally expensive to analyze.
TIME SERIES PLOTS OF EEG DATA FOR CHANNEL 1,2 AND 3

3D SCATTER PLOT OF BRAINWAVE DATA

VISUALIZATION OF PAIRWISE RELATIONSHIPS AND K-MEANS CLUSTERING ON MENTAL STATE DATA

3D VOXEL VISUALIZATION OF BRAINWAVE DATA AND SPECTOGRAM ANALYSIS OF BRAIN WAVE DATA

EEG POWER SPECTRAL DENSITY AND BAND POWER ANAYSIS

POWER SPECTRUM ANALYSIS OF EEG DATA

CONFUSION MATRIX AND MULTICLASS ROC CURVE ANALYSIS


Conducted a comprehensive exploratory analysis on a Mental Health Corpus to gain a deeper understanding of the emotional experiences of individuals with anxiety, depression, and other mental health challenges. Conducted word frequency analysis with word cloud visualization to uncover sentiment in a large dataset. Extracted frequent key words and revealed positive language to be the dominant sentiment, providing a captivating insight into the data.


