
FOREWORD
Alan Finkel AO Australia’s Chief Scientist
Adults make a lot of assumptions about what young people are thinking and feeling, so the Bill and Melinda Gates Foundation decided to stop assuming and find out. With data. They commissioned a large survey across 15 countries, including Australia, to understand what matters to this generation.
Our young people worried about many things: the environment and climate change, poverty and economic instability, and the prospect of a world without jobs – or jobs for robots only, humans need not apply.
They had personal worries, too: school marks, and family troubles, and health concerns.
But even bearing all that in mind, they were still significantly more likely than their parents to believe that – in the long run – their generation could have a more positive impact on the world than the generation before.
That gives me hope.
My ambition is for all our young people to leave school in the knowledge that their education equips them to make the future an incredible place. Science education is all about empowering the new generation.
You can think of science as humanity’s superpower. It’s built on a fundamental optimism about the capacity of people, working together, to escape the limitations of the past. We’re fired up not just by the need to know why, but an endless fascination with what’s next. When we look to the future, we see an invitation to fill in the blanks.
Take the global challenge of climate change. With science, it becomes your opportunity. And what abundant potential we have right here in Australia! We can tap our sunshine and wind directly, to make electricity. We can use renewable electricity to split water into hydrogen and oxygen – and countries like Japan want to buy that hydrogen, for use as a zero-emissions, clean-burning fuel. We can mine the lithium required for electric car batteries, more safely and sustainably than other nations. And the high-speed charging stations to charge all those millions of electric cars? Here in Australia, we developed the very best charging stations you’ll find on the global market, and our technology is lining highways all over the world.
If you stepped back in time and told a young person in the 1950s that their grandchildren would be cruising around Sydney in a car powered by Australian sunshine, they would laugh. “You must have read that in a comic book”, they’d say.
But you can do it.
That’s science.
Most superheroes acquire their powers by luck. They’re born with them, or they fall victim to a happy accident. Science powers are different. The content has to be learned, and the skills have to be mastered. It takes enormous dedication and hard work.
I promise you, the rewards are well worth seeking if you have the self-belief and personal commitment to persevere.
Congratulations to all the students, teachers, partner organisations and researchers who have made that commitment to The Future Project. Every one of you has looked at the world and identified a problem that science allows you to solve.
And to the young people reading this journal, I hope you will take that same conviction to the task of inventing our future, no matter which path from school you ultimately choose to pursue. Aim high, work hard... and may the Force be with you.
AFinkel
Dr Alan Finkel AO Australia’s Chief Scientist
Dr
INTRODUCTION
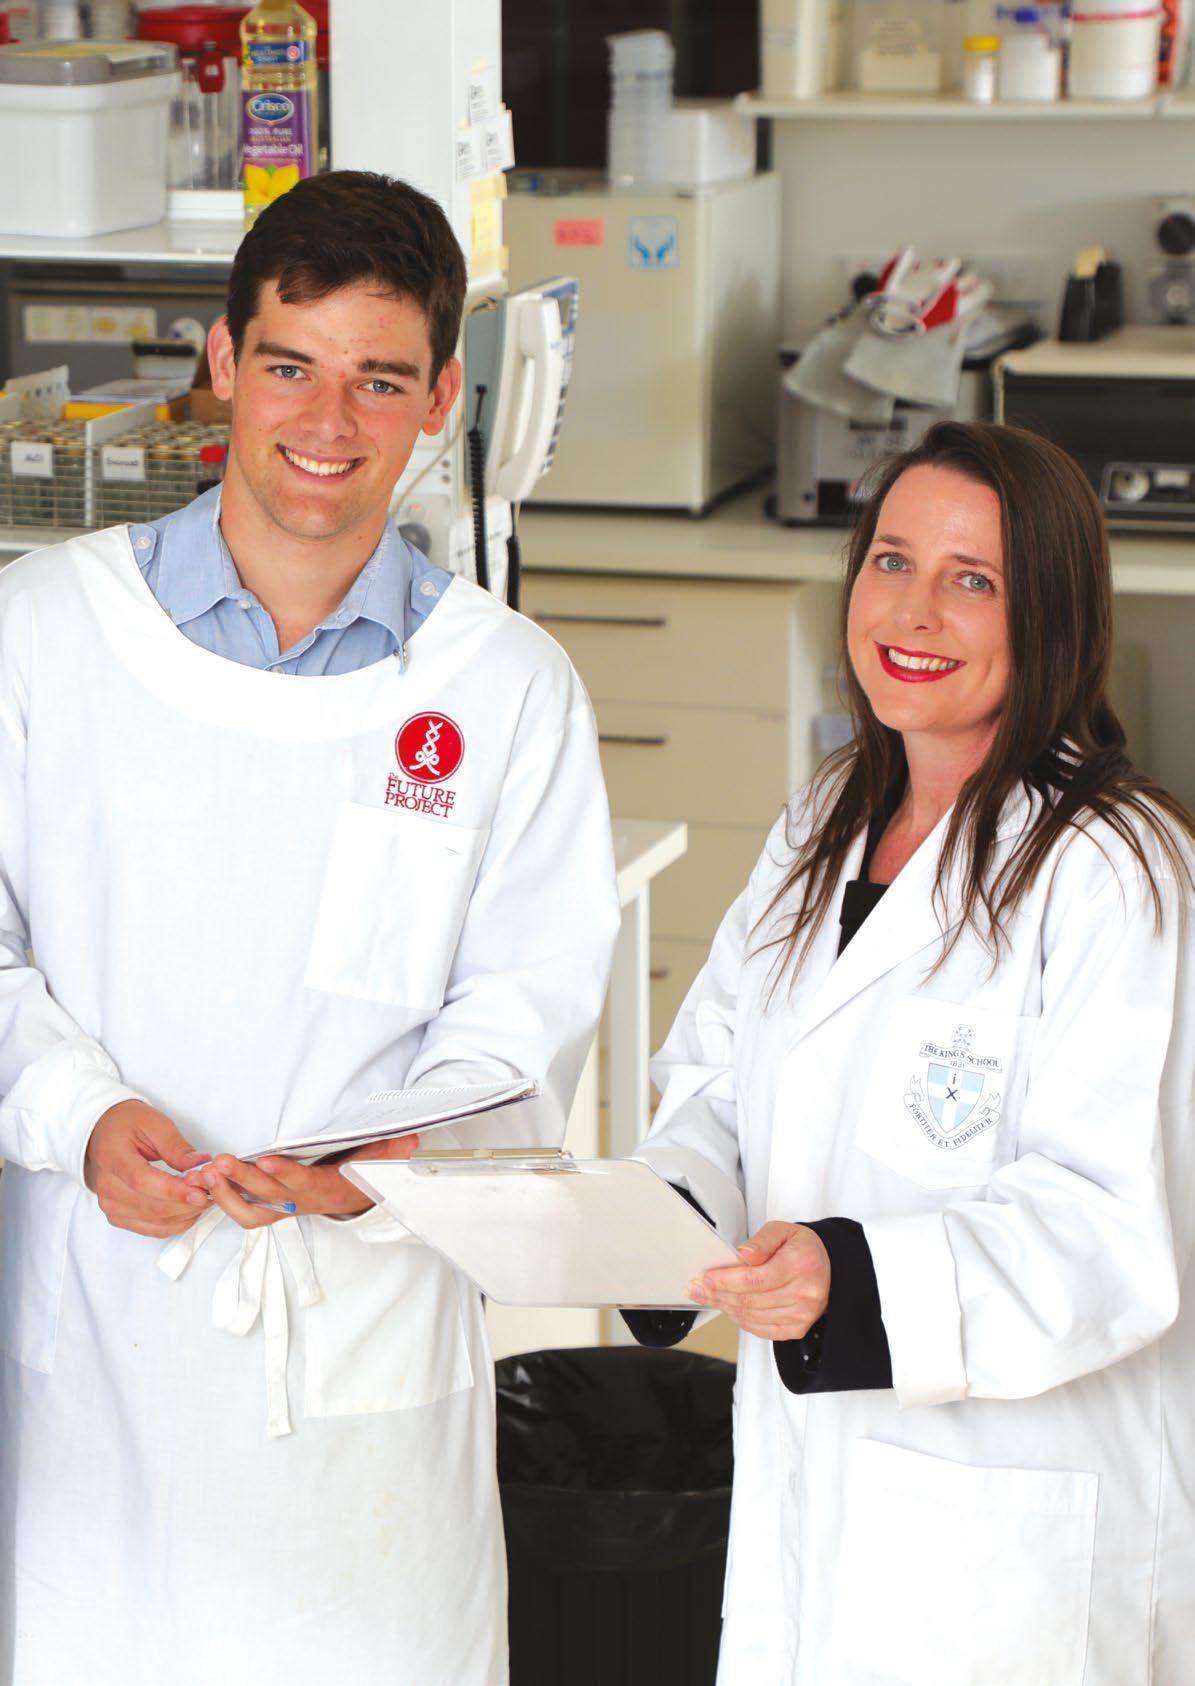
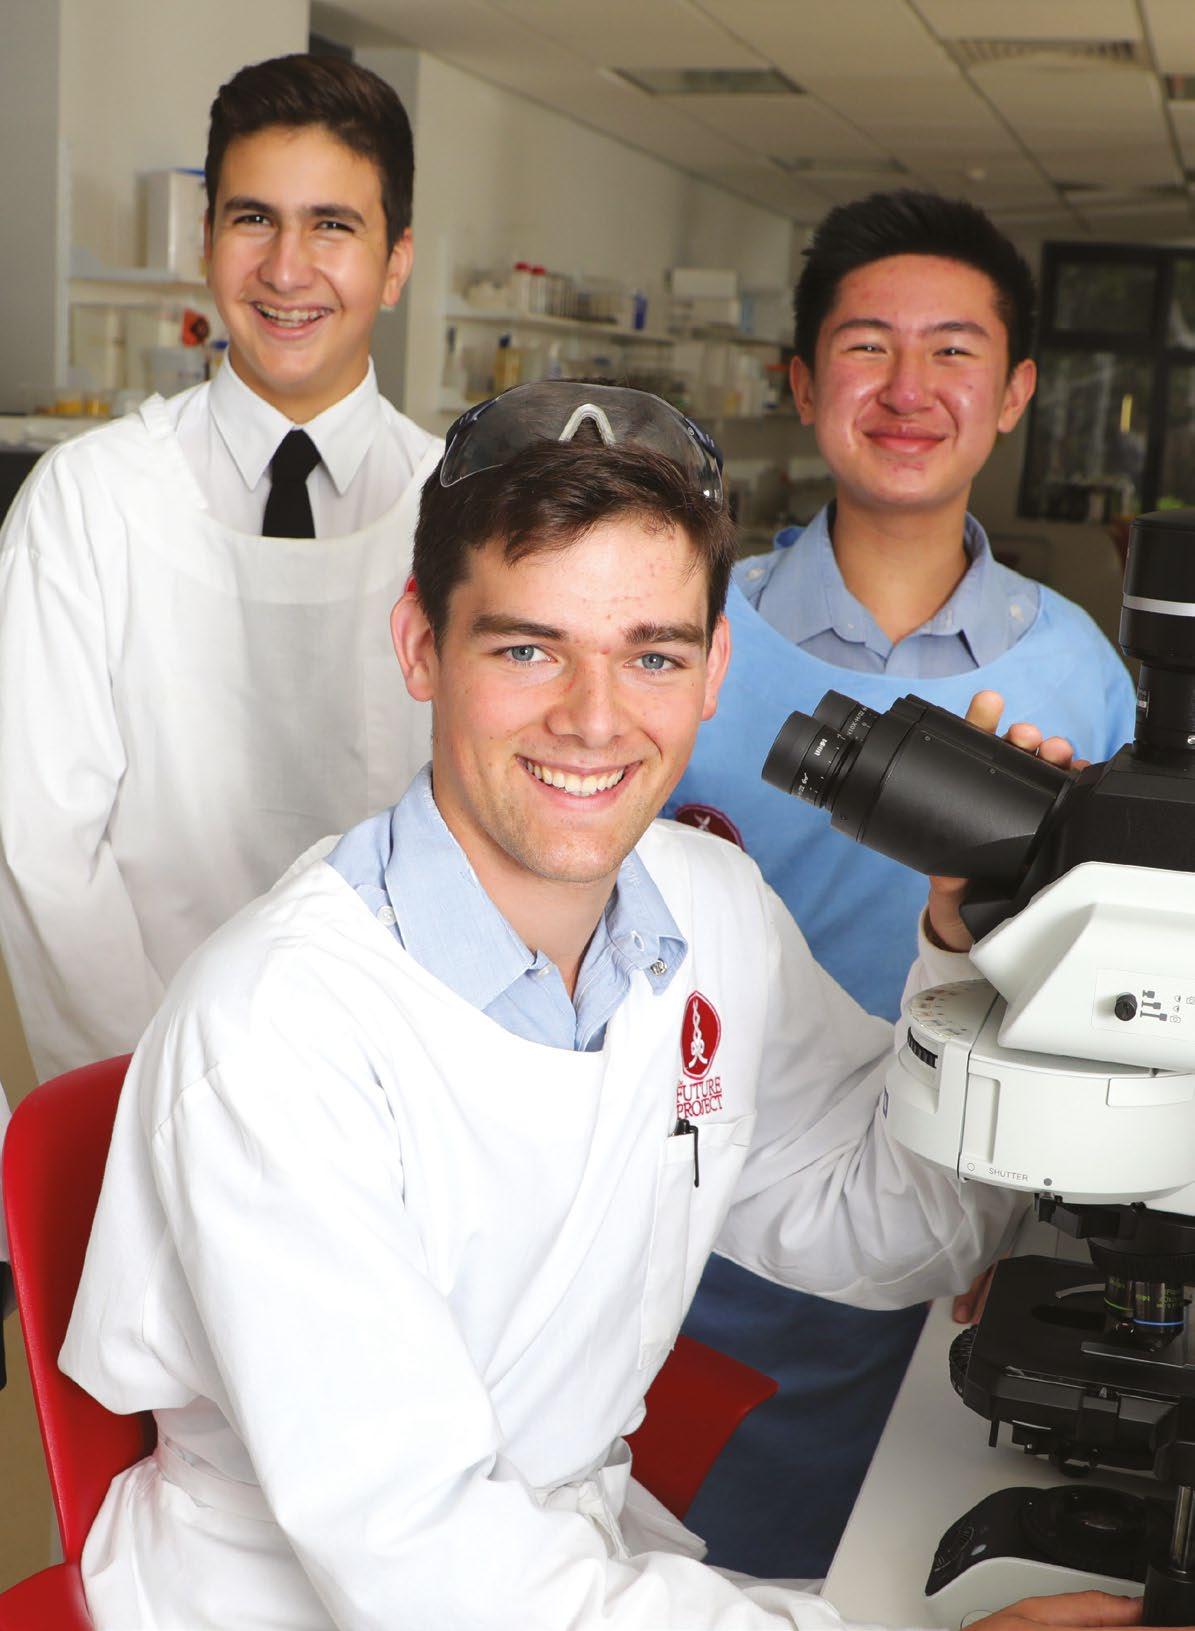
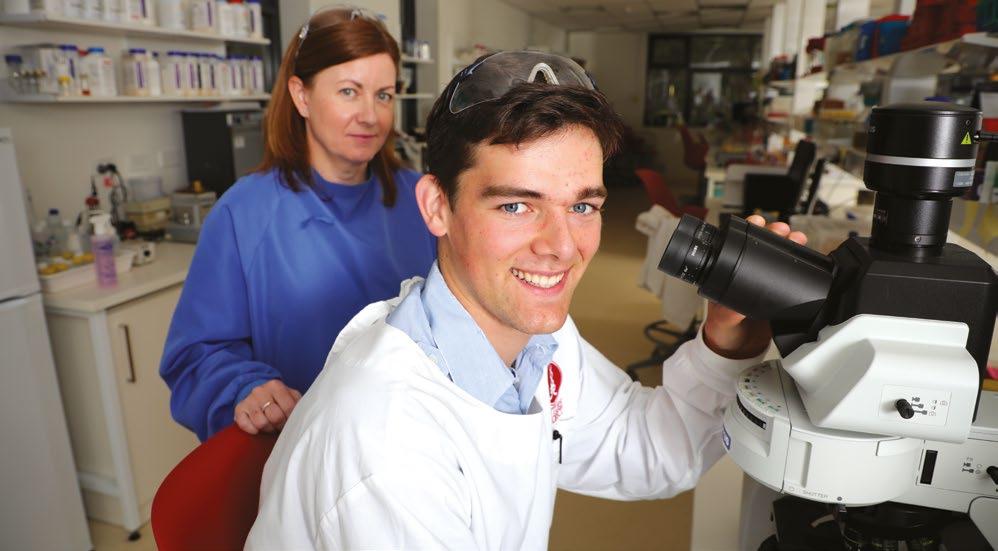
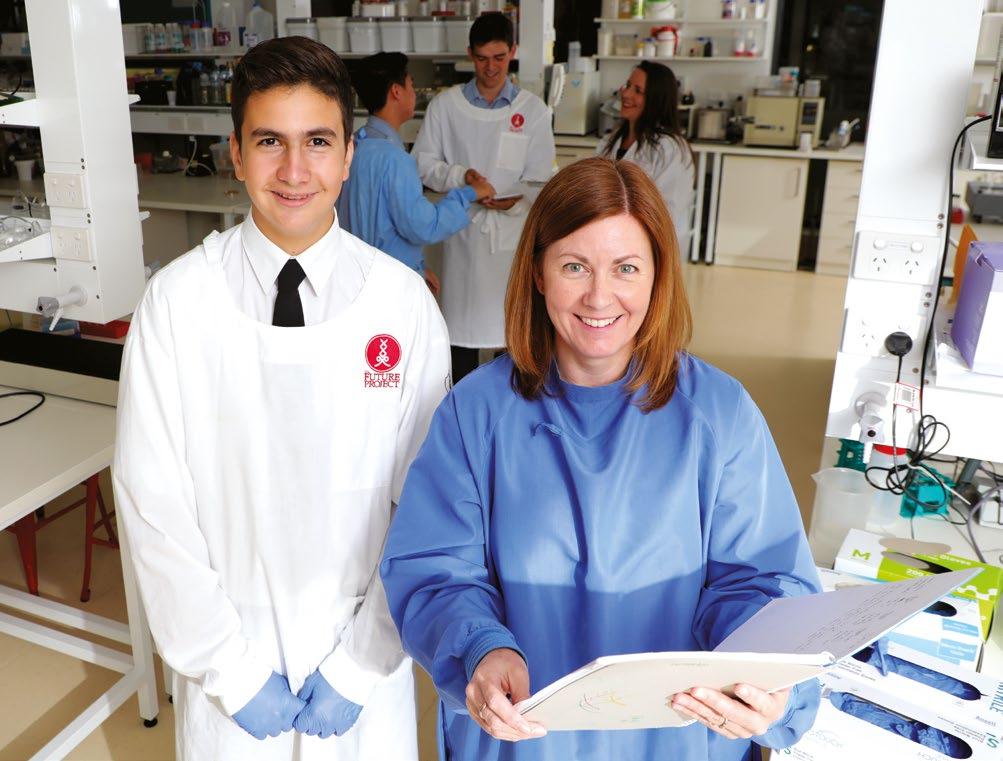
The aim of The Future Project is to motivate and engage the next generation of scientists. It achieves this by providing students with an opportunity to do something they cannot typically do whilst at school – work with and be mentored through research projects by leading scientists. The Future Project is a unique collaboration between scientists and secondary schools, located in an industry-standard research facility in The Science Centre at The King’s School.
The program is fortunate to have a number of independent research-based companies who work on site in The Future Project facilities. The companies include Aegros Biopharma, Quantal Bioscience, Sangui Bio and Joan Lloyd Veterinary Consulting. The scientists who work for these companies are leaders in their fields and bring with them years of industry experience and a wealth of knowledge. The areas of expertise that the scientists work in are varied and include biomedical, microbiological, agricultural and engineering research.
The Future Project consists of two key strands which are integral to science and engineering – research internships and science communication. One path is focused on research and innovation, whilst the other path is focused on the communication of science and improving scientific literacy.
The Future Project has Senior and Junior programs. The Senior Interns program takes in approximately 20 senior secondary (Year 11) students each year. This year’s participants have come from Baulkham Hills High School, Cherrybrook Technology High School, Cumberland High School, Mount St Benedict College and The King’s School (TKS).
Senior Interns collaborate with these scientists on various different authentic research projects. Senior Interns work outside of school time, spending approximately two hours each week during school terms designing, researching and communicating their research. They also participate in two research blocks during the Term 1 and Term 2 school holidays. This allows them more time to work on their projects, such as performing experiments that require a longer amount of time and to immerse themselves in the experience.
Senior Interns develop their knowledge, research and laboratory working skills related to an area of research. The program also helps them to build on their science communication skills. Their research project culminates with a student conference presentation and a research journal article.
The Junior (Year 10 students) intake consists of two strands – research internships (Junior Interns) and science communication (Junior Communicators).
Dr Vera Munro-Smith Director, The Future Project

One path is focused on research and innovation, whilst the other is focused on the communication of science and improving scientific literacy. The Junior Interns program is integrated into normal science class rotations for TKS students. A number of these students then elect to apply for Senior Internships.
The Future Project also partners with tertiary education providers including the University of New South Wales (UNSW), Western Sydney University (WSU) and Sydney University (USyd). The involvement of these partners with The Future Project varies, developing with time and as research interests change. University researchers work with students and staff on research projects, sharing their expertise. They also provide interns with visits to the universities that enables participants in The Future Project to use specialised scientific instrumentation.
With the number of students studying science subjects in Australia on the decline, the importance of encouraging the next generation of scientists is all the more critical. One of the new collaborations this year is with UNSW and is looking at the role of motivation and engagement in students enjoyment and achievement in science. This research is supported in part by the Australian Research Council (Linkage Projects). Student engagement in science can be challenging, especially at a time where they have ever increasing access to new technologies, devices and forms of entertainment.
The other new collaboration this year is with Western Sydney University, in particular with their Advance Materials & Characterisation Facility (AMCF). The AMCF has a wide variety of state-of-the-art scientific instruments for material and biological characterisation, including Scanning Electron Microscopes (SEM) and an X-ray Diffractometer (XRD). The Senior Interns were given the opportunity to use the instruments.
For some interns the experiences provided by The Future Project helps them to decide whether the study of science at the tertiary level or a career in science is for them. Certainly, past Senior Interns have indicated through feedback that the experience encouraged them to choose to study science subjects at the tertiary level, some have even gone on to work for the researchers.
For other students, who had already decided that their interests and passion are with science, they relish the opportunity to immerse themselves in real scientific research and to work with leading scientists. The added benefit is meeting students from other schools and making lasting friendships.
There is hope in the Future.
HYDROGEN PRODUCTION VIA THE DARK FERMENTATION OF PROBIOTIC WASTEWATER
Jack Thomas1, Artharva Thengodkar1, Belinda Chapman2 and Michelle Bull2
1The Future Project; 2Quantal Bioscience
ABSTRACT
Alternate and renewable energy options are becoming increasingly popular in residential and industrial settings and the use of hydrogen as a potential energy source is considered potentially viable. We investigated the possibility of producing hydrogen from nutrient-rich probiotic wastewater using dark fermentation.
A variety of starting microbial consortia were investigated, including untreated and heat-treated soil samples and samples from one year old soil-based Winogradsky columns. Probiotic wastewater was inoculated with the various microbial consortia in a closed, batch fermentation system. Headspace gas was tested with a device that could analyse gas samples up to 500 ppm of hydrogen. No hydrogen production was observed with the probiotic wastewater regardless of the microbial consortia used.
Production of hydrogen through the process of dark fermentation is environmentally, ecologically and economically sustainable. In dark fermentation microbes chemically breakdown organic substances in the absence of light and produce hydrogen.
Quantal Bioscience, an applied microbiology company, are in an alliance with a fermentation process facility to commercially produce yeast and probiotic products. The large scale production of these products will result in excess wastewater after cell harvest which will be an expensive waste stream for the facility to dispose.
We investigated the potential of hydrogen production from the nutrient rich probiotic wastewater as an alternative use of this waste. A component of this was finding a source of a community of microbes that would produce hydrogen through dark fermentation. To explore the hydrogen-producing potential of different microbial consortia we used a microbiological broth system containing antioxidants which facilitated the growth of anaerobic microorganisms.
We used a medical breath testing device with a hydrogen sensor to detect hydrogen gas changes in the closed, static batchfermentation bottles. Hydrogen was detected in the microbiological broth system, at levels exceeding the detector upper limit of 500 parts per million (ppm), from a microbial consortia derived from one year old soil-based Winogradsky columns. Using the same microbial consortia and other microbial consortia derived from fresh soil samples, we were not able to detect hydrogen from the probiotic wastewater fermentation bottles. Investigations will continue to explore the effect of pH and incubation temperature on the potential for hydrogen production from probiotic wastewater.
In a separate closed, batch fermentation system, a microbiological broth containing high levels of antioxidants was investigated for its potential to support the growth of anaerobic bacteria, to likely target microorganisms for hydrogen production in dark fermentation.
Significant amounts of hydrogen (at least 500 ppm) were produced from the broth fermentations inoculated with samples from Winogradsky columns and incubated at 37 °C. The lack of hydrogen production in the probiotic wastewater fermentations may have been due to inhibitory levels of oxygen, pH that was too low or nutrient deficiencies in the probiotic wastewater.
INTRODUCTION
Alternate and renewable energy options are becoming increasingly popular in residential settings – as can be seen in the massive support of residential solar panel use, as well as in industrial manufacturing settings, where significant amounts of energy are often used. There are a multitude of renewable energy options in these facilities including harnessing additional mechanical energy, biogas production and various fermentation options.
Harnessing renewable energy options is of interest to industry as it is both beneficial to the environment and can be financially beneficial in minimising the costs of disposing of wastewaters, as well as minimising energy costs, especially if a closed-loop hydrogen production fuel cell was to be developed.
Hydrogen gas, H2, is considered a very clean energy source (Marchetti, 1973); this is because its combustion only releases water as a reaction product. Hydrogen also has the highest energy density when compared to any other fuel (142 kJ/g). As at 2011, 40 % of hydrogen gas was produced from natural gases, 30 % from heavy oil and naphtha, 18 % from coal, 4 % from electrolysis and about 1 % from biomass (Cardoso et al ., 2014). There is also potential for hydrogen gas production from the nutrient-rich wastewaters of commercial probiotic fermentations.
To date there has been little research as to how to go about producing hydrogen gas from probiotic wastewater, although dark fermentation is seen as a potentially viable method. Investigations into the prospects of dark fermentation from agricultural and food production waste streams have been undertaken by various university groups (e.g., Chen et al ., 2008 and Akroum-Amrouche et al ., 2013).
METHOD
PROBIOTIC WASTEWATER PREPARATION
The probiotic wastewater was produced from a fermentation inoculated with a commercially available probiotic starter culture, with a plant based substrate evenly mixed into 1.2 L of bottled water. The dehydrated probiotic starter culture was resuscitated in 20 mL of De Mann, Regosa, Sharp broth (MRSB) and incubated for 16 hours (h) at 28 °C, whilst shaking at 160 revolutions per minute (rpm). 10 mL of the resuscitated culture was added to each 1.2 L of fermentation substrate and fermented for 24 h at 35 °C at 140 rpm.
After this fermentation, the mixture was centrifuged at 3800 x g for 10 minutes to separate the wastewater from the probiotic and substrate sediment and frozen in 50 mL aliquots at -80 °C until it was required for dark fermentation.
FERMENTATION VESSEL
DEVELOPMENT AND TESTING
In order to collect and analyse the gas produced from the fermentation, two fermentation systems were designed and tested. Firstly, a plastic water bottle filled 2/3 with vermiculite was connected to a foil pouch gas trap via flexible tubing connected to 1 mL syringe barrels and disposable pipette tips, sealed into the bottle cap and pouch with silicon sealant. Secondly, fermentations were conducted in 200 mL glass Schott bottles, with a small hole in the lid and a circle of 1.5 mm nitrile butadiene rubber (NBR) as an airtight layer (see Figure 1). A sample of headspace gas was extracted by needle and syringe through the rubber seal.
Headspace gases were tested for the presence and concentration of hydrogen gas by pushing samples through a breath testing medical device with a H2 sensor, the Gastrolyser. The Gastrolyser has an upper limit of H2 concentration of 500 ppm.Gas-tightness of the bottle system was tested by producing a significant amount of carbon dioxide, CO2, within the container by reacting sodium bicarbonate with acetic acid. We further tested the capability of the bottle to hold H2 by reacting aluminium with potassium hydroxide solution, KOH. Three full 50 mL syringes of this gas were pushed through the Gastrolyser and produced a positive reading of H2
Inoculum
H2 production (ppm)
Universal Broth Wastewater
Winogradsky – 1 (initially heat-treated) > 500 0
Winogradsky – 2 (unheated) > 500 0
Winogradsky – 2 (initially heat-treated) > 500 0
MICROBIAL SOURCES AND INOCULA TREATMENT
The first microbial consortia tested for the production of H2 were four samples of aquatic sediment, three of which were collected at The King’s School campus in North Parramatta, and the fourth collected from Cherrybrook Lakes, Cherrybrook. Half of each sample was heated treated at 80 °C for 10 min in a water bath to enrich the samples for spore forming bacteria.
The other microbial consortia assessed were water samples from two Winogradsky columns that had been developing for more than 1 year. Samples were taken from the anaerobic zones of the columns. Each sample was split, with half being heat treated (80 °C, 10 min).
Isolates of bacterial species previously shown to produce H2 (Rittmann and Herwig, 2012) were obtained from the Quantal Bioscience culture collection: Bacillus subtilis, Bacillus megaterium, Bacteroides fragilis, Citrobacter fruendii, Dietzia sp. and Escherichia coli K-12
DARK FERMENTATION EXPERIMENTS
The soil and Winogradsky column microbial consortia were grown in (1) a microbiological broth containing high concentrations of antioxidants to enable anaerobic growth under aerobic conditions (Universal Broth; Dione et al ., 2016) and (2) the probiotic wastewater to assess their H2 production capabilities.
Individual bacterial isolates of potential H2 producing bacteria and the microbial consortia from a Winogradsky column sample were grown in the Universal Broth and a spectrophotometer was used to determine the optical density (OD) at 600 nanometers (nm) at different times during incubation, prior to measuring H2 production with the Gastrolyser.

Figure 1 Closed, batch fermentation vessel.
50 ml syringe 19 G needle Bottle lid with hole 2mm NBR rubber without hole
Table 1. Hydrogen production from Winogradsky column microbial consortia.
2e winograndsky
B. subtillis
Dietzia
C.fruendii
E.coli
B.megaterium
Bact. Fragillis
RESULTS
Initial dark fermentation experiments were conducted with microbial consortia from unheated and heat treated soil samples inoculated into probiotic wastewater using the first fermentation bottle system with a foil pouch gas trap. Experiments with this fermentation system did not result in measurable production of H2, although bubbles were seen in the bottles after incubation.
Subsequent dark fermentation experiments were conducted in the glass bottle system (see Figure 1). When inoculated with the microbial consortia from the Winogradsky samples (untreated or heat treated), there was no H2 production when the substrate was probiotic wastewater (see Table 1). However, significant amounts of H2 gas were produced from the Winogradsky inoculum when fermented in Universal Broth, such that it exceeded the 500 ppm limit of the Gastrolyser and created a positive pressure within the fermentation vessel.
Figure 2 illustrates the growth of various bacterial species known to produce hydrogen gas via dark fermentation with varying substrates. It is clear that the Winogradsky column microbial consortia and E. coli grew much more rapidly initially in Universal Broth, especially when compared to a species that took longer to begin growth such as B. fragilis. The individual bacterial species tested produced no more than 7 ppm of H2 gas (data not shown) under these conditions.
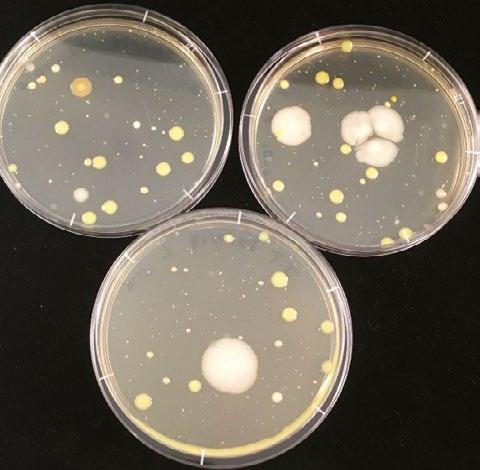
Following dark fermentation of the Winogradsky column, samples were withdrawn of the microbial consortia 2 (heat treated) in Universal Broth and grown anaerobically on Universal Agar to assess the prevailing colony morphology (see Figure 3). There were at least three different colony types that grew substantially under the conditions and are potentially amongst the dominant species responsible for H2 production.
To investigate the differences between the probiotic wastewater and Universal Broth substrates, their pH was measured before and after inoculation and incubation with Winogradsky column microbial consortia 2 (heat treated). The results presented in Table 2 indicate the initial low pH of probiotic wastewater may have inhibited the growth of the microbial consortia, or at least the fraction of microorganisms capable of H2 production.
DISCUSSION
The probiotic wastewater, without alteration, was not an effective substrate for any of the microbial consortia tested for hydrogen production and failed to produce more than 1 ppm with any of the Winogradsky inocula or individual bacterial isolates. In contrast, in Universal Broth, the Winogradsky column microbial consortia regardless of prior heat treatment produced more than 500 ppm H2 within 24 hrs of incubation at 37 °C (see Table 1). This could be as a result of the compositional difference of the substrates (including available proteins or carbohydrates), the high concentration of antioxidants in the Universal Broth (allowing for anaerobic microorganisms to grow) or a more tolerable pH at the start of the dark fermentation (see Table 2).
Universal Broth supported the growth of the Winogradsky column microbial consortia better than the individual bacterial isolates (see Figure 2) and a range of bacterial colony types were present at the end of incubation in this broth (see Figure 3). Although single isolates of various bacteria have been shown to be capable of H2 production (Rittman and Herwig, 2012), for the substrates that were tested here, a microbial consortia may be a prerequisite to ensure all the required components of the H2 production metabolic pathway are present.
Due to the extremely small size of a hydrogen gas molecule, gas permeability was a significant issue when selecting materials for the fermentation system and was responsible for a large portion of the issues surrounding the overall gastight properties of the system. Another factor that may have affected the results surrounds the loss of anaerobic conditions when extracting a gas sample. Although the rubber seal appeared to be airtight, even to hydrogen, after a sample of the headspace had been extracted there was a risk of a loss of the anaerobic environment with the current extraction method.
Additional research to continue on from this investigation could be the alteration of the probiotic wastewater to create conditions in which hydrogen production is possible. Furthermore, repeating the fermentation and taking gas samples at shorter time intervals would allow insight into how the microbial consortium produces hydrogen. With the current upper limit of 500 ppm H2 detection using the Gastrolyser, running the fermentation with a larger
Figure 2. Growth of potential hydrogen producing bacteria in Universal Broth.
headspace might allow for differentiation in H2 production between the various microbial consortia.
CONCLUSION
This investigation provides evidence that there is potential for significant amounts of hydrogen gas to be produced via dark fermentation in Universal Broth, when inoculated with microbial consortia from water samples from aged Winogradsky columns. Although we were unsuccessful in producing measureable amounts of hydrogen gas when using the probiotic wastewater as a substrate, further investigations into controlling factors such as the pH, nutrient and oxygen contents of the wastewater are suggested to determine the viability of the industrial application of this process.
ACKNOWLEDGEMENTS
We would like to thank The Future Project and Dr Vera MunroSmith for giving us this invaluable opportunity, as well as Dr Michelle Bull and Dr Belinda Chapman of Quantal Bioscience for facilitating our research and for all their hard work, support and guidance. Thanks also goes to Emma Winley and Scott Mitchell for their help and advice in the laboratory.
Microbial growth from
REFERENCES
Akroum-Amrouche, D., Abdi, N., Lounici, H. and Mameri, N. (2013) Biohydrogen Production by Dark and Photo-Fermentation Processes. In 2013 International Renewable and Sustainable Energy Conference (IRSEC) , 499–503.
Cardoso, V., Romao, B.B., Thalles, F., Silva, M., Santos, J.G., Batista, F.R.X. and Ferreira, J.S. (2014) Hydrogen Production by Dark Fermentation. Chemical Engineering Transactions , 38:481–486.
Chen, C.Y., Yang, M.H., Yeh, K.L., Liu, C.H. and Chang, J.S. (2008) Biohydrogen Production Using Sequential Two-Stage Dark and Photo Fermentation Processes. I nternational Journal of Hydrogen Energy , 33(18): 4755–62.
Dione, N., Khelaifia, S., La Scola, B., Lahier, J. and Raoult, D. (2016) A quasi-universal medium to break the aerobic/anaerobic bacterial culture dichotomy in clinical microbiology. Clinical microbiology and infection , 22(1): 53-58.
Marchetti, C. (1973) Hydrogen and Energy. Chemical Economy and Engineering Review , 5(1): 7-15.
Rittmann, S. and Herwig, C. (2012) A comprehensive and quantitative review of dark fermentative biohydrogen production. Microbial Cell Factories , 11:115-133.
Figure 3.
Winogradsky column microbial consortia (sample 2e) plated onto Universal Agar after dark fermentation in Universal Broth.
PREVALENCE AND DISTRIBUTION OF INTI1
GENES
CONFERRING ANTIMICROBIAL RESISTANCE IN BACTERIA FROM HORSE-GUT MICROFLORA
Harrison Nguyen1, Samarjeet Saluja1, Anna Zhou1, Michelle Bull2, Belinda Chapman2 and Scott Mitchell2
1The
Future Project, 2Quantal Bioscience
ABSTRACT
The increased use of antibiotics in the world has led to the rapid spread of resistance to antibiotics in bacteria, posing a serious problem for the future treatment of bacterial infections. Known to play a key role in the expression and transfer of antimicrobial resistance, integrons are genetic elements that allow for rapid acquisition and differential expression of genes. In this study the distribution of clinical class 1 integrons in antibiotic resistant bacteria from a complex environmental sample were examined.
A sample of horse manure was taken, diluted and cultured on various agars under a variety of growth conditions, with antibiotics added to promote growth of integron-containing, antibiotic resistant bacteria. Colonies were taken, tested for the IntI1 gene and then their 16S genes were sequenced. In total, five hundred and forty isolates were screened, four of which were confirmed to have possessed the IntI1 gene from three different bacterial genera. Understanding the prevalence and distribution of integrons in antimicrobial resistant bacteria has allowed us to better understand the role they play in the spread of AMR.
Integrons are known to play a vital role in the rising global crisis of the dissemination of antimicrobial resistance (AMR). They are mobile genetic elements – structures that allow for acquisition, expression and transfer of genes, such as those responsible for antimicrobial resistance and thus important when considering the evolution of bacteria. Our group has explored the prevalence of integrons conferring antimicrobial resistance within horse manure. The experiment has focused on horse manure due to the unique environment of the horse gut and the dense and diverse population of microorganisms it contains.
We have taken horse manure and amplified the DNA of various bacteria found in the sample. With this, we then looked for the IntI1 gene, which is characteristic of the clinical class 1 integron (CC1I). When we detected CC1Is, we determined the species of bacteria that possessed the integron. By exploring this specific environment, the group hoped to find integrons that confer antimicrobial resistance to a range of bacteria species. The results gathered by this experiment will help further the world’s understanding of integrons in the hope that it will assist with the fight against antimicrobial resistance.
INTRODUCTION
The development of antimicrobial drugs was one of the greatest medical advancements of the 20th century, allowing humans to survive previously untreatable bacterial infections. Since the advent of penicillin in 1928, there have been discoveries of a variety of other antibiotics to combat pathogenic bacteria. Integrons are genetic elements able to acquire, excise and shuffle gene cassettes within their cassette array, which can contain a range
of gene cassettes, capable of expressing diverse AMR. (Escudero et al ., 2015). CC1Is have played a major role in the global spread of AMR which poses a dilemma for the future treatment of bacterial infections (Gillings et al ., 2008). Antimicrobial resistance is one of the current leading concerns in global public health (Ventola, 2015). By screening for CC1Is derived from complex environments it is hoped this will facilitate an improvement in our understanding of the diversity and prevalence of integrons and ultimately, their respective gene cassettes. Horse manure is a dense, moist environment rich in bacteria and fungi. Both of these are capable of producing antimicrobial compounds which may in turn act as a selective pressure for the widespread transfer of AMR. Among horse gut bacteria, AMR might also be selected for by the use of administered antimicrobial compounds, which can be given to fight infections or in equine feed. The data gathered in this study provides a snapshot of the prevalence of CCI1s in an underrepresented model.
METHODS AND MATERIALS
Horse manure was obtained from a farm approximately 100 km south of Sydney. The sample was taken aseptically and diluted to a 1:10 concentration with 20 % glycerol and 80 % deionised water (sterilised). The horse manure was then spread plated onto a variety of agars (BHIA, NA, R2A, TSA and MRSA) and grown under different conditions, which were optimised to promote the growth of CC1I-containing bacteria as established by previous studies (Deng et al. , 2015; see Table 1). Plates were incubated at either 30 or 37 ˚C and either aerobically or under an Oxoid CampyGen gas mix (see Table 1). The plates were also grown with three different antibiotics (sulfamethoxazole, trimethoprim
or streptomycin) to eliminate the bacteria without AMR. Cycloheximide was added to discourage growth of fungi. A total of fifty-four plates were incubated. Plates were prepared with a 10-2 and 10-3 dilution of horse manure.
The plates were incubated for 48 hours and 10 colonies were selected from each plate (for a total of 540 isolates) and stored into 96 well plates with 10 μL of PBS (10 ml PBS/490 milliQ water). These colonies were also placed together in batches of five colonies in Eppendorf tubes for the initial batch (first round) of processing (108 tubes in total). The Eppendorf tubes carrying five isolates were then boiled for 15 minutes at 95 ˚C and centrifuged for 1 minute at 120 revolutions per minute (rpm). From this, the supernatant was pipetted off the boiling cell lysates and placed into a new tube. Master mix with taq polymerase and primers HS915 & HS916 was then added to each supernatant and underwent a Polymerase Chain Reaction (PCR) process.
PCR product was used for gel electrophoresis with one gel for each batch of five with 1.8 % agarose at 120 volts. Within each gel, a standard ladder was used with 100 base-pair increments, along with a negative control (a lane of master mix alone) and a positive control (a Pseudomonas spp . already confirmed to have the IntI1 gene). A picture was taken of each gel to confirm if they possessed the IntI1 gene at 341 base pairs and the positive batches were recorded. Then the individual isolates from the positive batches of five underwent the same process.
Individual isolates that returned positive were re-streaked and incubated in the same conditions as their original source plate until colonies could be picked from a monoculture. These colonies underwent the same boiling and storage as the others. They were then screened for IntI1 with PCR and gel electrophoresis. If positive for IntI1, the isolates were also screened for the sequences for two, more complex mobile genetic elements, the transposons IS26 and ISCR1. Finally, IntI1 positive isolates were also sent to an external facility for Sanger sequencing of the 16S gene to identify the bacterial species.
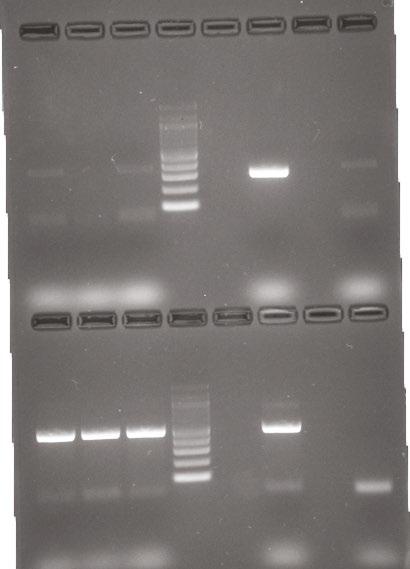
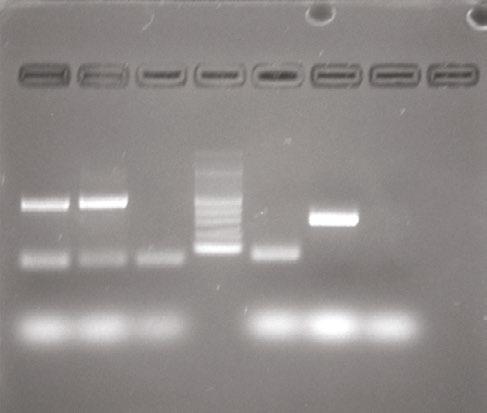
Figure 2 (below): Electrophoresis gel of sample Q7 testing for 16S and ISCR1 genes.
Figure 1 (above). Electrophoresis gel of IntI1 positive isolates from BHIA sulfamethoxazole 37 ˚C.
RESULTS
From the 540 isolates screened, there were a total of 11 colonies that were suspected to have possessed the IntI1 gene. However, only four pure cultures were able to be obtained and confirmed to be positive for the IntI1 mobile genetic element (MGE; see Table 2 and example gel, Figure 1). Of the four isolates confirmed to have integrons, none possessed the mobile genetic element ISCR1, but three were confirmed to also have the IS26 mobile genetic element, with one result still pending at the time of writing (see Table 2). All of the IntI1 positive samples were also confirmed as bacteria, on the basis of their possession of the 16S gene (see example gel, Figure 2). Once the bacteria were sequenced it was determined that isolate Q1 was Leclercia of an unknown species, isolates Q2 and Q3 were believed to be of the same species Escherichia hermannii and isolate Q7 was Arthrobacter of an unknown species (see Table 2).
DISCUSSION
This experiment explored the prevalence of integrons within bacteria found in horse manure, incubated under a range of conditions. Therefore, this experiment is able to offer results from a complex environmental sample. Horse manure was chosen as it is a dense, moist environment rich in bacteria and fungi, both of which can produce antimicrobial compounds and thus may contribute to the selection of AMR facilitated by MGEs.
In the future, to expand on the scope of this project, sampling a greater number of horses could be performed, to continue to expand our knowledge of MGEs in the horse gut environment. As the sample was only taken from one horse, these results may not be representative of all horses. This also includes the fact that the horse sampled may have been given antimicrobials selecting for the resistances observed.
CONCLUSION
Through this experiment, a number of MGEs and their resident bacterial species were characterised. The experiment revealed that out of five hundred and forty isolates, four individual isolates were confirmed to contain a IntI1, and at least three to have another MGE. As integrons play a vital role in the dissemination of antimicrobial resistance, these results may eventually assist in the fight against global AMR.
ACKNOWLEDGEMENTS
Special thanks go to the staff of The Future Project, especially Dr Vera Munro-Smith and the researchers at Quantal Bioscience – Dr Belinda Chapman, Dr Michelle Bull and Ms Emma Winley, for their tremendous support. Thanks to Mr Tim Weston, as Baulkham Hills High School’s Coordinating Teacher and the other industry partners of The Future Project for allowing The Future Project to exist and giving us this great opportunity. We would like also to thank The King’s School for allowing us the use of their facilities.
Table 1. Growth conditions of bacteria.
Man, Rogosa, Sharpe
Table 2: Molecular markers identified within integron-containing isolates.
(Leclercia sp.)
Q2 (Escherichia hermannii)
Q3 (Escherichia hermannii)
Q7 (Arthrobacter sp.)
REFERENCES
Escudero, J. A., Mazel, D., Nivina, A. and Loot, C. (2015) The Integron: Adaptation On Demand. Microbiology Spectrum , 3(2) Gillings, M., Boucher, Y., Labbate, M., Holmes, A., Krishnan, S., Holley, M. and Stokes, H. W. (2008) The Evolution of Class 1 Integrons and the Rise of Antibiotic Resistance. J ournal of Bacteriology , 190(14): 5095–5100.
Ventola, C. L. (2015) The Antibiotic Resistance Crisis: Part 1: Causes and Threats. Pharmacy and Therapeutics , 40(4): 277–283.
Deng, Y., Bao, X., Ji, L., Chen, L., Liu, J., Miao, J. and Yu, G. (2015) Resistance integrons: class 1, 2 and 3 integrons. Annals of Clinical Microbiology and Antimicrobials , 14: 45.
PROTEIN SEPARATION IN ELECTROCYL – A CYLINDRICAL TANGENTIAL MEMBRANE ELECTROPHORESIS SYSTEM
Feng Ye1, Edison Ruan1, Matthew Ford1, Olivier Laczka2, Kailing Wang2 and Hari Nair2
1The Future Project; 2Aegros Biopharma
ABSTRACT
ElectroCyl is a separation device which combines electrophoresis and membrane technology to selectively extract proteins from human plasma. This process isolates proteins based on their size and charge through membranes with pre-defined pore sizes where the proteins are mobilised by an electric field (Ef). The project is aimed to better understand the design characteristics of the ElectroCyl and optimise the overall separation efficiency of the instrument. The unique feature of the device is that the outer electrode is larger than the inner electrode. This raises a question:
Plasma-derived therapeutics are commonly used to treat patients suffering from a broad range of diseases. Many developing countries have trouble getting access to these life-saving drugs due to the high cost. The ElectroCyl is a protein separation device that can pull out the target substances from human plasma. The aim of this research project is to better understand the design characteristics of the device and determine how to improve the efficiency of its separation process. The data collected from this study will contribute to the development of the large scale ElectroCyl unit to be used in a commercial manufacturing plant.
INTRODUCTION
Plasma is the largest component in blood, adding up to approximately 55 % of the overall blood content. Proteins within plasma can be extracted and used for therapeutic purposes to treat people with health conditions such as autoimmune disorders, haemophilia and blood loss (Nicholson, et. al. , 2000). The most abundant protein in plasma is Albumin, representing 55 – 60 % of all proteins. Human Albumin is a globular protein which consists of one polypeptide chain of 585 amino acids, with a molecular weight of 66 500 Da.
Electrophoresis is a well-established technique dating back to the late 19th century when it was used to purify clay (Moulik, et. al. , 1967). This technique is now commonly used to separate proteins from matrices based on their size and charge (Izzo, et al. , 2006). Its basic principle involves generating an electrical field across a gel in which a cathode and anode are placed on either side of the electrophoresis apparatus with a conductive buffer in the system.
The newly developed ElectroCyl presents a configuration where a membrane cartridge is placed between a pair of electrodes. Within the membrane cartridge, a separation membrane is sandwiched between two restriction membranes defining two separated streams and allowing proteins to transfer from one stream to the other when an electrical field is applied (see Figure 2).
will there be a difference in transfer rate if proteins travel from inner toward outer electrode, or vice versa? A series of experiments were conducted using Bovine Serum Albumin (BSA) as the model protein to determine the preferential direction of transfer. The results show a greater pulling effect on the charged proteins by the asymmetrical larger outer electrode, providing a 0.4 mg/min/ cm2 increase in protein transfer, representing an overall 30 % yield improvement compared to the inbound direction.
METHODS AND MATERIALS
BRADFORD PROTEIN QUANTIFICATION ASSAY
The Bradford Assay (using Bovine Serum Albumin, BSA) was carried out in a 96-well plate, adding 280 µL of Bradford reagent (Bio-Rad) to 20 µL of sample, followed by 5 minutes of incubation in the dark and absorbance determination at 595 nm using a microplate reader (iMARK, Bio-Rad). Protein concentrations were calculated by aligning the absorbance obtained to a standard curve prepared using a serial dilution of standard protein solutions (Sigma-Aldrich) ranging from 0 to 0.5 mg/mL. Appropriate dilutions were made for each sample to ensure that the absorbance values were within the linear part of the standard curve (Optical Density, OD, was no higher than 0.8). Tris-Borate (TB) buffer at pH 8.9 was used as the eluent. Each sample was analysed in triplicate.
SDS-PAGE GEL ELECTROPHORESIS
The three replicates of collection streams for each of the two configurations tested were pooled together. The pooled samples and the starting BSA solution were diluted (1:20). Subsequently, 10 and 5 µL of these solutions, respectively, were mixed with 2 x Laemmli sample buffer (Bio-Rad) at a 1:1 ratio and then placed into the wells of mini-PROTEAN TGX stain-free gels, 4-20 % (Bio-Rad), along with a colour burst marker (Sigma-Aldrich). 10 µL of TB buffer was also processed as the negative control. A Tris-Glycine Sodium Dodecyl Sulfate (SDS) buffer was then added into the gel tank. After 40 minutes at 90 volts, the gels were stained with EZBlue gel staining reagent (Sigma-Aldrich).
PROTEIN SEPARATION BY ELECTROCYL
Each inbound and outbound configuration was tested in triplicate and in an alternate fashion. The buffer tanks were connected to a chiller set at 7 ℃ to keep the temperature of the system within a reasonable range. 39.5 mg/mL BSA in 45 mM TB buffer at pH 8.9 was prepared as the feed and 150 mL of this solution was introduced in the feed vessel, while the collection vessel was supplemented with 150 mL of TB buffer only. Each buffer tank was filled with 5 L of refrigerated TB buffer. The polarity of the electrodes was adjusted depending on the transfer direction
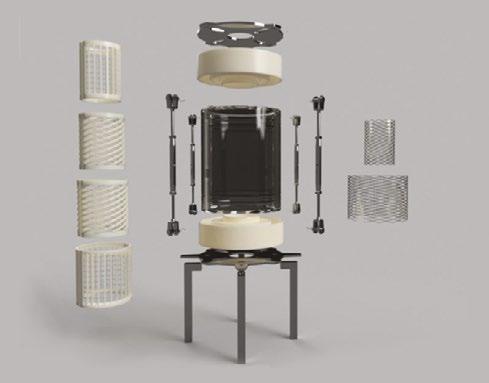
1. Inner restriction mesh
2. Inner seperation mesh
3. Outer seperation mesh
4. Outer restriction mesh
5. Inner titanium electrode
6. Outer titanium electrode
7. Top end plate
8. Top end cap
9. Tensioners
10. Acrylic casing
11. Bottom end cap
12. Bottom end plate
13. Legs
Figure 2. Deconstructed view of the ElectroCyl and description of its main components.
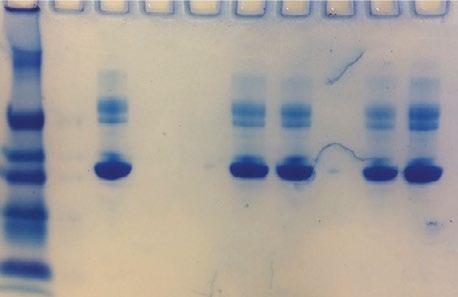
3A. Mass transfer rates obtained depending on the direction of transfer (error bars represent the standard error of the mean); 3B. Coomassie-stained SDS-PAGE gel comparing the protein contents in each stream prior and after the transfer process.
4A. Averaged currents; 4B. Temperatures recorded at the start and end of each run; error bars represent standard deviations.
Figure
Figure
tested. Runs were carried for 15 minutes at 240 volts. A peristaltic pump controlling both the feed and collection streams was set at 100 rotations per minute (rpm) while the buffer pumps were both set at 350 rpm.
The temperatures of both stream, as well as that of the buffer, were recorded at the start and end of each run. The electrical currents were also recorded for each run. The buffer contained in each tank was thoroughly mixed between each run to ensure consistency in conductivity across all experiments. A new cartridge was assembled using fresh membrane before each run. The transfer rates were calculated as a function of Albumin mass transfer into the collection stream per cm2 of membrane and time (expressed in mg/cm2/min).
RESULTS
The results show average transfer rates of 0.82 mg/min/cm2 for the inbound direction versus 1.19 mg/min/cm2 for the outbound direction (see Figure 3A). Figure 3B illustrates the increased BSA transfer toward the collection stream in the outbound configuration compared to the inbound one (54 %and 39 %). The mass balance calculated at the end of the run was approximately 100 % in both cases.
The currents recorded at the start and end of each run were lower when carrying out the transfers in the inbound configuration. Overall, the current was consistently lower at the end of the runs than at the start (see Figure 4A). Temperatures increased along each run duration. The temperature increase was larger when operating the ElectroCyl in the outbound configuration. Additionally, the collection stream seemed to heat up faster than the sample one.
DISCUSSION
A clear difference in transfer efficiency was shown depending on the direction of transfer, with the outbound direction yielding a significantly higher protein transfer rate. This phenomenon probably results from the fact that the larger electrode generates a larger electrical pulling force.
The temperature was monitored throughout each single transfer run and was recorded at the start and end of each experiment (see Figure 4B). Interestingly, the temperature increase is consistently higher in the collection stream regardless of the direction of transfer, showing that the positive electrode might generate more heat that the negative one, independently of size. Since the cooling system had a limited capacity, the experiments were arranged in an alternating order and in pairs to sustain the validity and accuracy of the experiment. Figure 4B clearly shows the increase in temperature during the experiments. The temperature often rose over 35 ℃, which is likely to compromise the integrity of proteins. Therefore, such a high voltage might not be suitable in the future unless a more powerful cooling system is implemented.
CONCLUSION
The outbound transfer was significantly more efficient than the inbound one, since the outer electrode had a larger surface area and consequently, provided a stronger pulling force. The results obtained show a difference of 0.4 mg/min/cm2 in transfer rate, representing about 30 % increase in yield. Further studies should involve the use of human plasma to assess the impact of transfer direction on the purity of the separated proteins, as a slower transfer might prevent smaller impurities to get through the membrane during the process. Such a study could also help determine whether a given direction of transfer could be more suited for the separation of certain types of proteins, depending on their size or charge.
ACKNOWLEDGEMENTS
We thank The King’s School for providing us with this opportunity. We would also like to acknowledge the support from Cumberland High School and Cherrybrook Technology High School. Finally, we thank Aegros Biopharma, in particular, Dr Olivier Laczka, Dr Kailing Wang and Dr Hari Nair for guiding us through the project.
REFERENCES
Izzo, V., Costa, M. A., Di Fiore, R., Duro, G., Bellavia, D., Cascone, E. and Barbieri, R. (2006) Electrophoresis of proteins and DNA on horizontal sodium dodecyl sulfate polyacrylamide gels. Immunity & Ageing , 3: 7.
Moulik, S., Cooper, F. and Bier. M. (1967) Force-flow electrophoretic filtration of clay suspensions: Filtration in an electric field. Journal of Colloid and Interface Science , 24: 427-432.
Nicholson, J., Wolmarans, M. and Park, G. (2000) The role of albumin in critical illness. British Journal of Anaesthesia , 85(4): 599-610.
THE ROLE OF MOTIVATION AND ENGAGEMENT IN STUDENTS’ ENJOYMENT AND ACHIEVEMENT IN SCIENCE
Andrew
J. Martin1, Roger Kennett2, Marianne Mansour1, Brad Papworth1 and Joel Pearson1 1 University of New South Wales; 2 The Future Project ABSTRACT
In recent years, Australian students’ participation and achievement in science has been declining, leading to calls for research to identify factors that may be targeted to redress these troubling trends. The present study focused on students’ motivation and engagement in science as potential factors implicated in science outcomes. Specifically, the study explored the relationship between students’ motivation and engagement in science and their enjoyment of, and achievement in, science. The sample comprised 160 boys and girls in Years 7 to 10 from two urban Australian schools.
Correlations demonstrated that key aspects of students’ science motivation and engagement were indeed linked to their enjoyment of and achievement in science. Findings provide insight into motivation and engagement factors to target in educational intervention seeking to optimise science outcomes. Discussion of findings identifies next steps in assessment of students’ science motivation and engagement, including examination of psycho-physiological (via biometrics) and neuro-psychological (via electroencephalography; EEG) correlates.
Boosting the science skills and knowledge that underpin research and innovation enhances a nation’s competitiveness and its citizens’ wellbeing. Unfortunately, statistics in recent years have shown that science in Australia is under some threat. Science enrolments for senior school students have been in a long-term descending trend and the science achievement of Australian high school students has declined in recent years. At the same time, high school students’ interest in and enjoyment of science can be difficult to sustain because science is a challenging subject. Improving students’ science motivation and engagement has been identified as part of the solution to these troubling statistics.

Thus, in this investigation, we examined students’ science motivation and engagement—and their links to students’ enjoyment and achievement in science. Our study of 160 high school boys and girls from two schools found that there were some key motivation and engagement factors that are significantly linked to both enjoyment of and achievement in science. Targeting these factors in science pedagogy may be one avenue for boosting science outcomes among Australian high school students.
INTRODUCTION
Enhancing the science knowledge and skills that drive research and innovation in diverse aspects of society will boost a nation’s competitiveness (Australian Academy of Science, 2006; Office of the Chief Scientist, 2012, 2014). However, Australian statistics show that science enrolments for senior school students have been in a long-term descending trend (Office of the Chief Scientist, 2014) and the science achievement of Australian students has declined in the latest (2016) Trends in International Mathematics and Science Study.
Improving and sustaining students’ science motivation and engagement has been identified as critical to addressing these alarming statistics and to enhance students’ enjoyment of and achievement in science (Committee for a National Science Communications Strategy, 2010). Therefore, this investigation examined students’ science motivation and engagement—and their links to students’ enjoyment and achievement in science.
In this study, motivation is defined as students’ energy, inclination and drive to learn and achieve; engagement is defined as the behaviour following from this energy, inclination and drive (Martin, 2007). Motivation and engagement are multidimensional, comprising positive and negative thoughts, emotions and behaviours. The Motivation and Engagement Wheel (Martin, 2007)
Positive motivation in science – Self-belief – Valuing
Learning focus
Positive engagement in science
– Plan and monitor – Task management – Persistence
Negative motivation in science – Anxiety – Failure avoidance – Low
Negative engagement in science – Self-sabotage – Disengagement
† p < .10, * p < .05, ** p < .01, *** p < .001
is a multidimensional framework that articulates these positive and negative motivation and engagement factors (see Liem and Martin, 2012) for a review of its development and for more detail on its motivation and engagement factors). These factors are grouped into four themes: positive motivation, positive engagement, negative motivation and negative engagement. Figure 1 displays the Motivation and Engagement Wheel.
Three factors reflect students’ positive motivation in science: selfbelief, valuing and learning focus. Positive engagement in science also comprises three factors: planning and monitoring behaviour, task management, and persistence. Three factors are part of negative motivation: anxiety, failure avoidance and low control. Finally, self-sabotage and disengagement are the two factors reflecting negative engagement.
METHODS AND MATERIALS
PARTICIPANTS
The study comprised 160 students in Year 7 (29 %), Year 8 (27 %), Year 9 (22 %), and Year 10 (22 %). They were from an independent single-sex boys’ school (~70 % of the sample) and an independent single-sex girls’ school (~30 %) in Sydney, Australia. The average age was 13.99 (SD = 1.24) years.
PROCEDURE
Data collection was supervised by a university research assistant and involved the following three components: an online demographic survey, an online science motivation and engagement survey, and a hard copy science test. Students participated in small groups of 6-10 students. Students completed all parts of the survey and test on their own.
MATERIALS MOTIVATION AND ENGAGEMENT IN SCIENCE
Science motivation and engagement were measured using the Motivation and Engagement Scale (MES; Martin, 2015). The MES
item wording was adapted to science—an adaptation that has been previously validated (Green, Martin and Marsh, 2007). Each of the 11 parts of Wheel was assessed via 4 items (thus, a 44-item instrument in total). To each item, students rated themselves on a scale of 1 (Strongly Disagree) to 7 (Strongly Agree). Each student’s responses to each of the 4 items were then aggregated to generate 11 average scores for each student (each average score corresponding to each part of the Wheel).
SCIENCE ENJOYMENT AND SCIENCE ACHIEVEMENT
Science enjoyment was assessed with four items previously validated by Green et al. (2007). As with the MES, these items were rated by students on a scale of 1 (Strongly Disagree) to 7 (Strongly Agree) and then aggregated to generate an average enjoyment score for each student. Science achievement was assessed using questions from the Australian Council for Educational Research (ACER) Progressive Achievement Tests in Science (PAT Science; Martin, Urbach, Hudson and Zoumboulis, 2009). The PAT Science is a validated test assessing scientific literacy, science knowledge, and application of scientific principles from Years 3 to 10. To ensure comparability across Years 7 to 10, we standardised ( M = 0, SD = 1.00) the total raw score for each year group.
DATA ANALYSIS
Data analysis centered on bivariate Pearson product-moment correlations using SPSS for Windows (version 24). The minimum level of statistical significance was set at p < .05 (though, for completeness, we also signalled where an effect was significant at p < .10), with values of p < .01 and p < .001 reflecting more stringent levels of statistical significance. We also present effect sizes for each correlation, based on Cohen’s d-value. For each d-value we indicate its magnitude, with d = 0.2, 0.5, and 0.8 corresponding to small, medium and large effects respectively.
Table 1. Bivariate correlations (and effect sizes; Cohen’s d) between motivation and engagement in science and students’ enjoyment of and achievement in science
RESULTS
Results are presented in Table 1. In terms of correlation between positive motivation and engagement and students’ science enjoyment, self-belief (r = .52, p < .001), valuing (r = .68, p < .001), learning focus (r = .53, p < .001), planning and monitoring (r = .25, p < .01), task management (r = .29, p < .001) and persistence (r = .49, p < .001) were statistically significant; all associated with greater science enjoyment. Of this group of motivation and engagement factors, relatively higher effect sizes were found for self-belief (d = 1.22), valuing (d = 1.86), learning focus (d = 1.25) and persistence (d = 1.12).
Regarding the correlation between negative motivation and engagement and students’ science enjoyment, anxiety (r = -.19, p < .05), failure avoidance (r = -.17, p < .05), low control (r = -.28, p < .001), self-sabotage (r = -.26, p < .01) and disengagement (r = -.70, p < .001) were statistically significant; all associated with lower science enjoyment. Of this group of motivation and engagement factors, a relatively higher effect size was found for disengagement (d = 1.96).
In terms of the correlation between positive motivation and engagement and students’ science achievement, self-belief (r = .25, p < .01), valuing (r = .21, p < .01) and persistence (r = .14, p < .10) were statistically significant; all associated with greater science achievement. Of this group of motivation and engagement factors, a relatively higher effect size was found for self-belief (d = 0.52).
Regarding the correlation between negative motivation and engagement and students’ science achievement, anxiety (r = -.20, p < .05), low control (r = -.26, p < .01) and disengagement (r = -.24, p < .01) were statistically significant; all associated with lower science achievement. Of this group of motivation and engagement factors, relatively higher effect sizes were found for low control (d = 0.54) and disengagement (d = 0.50).
DISCUSSION
The present study sought to ascertain the link between students’ motivation and engagement in science and their enjoyment of and achievement in science. Harnessing the factors in the Motivation and Engagement Wheel (Martin, 2007), findings showed that motivation and engagement were significantly associated with students’ enjoyment of and achievement in science. Notably, of the Wheel’s factors it emerged that self-belief in science, valuing of science, learning focus in science and persistence in science were particularly linked to higher levels of enjoyment of science, while disengagement was particularly linked to lower levels of enjoyment in science. In terms of science achievement, self-belief was particularly linked to higher performance, while low control and disengagement were particularly linked to lower levels of science performance.
One aspect of our research design important to note is that all our motivation and engagement measures were based on students’ self-report. A great deal of prior research has shown this to be a valid approach to assessment (see Liem and Martin, 2012 for
review), but there is now a need to expand assessment of these factors by drawing on latest developments in emerging fields of psychology. Indeed, a major project along these lines funded by the Australian Research Council in partnership with The Future Project is in progress. In this project, researchers harness latest developments in technology to explore (a) psycho-physiological (via biometrics) and neuro-psychological (via electroencephalography; EEG) correlates of students’ science motivation, engagement, and achievement. There is growing evidence that psycho-physiology and neuro-psychology can inform and supplement educational practice (e.g., Brookman, 2016) and we seek to examine this in relation to science motivation, engagement, and achievement.
CONCLUSION
Motivation and engagement are vital elements of students’ experience of and achievement at school. The present study demonstrated that science is no exception, with distinct aspects of science motivation and engagement significantly associated with their enjoyment of and performance in science. These findings provide direction for specific motivation and engagement factors that might be targeted in efforts to enhance science outcomes through school and beyond.
ACKNOWLEDGEMENTS
This research was supported in part by the Australian Research Council (Linkage Projects) and The Future Project (and its Consortium of Partners: The King’s School, Aegros Biopharma, Quantal Bioscience, Sangui Bio and Joan Lloyd Consulting).
Figure 1. Motivation and Engagement Wheel (reproduced with permission from www.lifelongachievement.com).
REFERENCES
Australian Academy of Science (2006) Mathematics and statistics: Critical skills for Australia's future. Melbourne, Australia: Australian Academy of Science.
Brookman, A. (2016) Learning from educational neuroscience. The Psychologist , 29: 766-769. Committee for a National Science Communications Strategy (2010) Inspiring Australia: A national strategy for engagement with the sciences . Canberra: CNSCS.
Green, J., Martin, A.J., and Marsh, H.W. (2007) Motivation and engagement in english, mathematics and science high school subjects: Towards an understanding of multidimensional domain specificity. Learning and Individual Differences , 17: 269-279.
Liem, G.A. and Martin, A.J. (2012) The Motivation and Engagement Scale: Theoretical framework, psychometric properties, and applied yields. Australian Psychologist , 47: 3-13.
Martin, A.J. (2007) Examining a multidimensional model of student motivation and engagement using a construct validation approach. British Journal of Educational Psychology , 77: 413-440.
Martin, A.J. (2015) The Motivation and Engagement Scale . Sydney, Australia: Lifelong Achievement Group. Retrieved from: www. lifelongachievement.com.
Martin, R., Urbach, D., Hudson, R. and Zoumboulis, S. (2009) Progressive Achievement Tests in Science . Melbourne: Australian Council for Educational Research.
Office of the Chief Scientist (2012) Health of Australian Science . Canberra: Australian Government.
Office of the Chief Scientist (2014) Benchmarking Australian Science, Technology, Engineering, and Mathematics . Canberra: Australian Government.




REGULAR BLOOD TESTING CAN PREDICT FUTURE RISK OF
CHRONIC DISEASE AND LIFESPAN
1,
1The Future Project ; 2Sangui Bio
ABSTRACT
There are a number of reasons why people want to understand changes in their health, in particular their risk of developing chronic diseases. This risk is closely linked to their long-term inflammatory status, which is becoming more widely understood as a health marker. For example, there is over $1 trillion spent each year on personalised nutrition and wellness products, that are often marketed as anti-inflammatory. However, consumers often don’t have access to scientifically validated measures of how nutrition and wellness products or lifestyle choices, such as exercise, affect their health.
INTRODUCTION
Inflammation is a crucial process in wound healing, regeneration and immune function. The average concentration of inflammatory proteins in blood over months to years is now accepted as a strong predictor of disease development and lifespan. Blood is the most tested tissue in medicine because analysis can inform doctors about a patient’s general health, immune system function and the health of organs such as the liver and kidneys. A significant drawback of conventional blood testing is that patients are tested infrequently, usually when they are unwell, which provides little information on their normal levels of inflammatory proteins over time. In addition, in-hospital and conventional pathology laboratory testing are expensive and require the patients to travel to a blood collection centre.
Sangui Bio is developing technology to enable people to regularly sample their blood at home using finger pricks and dried blood spots. Using this system people will obtain medically relevant information on their inflammatory markers and how those change over time in response to various lifestyle choices. A significant advantage of at-home sampling with dried blood spots is enabling more frequent testing, which will provide time-series data so that trends in markers can be observed and correlated with lifestyle changes.
The Sangui Bio Future Project team have tested various dried blood spot collection devices and assessed a range of storage and protein extraction conditions. The goal of this project was to develop protocols that enable people to take dried blood spot samples at-home and for an analysis lab to obtain the same quality of information as they would at a hospital or conventional pathology lab. The results reported in this study were obtained from commercially available dried blood spot kits made by Neoteryx (Torrance, CA).
This is because it is difficult and costly to obtain regular health checks via the conventional medical system. The in-home blood sampling methods that Sangui Bio are developing will enable the analysis of multiple blood samples over time to track customers’ inflammatory status and see the effect of any changes in diet, exercise, supplements and lifestyle.
This project aimed to assess the stability of inflammatory proteins within dried blood spots, which will be a key aspect of their usefulness in any large-scale studies. The experiments in this project were designed to investigate the effects of light, temperature and humidity on the stability of dried blood spots. The stability of dried blood spots were evaluated by measuring the concentration of two proteins that are involved in inflammation, C-reactive protein (CRP) and Interleukin 8 (IL-8). CRP is produced by the liver and rises in concentration when there is chronic or acute inflammation, such as cardiovascular disease or infection. It is one of a group of proteins called acute phase reactants, that are released in response to inflammation. IL-8 is one of the major mediators of the inflammatory response. It is secreted by several immune cell types and functions as an attractant that brings other immune cells to the site of inflammation.
METHOD
BLOOD DONATION
Blood collection was approved by the Northern Sydney Coast Human Research Ethics Committee of NSLHD and CCLHD (1201–046 M) and was carried out in accordance with the relevant guidelines and regulations. Written informed consent was collected from all participants before participation in this study.
NEOTERYX DRIED BLOOD SPOT DEVICE PREPARATION AND STORAGE
Whole blood was collected from four individuals in vacutainers containing EDTA and mixed gently. 30 µL aliquots were then spotted onto the base of a multichannel reservoir. Individual Neoteryx tips were touched to the whole blood spots until the entire tip was filled.
Isabelle Alley
Alanna Bindschedler1, Daniel Monteiro1, Nick Pierides1, Cameron Hill2, Elisabeth Karsten2 and Ben Herbert2
Figure 1. Concentration of CRP in whole blood dried in Neoteryx tips dried for 24 hours then stored using the standard method (room temperature humidity controlled), stored in direct sunlight with no temperature control (Non-controlled light and temperature), stored in a completely unregulated environment (Non-controlled environment) and at high temperature and high humidity (37 oC high humidity). There were no statistically significant differences.
The devices were dried for 24 hours and then stored under one of four conditions:
1. Sealed in low humidity conditions at room temperature
2. Sealed in low huvvmidity at uncontrolled temperature and light
3. Sealed in low humidity with uncontrolled temperature/light and exposed to the elements
4. Unsealed in high humidity at constant 37 oC.
After two weeks storage, the tips were removed from the plastic stems and placed into 1.5 mL Eppendorf tubes. These were then extracted by adding 60 µL of extraction solution (0.05 % Tween in PBS) and incubation at room temperature. After incubation the extraction solutions containing the tips were centrifuged 5 times at 10000 g for 30 seconds to increase fluid movement through the tips. The Neoteryx tips were then removed from the extraction solution and placed in a Bio-Rad column insert and centrifuged at 2500 g for 5 minutes with the flow through recombined with the extraction solution.
ISOLATION OF BLOOD COMPONENTS
Blood samples were collected in a vacutainer containing EDTA anticoagulant. Samples of whole blood were aliquoted into labelled Eppendorf tubes. Plasma was isolated from the whole blood by centrifugation (1500 g, 10 mins). After collection of the plasma, the remaining cell pellets were resuspended in sodium chloride solution (NaCl, 0.15 M) at a 1:1 ratio. Subsequently, a solution of dextran (6 %w/v) was added to the cell suspension at a 1:4 ratio which was then left to stand upright for 30 minutes at room temperature to enable the red blood cells (RBCs) to settle to the bottom of the tube. Following incubation, the upper, white blood cell rich fraction was discarded and the lower RBC rich layer was isolated and washed once in PBS (500 g, 5 minutes). Following isolation of the individual fractions, 30 µL of each component was spotted onto the bottom of a multichannel reservoir and then absorbed into individual Neoteryx tips. These were dried for 4 hours prior to extraction using the standard method.
IL-8 AND CRP ELISA
The concentration of IL-8 and MIF in the prepared plasma samples was determined using an IL-8 ELISA (Abcam) and a CRP ELISA (elisakit) according to the manufacturer's instructions. The absorbance was determined using a spectrophotometer and the standard curves for the assays were produced using the kit standards. Analysis of the data was performed using Microsoft Excel and the concentration of IL-8 and MIF in the plasma samples was determined by extrapolating from the prepared standard curves.
STATISTICAL ANALYSIS
Significant differences between groups were determined using a paired, two-way Students T-test. These analyses were performed on Microsoft Excel. Values were statistically significant if p < 0.05.
RESULTS
EFFECT OF STORAGE CONDITIONS ON CRP AND IL-8 IN DBS
The first experiment performed on dried blood spots in Neoteryx devices compared the CRP concentration after one week of room temperature storage to the CRP level from fresh blood. The Neoteryx devices were stored in plastic zip-lock bags in two groups, one with desiccant pouches to control humidity and one without desiccant. The effect of humidity control was very significant (p 0.02), with the recovery from desiccated samples being 105 % of the control fresh blood and the recovery from nondesiccated samples being 47 % (data not shown).
The second experiment introduced the additional variables of temperature and light exposure to the storage conditions. In this experiment the concentration of CRP was not significantly changed (p > 0.05) in Neoteryx dried blood devices stored under different environmental conditions (see Figure 1). Although none of the storage conditions produced significant changes, the standard deviation and the average concentration of CRP concentration increased in the non-controlled temperature and light samples and the non-controlled environment samples. The concentration of IL-8 also did not significantly change with the different storage
conditions, however, unlike CRP, the standard deviation did not increase in the non-controlled conditions (see Figure 2). In contrast analysis of the separated components of whole blood, dried for only 4 hours instead of 24 hours showed a very large increase in IL-8 in whole blood (see Figure 3).
DISCUSSION
The stability of dried blood spots in Neoteryx devices and particularly the key proteins such as CRP needs to be understood before they can be used in any large-scale studies. The experiments detailed in this study were designed to investigate the effects of light, temperature and humidity on the concentration of two particular analytes, C-reactive protein (CRP) and Interleukin 8 (IL-8).
Analysis of CRP concentration showed that humidity was the key storage condition that must be controlled. No significant changes in CRP or IL-8 were detected with any of the other storage conditions, however, there is valuable information that can be obtained by looking at the average concentration and standard deviation. The 37 oC high-humidity was expected to be the worst storage condition and in this experiment it did return the lowest average CRP concentration but the standard deviation was quite
small. This seems to indicate that under high temperature and high humidity there was degradation of CRP probably because enzymes that degrade the sample were able to remain active under these conditions.
In contrast, the samples for the non-controlled light, temperature and environmental conditions showed an average increase in CRP concentration but also had a much higher standard deviation than either the room temperature or the 37 oC high humidity conditions. This indicates that as the temperature and other environmental conditions change, so does the variability of the CRP concentration. These two results together indicate that the Neoteryx devices should not only be protected from extremes in temperature and humidity, they also require controlled conditions to produce consistent results.
The average IL-8concentration changed very little with changes in storage conditions. Again none of the conditions had a statistically significant effect on the concentration of IL-8, however, in general it is apparent that the room temperature, low humidity samples had the highest average IL-8 concentration. In contrast to the CRP results, it appears that the non-controlled conditions do not increase the standard deviation of the IL-8 concentration.
Dried blood spot device IL-8 concentrations of different whole blood components Non-controlled environment
Figure 2. Concentration of IL-8 in whole blood dried in Neoteryx tips dried for 24 hours then stored using the standard method (Room temperature humidity controlled), stored in direct sunlight with no temperature control (Non-controlled light and temperature), stored in a completely unregulated environment (Non-controlled environment) and at high temperature and high humidity (37 oC high humidity). There were no statistically significant differences.
Dried blood spot device IL-8 concentrations under different storage conditions
Figure 3.
Concentration of IL-8 in the plasma fraction (Plasma), plasma diluted 1:1 in PBS (Plasma+PBS), red blood cells in plasma (RBC +plasma), red blood cells in PBS (RBC+PBS) and whole blood (Whole blood). The IL-8 concentration in whole blood dried for only 4 hours was 32 times higher than any individual component (p-value < 0.01).
Analysis of the whole blood and its components, when dried in a Neoteryx tip for only 4 hours, produced some very interesting and potentially problematic results. The IL-8 concentration in isolated plasma; diluted plasma (plasma+PBS); red blood cells and plasma recombined (RBC+plasma) and red blood cells alone (RBC+PBS) all showed low levels of IL-8. In contrast, whole blood contained an average of 1643 mg/mL of IL-8, which was 32 times higher than any of the isolated components. Considering the only different aspect of the whole blood compared to all the separate components is the presence of white blood cells, it can be assumed that a significant number of white blood cells survived the shorter 4 hour drying time. White blood cells are the only component of blood that is capable of synthesising new proteins and secreting them into the surrounding solution. Once these cells were placed into the extraction solution these stressed but viable white blood cells produced high quantities of IL-8.
These results highlight the need to prevent white blood cell activity during the dried blood spot collection. This may be achieved by:
• fractionate whole blood prior to drying to remove white blood cells
• ensuring drying time is consistent and rapid – between 20 and 30 oC with low humidity
• store the dried blood spots in low humidity conditions
• the use of a white blood cell inhibitor to prevent protein synthesis
CONCLUSION
This study aimed to examine the effects of different storage conditions on the concentration of CRP and IL-8. CRP concentration was shown to be slightly reduced under high temperature and significantly reduced in high humidity conditions. In addition, variation in the storage conditions showed a decrease in consistency of results. Therefore, it can be concluded that conditions need to be controlled and high temperature/high humidity conditions should be avoided for consistent recovery and measurement of CRP. IL-8 concentrations were relatively unaffected with storage conditions, however, drying time appears to be extremely important and needs to be at least 24 hours long.
REFERENCES
Karsten, E. (2016) Red blood cells: the immune system's hidden regulator. PhD Thesis , University of Sydney.
Marie, C., Fitting, C., Muret, J., Payen, D. and Cavaillon, J.M. (2000) Interleukin 8 Production in Whole Blood Assays. Cytokine: 12(1): 55-61.
THE EFFECT OF ELECTRODE DISTANCE ON PROTEIN SEPARATION IN TANGENTIAL FLOW ELECTROPHORESIS
Andre Fisher1, Justin Kam1, Ethan Tang1, Ante Jerkovic1, Vera Munro-Smith1, Kailing Wang2, Hari Nair2
1The Future Project; 2Aegros Biopharma
ABSTRACT
This study aimed to determine the most effective electrode distance in protein separation in tangential flow membrane electrophoresis. Protein separation was conducted using the MiniFlow, a separation device that works on the basis of tangential flow electrophoresis. The unique feature of the MiniFlow is that the electrode distance is adjustable, allowing for protein separation to be tested at different electrode distances.
Proteins in human plasma can be extracted and used as lifesaving medicines. However, the extraction process is complicated and costly, making it unaffordable in developing countries. To combat this issue, Aegros Biopharma have developed an efficient separation technology by using size and charge to isolate the target therapeutic proteins. The MiniFlow, which is a laboratoryscale instrument of the industrial-scale separation unit, was used to study how to improve the separation process efficiency.
INTRODUCTION
Plasma fractionation is a process which separates proteins found in human plasma. These can then be developed into plasma therapeutics for the treatment of patients (Hosseini and Ghasemzadeh, 2016). The conventional plasma fractionation process, the Cohn Method, is used to separate the main therapeutic proteins into five “fractions”. However, this process is very complicated and expensive (Burnouf, 2012).
Tangential flow electrophoresis is a newly emerging technology that separates proteins through membranes by the application of an electric field. By exposing proteins to a buffer with a specific pH, the innate charge of specific target proteins can be adjusted (i.e., they can be given a positive or negative charge). When an electric field is applied, the proteins will be separated according to their charge (National Diagnostics, n.d.). Simultaneously, membranes with specific pore size can separate proteins by size (Evtushenko, et.al ., 2005).
The MiniFlow is a prototype device based on the process of tangential flow electrophoresis. The main component of the instrument, the membrane cartridges, consists of three membranes and two separation plates which can separate proteins by size and/or charge simultaneously. A distinct feature of the MiniFlow is that the distance between the two electrodes is adjustable. As a result, the MiniFlow can be used to determine the optimal electrode distance in which protein purification is most efficient.
The separated proteins were then quantitatively compared to establish which distance was most efficient. It was concluded that there is a direct correlation between electrode distance and protein transfer; as the electrode distance is decreased, protein transfer increased.
METHOD
BUFFER PREPARATION
Tris-Borate (TB) buffer of pH 8.9 was used for Bovine Serum Albumin (BSA) separation. To prepare the TB buffer, 260 g of TrisBase and 56 g of boric acid were weighed into a beaker. 1.5 L of purified water was added and placed on a magnetic stirrer with flee until dissolved. The final buffer volume was brought to 2 L with milliQ water and measured with a pH meter (to 8.9). This buffer was diluted to 1 in 10 times for use in BSA separation.
BSA SEPARATION BY MINIFLOW
The BSA separation was run at 3 different electrode distances twice in the MiniFlow (15 mm, 28 mm and 44.8 mm). Once the electrode distance was set, 25 mL of the TB buffer was poured into both the inner and outer vessels and a leak test was conducted to ensure membrane quality. The sample pump was set at a flow rate of 29.7 mL/min. 25 mL of protein and TB buffer was poured into the inner and outer stream vessels respectively. The buffer and sample temperatures, volumes and current were recorded (at time = 0). The sample and buffer pump were then turned on for 30 minutes at 200 Volts (V). The buffer temperature was controlled at 7 oC with a flow rate of 200 mL/min. Once 30 minutes had elapsed, the buffer temperature, current and volumes were recorded. After each run was conducted, a rinse of 150 mL of water was run through the experiment for 3 minutes.
Simultaneously, 500 µL of each sample stream was collected at the beginning and end of the experiment (i.e., at time = 0 and 30 minutes).
BRADFORD ASSAY
The Bradford Assay is a method used to determine protein quantity.
Initially, the standard BSA curve was made by diluting a 0.25 gL-1 stock solution down to 0.0156 gL-1. TB buffer was used as the background absorbance in the standard curve. The
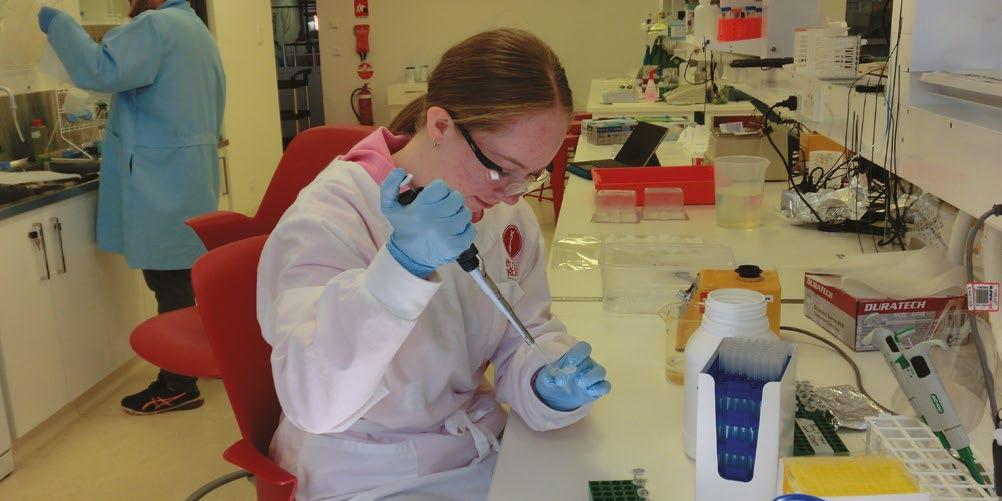
protein samples were diluted to 1:100. 10 µL of each dilution was transferred to a 96-well plate in triplicate. 290 µL of Bradford reagent was added to each well with a 12-channel pipette. The 96-well plate was incubated at room temperature for 5 minutes.
The plate was placed into the Bio-Rad Multi-Well Plate Reader at an absorbance of 595 nm and the absorbance values were used to calculate the concentration of the samples.
SODIUM DODECYL SULFATE POLYACRYLAMIDE GEL
ELECTROPHORESIS (SDS PAGE)
SDS PAGE is a method used to separate proteins through polyacrylamide gel. According to the Bradford Assay, the highest protein sample concentration was 20 µg/µL.
Samples were diluted to a quarter to attain a concentration of 5 µg/µL, increasing accuracy. 4 µL of the 5 µg/µL samples were added to obtain a final loading of 20 µg of protein in each lane, making it suitable for SDS PAGE. The gel was then run for 50 minutes at 180 V, then removed from their cassettes and scanned in the Bio-Rad Gel Doc. The gels were then stained with Coomassie Blue Stain and de-stained over a 2-day period.
RESULTS
As shown in Figure 1, the 15 mm electrode distance had the highest protein transfer of 67.16 %, reducing to 61.46 % and then 60.12 % in the 28 mm and 44.8 mm distances, respectively. Therefore, closer electrode distances produced greater protein transfer rate.
Figure 2 displays the protein purity of samples collected from the original sample of protein at 0 minutes, the proteins transferred at 30 minutes and the proteins that have not been transferred at 30 minutes. The results show a clear increase in intensity in the proteins transferred at 30 minutes as the electrode distance decreases. As expected, the intensity of the original samples at 0 minutes are all the same.
Results in Figure 3 display the temperature increase of the inner and outer streams which had a starting temperature of 15 °C. There was a temperature increase in the outer collection stream and a decrease in the inner stream after the 30 minute run. As the electrode distances got shorter, there was an increase in temperature.
Figure 4 displays consistent volume transfer between each run of the experiment. All 6 runs started with 25 mL in the inner streams and ended with 25 mL in the outer streams, whilst also ending up with an average loss of 8.3 mL in the outer stream and an average gain of 5.92 mL in the inner stream.
DISCUSSION
It was hypothesised that as the distance between the electrodes decreased, the protein transfer efficiency would increase (generated by a stronger electric field between the electrodes). Higher protein transfer did occur as the electrode distance decreased (see Figure 1). This was further supported by the SDS PAGE gel in Figure 2, where the intensity of the transferred proteins was reduced as the electrode distance increased. This was due to an increase in electric field strength as the electrode distance decreased, indicating that there was a greater pull on the protein (see Figure 1).
The higher temperature of the outer collection stream indicated that the positive electrode generated more heat during the 30 minute run, potentially due to the pulling effect it has on the negatively charged proteins. The heat radiating from the outer electrode was transferred to the outer collection stream and the further the distance between the electrodes, the lower the temperature. Figure 3 shows a clear correlation between temperature and distance. The high temperatures associated with closer distances between electrodes were problematic as they denature the proteins. The solution to this overheating problem is to implement a more efficient cooling system to manage and control the temperature increase. Consistent volumes were used throughout the experiment, meaning that there were no leaks in the MiniFlow device and that the electrode distance had no effect on the volumes (see Figure 4).
CONCLUSION
The important finding from this study was that shorter electrode distances were the most efficient configuration for protein separation in tangential membrane electrophoresis. It is anticipated that if these findings are adopted in the large-scale design, the product yield and process efficiency will be increased, therefore, the manufacturing cost could be reduced, making these life-saving drugs more affordable to developing nations.
ACKNOWLEDGEMENTS
Thank you to the Aegros Biopharma team for the guidance and assistance during this project, specifically Dr Ante Jerkovic and Dr Kailing Wang. Thanks also goes out to The King’s School for hosting The Future Project as well as The King’s School staff for organising this opportunity.
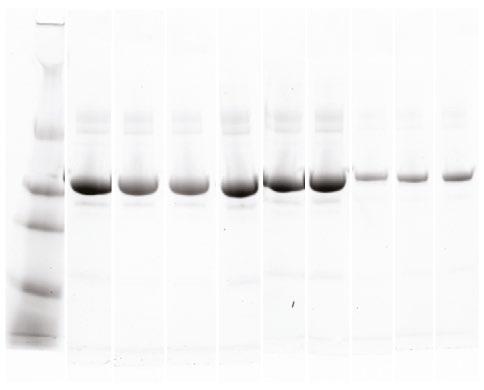
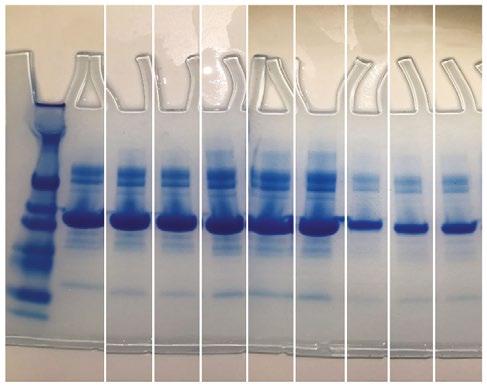
Figure 2. SDS PAGE Gels of proteins from the MiniFlow experiments showing (a) a gel scan using GelDoc UV at 280 nm and (b) Coomassie stained gel.
Figure 1. Average protein transfer (%) at different electrode distances during the 30 minute MiniFlow experiments at 200 V (n=2, error bars +/- standard deviation).
3. Volume changes during the 30 minute MiniFlow experiments at different electrode distances and at 200 V (n=2, error bars are +/- standard deviation).
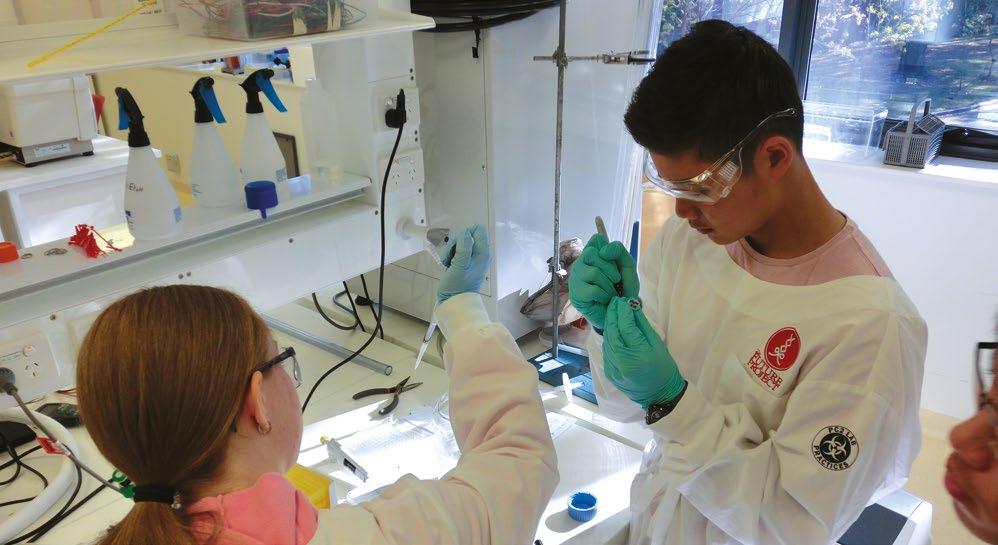
REFERENCES
Marketing Research Bureau (2018) History of Plasma Fractionation . Retrieved from: http://marketingresearchbureau.com/plasma-industry/ history-of-plasma-fractionation/.
Burnouf, T. (2012) Plasma Fractionation. ISBT Science Sieries , 7: 62-67.
National Diagnostics (n.d.) The Mechanical and Electrical Dynamics of Gel Electrophoresis . Retrieved from: https://www. nationaldiagnostics.com/electrophoresis/article/mechanical-and-electrical-dynamics-gel-electrophoresis-intro-and-sample.
Ophardt, C. E. (2003) Denaturation of proteins . Retrieved from: http://chemistry.elmhurst.edu/vchembook/568denaturation.html. Evtushenko, E., Wang, K., Stokes, H. W. and Nair, H. (2005) Blood Protein Purification and Simultaneous Removal of Non-enveloped Viruses Using Tangential-flow Preparative Electrophoresis. Electrophoresis , 26: 28-34. Wikipedia (n.d.) Albumin . Retrieved from: https://en.wikipedia.org/wiki/Albumin. Hosseini, M. K. and Ghasemzadeh, M. (2016) Implementation of Plasma Fractionation in Biological Medicines Production. Iranian Journal of Biotechnology , 14(4): 213-220.
Electrode distance (mm)
Figure
Outer stream (Collection)
Inner stream (Sample)
THE EFFECTS OF KOSMOTROPIC AND CHAOTROPIC SALTS ON THE GROWTH OF XEROPHILIC FUNGI
DERIVED FROM HORSE SUPPLEMENTS
Charlene Jee
1,
Darcy Thompson
1,
Sabina
1The Future Project; 2Quantal Bioscience
Mangat1, Vera Munro-Smith1, Emma Winley2 and Belinda Chapman2
ABSTRACT
It has been acknowledged that xerophiles have the potential to grow at low water activity using sugar-based medium. However, there is a significant lack of literature in their ability to grow at equally low water activities using salt-based medium. Previous work has failed to address the effect of both chaotropic and kosmotropic salts in comparison with one another on the presence and growth of xerophilic fungi as well as their role in the structure of agar.
INTRODUCTION
There has been extensive research conducted utilising sugarbased media to understand the growth of xerophiles in dry environments, however, salts have not been commonly pursued in this area of study. Salts of sodium, magnesium and calcium are common ingredients of equine feed, hence it is necessary to study the growth of xerophiles in environments containing high aqueous concentrations of these salts.
The aim of this investigation was to improve the understanding of the nature of xerophile growth in conditions of high salt concentrations, the relationship between salt concentration and fungal growth and the effect of chao – and kosmotropicity of salts on xerophilic growth.
Xerophiles are yeasts and moulds that have the capability to grow at 0.85 to 0.62 water activity (Beuchat and Hocking, 1990). Such water activity is considered relatively low, giving xerophiles the common name ‘dry loving’ fungi, which have been found and linked to spoilages within equine feed in various countries (Magnoli et al. , 2009). If quality assurance is inadequate during the production of equine feed, it could enable these microorganisms to thrive in the dry environment of equine feed and supplements. By investigating this matter, improved instructions could be provided to horse owners to ensure that horse supplements are appropriately stored.
A selection of commercial equine supplements are to be sampled and tested for the presence of xerophilic fungi and grown in standard laboratory conditions and observed. A change in the growth media might either hasten or delay their growth. Different agar spread plates were to be utilised including sugar-based and salt-based media. Varying concentrations of different chaotropic
Fungi were selected from a positive source of xerophiles in horse supplements and was monitored on chaotropic and kosmotropic salt-based mediums of differing concentrations. In comparison with the control sugar-based agar, it was found that the fungi were more suited to growth on salt-based medium of higher concentrations due to its lower water activity. Through this investigation the understanding of the nature of xerophilic growth on salt-based medium, as well as the methodology in preparing such medium has been widened greatly, which ultimately widens the scope for research using salts in growing fungi as well as the safe storage and handling of horse supplements.
salts (water displacing agents) and kosmotropic salts (water ordering agents) were to be used to compare the presence and growth rates of xerophilic fungi. The salts were chosen based on their physical and chemical properties and predicted interaction with both the agar and the growth of xerophilic fungi. These salts included sodium chloride, magnesium sulfate and calcium chloride with chao – and kosmotropic activities of 11.0 (chao), 64.5 (chao) and 92.2 (kosmo), respectively (Cray et al. , 2012).
METHOD AND MATERIALS
INITIAL ISOLATION OF XEROPHILIC FUNGI
Samples were taken from two horse supplements (YS1 and YS2), diluted and spread plated on MY50G (malt extract yeast extract glucose 50 %), MY70G (malt extract yeast extract glucose 70 %) and DG18 (dichloran 18 % glycerol agar) plates. A second isolation and serial dilution was also done on MY50G. Plates were incubated at 28 ℃ before observing the growth 1 week later.
Water activities were taken using a water activity meter in a controlled environment of 25 °C. All media were tested for water activity to determine that they were made to the expected water activity reading.
SUBCULTURING OF XEROPHILIC FUNGI
From the initial isolation plates, two colony morphologies were selected for comparative growth studies. These were selected by colour and are known as the yellow isolate and the orange isolate. Samples were taken using sterile inoculation loops to isolate onto MEA, MY50G and 3 salt based agars at 2 different concentrations. The salt agars were made from malt extract agar (MEA) consisting
of 20 g malt extract, 20 g dextrose, 6 g peptone, 15 g agar and 1 litre of distilled water. To the MEA base calcium chloride, sodium chloride or magnesium sulfate was added at concentrations of 4 % or 8 %. All were autoclaved at 121 °C for 25 minutes. MEA and MY50G were used as controls media.
The water activity of each media was measured and recorded, as well as the water activity of the horse supplements.
After subculturing and incubation, the diameters of fungal growths were measured and recorded, as well as a general profiling of the fungal growths measured according to colour.
RESULTS
INITIAL ISOLATION OF XEROPHILIC FUNGI
Colony counts of the initial MY50G plates were taken after one week of incubation for both isolations and are averaged in Table 1. The water activity for each of the supplements can also be found in Table 1. Table 2 displays the theoretical water activities, aw, of the xerophile isolation media compared to that measured with the water activity meter.
SUBCULTURING OF XEROPHILIC FUNGI
The water activity of the various salt media prepared can be found in Table 3. The extent of colony growth from a single inoculation point for both xerophilic isolates can be seen in Figure 1 and 2. Both isolates preferred growth on the MY50G agar with the water activity of 0.91. Neither of the isolates grew on the MEA agar that had a water activity of 0.99, suggesting that both of the isolates are obligate xerophiles. The images in Figures 3-8 were taken after 20 days of incubation at 28 oC.
DISCUSSION
According to this investigation, the presence of xerophilic fungi in the sampled horse supplements has been confirmed and their growth has been observed. As seen in Table 1, the horse supplement YS1 had more colony forming units than the YS2.
1: Colony forming units per gram of horse supplements where aw: water activity.
2: Water activity, aw, values for the media used for xerophile isolation.
(0.50 a w) 3X10² CFU/G 1.1X10³ CFU/G 7X10² CFU/G YS2 (0.47 a w) 7X10² CFU/G 1.1X10³ CFU/G 9X10² CFU/G
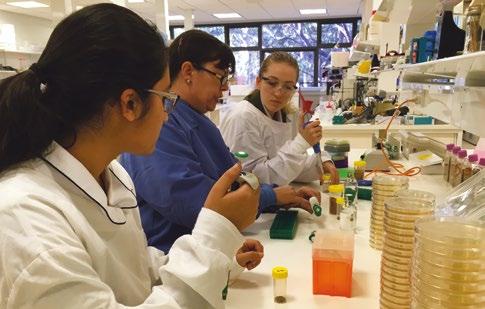
Figure 1: Growth of yellow xerophilic isolate as a measurement of colony diameter.
Table
Table
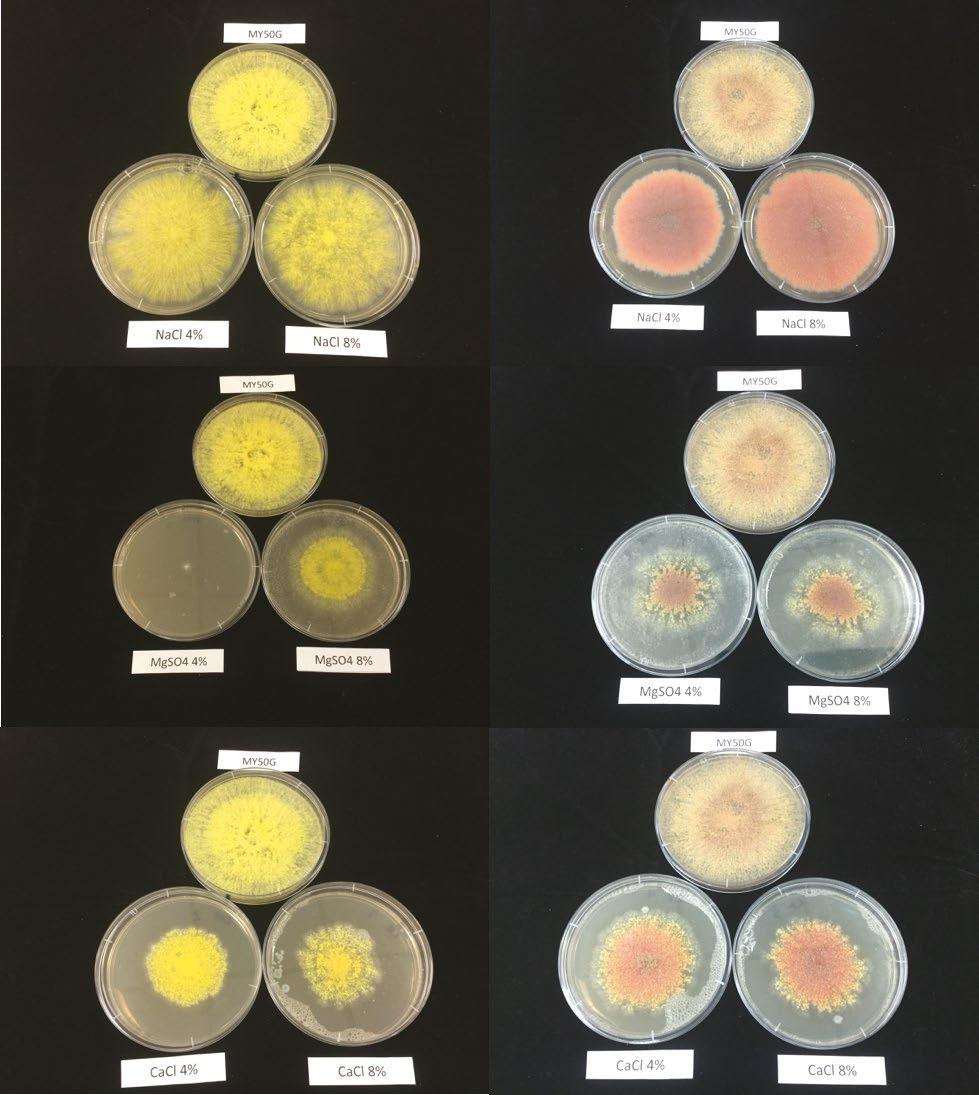
Figure 3: Yellow (left) and orange (right) xerophilic fungi isolates growing on MY50G (control, at the top of each set of three plates) and 4 % (left in each set of three plates) or 8 % (right in each set of three plates) NaCl (top row), MgSO4 (middle row) or CaCl2 (bottom row).
It is postulated that this may have occurred due to differences in the mineral composition of the two supplements seen in Table 4.
Water activity is the measure of water available to microorganisms and is measured on a scale of 0 to 1. The machine that is used to measure this is known as the water activity meter. The recorded water activity measurements for the different agars varied greatly. The wide variation of values received from the water activity measurements of the same samples requires further investigation into the functioning of the water activity meter. It is therefore recommended to repeat the measurements of water activities for all samples with a tailored water activity meter protocol.
In comparing fungal growth on different salt-based medium, a preference for growth on NaCl agar by the two fungal isolates species was observed (see Figures 1 – 3). However, both fungal isolates grew substantially more on the MY50G control, which had a significantly lower water activity than that of the saltbased medium. This low water activity could not be achieved using salts, as the medium structure was lost in the presence of high salt concentrations > 8 %. If a salt-based medium of a similarly low water activity could be produced it is recommended to repeat the investigation using such medium in order to provide more conclusive results about the nature of xerophilic growth in saline environments. Additionally, repetitions and more intensive monitoring of xerophilic fungal growth on the salt-based medium are also recommended in order to gain a more definitive correlation between the chaotropic and kosmotropic nature of salts and their effect on fungal growth.
CONCLUSION
From the results it can be concluded that for the most part, xerophilic fungi are more suited to growth in xerophilic environments rich in NaCl compared with either MgSO4 - or CaCl2based medium at the same % concentration.
ACKNOWLEDGEMENTS
We would like to acknowledge the efforts put in by our researchers, Dr Belinda Chapman and Ms Emma Winley, as well the coordinator of The Future Project, Dr Vera Munro-Smith. With their dedication and mentorship, we have come to accomplish a full investigation on the presence and growth of xerophiles in horse supplements. Our gratitude extends towards Mr John E. Hallsworth, as well, because of the support that he has provided us through the access of his research papers. We would also like to thank The King’s School for providing us with the resources and equipment for our investigation.
Figure 2: Growth of yellow xerophilic isolate as a measurement of colony diameter.
Table 3: Water activity of MEA media with different salt concentrations.
Table 4: Mineral composition of horse supplements with confirmed xerophilic presence.
REFERENCES
Beuchat, L. R. and Hocking, A. D. (1990) Some Considerations When Analyzing Foods for the Presence of Xerophilic Fungi. Journal of Food Protection, 53(11): 984-989. Retrieved from: http://jfoodprotection. org/doi/pdf/10.4315/0362-028X-53.11.984?code=fopr-site. DG-18 (DICHLORAN GLYCEROL) AGAR (n.d.) Retrieved from: https://catalog.hardydiagnostics.com/cp_prod/Content/hugo/ DG18Agar.html.
Gock, M. A., Hocking, A. D., Pitt, J. I. and Poulos, P. G. (2003) Influence of temperature, water activity and pH on growth of some xerophilic fungi. International Journal of Food Microbiology, 81(1): 11-19.
Magnoli C.E., Cavaglieri L.R., da Rocha Rosa C.A. and Dalcero A.M. (2009) Mycotoxigenic Fungi and Mycotoxins in Animal Feed in South American Countries. In: Rai M., Varma A. (eds) Mycotoxins in Food, Feed and Bioweapons. Springer, Berlin, Heidelberg.
Part of the strength of science is that it has tended to attract individuals who love knowledge and the creation of it... Thus, it is the communication process which is at the core of the vitality and integrity of science.
Phillip Abelson
JUNIOR COMMUNICATORS
Matt Purser, TFP Project Leader (Science Communication)
There can be no doubt that The Future Project has continued to attract students who have a powerful curiosity about the world around them?

It is striking to think that most of the students who enter the Intern Strand of The Future Project are introduced to areas of inquiry well beyond their ken, and yet they readily embrace the challenge in order to advance scientific understanding, along with their own in these areas. This is also true of the students in the Communication Strand of The Future Project. The thirst to develop new knowledge and skills across a range of scientific fields continues to drive innovation and excellence in this program.
The recipient of the Australian of the Year award this year is Dr Michelle Simmons, a pioneer in the field of quantum computing. Aside from her daunting intellect and formidable technical skills, she is also a passionate and eloquent advocate for Australian science. This comes at a time when many research teams struggle for support, and indeed a voice, across the country.
Quantum computing and other recent advancements such as genetic engineering, nanotechnology and artificial intelligence, all have the potential to radically reshape the
world in which we live. As these technologies come to the fore, it is vital that we have people in our community such as Dr Simmons to facilitate discussion in our communities regarding these technologies, their use and their possible impacts.
In the Communication Strand of The Future Project we hope to satisfy some of the curiosity that our Year 10 participants have about the world. But just as importantly, we hope to develop the skills of effective communication about what they have discovered in the domains of public demonstrations, live theatre, poster design and documentary-style films.
Early in the year, the students were involved in the development and performance of various demonstrations for a show called ‘Thinking Science’. This year, the demonstrations included an investigation into the behaviour of objects when cooled with liquid nitrogen and how ping pong balls can be suspended in the air above hair dryers. Other demonstrations examined the microscopic world, electrostatic electricity, the ever-popular ‘air cannon’ and ‘water bottle rockets’.
‘Thinking Science’ was designed for a target audience of primary school students. To this end, the students used a visible learning scaffold to develop their demonstrations, namely “I See” (what do I observe?), “I Think” (how can I explain what I observe?) and “I Wonder” (how could I learn more about this phenomena?). This scaffold would be used to guide the thought process of the audience, to mimic how a real scientist might think as they experience each demonstration.
In May, Year 4 students of Parramatta East Public School and Year 5 students from The King’s School came to the Science Centre to take part in the ‘Thinking Science’ shows.
It was wonderful to see the faces of wonder and delight on these students, who could not help but indulge their own curiosity with lots of curly questions. While the Year 10 boys were left in little doubt that the primary school students had enjoyed themselves, it is also hoped that the participants came away from the demonstrations having learnt a scientific principle or two. And who knows, perhaps the curiosity of some of these students was stoked in a way that might have inspired them to pursue their own future careers in Science!
Also in May, The Future Project Communicators were able to spend time with James Bradley, the ‘Writer-in-Residence’ at The King’s School. James is an Australian science fiction writer, and the acclaimed author of books such as ‘Clade’ and ‘The Silent Invasion’. During workshops with James, the students were able to gain valuable insight into the construction of fictional stories that are drawn from current and future areas of scientific research.
Our society needs people who can communicate scientific understanding in ways that the general public can engage with.
The second major task for our Communication students was to design posters for National Science Week, held in August. This year’s theme was ‘Game Changers and Change Makers’, which explored current innovative areas of research in science and engineering. The students started by researching some information in one of these key areas. They were then guided to use this information to develop an informative and engaging poster design.
The final versions of the posters showed information about key innovations such as the incoming 5G wireless network, the use of artificial intelligence in pest control, tiny robots that can be swallowed inside tablets to perform surgery and of course quantum computing! The best posters were put on display for the community to view throughout Terms 3 and 4 in the atrium of The King’s School’s Science Centre. During National Science Week, ‘Perform! Education’ came to The King’s School for students to watch the performance of ‘STEMania’. This fun, engaging and interactive live show showed how STEM principles could be applied to a variety of everyday situations. The Future Project Communicators had the opportunity to watch this show and then analyse the different aspects of the performance that made it such an effective example of science communication.
Over the course of the year, the students in The Future Project’s Intern strand have been collaborating with the research partners of The Future Project to do authentic and innovative research in the Science Centre’s purpose-built biochemistry laboratory. This research has been drawn from a diverse range of areas, such as looking for genetic markers associated with antibiotics in horse manure, investigating how to improve the efficiency of the transfer of proteins across synthetic membrane, and the detection of proteins in dried blood spots to help create a system for the early detection and treatment of disease. In the final session of the
year, the Communication students were asked to produce a series of short documentaries showcasing this research. To help explain the significance of this research to a lay audience, the students filmed the interns at work in the Science Centre and then interviewed them about the details of their research. This footage was then edited by the students along with other elements such as music, banners and titles. It is hoped that these films can be used to raise awareness and understanding of the science behind this research. This content can be viewed using The Future Project website: www.thefutureproject.com.
Our society needs people who can communicate scientific understanding in ways that the general public can engage with. All of the students involved in The Future Project Communication team have enjoyed the opportunity to learn more about scientific principles while honing their communication skills in demonstrations, print and digital media in an authentic way. It is hoped that the work of these students inspires greater understanding and curiosity in our wider community.
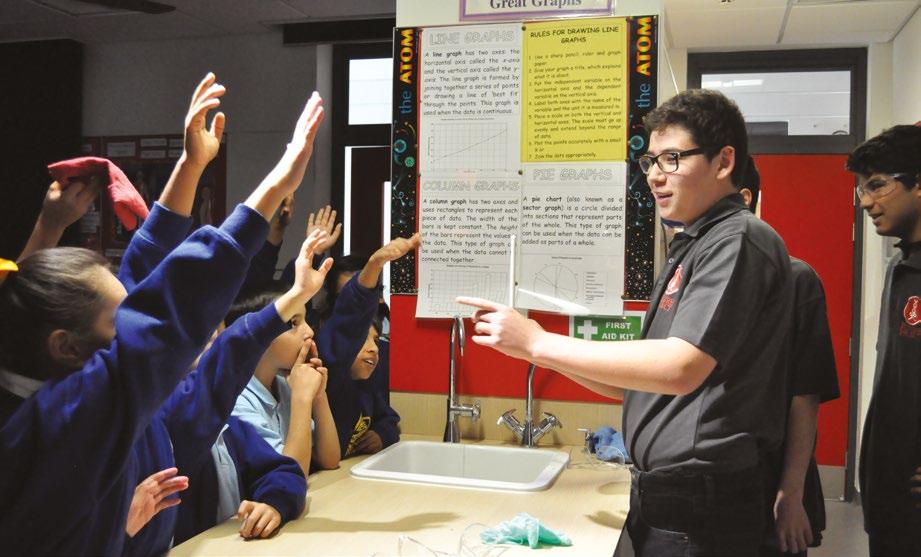




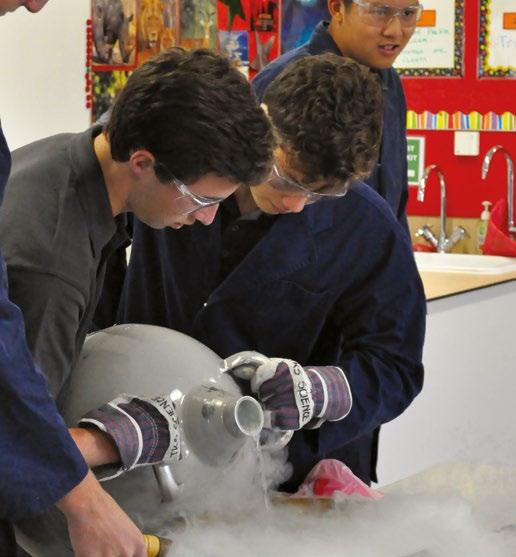
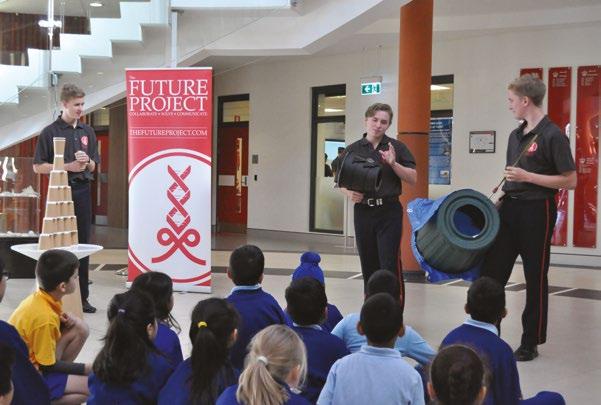
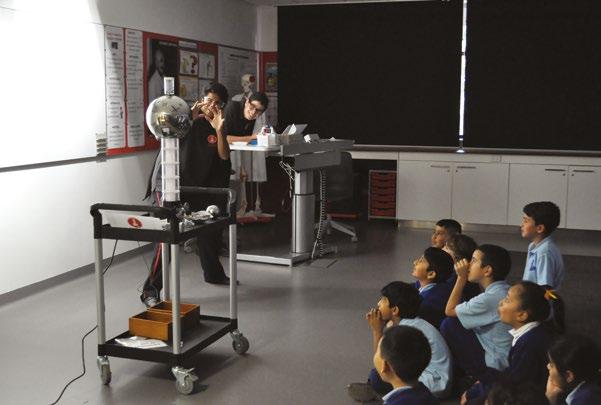



JUNIOR INTERNS
Jack Verman (Junior Intern 2018)
The Future Project Interns are immensely grateful for the opportunity to work with scientists with such a vast wealth of knowledge, on a project which reflects real life applications.
The Future Project (TFP) Interns are immensely grateful for the opportunity to work with scientists with such a vast wealth of knowledge on a project that reflects real life applications.
One of The Future Project partners, Quantal Bioscience, is working on developing innovative solutions and novel products using applied microbiology. They offer collaborative research consulting, science management and specialty testing services. They also work with public sector research organisations and with schools such as The King’s School. The TFP Junior Interns had the opportunity to work with the company’s distinguished scientists, Dr. Belinda Chapman, Director of Quantal Bioscience and Dr. Michelle Bull, Senior Research Microbiologist. Both Dr. Chapman and Dr. Michelle Bull have more than 20 years’ experience working across the food and health sectors.
The in-depth microbiology program which we experienced was interesting and innovative. Coming to class not knowing what we were about to discover growing on our agar plates made class time exciting. Filling in our lab books as we progressed through the course over a span of five weeks, left us with an information packed book, and recounts of all of the subtopics we studied during the course. We learnt many microbiology plating techniques, in conjunction with learning to understand how bacteria thrive in different environments. Personally, I never thought I would do work at this level, with scientists who have devoted the majority of their life to what we were learning, right there in The Science Centre.
Throughout the program, we developed highly useful skills which we will be able to apply in our daily school life, assisting us in our further studies which we will now be able to complete at a higher level. Just a few of the skills include: critical thinking, group collaboration, adapting to new problems, effective oral and written communication as well as analysing complicated information.
The Junior Interns were also fortunate enough to have another of The Future Project partners, Dr. Joan Lloyd, present her research. Dr. Lloyd has a Master’s Degree in Veterinary Pathology from the University of Sydney as well as a Doctor of Veterinary Medicine from the University of Saskatchewan. She has also been awarded a PhD in Veterinary Immunology by the University of Sydney.
Dr Joan Lloyd spoke to us about our responsibility to ensure that all livestock need to be cared for in our agriculture sector. Joan Lloyd Consulting has a reputation for providing well thought out veterinary science support to the Australian livestock industries. Through her informative presentations and practicals which we completed, we all gained a better understanding of the importance of biology, its impact in agriculture and how we can minimise the risks associated with livestock brutality and harm.
Under Dr. Joan Lloyd’s guidance, we conducted several experiments, one of which was extracting the DNA from beef mince. By doing this we were able to isolate the tiniest fragments of the beef and analyse meat in its most natural form. Not only was working with Dr. Joan Lloyd in itself interesting, but it was also involved a topic of science which we had never properly thought about, despite its large cultural significance in Australia.
On behalf of The Future Project Interns, I would like to convey that each and every one of us is grateful for the opportunity provided by The Future Project and The King’s School. The Junior Interns were guided by Mr Ryan Barnett. His charismatic and enthusiastic approach appealed to the group. We are also immensely thankful for the efforts of The Future Project partners – Dr. Belinda Chapman, Dr. Michelle Bull and Dr. Joan Lloyd – who put in their valuable time and energy to help us learn outside of our comfort zones, in such a great learning environment.



“Throughout the program, we developed highly useful skills which we will be able to apply in our daily school life”
PARTNERSHIP
Senior Interns visit to the Advanced Materials Characterisation Facility, Western Sydney University
During the second school holiday research block this year, The Future Project Senior Interns visited the Advanced Materials Characterisation Facility (AMCF) at the Parramatta South Campus of Western Sydney University. This AMCF Facility is world class and is used by a diverse range of clients including university researchers and companies.
The AMCF has a wide variety of state-of-the-art scientific instruments for material and biological characterisation, including Scanning Electron Microscopes (SEM), X-ray Diffractometer (XRD), Digital Nanoscope and Vibrational Spectroscopy (FTIR and Raman).
The Future Project Senior Interns not only got to see the facilities but were fortunate to actually use the instruments, including:
• SEM JEOL 7001F (FEGSEM and EDS microanalysis)
• SEM JEOL 6510 LV (Low Vacuum with EDS microanalysis)
• Phemon SEM
The students were able to see and capture images of a number of different types of samples, such as a butterfly, spider, wheat, a fly, leaves and pollen under powerful magnification.
Not only were the Senior Interns provided with this opportunity by Western Sydney University, but also researchers from The Future Project industry partners –Aegros Biopharma and Quantal Bioscience.
Dr Matthew Kolibac from Aegros Biopharma was able to see highly magnified images of the materials that they use in their Electro-Cyl instrument (a protein separation device), while Quantal Bioscience captured images of micro-organisms of interest to their research, including yeast and E. coli.
Dr Ric Wuhrer, Research Manager of the facilities, shared his deep knowledge of the instruments, including SEM principles and sample preparation, and discussed various projects that he and the team have worked on. Dr Laurel George, Senior Technical Officer, as well as researchers and Masters and PhD students presented talks on their research work and real world applications of the instruments.
In sharing their experiences and research work, the members of the AMCF team were truly inspirational and the Senior Interns learnt about potential study and career paths. This opportunity to further extend the experiences and skills for The Future Project Senior Interns and industry partners was valuable and made possible by the collaboration with Western Sydney University.
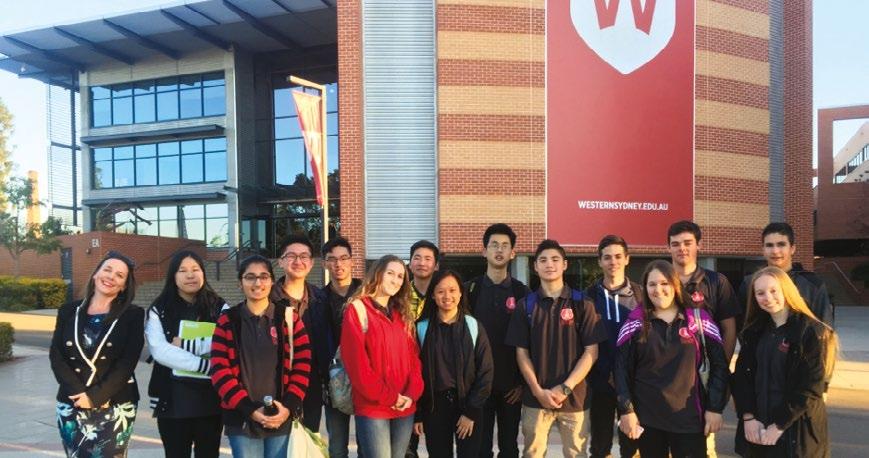
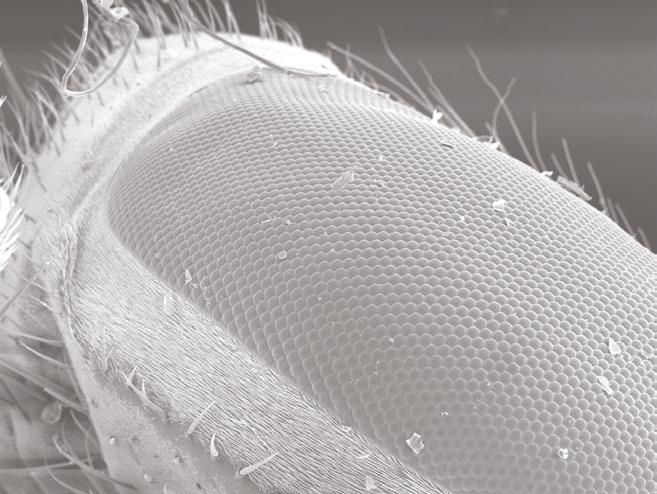
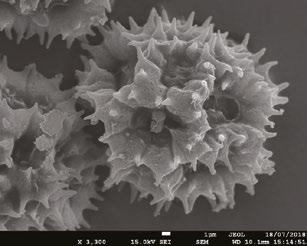
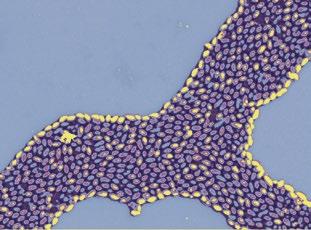
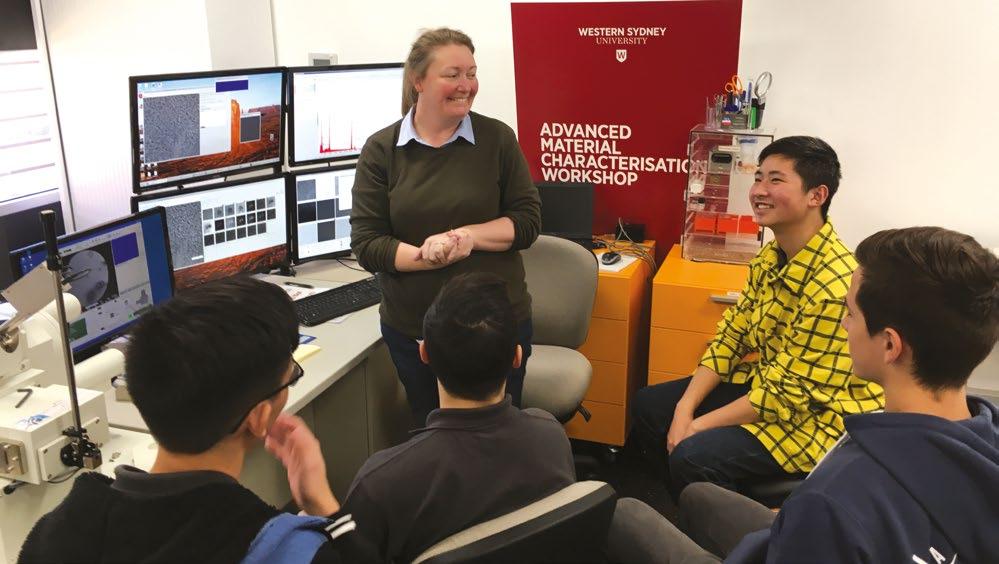
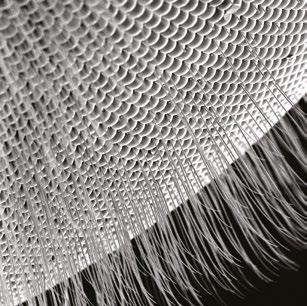
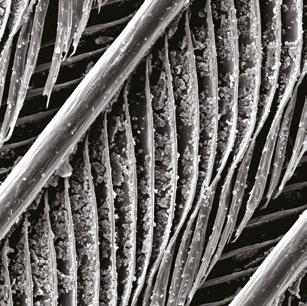
ACKNOWLEDGEMENTS
The Future Project is a collaboration of a number of different schools, industry partners and tertiary education providers. Simply, without them the project is not possible.
We would like to acknowledge the time and effort that the staff of the collaborating organisations have given to fostering excellence in science education. We thank them for being role models for the next generation of scientists.
Thank you to the staff of The King’s School who have assisted in a number of different ways, from mentoring the students, to assisting with the TFP Open Night, the Graduation & Awards Ceremony, organising school visits, presentations at assemblies and assisting with editing.
We extend our thanks to all of the collaborating teachers from the participating schools and members of their executive teams for supporting their students and encouraging them to pursue their interests and passion for science.
We thank the Advanced Materials Characterisation Facility team and Western Sydney University, in particular Dr Ric Wuhrer and Dr Laurel George, for making the visit to their facility possible.
COLLABORATING ORGANISATIONS
• Aegros Biopharma
• Quantal Bioscience
• Joan Lloyd Veterinary Science Consultancy
• Sangui Bio
• University of NSW
• Western Sydney University
• The King’s School
COLLABORATING SCHOOLS 2018
• Baulkham Hills High School
• Cherrybrook Technology High School
• Cumberland High School
• Mount St Benedict College
• The King’s School
CREDITS
Director of The Future Project
Dr V Munro-Smith
Project Leaders
R. Kennett, M Purser, R Barnett, Dr A Diskin
Editor Dr V Munro-Smith
ADDRESS
The King’s School
87-129 Pennant Hills Road North Parramatta NSW 2151
WEBSITE
www.thefutureproject.com
