Exploring Marine Hydrokinetics

Student Guide


SECONDARY 2022-2023
Exploring Marine Hydrokinetics was originally developed by The NEED Project with funding from the National Renewable Energy Laboratory and the U.S. Department of Energy, Water Power Technology Office. NEED would also like to acknowledge Mr. Walter Schurtenberger of Hydrokinetic Energy Corporation and The College of the Florida Keys for his technical advisement and support in the creation of this unit. NEED is grateful to its Teacher Advisory Board team and staff members for designing this unit:


Nina Corley
Shannon Donovan
Robert Griegoliet
Christine Lauer
Paula Miller
Doug Keaton
Tom Spencer
2 ©2023 The NEED Project Exploring Marine Hydrokinetics www.NEED.org
What Is Energy?
We all use the word energy daily. We have energy drinks, we pay our energy bills, and politicians discuss energy policy almost daily. However, what energy actually is can be a difficult concept to explain precisely. Our bodies and objects all around us are using energy all the time. Energy allows us to do work, and to affect change. It provides the ability to do what we need to do, whether we can visibly see what is happening or on a microscopic level. Energy exists in two basic forms. Stored energy to use later is called potential energy, while energy in motion is called kinetic energy. Each of these two, broad categories can be broken down further into nine different forms of energy.
One type of potential energy is gravitational potential energy (GPE), which is energy stored by position. A child at the top of a slide or water behind a dam both have gravitational energy. Elastic energy is potential energy that is stored by applying a force. When you wind up a toy car, you are storing energy in the spring inside of it. If you pull back on a rubber band, you are storing elastic energy in it. Nuclear energy is the potential energy within the nucleus of atoms. Very small changes in the nucleus of an atom can release tremendous amounts of energy. The most commonly used form of potential energy is chemical energy. It is the energy in the bonds between atoms of all the substances in the world. The food you eat, the fuel in the car you drive, the wood your campfire burns are all examples of chemical energy.
Kinetic energy – energy in motion - can be broken down into five forms. When large-scale things are moving, they have motion or mechanical energy. A child on a bike, water moving through a stream, and the wind all have motion energy. Thermal energy is the energy that allows atoms and molecules to move around. The more thermal energy in a substance, the faster the molecules move, and the higher its temperature. Sound energy is a form of energy that we often overlook – because a sound is a vibration, it is an energy form. Radiant energy is energy that moves through space in transverse waves. Sunlight and radio waves are examples of radiant energy, as are microwaves and x-rays. Electrical energy is the energy of moving electrons. Electricity is the most common example of electrical energy, but small static electricity jolts and lightning strikes are also examples of electrical energy.
Conservation of Energy
Conservation of energy is not just saving energy. The Law of Conservation of Energy says that energy is neither created nor destroyed. When we use energy, it doesn’t disappear. We simply change it from one form of energy into another. A car engine burns gasoline, converting the chemical energy in gasoline into motion energy. Solar cells change radiant energy into electrical energy. Energy changes form, but the total amount of energy in the universe stays the same.
Potential and Kinetic Energy
Kinetic Energy Potential Energy
HILL


Energy Transformations Energy Transformations
Energy Efficiency
Energy efficiency is the amount of useful energy you get from a system compared to the energy input. A perfect, energy-efficient machine would change all the energy put in it into useful work— an impossible dream. Converting one form of energy into another form always involves a loss of usable energy, often as waste heat.
Most energy transformations are not very efficient. The human body is a good example. Your body is like a machine, and the fuel for your machine is food. Food gives you the energy to move, breathe, and think. Your body is very inefficient at converting food into useful work. Most energy in your body is released as wasted heat.
©2023 The NEED Project Exploring Marine Hydrokinetics www.NEED.org 3
Chemical Motion Radiant Chemical
Chemical Motion Electrical Heat
Energy Sources
We use many energy sources to meet our needs. All of them have advantages and disadvantages—limitation or reliability of supply, and economic, environmental, or societal impacts. Energy sources are usually classified into two groups—renewable and nonrenewable.
In the United States, most of our energy comes from nonrenewable energy sources. Coal, natural gas, propane, petroleum, and uranium are nonrenewable energy sources. They are used to generate electricity, heat homes, move vehicles, and manufacture all kinds of products from candy bars to computers. They are called nonrenewable because their supplies are limited, and they cannot be replenished in a short period of time.
Petroleum, for example, was formed hundreds of millions of years ago, before dinosaurs lived, from the remains of ancient sea plants and animals. We could run out of economically recoverable nonrenewable resources someday.
Renewable energy sources include biomass, geothermal, hydropower, solar, and wind. They are called renewable because they are replenished in a short time, almost as quickly as they are used. Day after day the sun shines, the wind blows, and the rivers flow. We use renewable energy sources mainly to make electricity.
U.S. Energy Consumption by Source, 2020
NONRENEWABLE, 87.50%
Petroleum 34.73%


Uses: transportation, manufacturing - Includes Propane
RENEWABLE, 12.48%
Biomass 4.88%
Uses: electricity, heating, transportation
Natural Gas 33.99%
Uses: electricity, heating, manufacturing - Includes Propane
Coal 9.89% Uses: electricity, manufacturing
Wind 3.24% Uses: electricity
Hydropower 2.79%
Uses: electricity
Uranium 8.89% Uses: electricity Propane Uses: heating, manufacturing
*Propane consumption gures are reported as part of petroleum and natural gas totals.

Solar 1.34% Uses: electricity, heating
Geothermal 0.23% Uses: electricity, heating
Data: Energy Information Administration **Total does not equal 100% due to independent rounding.


Energy Sources and Electricity

In the United States, nine of the ten energy sources are regularly used to generate electricity; the only source that is not commonly used for electricity generation is propane. Natural gas is the leading source for electricity, followed by uranium and coal. Wind and hydropower are the leading renewable energy sources for electricity generation.


Petroleum 0.44%

*Total does not equal 100% due to independent rounding.
Data: Energy Information Administration
Other: purchased steam, tire-derived fuels, electricity used for storage, etc.
The most common way to generate electricity is by using thermal energy to boil water into pressurized steam that can turn a turbine. Turbines change linear motion into rotational motion; in this case, the linear movement of the steam is changed to a rotation to turn a generator. The generator houses large magnets and coils of copper wire. The turbine blades spin the generator, moving either the coils of wire or the magnets relative to the other.
This produces an electric current. Wind and hydropower use a flowing fluid, air or water respectively, to turn the turbine. Because no thermal energy is lost, wind and water are more efficient sources of energy for generating electricity.
4 ©2023 The NEED Project Exploring Marine Hydrokinetics www.NEED.org
RENEWABLE
Natura Hydropower Geothermal Biomass
NONRENEWABLE U.S. Electricity Net Generation, 2020 40.33%
2.27%
Uranium 19.70% 8.42%
7.13% 0.42% 1.40%
Electricity
Electricity is different from primary energy sources like petroleum or wind—it is a secondary energy source. That means we must use another energy source to produce electricity. Electricity is sometimes called an energy carrier because it is an efficient and safe way to move energy from one place to another, and it can be used for so many tasks. Since electricity is used for many tasks in our daily lives, it is needed and produced in large quantities each day.
A Mysterious Force
What exactly is the mysterious force we call electricity? It is moving electrons. And what are electrons? They are tiny particles found in atoms. Everything in the universe is made of atoms—every star, every tree, every animal. The human body is made of atoms. Air and water are, too. Atoms are the building blocks of the universe. Atoms are so small that millions of them would fit on the head of a pin.
Atomic Structure
Atoms are made of smaller particles. The center of an atom is called the nucleus. It is made of particles called protons, which carry a positive (+) charge, and neutrons, which carry no charge. Protons and neutrons are approximately the same size. The mass of a single proton is 1.67 x 10⁻²⁴ gram. Nuclear energy is contained within the nucleus, because a strong nuclear force holds the protons and neutrons together.
Protons and neutrons are very small, but electrons are much smaller—1,835 times smaller, to be precise. Electrons carry a negative (-) charge and move around the nucleus in orbits a relatively great distance from the nucleus. If the nucleus were the size of a tennis ball, the diameter of the atom with its electrons would be several kilometers.
If you could see an atom, it might look a little like a tiny center of spheres surrounded by giant invisible clouds (or energy levels). Electrons are found in these energy levels and are held there by an electrical force. The protons and electrons of an atom are attracted to each other. They both carry an electrical charge. The positive charge of the protons is equal to the negative charge of the electrons. Opposite charges attract each other. When an atom is in balance, it has an equal number of protons and electrons. The number of neutrons can vary.
Elements
An element is a substance in which all of the atoms have the same number of protons. The number of protons is given by an element’s atomic number, which identifies elements. A stable atom of hydrogen, for example, has one proton and one electron, with almost always no neutrons. A stable atom of carbon has six protons, six electrons, and typically six neutrons. The atomic mass of an element is the combined mass of all the particles in one atom of the element.

Atom
PROTON NEUTRON
NUCLEUS ELECTRON
Carbon Atom
Carbon Atom
A carbon atom has six protons and six neutrons in the nucleus, two electrons in the inner energy level, and four electrons in the outer energy level.
OUTER E N E R GY LEVEL
INNER E N E R GY LEVEL
NUCLEUS

PROTONS (+) ELECTRONS (–)
NEUTRONS
©2023 The NEED Project Exploring Marine Hydrokinetics www.NEED.org 5
Electrons
The electrons usually remain a constant distance from the nucleus in energy levels. The level closest to the nucleus can hold two electrons. The next level can hold up to eight. Additional levels can hold more than eight electrons. The electrons in the levels closest to the nucleus have a strong force of attraction to the protons. Sometimes, the electrons in the outermost level—the valence energy level—do not. In this case, these electrons— valence electrons—easily leave their energy levels. Other times, there is a strong attraction between valence electrons and the protons. Often, extra electrons from outside the atom are attracted and enter the valence energy level. When the arrangement of electrons changes in these ways, energy is gained or transformed. We call this energy from electrons electrical energy. Applying a force can make the electrons move from one atom to another.
Electrical Energy
The positive and negative charges within atoms and matter usually arrange themselves so that there is a neutral balance. However, sometimes there can be a buildup of charges creating more negative than positive charges, or more positive charges than negative charges. This imbalance produces an electric charge. Unlike electric current where electrons are moving, these electrons don’t move until there is another object for them to move to. This is called static electricity. When the charges become too unbalanced there is a discharge of electrical energy between positively and negatively charged areas. This is what causes lightning to jump from cloud to cloud, or between a cloud and the ground.
Magnets
In most objects, the molecules that make up the substance have atoms with electrons that spin in random directions. They are scattered evenly throughout the object. Magnets are different— they are made of atoms that have north- and south-seeking poles. The atoms in a magnet are arranged so that most of the northseeking poles point in one direction and most of the south-seeking poles point in the other.
Spinning electrons create small magnetic fields and act like microscopic magnets or micro-magnets. In most objects, the electrons located around the nucleus of the atoms spin in random directions throughout the object. This means the micro-magnets all point in random directions cancelling out their magnetic fields. Magnets are different—most of the atoms’ electrons spin in the same direction, which means the north- and south-seeking poles of the micro-magnets they create are aligned. Each micromagnet works together to give the magnet itself a north- and south-seeking pole.
Bar Magnet
Like Poles
Like poles of magnets (N-N or S-S) repel each other.
Opposite Poles
Opposite poles of magnets (N-S) attract each other.
A magnetic field can produce electricity. In fact, magnetism and electricity are really two inseparable aspects of one phenomenon called electromagnetism . A changing magnetic field can produce electricity. Every time there is a change in an electric field, a magnetic field is produced. This relationship is used to produce electricity. Some metals, such as copper, have electrons that are loosely held. They can be pushed from their valence energy levels by the application of a magnetic field. If a coil of copper wire is moved around a changing magnetic field, or if magnets are moved around a coil of copper wire, an electric current is generated in the wire.
Electric current can also be used to produce magnets. Around every current-carrying wire is a magnetic field, created by the uniform motion of electrons in the wire. Magnets used to produce electric current are called electromagnets.
6 ©2023 The NEED Project Exploring Marine Hydrokinetics www.NEED.org
Generating Electricity
When it comes to the production of electricity, it’s all turbines and generators. A turbine is a device that converts the flow of a medium such as air, steam, or water into motion energy to power a generator. A generator is an engine that converts motion energy into electrical energy using electromagnetism.
An electric generator is actually an electric motor that runs backward. Work is done to cause magnets to spin within coils of wire to produce electricity. Depending on the generator’s design, work can also cause the wires to move. When the wire moves through the external magnetic field, electrons in the wire are pulled and move through the wire. These electrons can be directed out of the generator as electricity.
Although electric motors and generators may seem complicated, the principle of electromagnetism is simple. When electricity moves through a wire, a magnetic field is created around the wire. In an electric motor, the motor’s wire is placed between external magnets. When electricity is sent through the wire, the magnetic field created around the wire interacts with the magnetic field of the external magnets. This interaction causes the wire to move. If the wire is designed so it is free to turn, the wire will spin and you have an electric motor.
Power plants use huge turbine generators to generate the electricity we use in our homes and businesses. Power plants can use many fuels to spin turbines. Coal, oil, biomass, and natural gas are burned to create steam to turn turbines. Nuclear power plants create steam from splitting atoms. Geothermal power plants harness steam from high pressure vents at the surface. Water-powered turbines, however, use already moving water and do not require heat.
Once the electricity is produced, it is moved to our homes and businesses. On land and under water, it moves through large electrical lines or cables. Electricity moves most efficiently under high voltage. When the electricity leaves a power plant, its voltage must be drastically increased. When it reaches our homes and businesses, the voltage must be reduced so it will not burn or damage things that use electricity. The voltage of electricity is
easily increased or decreased by a transformer. Transformers are commonly seen in our neighborhoods. Electrical substations are a series of transformers used to increase or decrease voltage. If you have an overhead electrical line that goes into your house, you will see a transformer on the pole where the overhead line leaves the larger power line. Usually, these overhead transformers are grey cylinders. They reduce the voltage so that the electricity can safely enter your house.
The Grid
Once electricity is produced, it is distributed to consumers through the electric grid. The grid consists of power generators, powerlines that transmit electricity, and the components that make it all work, including substations, meters, homes, and businesses.
In the United States, there are over 160,000 miles of high-voltage electric transmission lines. They take electricity produced at power plants to transformers that step up the voltage so that it can travel more efficiently along the grid. Before entering your home, another transformer steps down the voltage so that it can be used to operate your lights, appliances, and other electrical needs. One challenge facing renewable energy sources, including wind, is that the most efficient spots for producing electricity are often in secluded or rural areas, like offshore. Most traditional power plants are built near population centers and the fuel source is transported to the plant. This allows the electricity produced to be quickly and economically transmitted to consumers. In order to distribute the energy produced from some renewable sources, the electricity must travel farther distances. The longer the electricity has to travel the more transmission lines are needed and the more energy is lost (as heat) along the way.
To overcome the challenge of distributing electricity quickly and efficiently, not only for renewable energy sources, but also for nonrenewable sources, steps are being taken to upgrade the U.S. electricity grid to a “smart grid.” Using new technology the smart grid will help to save money, operate reliably, reduce its impact on the environment, and handle the growing power needs of today and tomorrow.
©2023 The NEED Project Exploring Marine Hydrokinetics www.NEED.org 7
*Graphic not to scale Power plant generates electricity Transformer steps up voltage for transmission Step-down transformer reduces voltage (substation) Transmission lines carry electricity long distances Neighborhood transformer on pole steps down voltage before entering house Distribution lines carry electricity to houses Transporting Electricity Power Tower Electric Poles
High-Voltage Transmission Lines
The Continental U.S. Electric Grid
Current
The flow of electrons can be compared to the flow of water. The water current is the number of molecules of water flowing past a fixed point; electric current (I) is the number of electrons flowing past a fixed point.

With electricity, conducting wires take the place of the pipe. As the cross-sectional area of the wire increases, so does the amount of electric current (number of electrons) that can flow through it. Current is measured in amperes (A).
Resistance
Data: Federal Emergency Management Agency
Measuring Electricity
We are familiar with terms such as watt, volt, and amp, but we do not always have a clear understanding of these terms. We buy a 13watt light bulb, a tool that requires 120 volts, or an appliance that uses 8.8 amps, but we typically don’t think about what those units mean.
Using the flow of water as an analogy can make electricity easier to understand. The flow of electrons in a circuit is similar to water flowing through a hose. If you could look into a hose at a given point, you would see a certain amount of water passing that point each second.
The amount of water depends on how much pressure is being applied—how hard the water is being pushed. It also depends on the diameter of the hose. The harder the pressure and the larger the diameter of the hose, the more water passes each second. The flow of electrons through a wire depends on the pressure pushing the electrons and on the cross-sectional area of the wire.
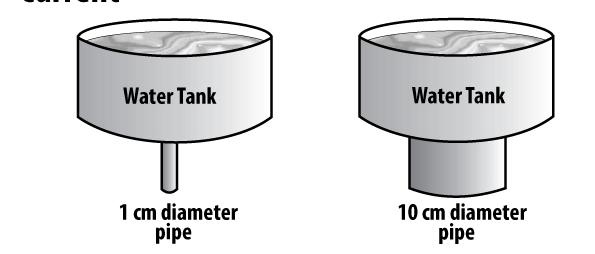
Voltage
The force or pressure that pushes electrons in a circuit is called voltage. Using the water analogy, if a tank of water were suspended one meter above the ground with a one-centimeter pipe coming out of the bottom, the water pressure would be similar to the force of a shower. If the same water tank were suspended 10 meters above the ground, the force of the water would be much greater, possibly enough to hurt you.
Voltage (V) is a measure of the pressure applied to electrons to make them move. It is a measure of the strength of the current in a circuit and is measured in volts (V). Just as the 10-meter tank applies greater pressure than the one-meter tank, a 10-volt power supply (such as a battery) would apply greater pressure than a one volt power supply.
AA batteries are 1.5 volt; they apply a small amount of voltage for lighting small flashlight bulbs.
A car usually has a 12-volt battery—it applies more voltage to push current through circuits to operate the radio or defroster. The standard voltage of wall outlets is 120 volts—a dangerous voltage. An electric clothes dryer is usually wired at 240 volts—a very dangerous voltage.
Resistance (R) is a force that opposes the movement of electrons, slowing their flow. Using the water analogy, resistance is anything that slows water flow, such as a smaller pipe or fins on the inside of a pipe. In electrical terms, the resistance of a conducting wire depends on the properties of the metal used to make the wire and the wire’s diameter. Copper, aluminum, and silver—metals used in conducting wires—have different resistance.
Resistance is measured in units called ohms (Ω). There are devices called resistors, with set resistances, that can be placed in circuits to reduce or control the current flow. Any device placed in a circuit to do work is called a load. The light bulb in a flashlight is a load. A television plugged into a wall outlet is also a load. Every load has resistance.
8 ©2023 The NEED Project Exploring Marine Hydrokinetics www.NEED.org
Water Tank 1 m Water Tank 10 m VoltageVoltage Current
Resistance Resistance
Water Tank
Water Tank
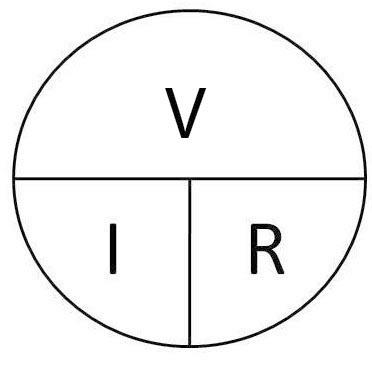
Ohm’s Law
Formulas for Measuring Electricity
The formula pie works for any three variable equation. Put your finger on the variable you want to solve for and the operation you need is revealed.
No Resistance Resistance
Ohm’s Law
The relationship between voltage, current, and resistance is defined in Ohm’s Law. George Ohm, a German physicist, discovered that in many materials, especially metals, the current is proportional to the voltage. He found that if he doubled the voltage, the current also doubled. If he reduced the voltage by half, the current dropped by half. The resistance of the material remained the same. This relationship is called Ohm’s Law and can be described using the formula to the right.
Electric Power
Power (P) is a measure of the rate of doing work or the rate at which energy is converted. Electric power is the rate at which electricity is produced or consumed. Using the water analogy, electric power is the combination of the water pressure (voltage) and the rate of flow (current) that results in the ability to do work.
A large pipe carries more water (current) than a small pipe. Water at a height of 10 meters has much greater force (voltage) than at a height of one meter. The power of water flowing through a one centimeter pipe from a height of one meter is much less than water through a 10-centimeter pipe from 10 meters.
Electric power is defined as the amount of electric current flowing due to an applied voltage. It is the amount of electricity required to start or operate a load for one second. Electric power is measured in watts (W).
Electrical Energy
Electrical energy introduces the concept of time to electric power. In the water analogy, it would be the amount of water falling through the pipe over a period of time. When we talk about using power over time, we are talking about using energy. Using our water example, we could look at how much work could be done by the water in the time that it takes for the tank to empty.
The electrical energy that a device consumes can be determined if you know how long (time) it consumes electric power at a specific rate (power). To find the amount of energy consumed, you multiply
the rate of energy consumption (watts) by the amount of time (hours) that it is being consumed. Electrical energy is measured in watt-hours (Wh).
energy (E) = power (P) x time (t)
E = P x t or E = W x h = Wh
Another way to think about power and energy is with an analogy to traveling. If a person travels in a car at a rate of 40 miles per hour (mph), to find the total distance traveled, one would multiply the rate of travel by the amount of time traveled at that rate. If a car travels for one hour at 40 miles per hour, it would travel 40 miles.
distance = 40 mph x 1 hour = 40 miles
If a car travels for three hours at 40 miles per hour, it would travel 120 miles.
distance = 40 mph x 3 hours = 120 miles

The distance traveled represents the work done by the car. When we look at power, we are talking about the rate that electrical energy is being produced or consumed. Energy is analogous to the distance traveled or the work done by the car.
A person wouldn’t say they took a 40-mile per hour trip because that is the rate. The person would say they took a 40-mile trip. We would describe the trip in terms of distance traveled, not rate traveled. The distance represents the amount of work done. The same applies with electrical energy. You would not say you used 100 watts of light energy to read a book, because a watt represents the rate you use energy, not the total energy used. The amount of energy used would be calculated by multiplying the rate by the amount of time you read.
©2023 The NEED Project Exploring Marine Hydrokinetics www.NEED.org 9
V =
I
R
Voltage = current x resistance
I x R or V = A x Ω
Current = voltage / resistance
= V / R or A = V / Ω
Resistance = voltage / current
= V / I or Ω = V / A
I
V = I x R
= V/R R = V/I
An Ocean Full of Energy
When you think of the United States, you may picture a map outlining the 50 states and their coastlines. However, the United States actually includes a huge area you can’t see. This area lies beneath the oceans off our coasts. We refer to the land and water off our coasts as being “offshore.”
Economically, the land and water surrounding our coastlines are very important to our nation. Most of the seafood we eat comes from the waters offshore. The submerged lands hold fossil fuels, such as petroleum and natural gas. More recently, renewable sources of energy are generating electricity offshore. All of these resources are important to the United States when considering the world’s increasing demand for energy. Marine renewables have the capacity to greatly increase U.S. renewable generation in the coming years with the continued research and deployment of hydrokinetic technologies.
Marine Energy Power Potential
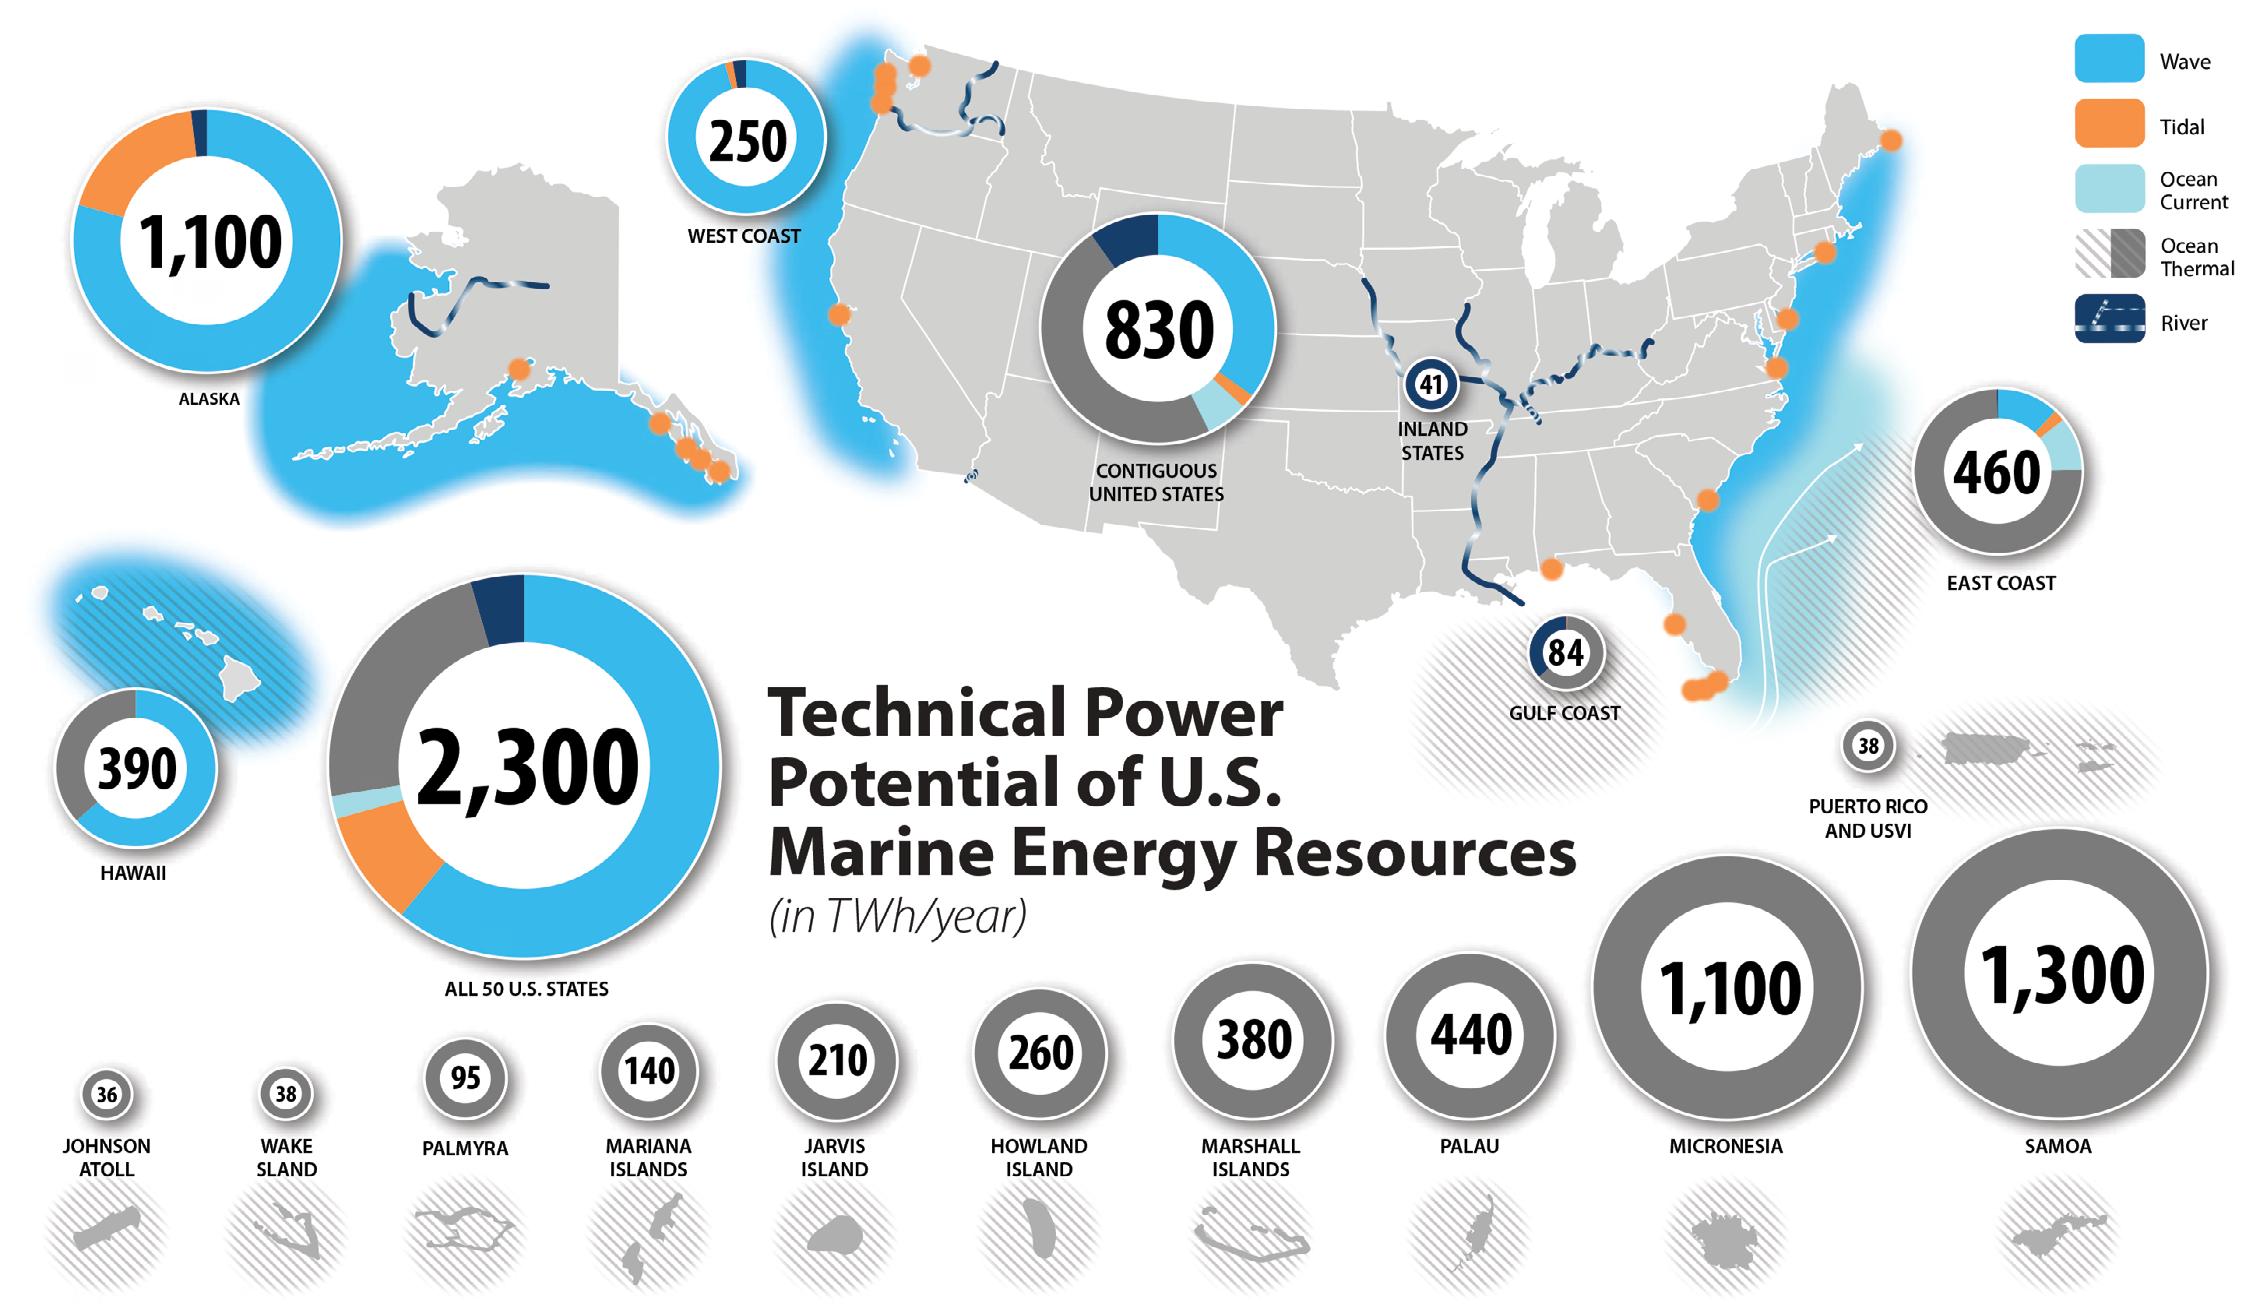 Source: NREL
Marine Hydrokinetics
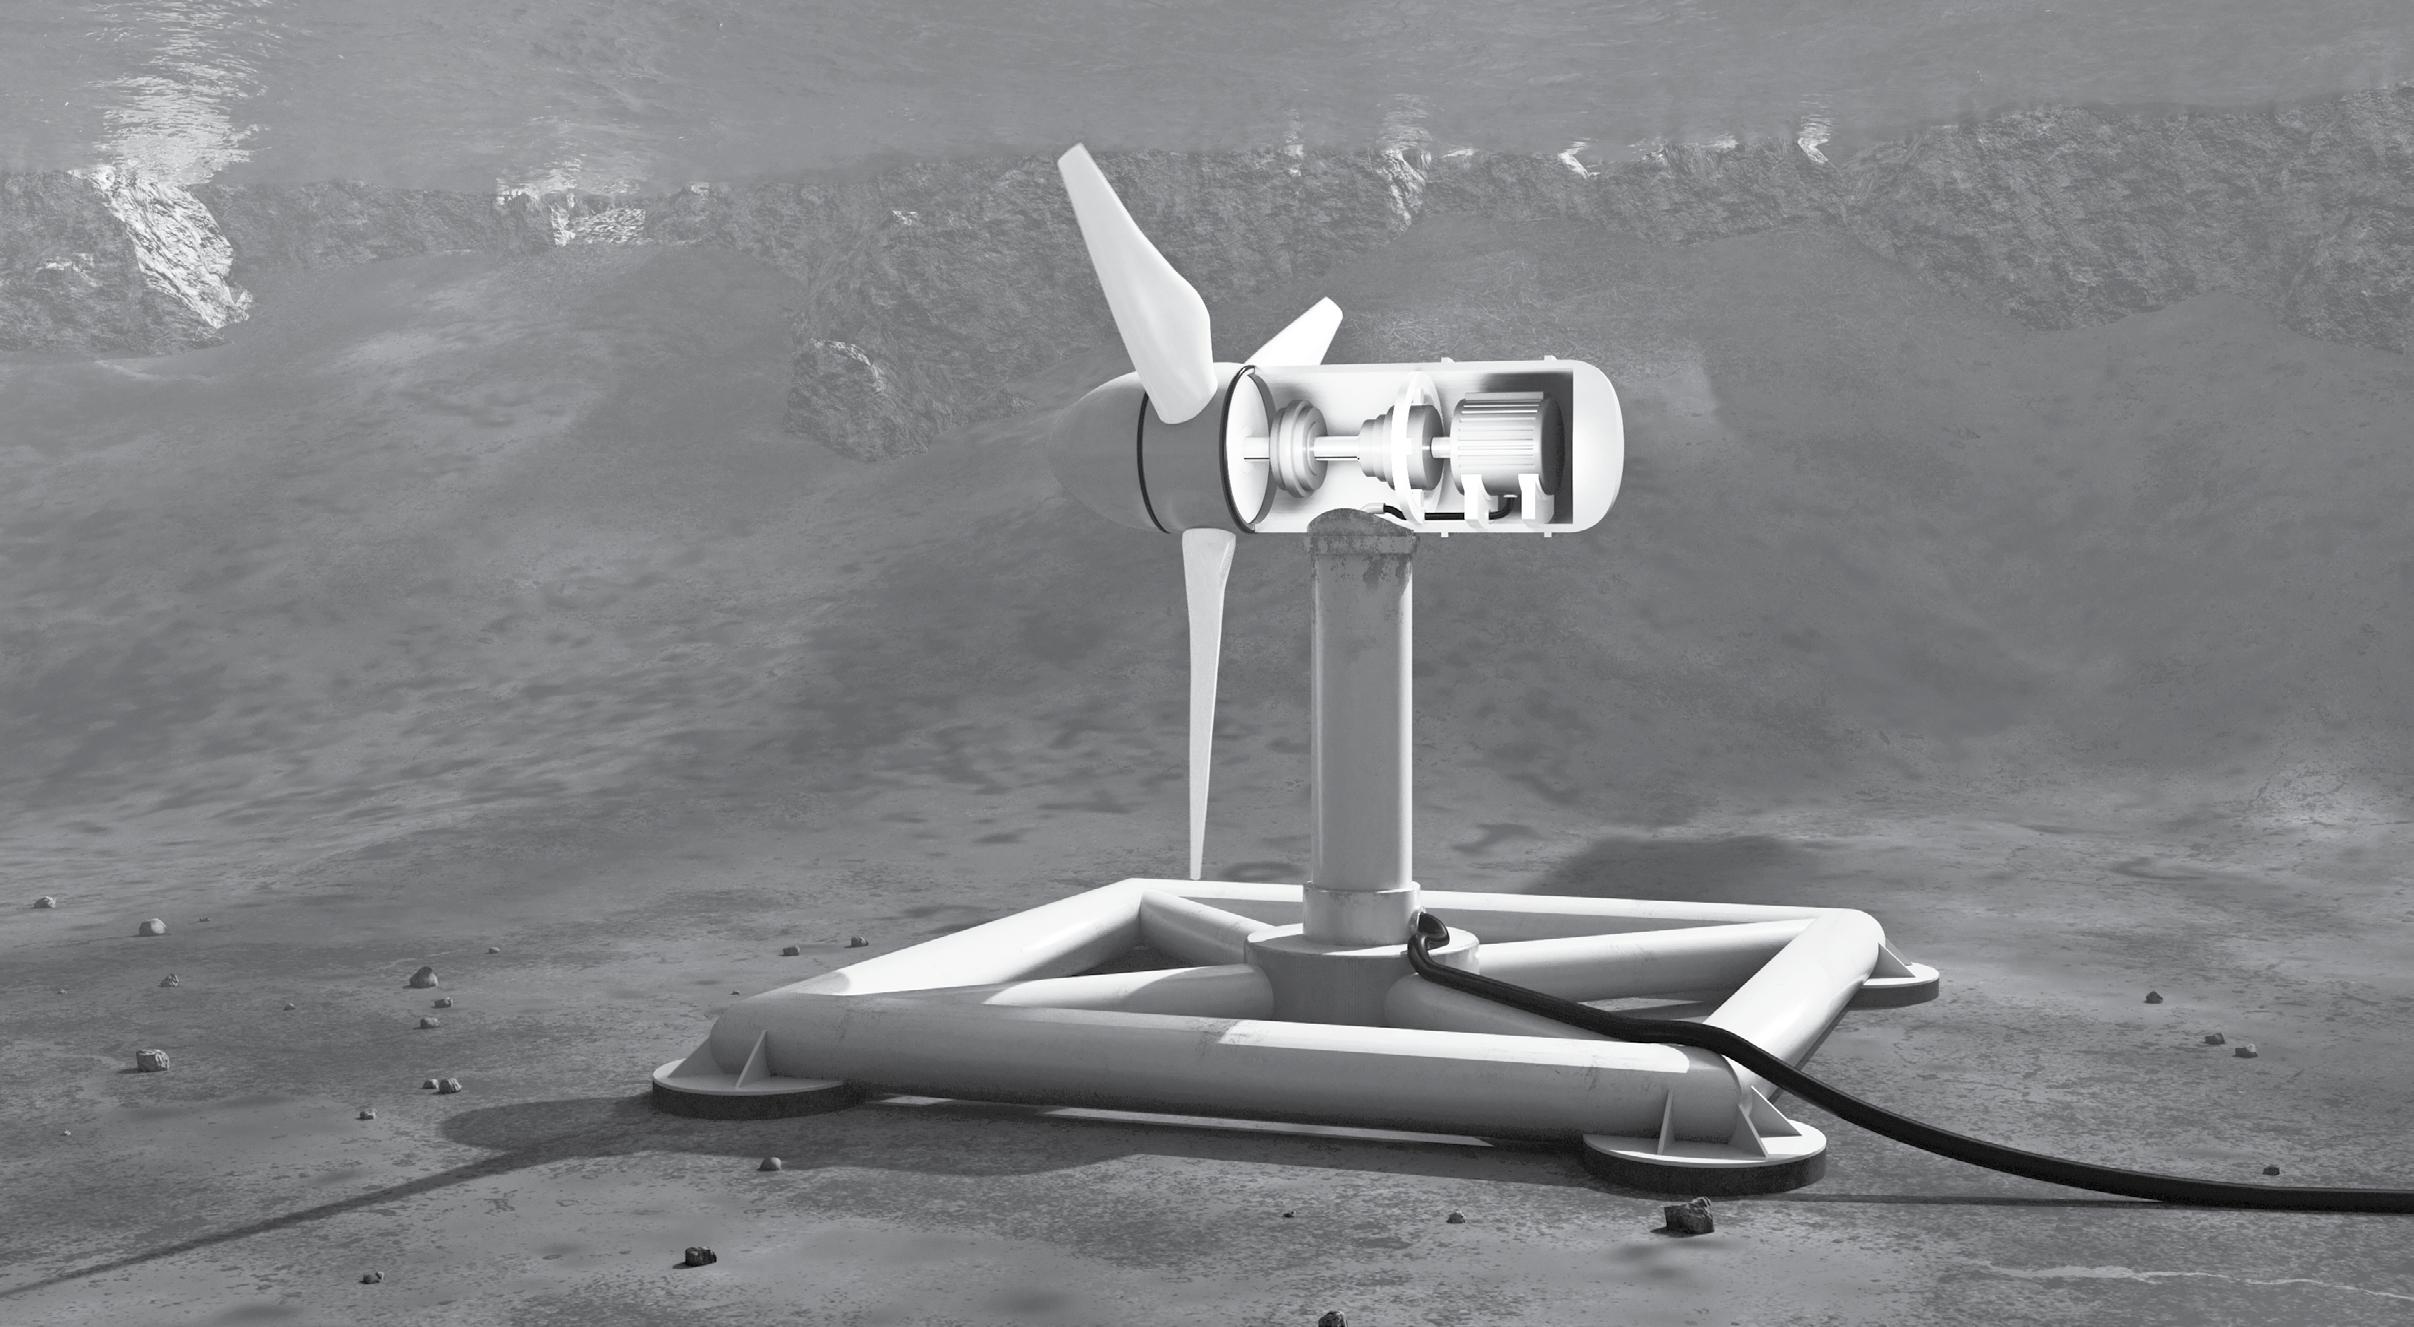
The movement of water in the world’s oceans creates a vast store of kinetic energy. Marine Renewable Energy (MRE), also known as Marine Hydrokinetics (MHK), can be harnessed to generate electricity to power homes, transport and industries. MRE encompasses wave energy — power from the movement of surface waves, tidal energy – power from the changes in tides, ocean current energy — power from the motion of ocean currents, ocean thermal energy conversion (OTEC) — power from the heat differential of different thermal layers within a body of water, and salinity and pressure gradient — power from the difference in salt concentration between two fluids.
10 ©2023 The NEED Project Exploring Marine Hydrokinetics www.NEED.org
Underwater Geography
At the edge of the ocean, where waves lap at the shoreline, is the continental shelf. It is a continuation of the North American continent we live on, and this landmass extends from the shore into the ocean as a gently sloping undersea plain. This undersea world is a fascinating place.
The continental shelf can be as narrow as 20 kilometers (12 miles) along the west coast and as wide as 400 kilometers (249 miles) along the northeast coast of the United States. The water on the continental shelf is shallow, rarely exceeding a depth of 150 to 200 meters (490-650 feet). Often, the continental shelf is a mostly sandy bottom, with great opportunity for offshore energy development.
The continental shelf drops off dramatically at the continental slope and continental rise, where the deep ocean truly begins. The deep ocean consists of abyssal plains that are 3 to 5 kilometers (1.8-3.1 miles) below sea level. Many of these plains are flat and featureless, while others are marked with jagged mountain ridges, deep canyons, and valleys. These areas also offer great opportunity for development.
Bathymetry studies must be completed and/or analyzed for any offshore installation to help understand the surface conditions and the geology at and below the seafloor. These studies have often required ships to tow sensing and Sonar equipment called a towfish to collect data. Advances in Autonomous Underwater Vehicles (AUVs) are allowing us to collect this information at a much greater rate. Soon we will have much better maps available to help make these kinds of decisions
The Exclusive Economic Zone (EEZ)
In 1982, the United Nations adopted a law giving each country bordering an ocean the rights to an exclusive economic zone off its coast. The EEZ is an area of coastal water and seabed no more than 200 nautical miles (370 km) beyond the country’s shoreline. Each country claims exclusive rights for fishing, drilling, and other economic activities. This includes production of energy from the water, winds, and currents. On March 10, 1983, President Ronald Reagan signed a Presidential Proclamation that set up the U.S. Exclusive Economic Zone (EEZ).
The Outer Continental Shelf (OCS)
The first three nautical miles offshore belong to the state that it borders. According to the Outer Continental Shelf Lands Act, the Federal Government controls the area beyond that, known as the Outer Continental Shelf, or OCS.
The Outer Continental Shelf consists of 1.7 billion acres of submerged lands, subsoil, and seabed in a specified zone up to 200 nautical miles from the U.S. coastline to the edge of the EEZ, or even farther if the continental shelf extends beyond 200 nautical miles. The OCS is divided into four regions: the Atlantic Region, the Gulf of Mexico Region, the Pacific Region, and the Alaska Region.
Underwater Geology
What’s a Nautical Mile?
A nautical mile is based on the circumference of the Earth. Visualize this: cut the Earth in half at the Equator, pick up one of the halves, and turn it on its side. The Equator is the edge of the circle.
A circle is divided into 360 degrees. Each degree divides into 60 minutes. One nautical mile is one minute of arc on the planet Earth. Every country in the world uses this unit of measurement for travel in the air and on the oceans.
We are used to measuring distances in meters and feet. A nautical mile is equal to 1,852 meters, or 1.852 kilometers. In the English measurement system, a nautical mile is equal to 1.1508 miles, or 6,076 feet.
At the Equator, the Earth measures 40,075.16 km (or 24,901.55 miles). How many nautical miles is it around the Equator? 0º 30º 300º
330º 270º 240º 210º 180º 150º
60º 90º 120º 1 nautical mile
©2023 The NEED Project Exploring Marine Hydrokinetics www.NEED.org 11
COAST CONTINENTAL SHELF OCEAN CONTINENTAL RISE ABYSSAL PLAIN CONTINENTAL SLOPE SHELF BREAK
Image adapted from Bureau of Ocean Energy Management (BOEM)
Wave Energy
There is tremendous energy in ocean waves. But harnessing wave energy, or extracting the power from a wave, is a big challenge. Wave energy devices extract energy directly from the surface motion of ocean waves and convert the energy into electricity. A variety of technologies and promising designs are undergoing demonstration testing around the world.
Wave Formation
Waves are caused by the wind blowing over the surface of the ocean, although they can also be affected by tides, weather conditions, and underwater events. The size of waves depends on the speed of the wind, the duration the wind blows, and the distance of water over which the wind blows, known as the fetch. Usually, the greater the fetch, the higher the waves. A strong breeze of 48 kilometers per hour (30 mph) can produce waves three meters (10 feet) high. Violent storm winds of 105 kilometers per hour (65 mph) can produce waves nine meters (30 feet) high.
As the wind blows over the water, there is friction between the wind and the surface of the water. The wind pulls the surface water in the direction it is going. The water is much denser than the air and cannot move as fast, so it rises and is then pulled back down by the force of gravity. The descending water’s momentum is carried below the surface, and water pressure from below pushes this swell back up again. This tug of war between gravity and water pressure creates wave motion.
Ocean waves are, therefore, the up and down motion of surface water. The highest point of a wave is the crest; the lowest point is the trough. The height of a wave is the distance from the trough to the crest. The wavelength is the distance between two crests. Small waves may have lengths of a few inches while the crests of large storm waves may be several football fields apart. Waves usually follow one another, forming a train. The time it takes two crests in a train to pass a stationary point is known as the period of a wave. Wave periods tell us how fast the waves are moving.
Wave Formation
The U.S. has over 95,000 miles of coastline for harnessing wave energy, however, not every mile is created equal. The best wave resources in the U.S. for producing power are found in and around deeper waters of the Pacific Ocean. Wave energy potential is often described by power per meter of wave crest. The Pacific Coast of the U.S. has many areas of the coast that have potential for 35 kW/m averaged throughout the year. For contrast, the Gulf of Mexico and the Atlantic Coast resources are more consistently near 10-20 kW/m. Wave energy technology is being tested in several sites, both in the Atlantic and Pacific, and will help maximize the resources to bring power to the people, wherever they may be.
Wave Measurements Wave Measurements
CREST LENGTH
HEIGHT
TROUGH
Wave Formation
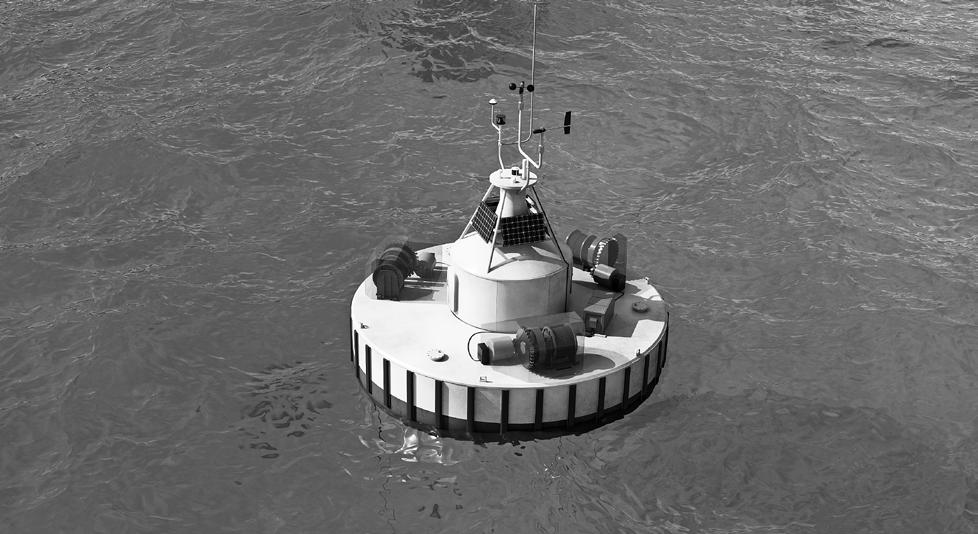
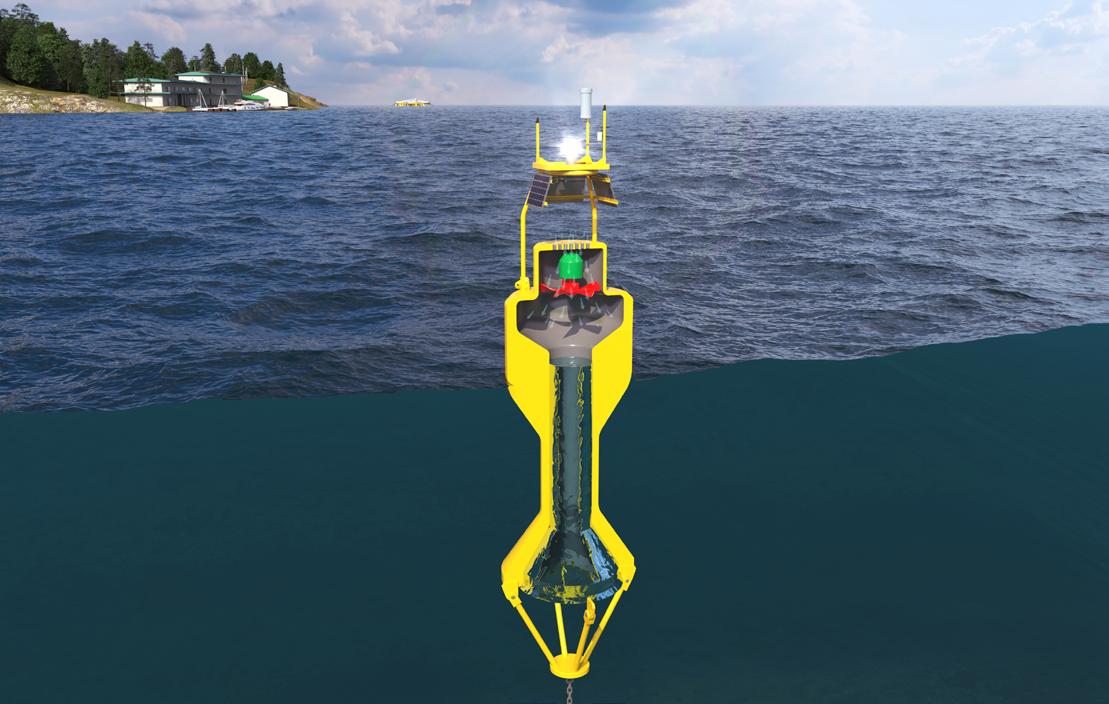
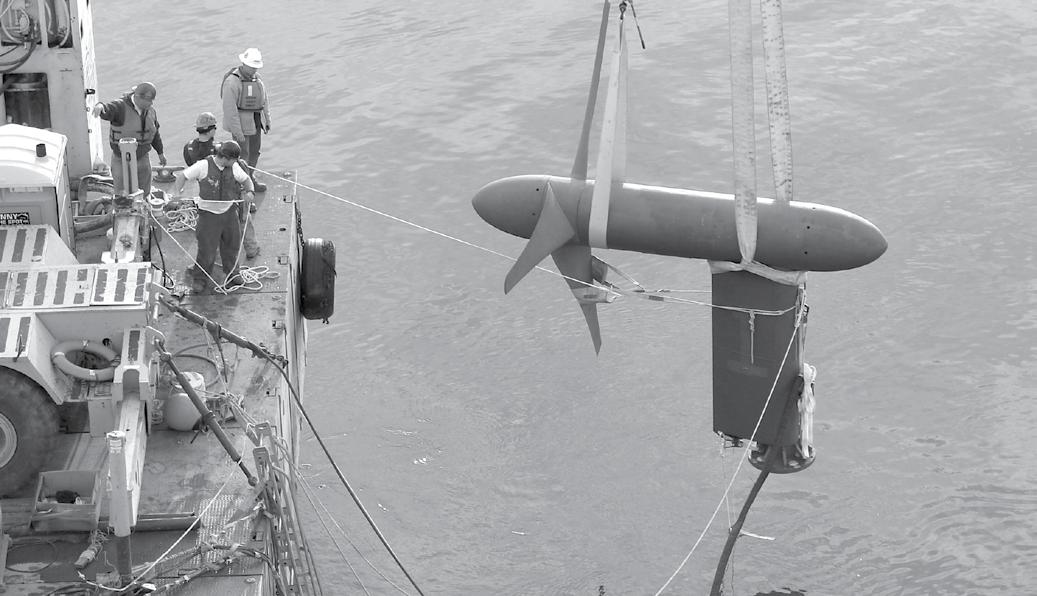
Image courtesy of IKM Testing UK Wave and other oceanographic data can be gathered from wave-powered buoys like the one depicted above. The buoy is equipped with instruments and sensors that record wind speed, wave height, water temperature, air temperature, and other conditions. The sensors send data back to shore, however, the sensors require power to send such signals. This buoy is moored or anchored to the ocean floor with cables. The cables are wound around gears or winches that are connected to a generator. As the cables move up and down with wave action, the kinetic energy is transformed into electricity through the winding and unwinding of the cable. Wires connected to the generator send electricity to a small battery for storage, and into the computing and sensing devices on the buoy to power lights and send signals.
12 ©2023 The NEED Project Exploring Marine Hydrokinetics www.NEED.org
orbit in open water Friction distorts the circular orbit
of wave moves faster. Increasingly elliptical
Wave begins to break
Circular
Top
orbit
Wave-Powered Research Buoy
Wave Energy Technology
Research and development of wave energy is really just beginning. Worldwide, over a hundred conceptual designs of wave energy conversion devices have been developed, but only a few are built as full-scale prototypes or tested under real world conditions. So far, no particular technology is considered an ultimate solution.
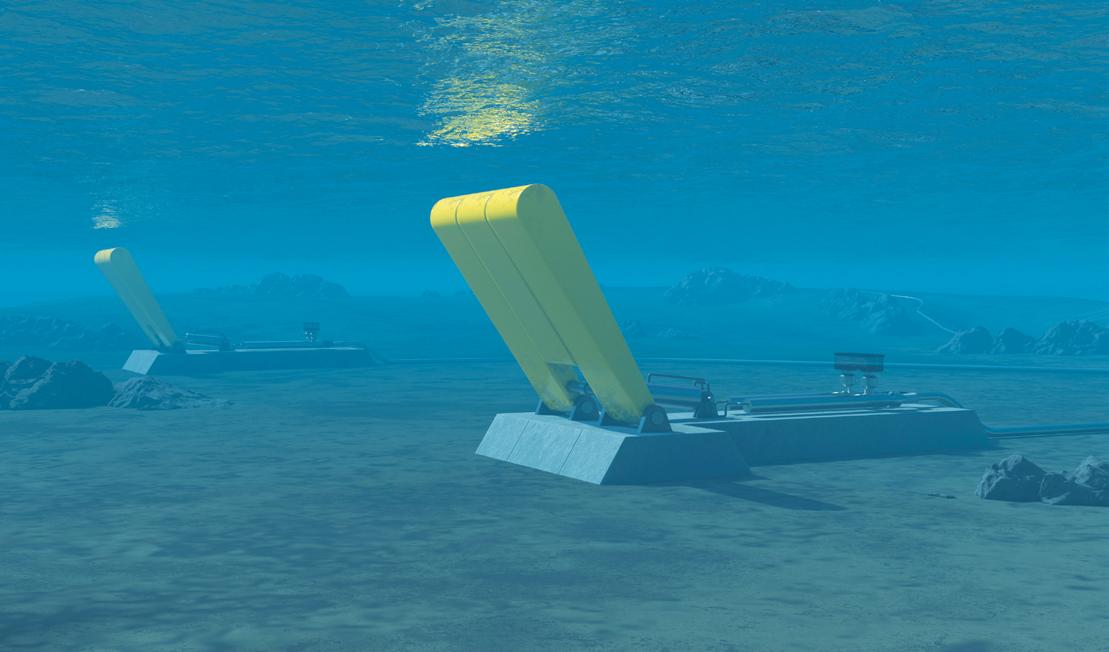
Wave energy devices turn motion or mechanical energy into electric current. How motion energy is obtained from ocean waves is what makes each device unique. Wave energy technology can be grouped into a few major categories, each with a different method for harnessing energy from waves: attenuators, point absorbers, overtopping devices, pressure differential, oscillating water columns, and osculating wave surge converters.
There is one thing each kind of device has in common - in order for it to be economically successful, it must overcome some major technical challenges. It has to survive the harsh ocean environment, and it must efficiently extract energy from waves. Other major technological challenges include generating electricity in a water environment, and getting that power through the ocean to the existing electric grid. There are additional challenges with the mechanical systems, mooring and anchoring the device, reliability, and predictability or wave forecasting.
In addition to technological challenges, developers must consider how a device may impact the surrounding marine environment. Some environmental concerns include migratory species, and changing the flow of sediments near the shore. In some places, citizens and business owners have concerns about losing commercial and recreational fishing grounds and the impacts these devices have on recreational activities like surfing and kayaking.
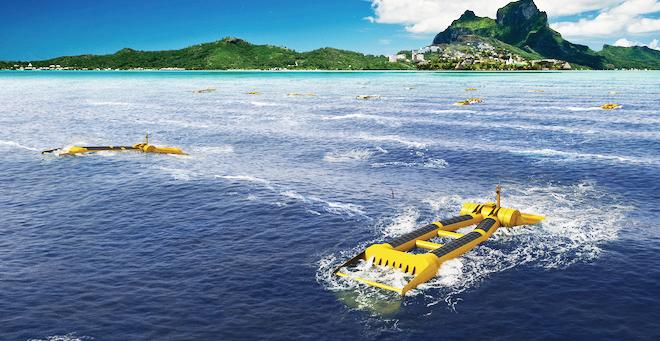
Attenuator
An attenuator is generally a multi-segmented device that floats on the surface of the ocean. It is anchored in place parallel with the incoming waves. The device harnesses energy as the motion of the waves causes flexing between each segment. The mechanical motion of the flexing is converted to electrical energy using hydraulic pumps and generators.
An example of this technology is in use by the Scottish company, Mocean. They invented wave attenuators known the Blue Star, the larger Blue Horizon and BlueX. The device is a raft with hinged joints. Passing waves cause each joint to rise and fall. The motion of the hinges drive the generators to produce electricity. The wave energy converters are anchored to the sea floor by moorings and then connected to the grid with subsea power cables.
Point Absorber
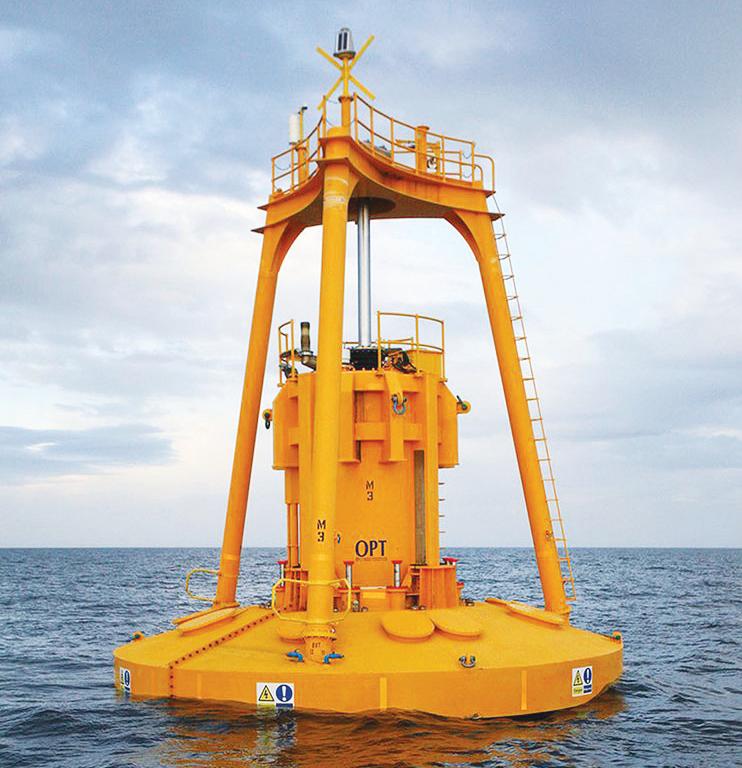
A point absorber often looks much like an ocean buoy. It is a floating structure that captures energy from the vertical motion of waves. A point absorber is not oriented any particular way in relation to the waves because it “absorbs” the energy from waves from every direction. The up and down bobbing motion drives a linear (rotary) generator or hydraulic energy converter to generate an electric current. The moving body of the absorber can be submerged or on the surface, and may be fixed to the sea bed or another structure. Several companies are successfully demonstrating this type of technology around the world. Ocean Power Technologies has deployed the PowerBuoy® off the coast of New Jersey for a U.S. Navy project. Other point absorber designs of many different shapes and approaches are being deployed, tested, and improved. Sites like the Wave Energy Test Site (WETS) in Hawaii, Scripps Oceanography Institution, and PacWave testing site in Oregon help companies to prove and improve their designs. CalWave has been testing and improving a design called the xWave which is a fully submerged, square-shaped, point absorber design that is protected from storms and swells by staying below the surface. Another example is the Fred.Olsen Lifesaver device, a device shaped like a round life saver that uses winches and cables to generate electricity as it bobs up and down.
©2023 The NEED Project Exploring Marine Hydrokinetics www.NEED.org 13
CONVERTER
MOCEAN BLUE HORIZON WAVE ENERGY
Image courtesy of Mocean Energy
OPT POWERBUOY
Image courtesy of National Geographic
Overtopping Device
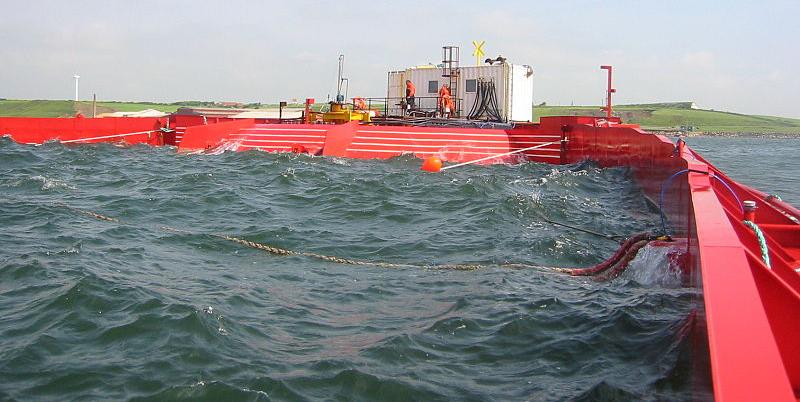
One way to harness wave energy is to focus the waves into a narrow channel, which can concentrate their power or size. Overtopping devices direct or channel the waves and allow them to spill over into a reservoir. The higher water in the reservoir creates a pressure difference between the water at the surface and in the reservoir, forcing fluid to travel through a turbine generator, much like a hydroelectric dam. Overtopping devices have been demonstrated both onshore and offshore. The Wave Dragon is one such example of a floating offshore overtopping device. It focuses or reflects the waves towards a ramp. Behind the ramp is a large reservoir where water that runs up the ramp can be stored and used to generate electricity. The Wave Dragon was first developed for use off the coast of Denmark in the early 2000s, and another is in use off the coast of Wales in the U.K.
Pressure Differential
Pressure differential devices are constructed below a wave and are built to capitalize on the pressure difference that occurs between crests and troughs of waves. If you’ve ever sat down quickly on an air mattress and rolled or bounced someone off the other side, you might be able to imagine how this device works. On one side of the system, the crest of the wave has a higher pressure, and it causes a device in the chamber to compress downward. On the other side, the trough has a lower pressure causing a device on this end of the chamber to expand upwards. There is air between the two expanding and contracting chambers, and power can be generated by the air as it expands and contracts from side-to-side. These devices are often located close to shore and are attached to the seabed.
Oscillating Water Column
Oscillating water column devices are typically partially submerged, and can be free floating or fixed onshore. The device is constructed so that they contain a shallow chamber of air on top of a column of water. Wave action causes the water column to rise and fall, causing the air in the chamber above to be compressed and decompressed with the movement. Trapped, or forced air can then spin a turbine generator to generate electricity.
Oscillating Wave Surge Converter
Oscillating wave surge converter technology harnesses energy directly from the surging and swelling motion of waves. It uses the swaying motion between a float, flap, or membrane that is free to move and a fixed point that is attached to a structure or the seafloor. Energy can be collected from the motion of the waves relative to the body of the device. Depending on the device design, there could be a generator at the hinge/fixed point that generates the electricity. Alternatively, the moving body could be used to create pressure in a fluid that will drive a turbine generator.
Wave Energy Around the World
In many areas of the world, the wind blows with enough consistency and force to provide continuous waves. The total power of waves breaking on the world’s coastlines is estimated at 2-3 million megawatts. Along with the west coast of the United States, the west coast of Europe and the coasts of Japan and New Zealand are good sites for harnessing wave energy. There aren’t yet any major commercial wave energy plants, but there are a few small ones deployed across the globe. Onshore and offshore devices will likely need to be deployed in arrays of multiple devices - much like a wind farm – in order to make the best use of wave potential for electricity generation.
14 ©2023 The NEED Project Exploring Marine Hydrokinetics www.NEED.org
Image courtesy of IKM Testing UK
OSCILLATING WAVE SURGE FLAP DEVICE
Image courtesy of IKM Testing UK
DRAGON
OSCILLATING WATER COLUMN DEVICE
WAVE
Image courtesy of Aquamarine Power
Tidal Energy
Tide Formation
Tides are caused by the interaction of gravitational forces between the Earth, moon, sun, and the Earth’s oceans. The force from the moon is much more powerful since it is closer to the Earth. The moon pulls on the ocean water that is closest to it. This creates a bulge in the surface of the water, called a tidal bulge. The water on the opposite side of the Earth also forms a tidal bulge, because the gravitational pull is smaller due to the greater distance from the moon on the far side of the Earth. These bulges produce high tides. The influence of the sun is apparent when it is aligned with the moon and the tides become higher than at other times.
Between the tidal bulges are lower levels of water that produce low tides. The tidal bulges move slowly around the Earth as the moon does. Halfway between each high tide is low tide. Most shorelines have two high and two low tides each day. However, the Gulf of Mexico only experiences one high and one low tide each day because of its geographic location.
On most of the U.S. coast, the tidal range, or the difference between high and low tides, is only about one to two meters (3-6 feet). When a high tide flows into a narrow bay where the water cannot spread out, the tidal range can be very large. These areas are potential locations for harnessing tidal power. The Bay of Fundy in Canada has the highest tides in the world, sometimes rising over 15 meters (50 feet).
Tidal Bulge
Harnessing Tidal Power
Tidal power is very reliable and predictable, which can make it a valuable resource. One main challenge to harnessing tidal power is geography. The highest tidal ranges are generated when the sun, moon, and Earth are in line. Water will flow in greater volume when this combined pull occurs. These are called spring tides. Lower tidal ranges, or neap tides, occur when the sun, moon, and Earth are less aligned, causing less volume of water. Tidal stream resources are largest where there are good tidal ranges and where there is good current speed to move the water. Geographical features like straits, inlets, channels, and islands can create higher velocities of currents and amplify the rise and fall of tides. This movement can be captured by turbines. Like wave power, tidal power is still in development in many areas, but the technologies are more advanced. A few commercial and pre-commercial scale systems have been installed in the U.K. and U.S. There are a few types of tidal technology designs including tidal barrages, tidal fences, and tidal turbines.
Tidal Barrage
A tidal power plant, or tidal barrage, is built across an estuary, the area where a river runs into the ocean. The water here rises and falls with the tides. A tidal barrage has gates and turbines at its base. As the tide rises, the water flows through the barrage, spinning the turbines, then collects in the estuary. When the tide drops, the water in the estuary flows back to the ocean. The water again turns the turbines, which are built to generate electricity when the water is flowing into or out of the estuary.
Tidal Fence
Building large-scale tidal barrages is less likely than alternative methods of harnessing tidal power. One option is a tidal fence. Tidal fences are similar to tidal barrages in that they stretch across narrow areas of moving water. Unlike tidal barrages, tidal fences do not dam water, but allow it to flow freely. This makes them cheaper to install as well as having less impact on the environment. However, tidal fences may inhibit the movement of large marine mammals and ships.
Tidal Barrage Tidal Barrage
TIDAL FLOW DIRECTION DAM TURBINE
Tidal water is captured at high tide behind a dam. When the tide turns, the water is released to the sea, passing through a set of turbines.
©2023 The NEED Project Exploring Marine Hydrokinetics www.NEED.org 15
EARTH MOON
Gravitational Attraction Rotati on o f t eh htraE
NEAR T I D A L EGLUB RAF T I D A L
BULGE
Turbine Turbine Turbine Turbine
Tidal Fence with Bridge
Tidal Turbines
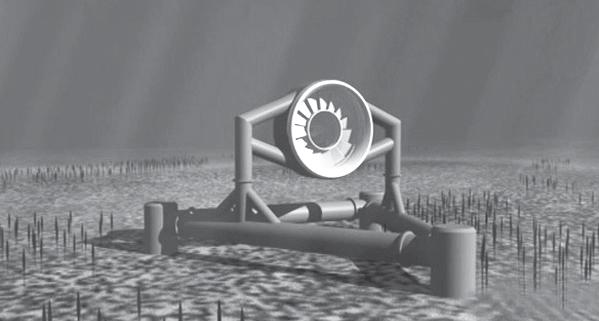
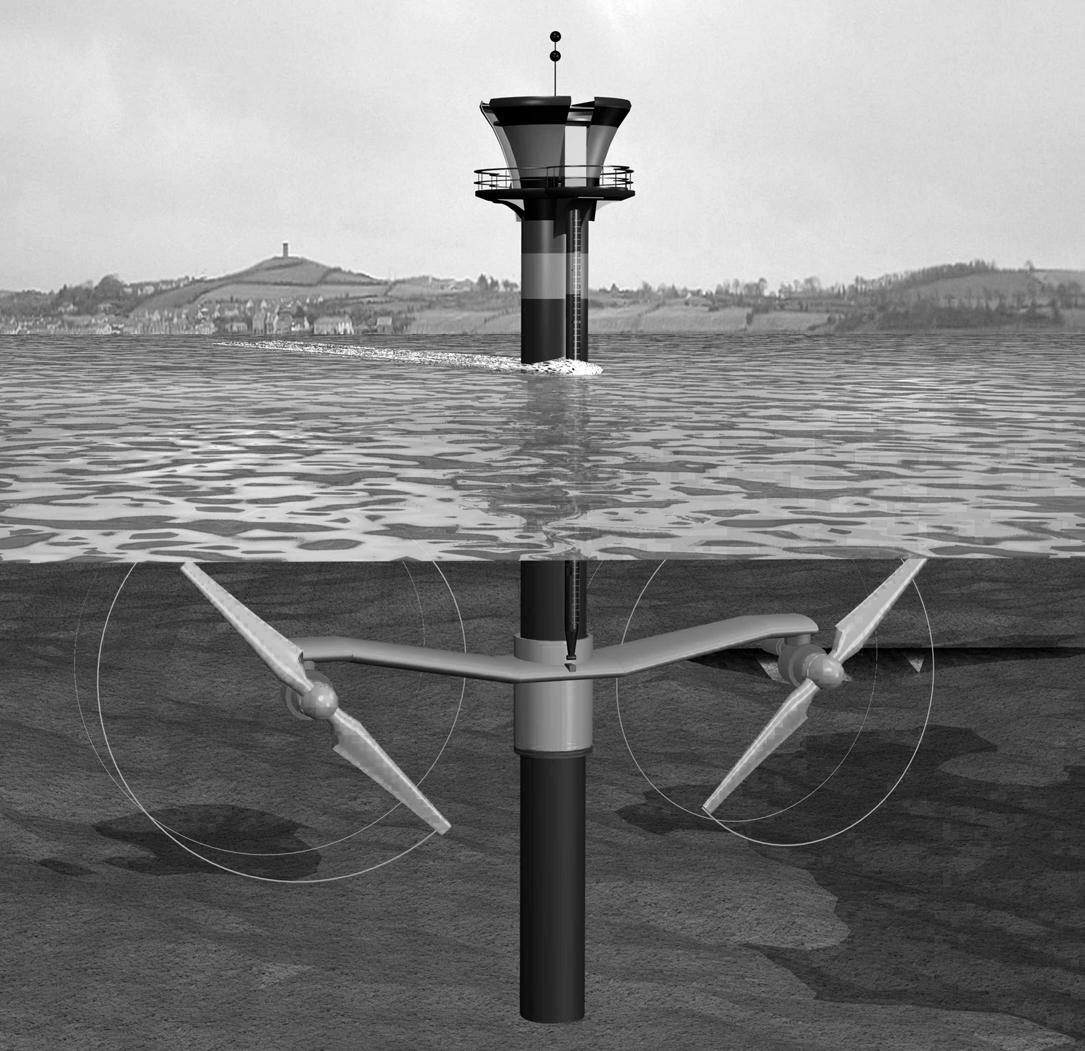
Underwater turbines work like submerged windmills, but are driven by flowing water rather than air. They can be installed in the ocean in places with high tidal current velocities or in places with fast, continuous ocean currents. There are a few general designs for tidal turbines, but the design and deployment can vary greatly based on the area selected. Tidal turbines are similar to wind turbines, using spinning blades that face the direction of the flow of water. These turbines can be ducted (enclosed), or open, and can be fixed on the ocean floor or floating at any point in the water column. The SeaGen and Open Hydro turbines are two examples of tested axial flow designs. Cross flow turbines capture the kinetic energy of moving water with spinning blades that are oriented perpendicular to the direction of water flow. Cross flow turbines are mounted vertically or horizontally, and can be open or ducted in their construction. Like axial turbines, these can also be placed anywhere in the water column, but bottom mounting is most common. The TideGen Turbine Generator Unit is an example of cross flow design in action. Tidal kite devices are designed very much like they sound. A buoyant wing or kite with a turbine attached to it is tethered to a cable. The cable is fixed at a location that enables it to “fly” in the tidal stream, often swooping in a figure-eight like motion. Archimedes screws are also constructed very similar to how they might sound. These corkscrew-shaped devices allow water from the tides to move up the spiral shaped-turbine, rotating the device to generate energy. Finally, oscillating hydrofoils utilize a wing attached to an arm that can oscillate with the flow of water. As the water flows, it lifts and lowers the wing, and a hydraulic system can be used to generate the electricity.
OPENHYDRO TIDAL ENERGY SYSTEM
New York City’s East River Project
The city and state of New York have partnered with Verdant Power to harness the energy in the ebb and flow of the tides in Manhattan’s East River. The Roosevelt Island Tidal Energy (RITE) Project is the first gridconnected (non-commercial) array of tidal turbines in the world. After completing a successful demonstration phase with six turbines that generated 70 megawatt-hours of electricity, the project received the first U.S. commercial license for tidal power. The project installed three 35-kilowatt turbines in 2020 with hopes to expand with more funding.
Image
Free Flow System turbine being installed in the East River, NY.
TIDGEN® TURBINE GENERATOR UNIT
TIDAL TURBINE
16 ©2023 The NEED Project Exploring Marine Hydrokinetics www.NEED.org
Image courtesy of Ocean Renewable Power Company
courtesy of Verdant Power
Image courtesy of Marine Current Turbines
An artist’s rendering of the SeaGen tidal turbine system. The SeaGen consisted of two large rotors, each driving a generator with a gearbox. The twin rotors—each 14-20 meters in diameter—are mounted on wing-like extensions on either side of a three-meter wide tubular steel monopile that is set into a hole drilled in the sea floor.
Image courtesy of OpenHydro
OpenHydro had tidal power projects in Europe, Canada, and in Admirality Inlet off the coast of Whidbey Island in Washington State.
Ocean Surface Currents
Global Ocean Currents
Ocean waters are constantly moving and flowing in complex patterns around the Earth called currents. Waters in the upper 400 meters (1,300 feet) are called ocean surface currents. They are formed by wind, water salinity, temperature, topography of the ocean floor, and the Earth’s rotation. Moving water below 400 meters is considered deep water current and its movement is mostly driven by density differences and gravity. Ocean currents are relatively constant and flow in one direction.
Ocean currents contain an enormous amount of energy because water is very dense. Ocean water is about 800 times more dense than air. This means slow flowing water exerts more force than a very strong wind over comparable surface areas. Capturing the energy potential remains a challenging technology problem.
Global Ocean Currents
Some of the ocean surface currents on America’s OCS are the Gulf Stream, Florida Straits Current, and California Current. The Gulf Stream is a powerful current in the North Atlantic Ocean. It originates in the Gulf of Mexico, exits through the Strait of Florida, and follows the eastern coastline of the United States and Newfoundland. It travels 40 to 120 kilometers (25 - 75 miles) a day at speeds ranging from 1.75 km/hour to 5 km/hour (or about one to three knots). The Gulf Stream strongly influences the climate of the East Coast of the United States and many Western European countries. It keeps temperatures warmer in the winter and cooler in the summer compared to surrounding areas.
©2023 The NEED Project Exploring Marine Hydrokinetics www.NEED.org 17
Warm water current
Cold water current
Ocean Surface Current Formation
Most ocean currents are driven by wind and solar heating of surface waters near the Equator, while some currents result from differences in density and salinity between surface and deeper waters.
As global winds drag on the ocean’s surface, they pull the water in the direction that the wind is blowing. Because of the Coriolis Effect, major surface ocean currents curve to the right in the Northern Hemisphere (in a clockwise spiral) and to the left in the Southern Hemisphere (in a counter-clockwise spiral). These major spirals of ocean-circling currents are called gyres and occur north and south of the Equator.
It is not just surface water that is affected by global winds and the Coriolis Effect — deep water currents are formed this way, too. As surface water molecules are pushed by the force of the wind, they, in turn, drag deeper layers of water below them. Each deeper layer moves more slowly than the layer above it, until about 100 meters deep. Below 100 meters, ocean currents are formed by differences in the density and salinity of the water. These differences are used by Ocean Thermal Energy Conversion systems to generate electricity (see page 19 for more details). As each successively deeper layer of water moves more slowly to the right or left, it creates a spiral effect known as the Ekman Spiral. Because the deeper layers move more slowly than the shallower layers, they tend to twist around and actually end up flowing in the opposite direction of the surface current. In this way, ocean water travels a continuous path all around the Earth.
Ocean Current Technology
Ocean currents are one of the largest untapped renewable energy resources on Earth. However, they are also the least understood ocean energy resource. Engineers are researching and developing technology designs to harness ocean current energy, but it’s still at an early stage of development.
To harness energy from ocean currents economically, and on a commercial scale, there are some major technical challenges to overcome. For example, the logistics of maintenance are likely to be complex and the costs potentially high, so system reliability will be extremely important. The system components will need to be built from materials resistant to corrosion in salt water. Another challenge involves keeping naturally occurring marine growth from building up on the system components.
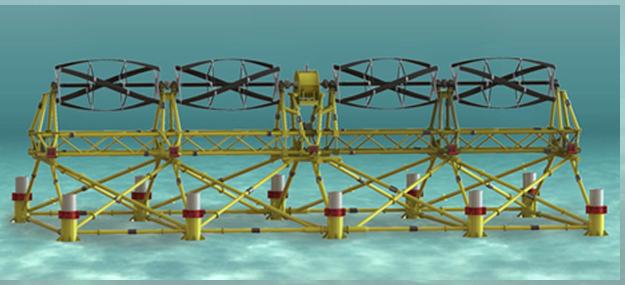
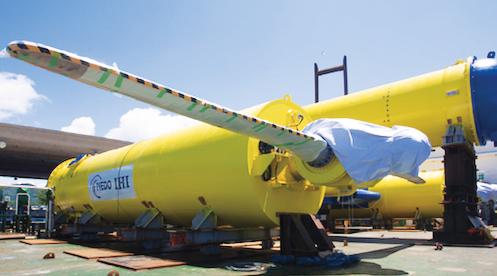
At this time, there are no commercial, grid-connected systems operating in the open ocean. Only a few small-scale prototypes and demonstration units have been built and tested. Tidal turbines and ocean current technologies are similar, and many of the turbines used for tides could be used for harnessing energy form currents. A project in Japan was able to showcase the viability of ocean current power with a very large, deep water turbine called Kairyu. Japan is one location where you can find some of the fastest ocean currents in the world. Two Japanese companies, NEDO and IHI, constructed a turbine to capitalize on the swift, steady deep water currents. The turbine looks almost like an airplane and consists of
CORIOLIS EFFECT
three cylindrical floats or pods, each about 20 meters in length. Two turbines are mounted on the outer two pods, with each rotating in an opposite direction. This opposite rotary motion cancels out any torque and keeps the system stable in the steady currents. The system is moored in about 100 meters of water, and installed so it maintains its locations about 30-50 meters below the surface. The model was successful in its tests for launch and generation from 2018-2021. Developers will continue to research and explore scaling the system for additional deployment and launches.
18 ©2023 The NEED Project Exploring Marine Hydrokinetics www.NEED.org
KAIRYU TURBINE
Image courtesy of NEDO / IHI
Other MHK Technologies
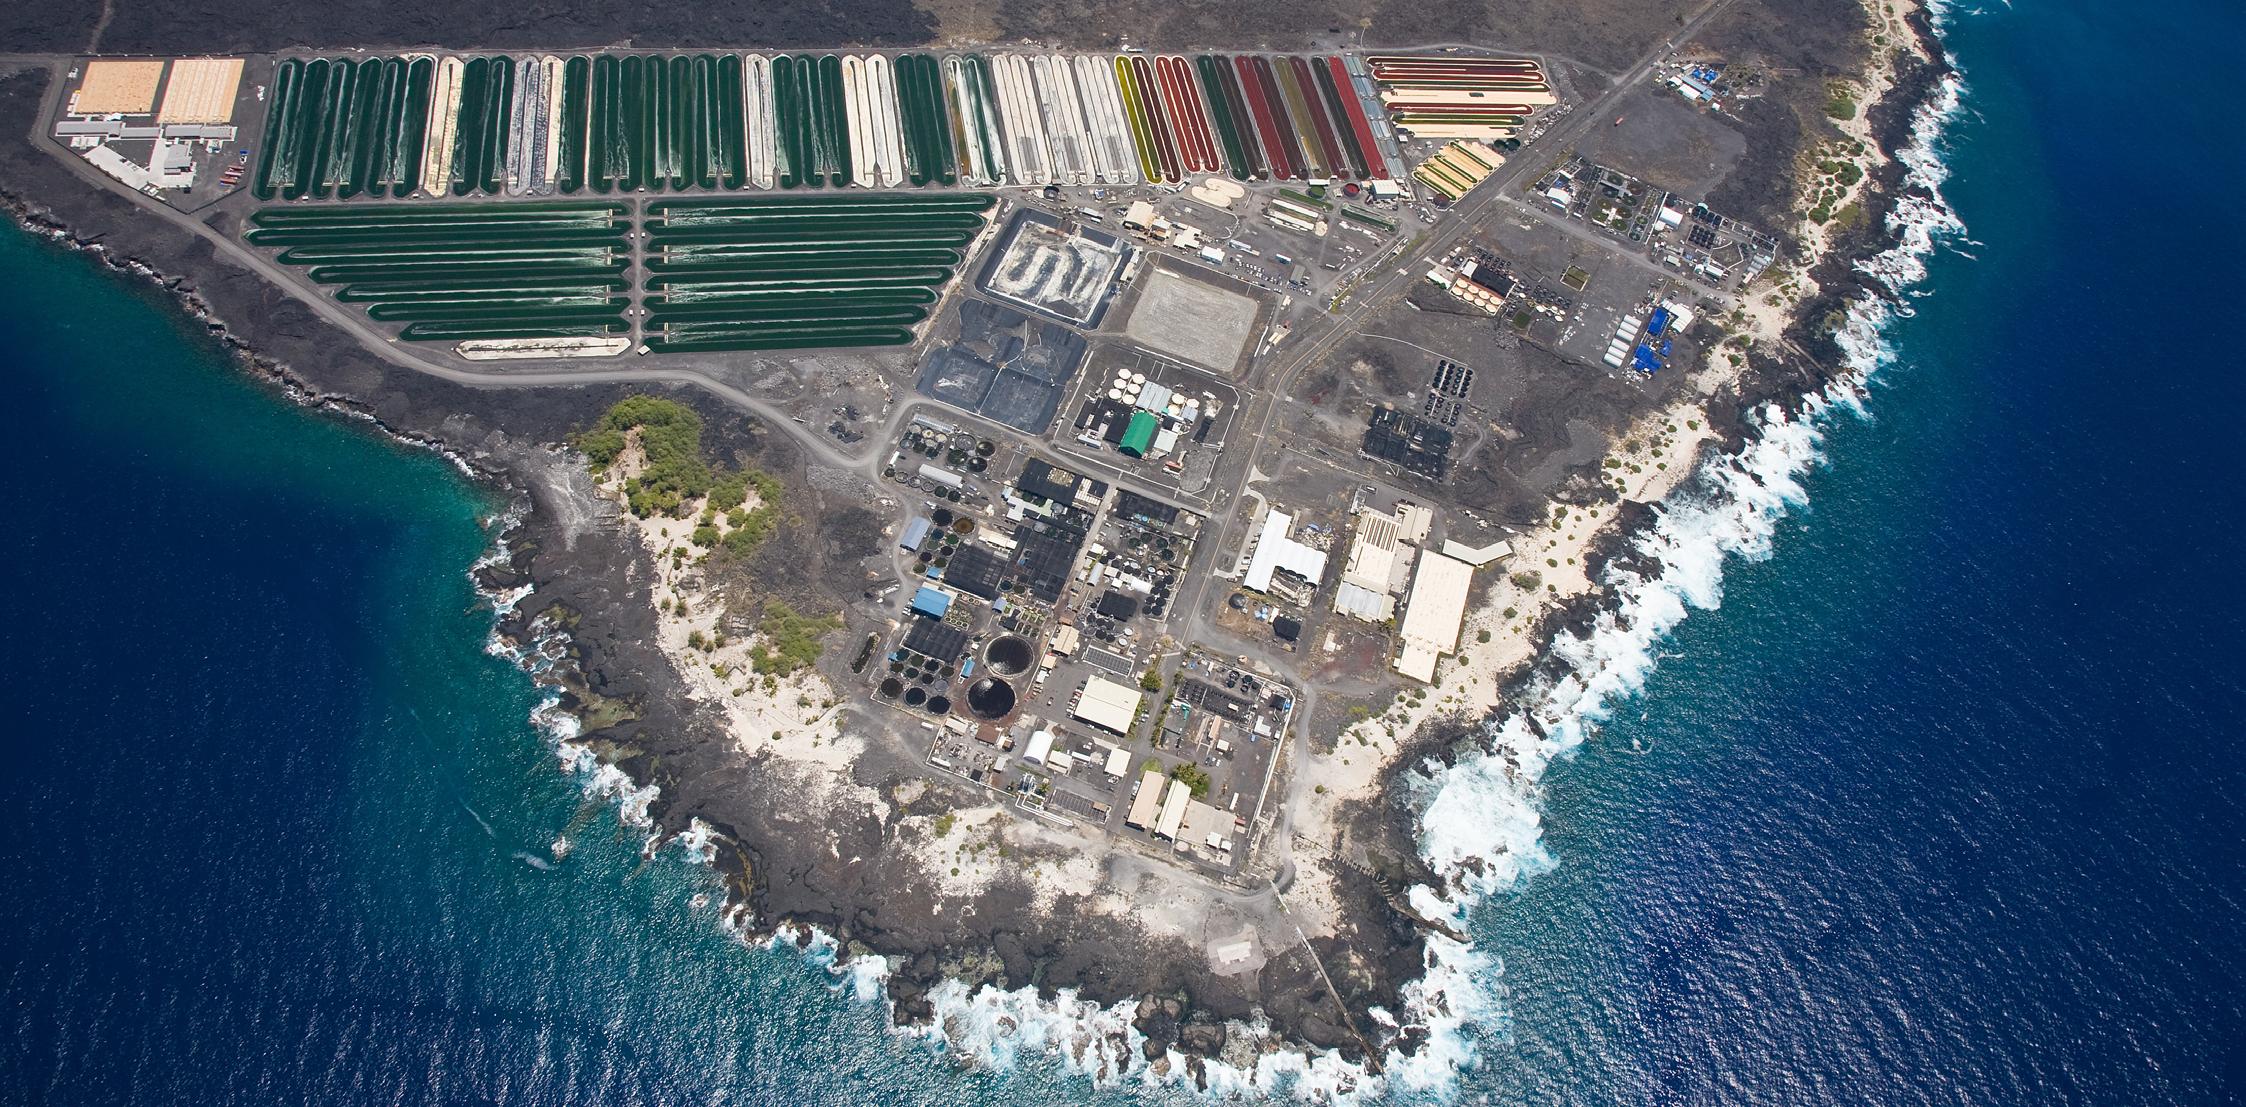
Ocean Thermal Energy Conversion (OTEC)
Oceans cover about 70 percent of the Earth’s surface. Radiant energy from the sun is absorbed by the ocean’s surface and some of it is transformed into heat. There is a large difference or layering affect between the warm surface waters and deeper waters in tropical and subtropical oceans. Deep ocean water does not receive any sunlight, and stays at a cool, constant temperature year round. This difference in temperature between the ocean layers can be used to generate electricity in an Ocean Thermal Energy Conversion (OTEC) plant. An Ocean Thermal Energy Conversion power plant can be designed as either open-cycle, closed-cycle or as a hybrid system. Each system uses a heat engine or heat exchanger to capture energy as heat flows naturally from hot to cold.
In an open-cycle system, warm surface water enters a low pressure vacuum chamber, where it boils and turns into steam. The steam spins a turbine connected to an electrical generator. Salt and other contaminants are left behind in this process. In a heat exchanger, the steam is exposed to cold ocean water and condenses back to a liquid. It is now desalinated fresh water that may be used for drinking or agriculture.
In a closed-cycle system, warm surface water passes through a heat exchanger to boil a fluid with a low boiling point. The steam created spins a turbine connected to a generator producing electricity. Cold ocean water condenses the steam back into the original fluid and
HAWAII OTEC PLANT SITE
flows back through the system to repeat the cycle. The working fluid and ocean water never mix. Used ocean water is piped back into the ocean fairly near shore.
A hybrid OTEC system produces electricity with a closed-cycle system and fresh water with an open-cycle system all at the same time. Warm ocean water enters a low pressure vacuum chamber, where it boils and turns into steam. The heat of the steam boils ammonia in a separate container. As the ammonia boils and turns into steam, it spins a turbine to generate electricity. Boiling the ocean water removes its salt and other impurities. When this steam condenses in the heat exchanger, it emerges as fresh, pure water for drinking or agriculture.
Salinity Gradient
In November 2009, the large Norwegian energy company, Statkraft, opened the world’s first osmotic power plant. The prototype power plant is based on the natural process of osmosis or changes in salinity. In the osmotic power plant, seawater and freshwater are separated by a special membrane in a large tank. Freshwater can move through the membrane but saltwater cannot. The salt content of the seawater draws freshwater through the membrane to dilute the salinity, increasing pressure on the seawater side of the membrane. The increased pressure is used to spin a turbine to generate electricity.
©2023 The NEED Project Exploring Marine Hydrokinetics www.NEED.org 19
Image courtesy of NELHA
Constructing and Siting MHK
MHK and Materials Science
Hydrokinetic devices must be able to thrive in what can often be a harsh environment. Salt, water, and motion put together can easily wear down many different materials. When constructing a device or technology for testing and use in the marine renewable energy world, materials matter.
When it comes to selecting materials for a project, application is key. It is important to consider exactly how the materials will be used, and which properties are most important. When considering the materials for a device, several factors come into play, including availability, cost, strength, and transportability of the materials. Materials that are lightweight and strong, but extremely expensive, may not be practical in the quantities needed to construct a hydrokinetic equipment.
MHK devices need to be rigid enough to withstand the motion of the water, cables, ropes, and anything else that might rub against them. However, depending on the technology and placement, the materials may also need to be somewhat flexible. The constant motion also requires that the materials be durable enough to limit fatigue over time. Corrosion must also be considered, and seals or coatings may also need to be added to the design to protect sensors, components, or joints. Materials used in MHK can vary widely depending on the technology and application and include everything from concrete, composites, and fiberglass, to resins, ceramics, polymers, and adhesives.
When designing prototypes and testing hydrokinetic technologies, engineers in marine renewable energy will often consider the process of additive manufacturing. Additive manufacturing uses computer-aided-design (CAD) programs or 3D printing and scanning to create very precise shapes. Additive manufacturing allows for the engineer and design teams to create designs quickly, often called rapid prototyping, without great expense and time involved with fabricating, machining, and conventional manufacturing. Additive manufacturing often uses polymers and composite materials that allow engineers and designers to
construct designs and test them in very short time frames, (months or less), and repeat their designs easily for continued refining and testing. Utility-scale or large-scale devices are more often made with steel. Perhaps future developments will showcase a role for additive manufacturing in large-scale devices.

20 ©2023 The NEED Project Exploring Marine Hydrokinetics www.NEED.org
3D PRINTING
Image courtesy of Adobe
The process of choosing a location for MHK equipment, known as siting, requires consideration of many factors. As with any human endeavor, there are trade-offs, which means that compromises are necessary. With any common resource, we seek to find compromises that are the “highest and best use” of our resources. In the world of real estate, appraisers use four criteria to determine the highest and best use of an area: legal permissibility, physical possibility, financial feasibility, and maximum productivity. When it comes to offshore energy, the questions related to highest and best use can be very complicated because of so many services that this area provides. In addition to wave power density, current flow velocity, tide tables, and water depth, developers must also consider seafloor geology, wildlife in the area, ship or recreational traffic, and local electricity infrastructure when selecting a site to place their equipment. Often, the location for deployment will dictate the type of equipment technology. For example, an area that experiences very little variation in tidal flow volume between high and low tide would not be a great candidate for tidal equipment. Tide charts, flow volume charts, and topography maps must be consulted. When selecting an area for current technology, flow volume and current speed and direction data should be gathered. Sometimes, this requires consulting data already compiled by local buoys already in place for use by the Navy or NOAA, however data may need to be gathered locally and may require deploying a data collection buoy.
Environmental and social considerations are also important once a site and technology are being investigated. Design and development teams will need to look at who uses the water in and around the area they might like to deploy. They must gather information on fishery, recreational, and even naval traffic in the area. Teams must also take a survey of sea life in the area, looking for protected species or migratory animals that live in the waters where the equipment and infrastructure will be placed. They will also need to make sure the area in question is able to be connected to those who will use the power. There will need to be infrastructure (electric substations or power lines) to connect to, or else it must be built. And it must be feasible to deploy the equipment and the necessary cables given the geography and geology of the local seafloor. Finally, teams must also even consider the possibility of extreme weather. Coastal areas can be subjected to stronger storms that bring intense wind, wave, and current conditions, and equipment must be able to withstand these conditions or be removed and re-deployed easily.
©2023 The NEED Project Exploring Marine Hydrokinetics www.NEED.org 21
Siting and Planning
TIDAL TURBINE
CURRENT FLOW DATA FOR ANALYSIS
Careers in Marine Hydrokinetics
The development and operation of MHK projects could create many jobs in the future. Each of the phases of operation will have permanent or temporary jobs created.
Phases of Operation
Research and Development – Analysts, scientists, and engineers will be needed to develop plans to look at the feasibility, environmental impact, and optimization technology.
Installation and Testing – Workers will be needed where the turbine components are built and deployed. Mariners and technicians will be called upon to complete phases of marine construction. Port Authority personnel may also help with the construction and provide lay-down areas for the connectivity infrastructure. Engineers, technicians, electricians, construction specialists, and testing specialists will work to ensure that the turbines are ready to begin producing power and put it on the grid.
Operations and Management – Engineers will be needed to monitor and deliver the resulting power from the facilities farm to those who draw power from the grid every day. There will be ongoing jobs for managers, analysts, engineers, technicians, and support personnel of all kinds throughout the life cycle of the project.
MHK Industry Job Examples
Research Scientist - studies and defines the basic science behind our natural systems and provides data to the scientific and technical community
Environmental Scientist - studies environmental systems and their interactions often characterizing effects of the built environment on natural systems and animal species
Marine Geologist / Geophysicist - studies the geology of our Earth including the makeup of the ocean floor and its component layers
Naval Architect - designs marine vessels to particular purposes and to accomplish specific missions
Design Engineer - designs major systems and subsystems within any technological machine - ensuring that the component parts work together to handle all loads they encounter and accomplish the design’s overall purpose as efficiently as possible.
Marine Engineer - sub-specialty of mechanical engineering that operates in the marine environment, and designs everything from docks to buoys to systems for ships and other vessels
Coastal Engineer - sub-branch of civil engineering that focuses on coastal systems and structures that interact with shorelines and water bodies
Mechanical Engineer - engineering field that focuses on mechanical and thermal systems used in technical applications
AUTONOMOUS UNDERWATER VEHICLE (AUV)
Images: Unsplash
Electrical Engineer – engineering field that focuses on both electrical (power) systems and electronic (control systems)

Civil Engineer - engineering field that focuses on the built environment - in buildings, roads, bridges, water, and sewer systems
Environmental Engineer - engineering specialty that focuses on the natural environment’s integration with the built environment - often finding innovative ways to accomplish project objectives while addressing problems such as runoff or contamination
22 ©2023 The NEED Project Exploring Marine Hydrokinetics www.NEED.org
Cable Technician - specialized technician who is responsible for installing and terminating cable systems connecting the devices to each other and to shore
GIS / Mapping Technician - specialized technician who is responsible for providing geographic characterization of the natural environment and precise location of technical systems installed within it
Inspection Technician / Drone Pilot/ AUV operator - specialized technician trained to inspect technical systems by operating robotic drone systems with digital video cameras on-board
Vessel Crew/Mariner - captains, deck hands, and vessel engineers (on larger vessels) execute shipping, construction, and research missions in oceans and rivers
Welders - specialized technicians that are trained to join metals through a variety of technologies and sometimes below the surface of bodies of water, can be land-based or a certified, specialized welding diver
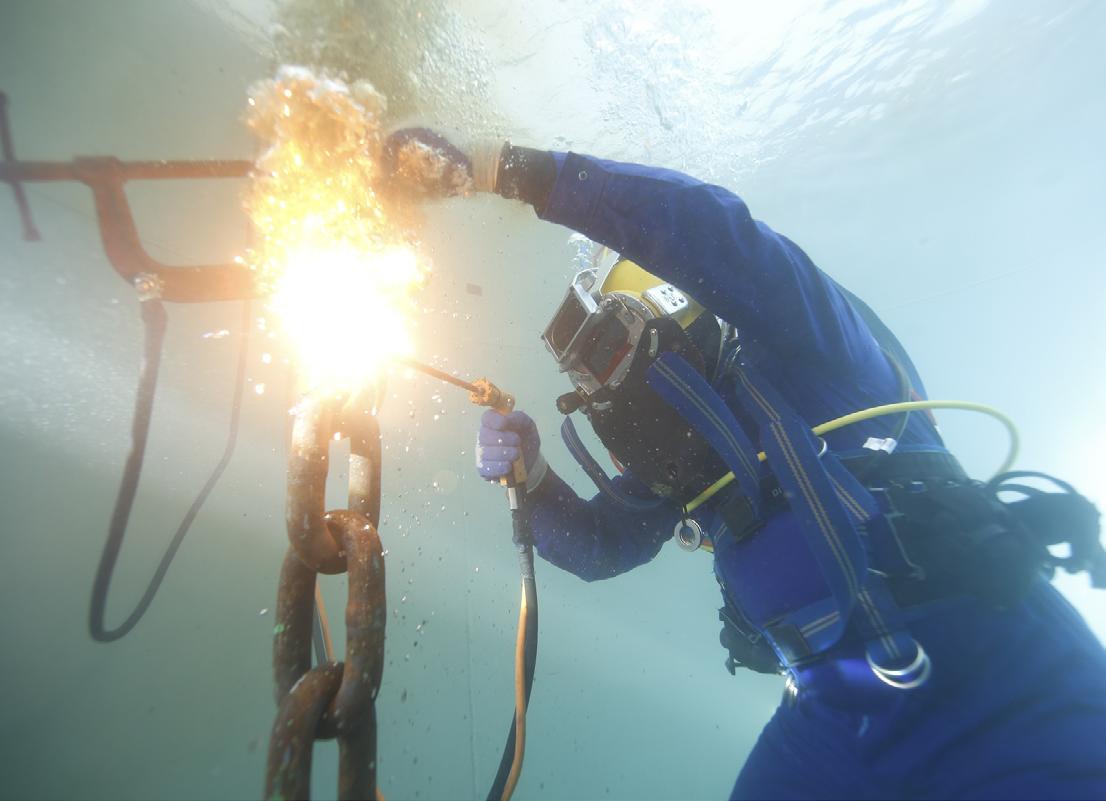
Diver - professionals who work under water to inspect, document and repair systems
Outside Machinist - professional mechanic capable of installing mechanical systems on vessels
Fabricator / Shipfitter - specialized technician that prepares and machines large metal parts to assemble
Painter / Coatings Specialist - specialized technician that deals with the application of primers, paints and other coating systems to protect system components
Rigger / Payload Specialist - specialized technician that deals with safely and efficiently moving and securing loads that are in transport or that are being made into larger assemblies during construction
Project Manager - professional manager that oversees the entire project, from beginning to end, including the integration of the component systems
Project Analyst - professional analyst who reports to the Project Manager and prepares detailed analysis and intelligence on specifically assigned parts of the project
Administrative Support Staff - office professionals that support and enable the work of the team to proceed.
©2023 The NEED Project Exploring
www.NEED.org 23
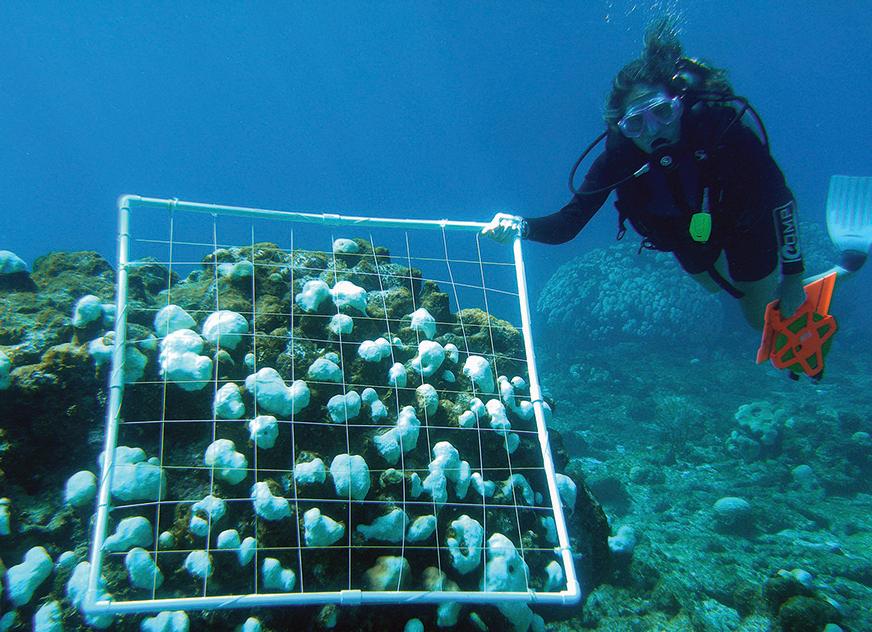
Marine Hydrokinetics
SCUBA DIVER
Image courtesy of Wikimedia Commons
MARINE RESEARCH VESSEL
Image courtesy of NOAA
WELDER
Image courtesy of Wikimedia Commons
Forms and Sources of Energy
24 ©2023 The NEED Project Exploring Marine Hydrokinetics www.NEED.org
Biomass Wind Hydropower Solar _______________________ Geothermal
Petroleum Natural Gas Coal Uranium Propane What percentage of the nation’s energy is provided by each form of energy? Chemical _____ Nuclear _____ Motion _____ Radiant _____ Thermal _____ What percentage of the
energy is provided by nonrenewables? ______ by renewables? ______ In the United States we use a variety of resources to meet our energy needs. Use the information below to analyze how each energy source is stored and delivered. Look at the U.S. Energy Consumption by Source graphic below and calculate the percentage of the
energy use that each form of energy provides. Using
graphic below, determine how energy is stored or delivered in each of the sources
energy. Remember,
the source of energy must be burned, the energy is stored as chemical energy.
RENEWABLE
NONRENEWABLE
nation’s
nation’s
the
of
if
**Total
Data:
Uses:
Uses:
Uses:
Uses:
Uses:
Uses:
8.89% Uses:
Uses:
U.S. Energy Consumption by Source, 2020
Uses:
*Propane
petroleum
does not add up to 100% due to independent rounding.
Energy Information Administration BIOMASS 4.88%
heating, electricity, transportation COAL 9.89%
electricity, manufacturing GEOTHERMAL 0.23%
heating, electricity HYDROPOWER 2.79%
electricity PETROLEUM 34.73%
transportation, manufacturing - includes propane PROPANE
heating, manufacturing URANIUM
electricity WIND 3.24% Uses: electricity SOLAR 1.34%
heating, electricity RENEWABLE NONRENEWABLE
NATURAL GAS 33.99%
heating, manufacturing, electricity - includes propane
consumption is included in
and natural gas totals.
Electric
Almost forty percent of the nation’s energy is used to make electricity today. Experts predict that this figure will continue to increase. The U.S. uses more electricity each year to meet its energy needs as we depend on more technology. The U.S. demand requires many energy sources be used to generate electricity. Some energy sources produce a substantial amount of the electricity we consume, while others produce less than one percent.
Individual Instructions
Your task is to rank the ten sources of energy in order of their contribution to U.S. electricity production. Place a number one by the source that provides the largest amount of electricity, a number two by the source that provides the second largest, down to a number ten by the one that provides the least amount of electricity. Use critical reasoning skills to determine the order. Remember to rank by electricity generation only, not by total energy production.
Group Instructions
Starting at the top of the list, ask members to contribute any knowledge they have about each energy source. Brainstorm by asking group members questions such as:
Is this source limited to a certain area of the country?
Are there any problems or limitations associated with this source?
Have you ever seen a power plant that uses this particular source of energy?
One person in the group should take notes. Once the group has gone through the list, it should divide the ten energy sources into three levels of importance: the top three most significant energy sources, the middle four moderately significant energy sources, and the bottom three least significant energy sources. The group should then rank the ten sources of energy in order of their contribution to U.S. electricity production.
©2023 The NEED Project Exploring Marine Hydrokinetics www.NEED.org 25
GAME
SOURCES USED TO GENERATE ELECTRICITY SOURCE YOUR RANK GROUP RANK BIOMASS COAL GEOTHERMAL HYDROPOWER NATURAL GAS PETROLEUM PROPANE SOLAR URANIUM WIND
Connections
INSTRUCTIONS
Electric Connections U.S. ELECTRIC POWER GENERATION SOURCES
SOURCES USED TO GENERATE ELECTRICITY
SOURCE STATISTICS
BIOMASS
COAL
GEOTHERMAL
In 2020, biomass produced 56.1 billion kilowatt-hours of electricity, 1.40 percent of the nation’s total. Biomass electricity is usually the result of burning wood waste, landfill gas, and solid waste.
90 percent of the nation’s coal is consumed by electric utility companies to produce electricity. In 2020, coal produced 773.8 billion kilowatt-hours of electricity, which was 19.30 percent of the nation’s electricity.
In 2020, geothermal power plants produced 16.9 billion kilowatt-hours of electricity, mostly from facilities in the western U.S. Geothermal energy produced 0.42 percent of the nation’s electricity.
HYDROPOWER
NATURAL GAS
7.13 percent of U.S. electricity is generated by 2,500 hydro plants nationwide. Hydro plants produced 285.8 billion kilowatt-hours of electricity in 2020.
Natural gas produced 1,616.7 billion kilowatt-hours of electricity in 2020, generating 40.33 percent of the nation’s electricity. Natural gas is used by turbines to provide electricity during peak hours of demand.
PETROLEUM
PROPANE
Petroleum provided 0.44 percent of U.S. electricity, generating 17.5 billion kilowatt-hours of electric power in 2020.
There are no statistics available for propane’s contribution to electricity generation. Very little propane is used to produce electricity.
SOLAR
URANIUM
Solar energy provided about 2.27 percent of U.S. electricity in 2020, amounting to 90.9 billion kilowatt-hours of electricity. Electricity was generated by solar thermal systems or photovoltaic arrays.
94 nuclear reactors provided the nation with 19.7 percent of its electrical energy needs in 2020. Nuclear energy produced 789.9 billion kilowatthours of electricity.
WIND
Wind energy produced 337.5 billion kilowatt-hours of electricity in 2020, providing 8.42 percent of the nation’s electricity. Most of the windgenerated electricity is produced in Texas, Iowa, and Oklahoma.
Error points are the absolute difference between your ranks and EIA’s (disregard plus or minus signs).
Data: Energy Information Administration, Annual Energy Report
RANK YOUR RANK ERROR POINTS GROUP RANK ERROR POINTS
ERROR POINTS TOTALS
SCORING:
0-12 Excellent 13-18 Good 19-24 Average
25-30 Fair 31-36 Poor 37-42 Very Poor
26 ©2023 The NEED Project Exploring Marine Hydrokinetics www.NEED.org
Measuring Electricity: Sample Calculations
Example 1: Calculating Voltage
If household current is 6 amps and the resistance of an appliance is 20 ohms, calculate the voltage. To solve for voltage, use the following equation: voltage = current x resistance (V = I x R).
Voltage = A x Ω V = 6 A x 20 Ω = 120 V
Example 2: Calculating Current
The voltage of most residential circuits is 120 volts. If we turn on a lamp with a resistance of 60 ohms, what current would be required? To solve for current, use the following equation: current = voltage / resistance (I = V / R).
Current = V / Ω I = 120 V / 60 Ω = 2 A
Example 3: Calculating Resistance
A car has a 12-volt battery. If the car radio requires 0.5 amps of current, what is the resistance of the radio? To solve for resistance, use the following equation: resistance = voltage / current (R = V / I).
Resistance = V / A R = 12 V / 0.5 A = 24 Ω
Example 4: Calculating Power
If a 6-volt battery pushes 2 amps of current through a light bulb, how much power does the light bulb require? To solve for power, use the following equation: power = voltage x current (P = V x I).
Power = V x A P = 6 V x 2 A = 12 W
Example 5: Calculating Voltage
If a 3-amp blender uses 360 watts of power, what is the voltage from the outlet? To solve for voltage, use the following equation: voltage = power / current (V = P / I).
Voltage = W / A
V = 360 W / 3 A = 120 V
Example 6: Calculating Current
If a refrigerator uses power at a rate of 600 watts when connected to a 120-volt outlet, how much current is required to operate the refrigerator?
To solve for current, use the following equation: current = power / voltage (I = P / V).
Current = W / V
I = 600 W / 120 V = 5 A
Example 7: Calculating Electrical Energy and Cost
If a refrigerator uses power at a rate of 600 watts for 24 hours, how much electrical energy does it use? To solve for electrical energy, use the following equation: energy = power x time (E = P x t).
Electrical Energy = W x h
E = 600 W x 24 h = 14,400 Wh x (1 kW/1,000 W) = 14.4 kWh
If the utility charges $0.13 a kilowatt-hour, how much does it cost to run the refrigerator for 24 hours? To calculate cost, use the following equation: cost = energy x price.
Cost = 14.4 kWh x $0.13/kWh = $1.87
©2023 The NEED Project Exploring Marine Hydrokinetics www.NEED.org 27
28 ©2023 The NEED Project Exploring Marine Hydrokinetics www.NEED.org Measuring Electricity
VOLTAGE = CURRENT X RESISTANCE 1.5 V = ______ A x 3 Ω ______ V = 3 A x 4 Ω 120 V = 4 A x ______ Ω 240 V = ______ A x 12 Ω
2 POWER = VOLTAGE X CURRENT 27 W = 9 V x ______ A ______ W = 120 V x 1.5 A 45 W = ______ V x 3 A ______ W = 120 V x 2 A
APPLIANCE POWER = VOLTAGE X CURRENT TV 180 W = 120 V x ______ A COMPUTER 40 W = 120 V x ______ A PRINTER 120 W = 120 V x ______ A HAIR DRYER 1,000 W = 120 V x ______ A TABLE 4 POWER X TIME = ELECTRICAL ENERGY (kWh) X PRICE = COST 5 kW x 100 h = x $0.13 = $ ______ 25 kW x 4 h = x $0.13 = $ ______ 1,000 W x 1 h = x $0.13 = $ ______
TABLE 1
TABLE
TABLE 3
Station One
? Question
How will electric current passing through a wire affect a compass?
Hypothesis
In your science notebook, write a hypothesis stating how you think electric current passing through a wire will affect a compass.
Materials
9-volt Battery Compass Alligator clip Nail
Procedure
1. Take the nail and hold it next to the compass. Move the nail around over the compass and observe the interaction. Record your observations in your science notebook.
2. Connect one end of the alligator clip to the negative terminal of the 9-volt battery.
3. Wrap the wire of the alligator clip around the nail, starting at the flat end or head of the nail, and moving towards the pointed end. Leave enough wire to reconnect the battery.
4. Connect the other alligator clip to the positive terminal of the 9-volt battery.
5. Hold the pointed end of the nail near the compass. Observe the interaction. Record your observations in your science notebook.
6. Hold the flat end or head of the nail near the compass. Observe and record the interaction.
Discussion
1. What did the electric current create when it passed through the wire around the nail?
2. What are the two poles of a magnet called?
3. Which pole was the flat end of the nail? Which pole was the pointed end of the nail? Support your answer with your observations.
4. How do the parts of an electromagnet work together to create magnetism?
5. Will you accept or reject your hypothesis? Upon what experimental evidence are you basing your conclusion?
©2023 The NEED Project Exploring Marine Hydrokinetics www.NEED.org 29
PART ONE: ELECTROMAGNET AND COMPASS
Station One
PART TWO: MOTORS AND GENERATORS
? Question
How are electricity, magnetism, and motion related?
Hypothesis
Write a hypothesis stating what you think about the relationship between electricity, magnetism, and motion.
Materials
Two motors
Two alligator clips 9-volt Battery Disassembled motor Masking tape
Procedure
1. Fold a piece of tape like a flag onto the shaft of the assembled motor and put an X on one side.
2. Connect the terminals of one of the assembled motors to the 9-volt battery with the alligator clips. What happens? Make observations in your science notebook.
3. Connect the alligator clips to opposite terminals of the battery. Observe and illustrate your observations. (Hint: pay attention to the direction of the spinning motor shaft.)
4. Look at the disassembled motor. Remove the rotor (coil of wire and magnets). Record and illustrate the disassembled motor and label the parts in your science notebook.
5. Connect the terminals of the two assembled motors to each other using alligator clips (no battery is involved here). Grasp the shaft of the motor without tape and give it a hard, swift spin, observing the tape on the shaft of the other motor. Record your observations.
6. Using the assembly from step #5, turn the shaft in the opposite direction and observe the tape. Record your observations. Make a diagram in your science notebook, indicating the direction the taped shaft spins according to the direction of the motor without tape.
Discussion
1. What energy transformation occurs in this activity?
2. What happened to the motion of the motor when the clips on the battery were swapped? Explain what is occurring in the battery to cause this.
3. Think back to when the two motors were hooked together. What happened to the direction of the shaft on the second motor when you reversed the turn on the first? Explain why this occurred.
4. Will you accept or reject your hypothesis? Upon what experimental evidence are you basing your conclusion?
30 ©2023 The NEED Project Exploring Marine Hydrokinetics www.NEED.org
&Background
For electrons to flow through a wire, the wire must make a complete path or circle. This path is called a circuit. A battery produces electricity, or moving electrons, only when it is part of a circuit. You can add or create a switch to a circuit to open and close the path. You can also add a load to the circuit so that the electricity can do work as it flows through the circuit. A light bulb is an example of a load. ? Question
Hypothesis
Read the procedure and record your hypothesis.
Procedure
1. Separate your dough into two smaller chunks. Roll each chunk into a round, elongated shape more like a wire. 2. Attach the battery to the battery clip. Take the uncoated ends of the wires on the battery clip and attach each to a dough “wire.”
3. Insert each end of an LED into each of the dough wires to complete or close your circuit.
4. Does your bulb light up? If not, troubleshoot and look for loose connections. LEDs have one longer and one shorter lead. One is the anode, and one is the cathode. Does this matter? Try switching the ends of your bulb in the circuit. What happens?
5. Draw a diagram or take a picture of your completed, closed circuit. Label which direction you think the current is flowing.
6. Create a switch by slicing or tearing one of your dough wires. Open and close the switch.
7. Given the images and background information above, describe what is wrong in each scenario and how to remedy and complete each “broken” circuit.
©2023 The NEED Project Exploring Marine Hydrokinetics www.NEED.org 31
Station Two CIRCUIT PART 1
1
1
1
A
How can you tell a circuit is complete? Materials
9-volt Battery
Battery clip
Ball of conductive dough
few LED lights
A B
Station Two CIRCUIT PART 2
& Background
There are many different ways to make circuits. You might want to connect several loads or power sources in one circuit. Computers have millions of circuits connected together. One way to connect power sources, loads, and switches is in a series circuit. In series circuits, electricity flows through all of the parts of a circuit in one loop.
Another way to connect power sources, loads, and switches is in a parallel circuit. In parallel circuits, there are separate circuits within the larger circuit, oriented in parallel to each other. If there is one power source and more than one load, each of the loads is connected to the power source separately. Part of the power source goes to each load.
? Questions
How are loads affected when wired in series? How are parallel circuits different from series circuits?
Materials
1 9-volt Battery
1 Battery clip
1 Ball of dough
A few LED lights
Hypothesis
Read the procedure and record your hypothesis.
Procedure
Two light bulbs in series
Two light bulbs in parallel
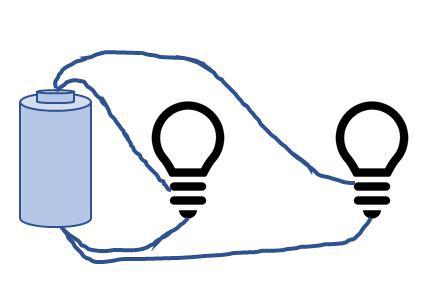
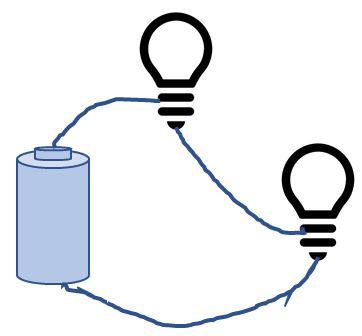
1. Separate your dough into several chunks. You may need to reshape and reform your dough to complete the steps as you go.
2. Create a series circuit using two LEDs, wired in one, continuous loop. Problem solve until both are lit. Record any changes you might notice in the LED bulb compared to the circuit with only one LED bulb in the loop. Is there a difference in brightness between the two LEDs? Explain why you might see differences in the Part 1 activity and Part 2 activity so far, and why there might even be differences between the loads.
3. Remove an LED. What happens?
4. Create a series circuit using three LEDs. What changes do you observe in comparison to two LEDs? Draw a diagram or take a picture of your completed series circuit with three loads. Label the direction of the current.
5. Build a parallel circuit using two LEDs parallel to each other, rather than in a loop. Problem solve until both are lit. What differences do you notice between series and parallel circuits with two loads? Do you notice any differences in the LEDs and their brightness? Explain any observations.
6. Add another LED to your parallel circuit, so you have three LEDs in parallel. Describe and explain any observations. Draw a diagram or take a picture of your completed parallel circuit with three loads. Label the direction of the current.
7. Remove an LED. What happens? How is this different than with the series circuit? Why?
Extensions
Design an experiment to test battery life in series and parallel circuits.
Join forces with another group and create a circuit with several power sources and loads wired in series. What do you observe?
Create a mixed circuit that uses power sources wired in series and LEDs as loads wired in parallel. Open and close switches and note what you see happening to bulbs with different switches.
32 ©2023 The NEED Project Exploring Marine Hydrokinetics www.NEED.org
Wave Basics Notes
Watch the video https://youtu.be/ UMC1EI-2sLo and take notes below before beginning the activities on wave motion.
? Question: How do waves move?
Mechanical Waves
• Wave: An _______________________ or vibration accompanied by a transfer of _______________________ that travels through _______________________ or _______________________.
• Medium: An intervening _______________________, such as air or _______________________, through which a _______________________ can _______________________ its _______________________. • Energy is _______________________, but the _______________________ does move along the _______________________ of the wave.
Transverse Waves
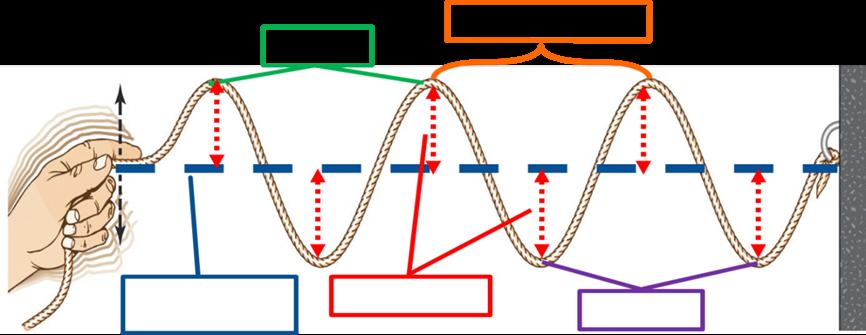
Transverse Wave: A wave vibrating _______________________to the ______________________it is ______________________ in a ________________ curve shape. _______________________and _______________________waves travel as transverse waves. _______________________: The midline of a wave. The _______________________of the wave’s _______________________position. _______________________: The _______________________point on a wave. _______________________: The _______________________point on a wave. _______________________: The _______________________between successive _______________________of a wave. Amplitude: The _______________________between a _______________________or _______________________and the _______________________. Based on the amount of _______________________in the _______________________. More _______________________ = Bigger
Longitudvinal Waves
Longitudinal Wave: A wave _______________________in the _______________________direction it is _______________________. _______________________ waves travel in this pattern. _______________________: A region in a _______________________wave where the particles are _______________________together. _______________________: A region in a _______________________wave where the particles are _______________________part. Wavelength: The _______________________between two _______________________compressions or two consecutive _______________________.
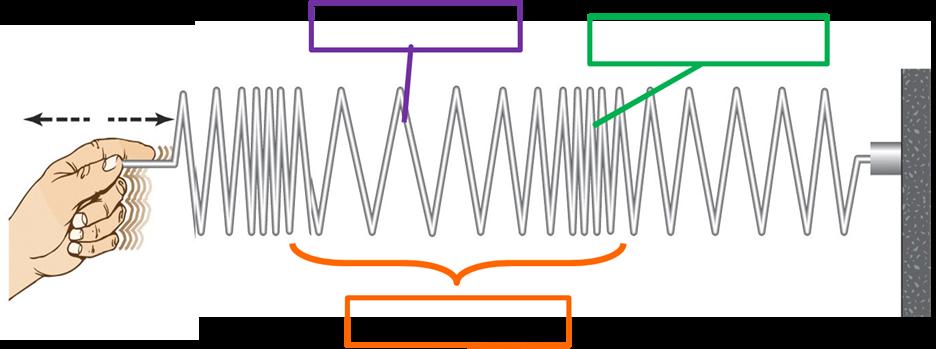
©2023 The NEED Project Exploring Marine Hydrokinetics www.NEED.org 33
Wave Speed Labs
WAVE SPEED A: AMPLITUDE
? Question
Does the amplitude of a wave affect its speed?
Hypothesis
In your science notebook write a hypothesis to address the questions below.
1. What does a wave carry?
2. Does the amplitude of a wave affect its speed? Why?
Procedure
1. Go to the PHET Wave on a String Simulator: https://phet.colorado.edu/en/simulations/wave-on-a-string
2. Click the play button.
3. Move DAMPING to “None”
4. Click on PULSE mode (not MANUAL or OSCILLATE)
5. Click on NO END (not LOOSE END or FIXED END)
6. Lower the TENSION to “Low.”
7. Click on SLOW MOTION.
8. Click the check box next to “Rulers” and “Timer.”
9. Change the AMPLITUDE to 0.15 cm.
10. Click the green “^” button and observe the pulse’s velocity.
11. Measure how far the wave travels in 1 second’s time. If you divide this by 1 second, you’ll have your wave’s speed in cm/s. Fill the data into the chart.
12. Repeat steps 9-11 for a 0.65 cm and 1.25 cm AMPLITUDE.
Data
Amplitude
Speed (cm/s)
Conclusion
0.15 cm 0.65 cm 1.25 cm
1. Does the amplitude of a wave affect its speed? Explain how you know.
34 ©2023 The NEED Project Exploring Marine Hydrokinetics www.NEED.org
Wave Speed B
PULSE WIDTH
? Question:
Does the pulse width of a wave affects its speed?
Hypothesis
In your science notebook write a hypothesis to address the questions below.
1. As wavelength increases, what happens to the wave’s frequency?
2. A wave with a large frequency most likely has a ____________________ wavelength.
3. Does the wavelength of a wave affect its speed?
Procedure
1. Go to the PHET Wave on a String Simulator: https://phet.colorado.edu/en/simulations/wave-on-a-string
2. Click the play button.
3. Move DAMPING to “None”
4. Click on PULSE mode (not MANUAL or OSCILLATE)
5. Click on NO END (not LOOSE END or FIXED END)
6. Lower the TENSION to “Low.”
7. Click on SLOW MOTION.
8. Click the check box next to “Rulers” and “Timer.”
9. Change the PULSE WIDTH to 0.25 s.
10. Click the green “^” button and observe the pulse’s velocity.
11. Measure how far the wave travels in 1 second’s time. If you divide this by 1 second, you’ll have your wave’s speed in cm/s. Fill in the data table below.
12. Repeat steps 9-11 for a 0.6 s and 1.00 s Pulse Widths.
Data
Pulse Width (1/2 Wavelength) 0.25 s 0.6 s 1.00 s Speed (cm/s)
Conclusion
1. Does the pulse width of a wave affect its speed? Explain how you know.
©2023 The NEED Project Exploring Marine Hydrokinetics www.NEED.org 35
Exploring Ocean Current Formation
? Question:
How do temperature differences affect ocean current formation?
Hypothesis
In your science notebook, write a statement predicting how temperature differences in a large body of water affect ocean current formation.
Materials
Clear rectangular plastic container Thermometer
Salt Food coloring Transfer pipette Water Ice Hot plate or hot pot 50 mL beaker or similarly sized cup
Procedure
1. Copy the data table into your science notebook, leaving space to record your observations.
2. Fill the large plastic container with water and allow it to warm or cool to room temperature. Your teacher may have done this for you already. Record the temperature of the water in the data table.
3. Obtain approximately 50 mL of ice water, room temperature water, or hot water using the beaker or cup. Record its temperature in the data table.
4. Add several drops of food coloring to the beaker or cup of water, mixing thoroughly. Make sure the water in the cup is dark enough to be easily seen.
5. Fill the transfer pipette with colored water by squeezing the bulb, then lowering the tip beneath the surface of the colored water. Invert the pipette and squeeze just until all the air is pushed out. While keeping the bulb squeezed, lower the tip beneath the surface of the colored water and release, completely filling the pipette.
6. Insert the tip of the transfer pipette into the large container of water until the tip is approximately halfway between the bottom of the container and the surface of the water.
7. Squeeze the bulb of the transfer pipette to release the colored water and observe what happens. Take a picture or short video clip of the trial if you are able.
8. Dump the beaker or cup of colored water and move on to the next temperature of water.
9. Repeat steps 3-8 for the remaining variables (ice water, room temp., and hot).
10. Repeat this process again, but this time stir 1-2 spoonfuls of salt into the beaker or small cup of water, adding and stirring salt until no more salt will dissolve. This is to make a saturated solution of salt. Your teacher may have already done this for you. You will add food coloring to this saturated salt water and repeat the process outlined in steps 2-9.
11. Clean everything up and return or dispose of materials according to your teacher’s directions.
36 ©2023 The NEED Project Exploring Marine Hydrokinetics www.NEED.org
CONTINUED ON NEXT PAGE
Data and Observations
Copy the following data table into your notebook, leaving plenty of space for your observations.
Temperature of water in large container Temperature of water in small beaker or cup
°C °C
°C °C
°C °C
Fresh water in beaker or cup
Observations
Salt water in beaker or cup
°C °C
°C °C °C °C
Conclusions
1. Did you notice any evidence of currents forming in your container? How do you know?
2. How are density and water temperature connected to currents? What did you observe to make the connection?
3. How is salinity connected to currents? What did you observe to make the connection?
©2023 The NEED Project Exploring Marine Hydrokinetics www.NEED.org 37
MHK Researcher Organizer
38 ©2023 The NEED Project Exploring Marine Hydrokinetics www.NEED.org
Important Information Graphics Needed Additional Information Needed Design of Presentation Topic
Site Assessment Challenge
&Background
Just like when considering where to install large scale solar or wind projects, there are many factors that must be considered when siting marine hydrokinetic systems. Six main factors should be considered:
Resource density (wave power density) Market size
Energy price (an estimate of avoided energy cost in the market) Distance to transmission Shipping cost
Water depth
Conditions are rarely perfect, and tradeoffs must be considered. Thus, being able to gather as much information as possible to support our decisions is critical.
Procedure
1. In this activity your team will analyze possible sites for installation of a marine hydrokinetic system and determine the best site and the best technology for a project based on the information available. Since residents of Hawaii have the highest average residential cost for electricity, we will focus on sites in this state (https://www.eia.gov/electricity/state/).
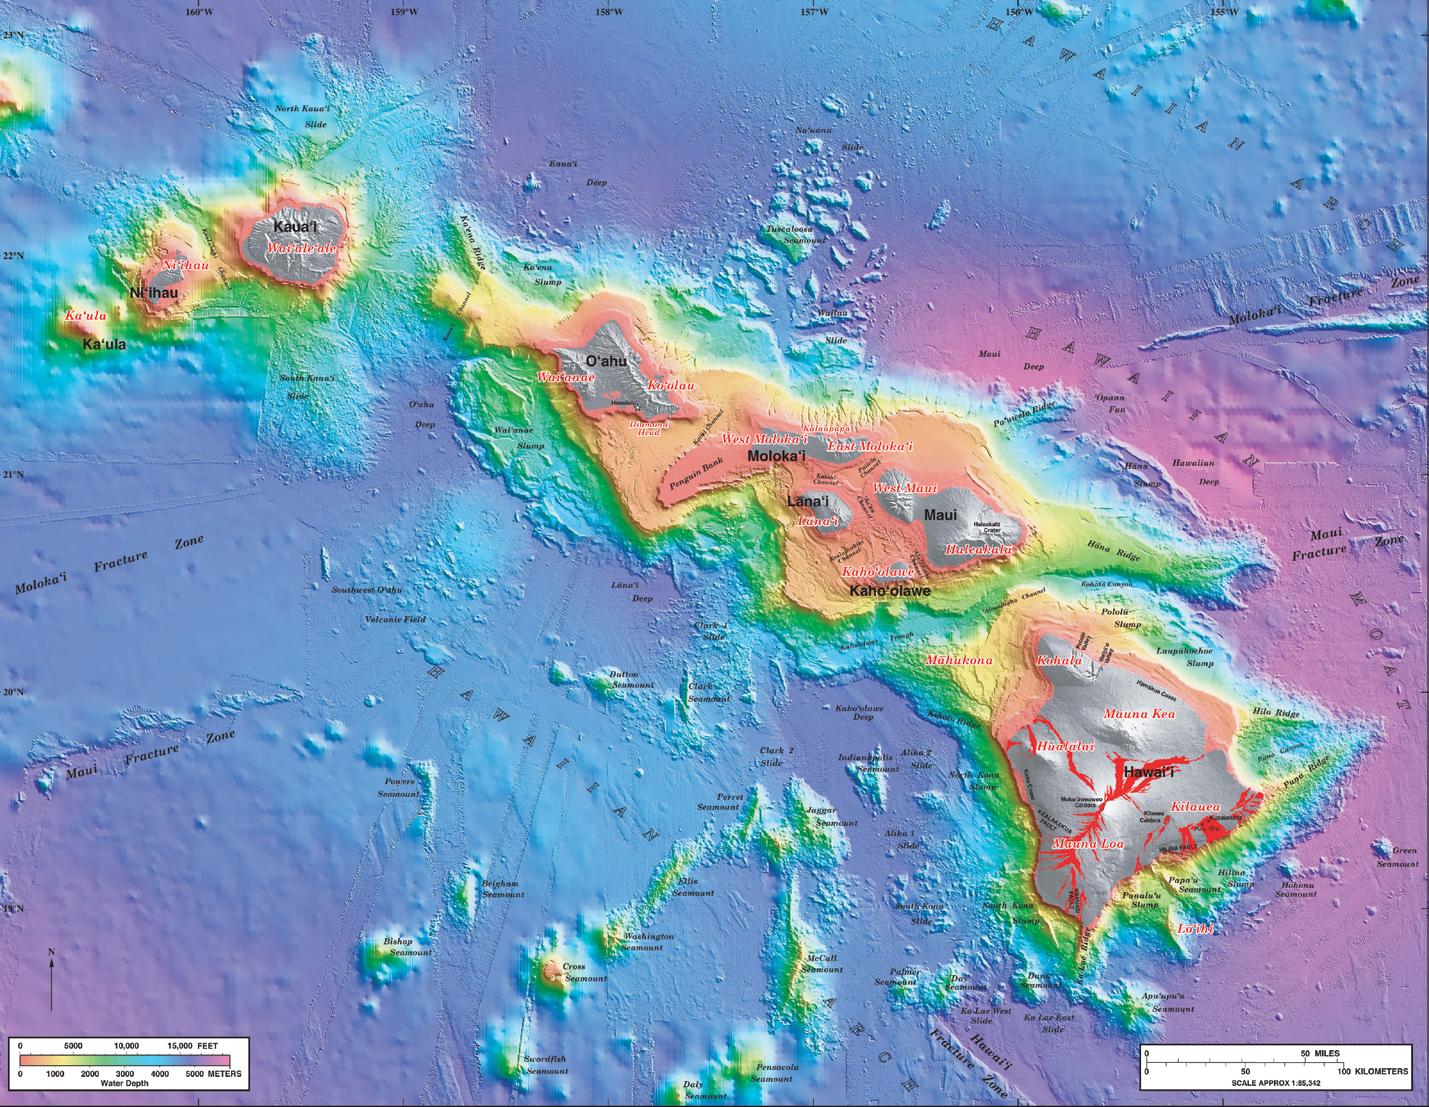
2. To simplify this process, you are limited to the following options of current energy converters for your choice of technology for deployment:
Horizontal axis in stream turbines Ducted turbines
Non-ducted turbines
Horizontal axis transverse turbines Kite-like turbines
Screw type turbines
3. Consider the following maps. Given the data on the maps, select a type of device to deploy, a location within the Hawaiian Islands to deploy the device, and create a list of information a project development and management team would still need to consider before selecting the site and beginning construction.
Figure 1: Water Depth Map
©2023 The NEED Project Exploring Marine Hydrokinetics www.NEED.org 39
CONTINUED ON NEXT PAGE
Figure 2: Location of transmission lines
Figure 3: Near Surface Current
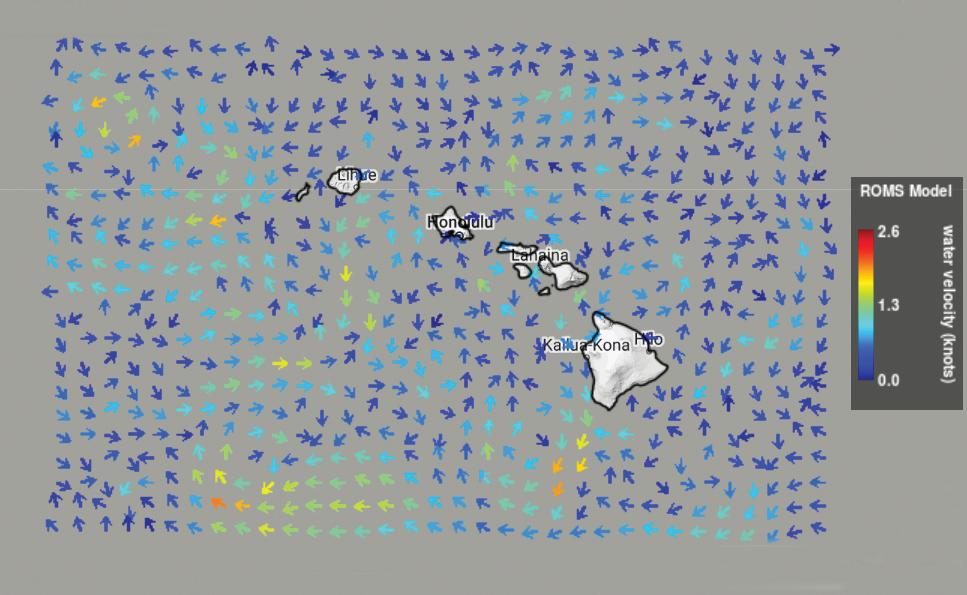
? Questions
1. What device are you selecting and why?
2. What location are you selecting?
3. What additional information would you advise a project manager consider before making the final decision on this project?
Figure 4: Population Density Map
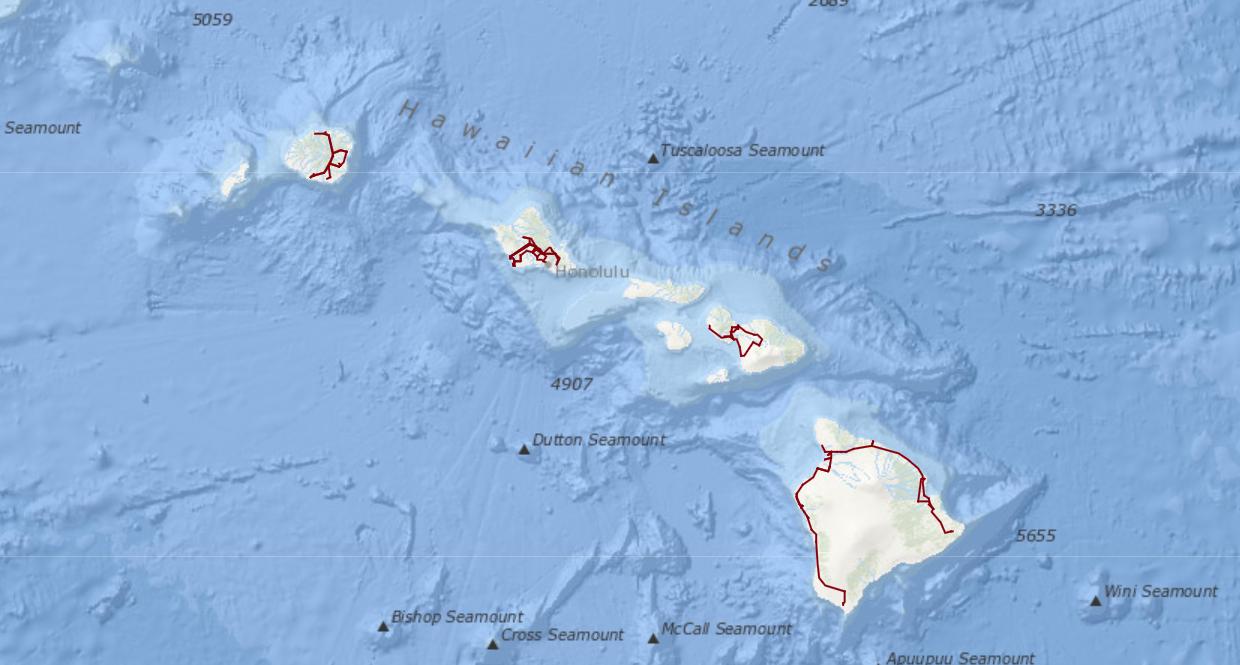
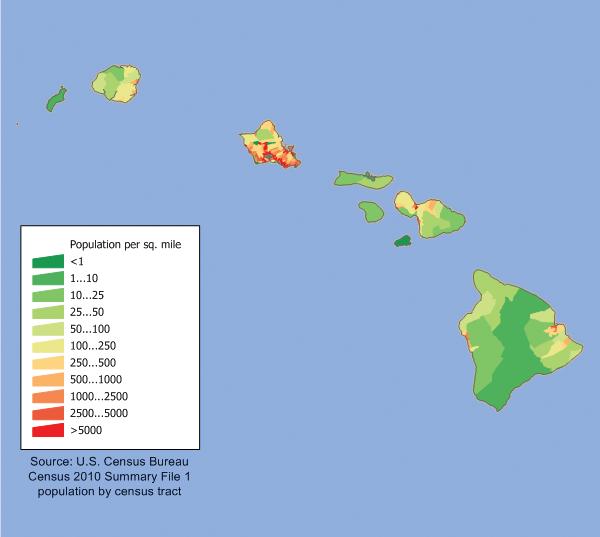
40 ©2023 The NEED Project Exploring Marine Hydrokinetics www.NEED.org
MHK Case Study and Hearing
&Background
When new infrastructure is to be added, or aging infrastructure is to be removed, it is important for all stakeholder opinions to be considered. Often times the decision to add new energy infrastructure is made looking through one lens: economics. However, there are often several lenses with which to view the decision to add new energy technologies – could it become a policy issue, or an environmental issue, or even a social issue? It is becoming more common to hold community meetings, hearings, or public comment sessions when deploying new energy technologies, power plants, or infrastructure, so that development teams and communities have an opportunity for all stakeholder opinions to be considered.
Procedure
1. Read the case study. Followed by the article.
2. Given your assigned group and stakeholder group, research your position. Consult the resource list provided and be sure to cite any additional resources where necessary. Divide up links and resources as a team. Complete the research chart on the next page.
3. Discuss your findings with your group and prepare your arguments and anticipate Q&A during the public hearing. Everyone in your group must be prepared to speak and given an opportunity to speak.
Each group will prepare a short introductory statement (2-3 sentences).
Each group should prepare for potential questions that might be posed to your group by regulators. Construct and practice responses.
When giving an answer, aim to give only the answer to the question, and not extra facts or unrelated information.
Make sure you are able to cite or reference any sources within your answer.
Each group should prepare for rebuttals, when “attacked” by another stakeholder group’s answers. Consider the other groups’ viewpoints and prepare rebuttals to their answers.
When stating a rebuttal, you will only have 30 seconds to begin to speak. Your rebuttal may ONLY pertain to the answer given and not diverge into other information. If you speak about something unrelated, regulators will stop you from speaking and yield to the next group.
2 Case Study
Emma, Max, and Aqakuktuq (Akkie to his friends) were about to finish their junior year at the University of Georgia. Emma and Max were born in Georgia, and Aqakuktuq was from Alaska. The three had been good friends since they met at freshman year orientation. Emma and Max were so interested in Akkie as he was Native American from the Inupiat tribe. Akkie told so many stories about Alaska. Max and Emma couldn’t wait to see this wonderful place, so different than Georgia. Akkie’s parents had invited Emma and Max to come and stay in Nikiski, Alaska, their home for the summer. Akkie’s dad worked for Oceans Renewable in Igiugig. He is a machinist. However, in his heart he is a fisherman; he even chose Akkie’s name, Aqakuktuq means fisherman in the Inuit language. The three were looking forward to a summer of fishing, eating delicious meals and exploring the Cook Island ecosystems. June finally came and Max, Emma, and Akkie arrived in Nikiski. Akkie’s mom had prepared salmon for their dinner. As they chatted at the dinner table. Akkie’s mom, a news reporter at the local newspaper, told everyone about a story she was covering. She showed them an article on tidal power.
After reading the article, the three friends had so many questions. Emma wanted to know about environmental impacts. Max was interested in the economics surrounding the project. Akkie, an engineering student graduating in just one more year, was really interested in the design and a position with Ocean Renewables. All three students were worried about climate change and felt this was the biggest issue of their lives. Akkie’s parents discussed the possible political aspects the project. Would people protest? Akkie’s mom was preparing a story about a Hearing on this project. Emma, Max, and Akkie could hardly wait for this event, and each had already formed some preliminary opinions. All three decided to do more research and attend the hearing.
©2023 The NEED Project Exploring Marine Hydrokinetics www.NEED.org 41
SEE ARTICLE ON NEXT PAGE
Nikiski’s Tidal Power Potential
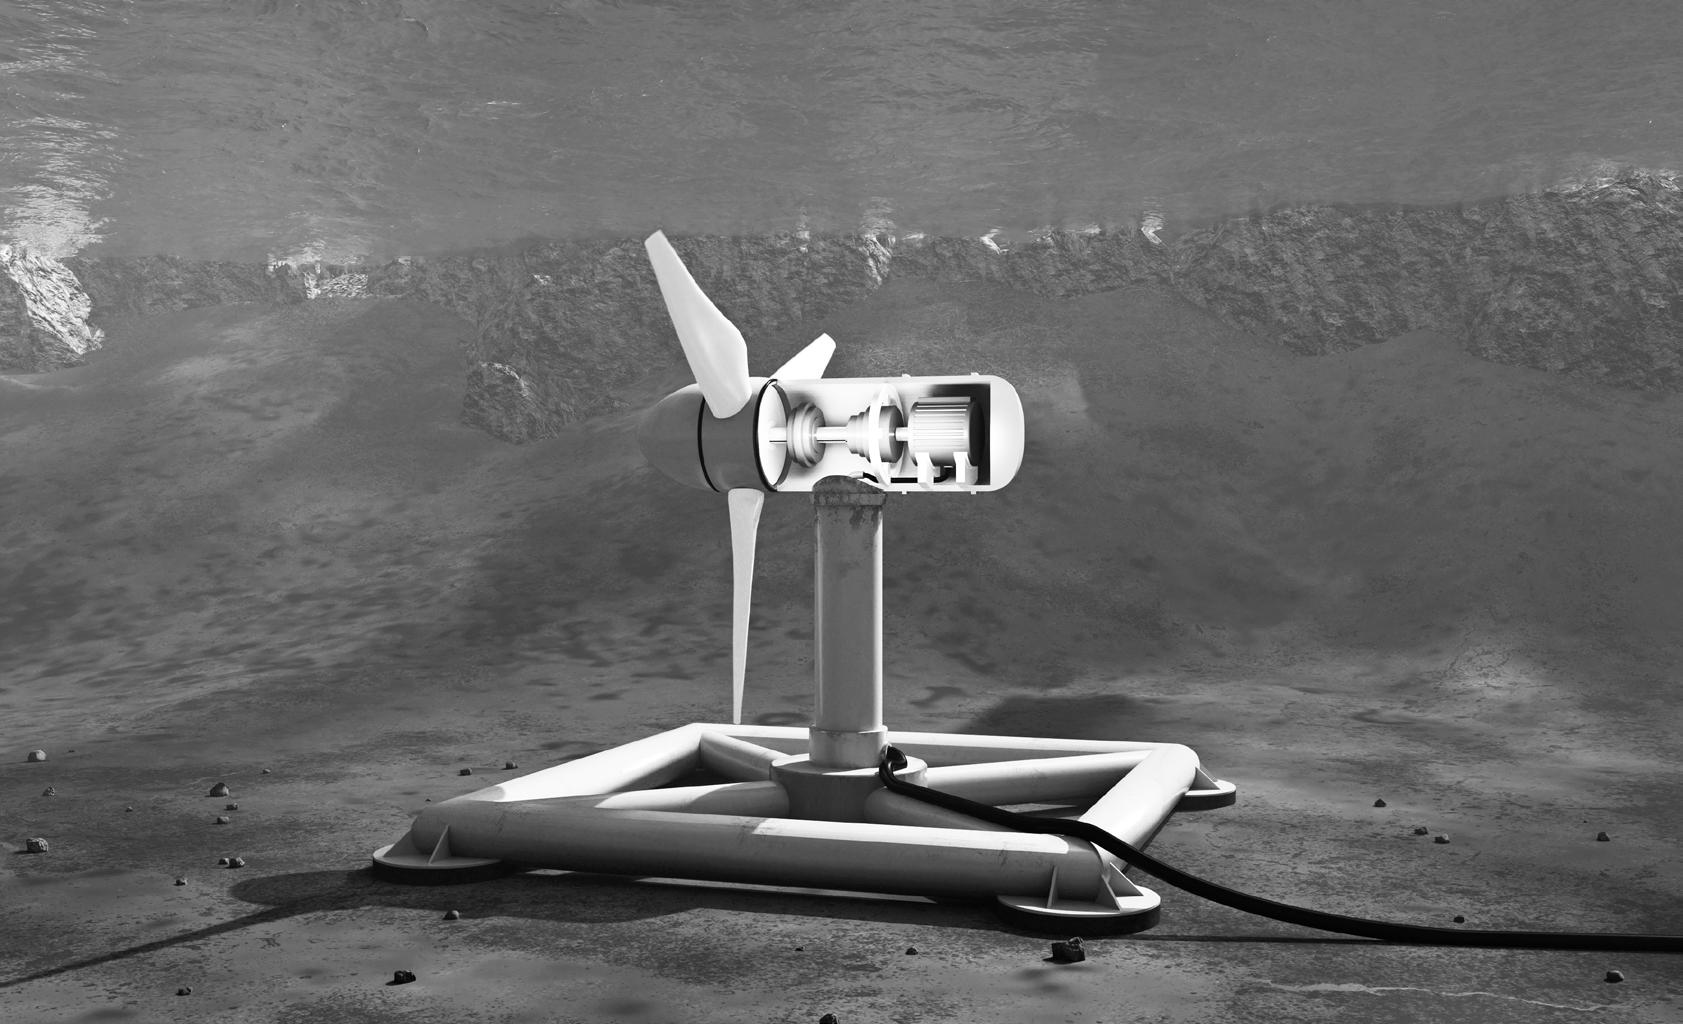
Staff Report
After studying the tides near Nikiski this summer, researchers said they’ve confirmed it would be a world-class place to put a tidal power generator. And they said the measurements they took will help them develop technology that can withstand the harsh conditions of Cook Inlet’s tides — some of the largest in the world.
Levi Kilcher, from Homer, was part of a team from the National Renewable Energy Laboratory that measured the velocity and turbulence of the East Foreland tides in Nikiski. He said at a virtual presentation Wednesday that the results are very promising, and there are strong currents at the site. Renewable energy advocates have been talking about turning Cook Inlet’s tides into energy for a while.
This spring, a Maine-based company filed a preliminary permit to start exploring the resource. Ocean Renewable Power Company said it hopes to have a generator in the water at the East Foreland in the next several years.
One variable that researchers measured this summer was the velocity of the tides. Velocity, Kilcher said, tells them how much power can be generated. The stronger the current, the greater the potential to generate power.
“Just in this little section of Cook Inlet, there’s the potential for like 100 megawatts or so,” he said. Kilcher said that shows the site is the right size for a project like Ocean Renewable’s. The company said it hopes to build its project up to 100 megawatts. That’s about a sixth of the Railbelt’s entire annual energy load.
Another key piece is tidal turbulence, to make sure the technology can withstand the harsh push and pull of the water.
“What they learned in the early days of the wind industry is that turbulence rattled the wind turbines and caused them to break and fail,” Kilcher said. “And so designing devices robust enough to handle the turbulent conditions is really important.” Kilcher said they’re still in the process of analyzing the turbulence they measured at the East Foreland site. He said he hopes the raw data and analysis will be out next year.
The technology Ocean Renewable plans to put in the water relies on the movement of the tides to spin turbines. Those turbines would then be connected to an underwater generator and would generate power from the tides moving in and out. The company already has a generator in the Kvichak River in Igiugig. Another company installed turbines in New York’s East River. But the technology is still on the newer side, especially for saltwater. And it’s not yet produced to scale,
like wind and solar technology, which makes it more expensive than its renewable counterparts.
Kilcher said he thinks the next step in tidal development is scaling up the technology to drive costs down. “And I think, as a former Alaskan and an Alaskan in my heart, that Cook Inlet would be a great place to demonstrate some of these technologies as they’re starting to scale up,” he said.
Historically, finding a market has been a challenge for power production companies. Multiple companies, including ORPC, have filed permits for power projects with the federal government that hasn’t come to fruition. But the Homer Electric Association is on board and says it will purchase the power generated by the project.
David Thomas leads the team at Homer Electric that’s looking at ways to get the utility to 50% renewable energy. The vast
majority of the utility’s power now comes from natural gas generated in Cook Inlet — not far from where Ocean Renewable plans to put the generator. He said proximity to existing structures is important for making new power projects affordable. That’s promising for the East Foreland site.
“Which is adjacent to the highway system and adjacent to our existing transmission lines,” Thomas said.
“And where those things — the resource, the transmission, the road infrastructure — come together is where you can make a project happen that otherwise might not pencil out.”
The company hopes to have a pilot device in the water in the next three years.
More information can be found at: https://www.ktoo.org/2021/11/19/ nikiskis-strong-currents-make-ita-world-class-site-for-tidal-powerresearchers-say/
42 ©2023 The NEED Project Exploring Marine Hydrokinetics www.NEED.org
Researchers: Cook Inlet’s tides make it a world-class site for new technology development
Image provided by NREL Tidal Turbine
Cook Inlet Energy - https://www.hartenergy.com/companies/cook-inlet-energy
Inlet Energy - https://inletenergy.com/
Cook Inlet Tribal Council - https://citci.org/
U.S. Energy Information Administration – www.eia.gov
Alaska Energy Fact Sheets
https://www.eia.gov/state/analysis.php?sid=AK
https://www.energy.gov/sites/default/files/2021-09/Alaska%20Energy%20Sector%20Risk%20Profile.pdf
Tidal Power Information
https://www.eia.gov/energyexplained/hydropower/tidal-power.php
Ocean Renewable Power Company - https://orpc.co/
Alaska Projects information - https://acep.uaf.edu/media/62507/ORPC-2011-AHTC-Presentation.pdf |
Nikiski Pilot Project
https://www.kdll.org/local-news/2021-04-09/nikiski-eyed-for-cook-inlet-tidal-energy-project
https://en.wikipedia.org/wiki/Nikiski,_Alaska
U.S Department of Energy, Water Power Technologies Office
https://www.energy.gov/eere/water/marine-energy-program
https://www.energy.gov/eere/water/marine-and-hydrokinetic-technology-development-and-testing
https://www.energy.gov/sites/default/files/2013/12/f5/51235.pdf
https://www.energy.gov/eere/water/downloads/marine-energy-united-states-overview-opportunities =
National Renewable Energy Laboratory (NREL)
https://maps.nrel.gov/marine-energy-atlas
PRIMRE - https://openei.org/wiki/PRIMRE
https://openei.org/wiki/PRIMRE/MRE_Basics
https://openei.org/wiki/PRIMRE/Databases/Projects_Database
U.S. National Park Service - Cook Inlet Ecology
https://www.nps.gov/articles/000/coastal-ecology.htm
National Oceanic and Atmospheric Administration (NOAA), Fisheries
https://www.fisheries.noaa.gov/action/critical-habitat-cook-inlet-beluga-whale
https://www.fisheries.noaa.gov/alaska/endangered-species-conservation/cook-inlet-beluga-whale-recoveryimplementation-task-force
Alaska Department of Fish and Game, Cook Inlet Management Area
https://www.adfg.alaska.gov/index.cfm?adfg=commercialbyareacookinlet.main
©2023 The NEED Project
www.NEED.org 43
Exploring Marine Hydrokinetics
:Research Links
Stakeholder group ______________________________________
Statements, data, and details that support your position Citation/Source
What are the other groups’ best arguments? How can you rebut?
Environmental Regulators Chart
Questions for Each Group
Which Group is Addressed: Pro or anti-Tidal
44 ©2023 The NEED Project Exploring Marine Hydrokinetics www.NEED.org Research
Chart
Model Wave Generator
? Question:
How can wave energy be captured to generate electricity?
Hypothesis
In your science notebook, write a statement predicting how temperature differences in a large body of water affect ocean current formation.
Materials
Clear plastic tubing 2 cylindrical magnets
Fishing line Hot glue gun Magnet wire
Pool noodle slice (3-4 cm thick) Sandpaper Fishing bobber Galvanometer
Waterproof duct tape
Anchoring mechanism or object Alligator clips
Procedure
Ruler Scissors or utility knife Marker
Tub of water (provided by teacher)
1. Test-fit the pool noodle slice over the plastic tubing. If the inner diameter of the pool noodle slice is too big to hold the tubing in place, wrap the top of the tubing with something waterproof to fill the gap between the tubing and the pool noodle slice. If the inner diameter of the pool noodle is smaller than the tubing, use a sharp knife or scissors to carefully shave away a small amount of the inside of the foam until the tubing fits snugly into the noodle slice.
2. Put the pool noodle slice over the tubing, leaving 2-3 cm of tubing on one side of the noodle slice. This is the “top” of your generator model. Hot glue everything in place but take care to not melt the foam of the pool noodle slice.
3. Test the tubing to ensure that the pool noodle slice will keep the tubing upright in water.
4. Unroll about 30 cm of magnet wire and leave this end free.
5. Wind magnet wire in a tight coil around the outside of the tubing for the number of turns needed. Your teacher may suggest a number to you or you may be instructed to determine this on your own.
6. After winding the coil, leave another 30 cm end of magnet wire and cut the wire. Apply hot glue to the wire coil to keep it in place.
7. Use the sandpaper to remove the enamel off the ends of the magnet wire, revealing the conductive surface beneath. Make sure you remove all of the enamel coating from at least 3 cm of wire.
8. Determine the anchoring mechanism for your generator. You will need something that keeps the tubing vertical in the water and does not move around. Your teacher may provide a way to do this, or you may be encouraged to use provided materials and design your own anchoring mechanism.
9. Attach the anchoring mechanism to the end of tubing opposite the pool noodle slice. Place the entire assembly in a tub of water, testing to make sure it stays vertical in the water and does not move around when you create waves. Make any necessary adjustments or changes and re-test.
10. Cut a small piece of duct tape and apply it to one of the flat ends of one magnet. Use scissors or sandpaper to remove any tape that wraps around to the side. The tape should cover only the end of the magnet without extending beyond or around it. This is especially important if the magnet is a very tight fit in your tubing. The duct tape provides a better surface for the hot glue to adhere to the magnet.
©2023 The NEED Project Exploring Marine Hydrokinetics www.NEED.org 45
CONTINUED ON NEXT PAGE
11. Hot glue a long piece of fishing line to the duct tape end of the magnet, leaving at least 10 cm hanging. Embed the fishing line in the hot glue bead. Allow the hot glue to cool and cure.
12. Tie the fishing line ends in a knot above the hot glue bead, and hot glue the knot to hold it securely. This centers the fishing line down the axis of the magnet, so it hangs straight from the line.
13. Place the anchored tubing in a tub of water so that it is completely submerged in the water. Dangle the magnet inside the tube to find the right length of line needed to keep the magnet centered in the wire coil on the tubing. Attach the fishing bobber so the magnet is resting in this position.
14. Inspect the entire model generator and make sure everything is positioned as it should be. Consult the diagram if necessary.
15. Connect the ends of the wire coil to the galvanometer using alligator clips. The needle should be at the zero line at the top of the scale.
16. Rock the tub of water back and forth to create waves inside. Observe the action of the bobber, and consequently the magnet, in the tube. Have your partner observe the reading on the galvanometer with respect to the position of the bobber and magnet at the same time.
17. Disconnect the galvanometer. Remove the tubing assembly from the tub of water and dry it with a paper towel.
18. Put the second magnet on the first magnet attached to the fishing line so it is attached by magnetic force to the first magnet. Mark the bottom face of the second magnet with a permanent marker.
19. Slide the second magnet off the first. Set the bobber/fishing line/magnet assembly aside.
20. Invert the second magnet so the mark you made on the bottom is now on the top.

21. Hold the second magnet inside the bottom of the tubing so it is completely inside the tubing but as near the bottom as possible.

22. Hot glue the magnet in place in the tubing.

23. Allow the glue to cool, then submerge the tubing in the tub of water again. Reattach the galvanometer to the wires and insert the first magnet by lowering the bobber into the water.
24. Again, agitate the tub, recording observations and galvanometer readings as they are related to the bobber / magnet position relative to the coil of wire.
Data and Observations
Copy the following into your notebook. Leave enough space for all of the variations being built in your class with different numbers of wire turns, and space to draw a diagram of your model. Make sure you label all of the parts of your model on the diagram. # Turns of wire Maximum galvanometer reading with one magnet Maximum galvanometer reading with two magnets
Conclusions
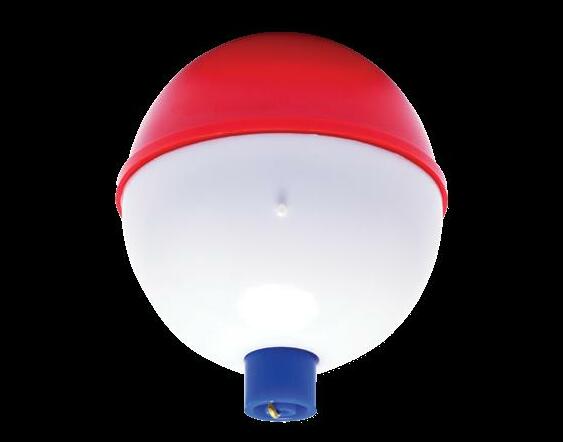
1. How did the galvanometer readings align with the movement of the magnet? Be as specific as possible.
2. How did the second magnet affixed to the bottom of the tubing affect the action of the bobber and first magnet? Be specific.
3. Think about how large utility-scale generators are. What do you predict would be some limitations to making a scaled-up version of your model that would generate enough power to make it worthwhile? What are some ways these limitations might be overcome?
46 ©2023 The NEED Project Exploring Marine Hydrokinetics www.NEED.org
Glossary


robot that travels underwater without input from an operator bathymetry the study or survey of the depth of the ocean floor chemical energy energy stored in the bonds between atoms; this energy is released when one or more substances change into new substances circuit pathway for electric current to flow conductor material that conduct electricity with little or no resistance Coriolis effect result of earth’s rotation on the atmosphere and ocean waters; the Coriolis effect makes storms swirl counterclockwise in the Northern Hemisphere and clockwise in the Southern Hemisphere crest topmost point of a wave current energy energy in the moving water of ocean currents density amount of mass per unit volume desalinated ocean water with the salt removed direct current electric current that flows in one direction only elastic energy energy stored in an object that has been stretched or pulled out of its natural state electric current electrical energy moving through a conductor electric grid system of power plants, distribution lines, and transmission lines that provides electricity electromagnet magnet produced by electric current electromagnetic induction production of voltage across an electrical conductor in a changing magnetic field electron the particle in an atom that carries a negative electrical charge energy the ability to do work or make a change energy source substances or places from which we obtain energy estuary tidal mouth of a large river, where the tide meets the stream fetch distance of water over which wind blows generator a device that converts motion energy into electrical energy gravitational potential energy energy stored in an object held up against gravity, such as water behind a dam or a child at the top of a slide gyre spiral or vortex heat engine device that changes heat into work by pulling thermal energy from a reservoir and using it to do work hydrokinetic energy system generating electricity from waves or directly from the flow of water in ocean currents, tides, or inland waterways insulator material that resists electrical current flow

©2023 The NEED Project Exploring Marine Hydrokinetics www.NEED.org 47
alternating current an electric current that reverses its direction at regular intevals or cycles; in the U.S., the standard is 120 reversals or 60 cycles per second; typically abbreviated as AC ampere (amp) a measurement of electric current atom the most basic unit of matter attenuator long, multi-segmented device that floats on the surface of the ocean; it harnesses energy as the motion of the waves causes flexing between each segment autonomous underwater vehicle (AUV) a c b
kinetic energy energy of motion
OTEC ocean thermal energy conversion uses temperature differences in ocean water to generate electricity. load the part of an electrical circuit that uses electricity to do work, such as a light bulb marine energy renewable energy source from the movement of ocean water in currents, tides, and waves mechanical motion energy motion energy, the movement of objects and substances from one place to another mooring tying and making stationary a device on water; a site where vessels, barges, or other floating objects can be tied nonrenewable energy source an energy source with a long term replenish rate and reserves that are limited, including petroleum, coal, natural gas, uranium, and propane nuclear energy energy contained in the nucleus of an atom ohm a measurement of resistance in an electrical circuit oscillating water column wave energy device using wave action to compress and decompress air in order to generate electricity oscillating wave surge converter wave energy device that captures energy from the surging or pulsing of waves, often near to shore osmosis movement of water through a membrane from low concentration of salt to high concentration of salt osmotic power using osmosis to generate electricity overtopping device a device that collects the energy from water rushing into a reservoir and spilling over OTEC ocean thermal energy conversion outer continental shelf areas in the oceans and Gulf of Mexico under the jurisdiction of the government of the United States and not the individual states themselves parallel circuit conductor or system of conductors providing more than one pathway through which electrical current can flow period time it takes for the crests of two concurrent waves to pass a stationary point point absorber device that captures energy from the up-and-down motion of waves potential energy stored energy power the rate at which energy is produced or consumed power plant site where electricity is generated, such as a nuclear power plant or hydropower generating facility pressure force per unit of area; pressure is measured in Newtons / m2 or pounds per square inch pressure differential wave energy device capturing the energy between the crests and troughs of waves prototype the first object produced from a new design pumped storage hydropower water pumped to a high reservoir during times of electricity abundance, then released to flow downhill and generate electricity when demand is high radiant energy energy that travels in electromagnetic waves renewable energy source an energy source with a short term replenish rate, including biomass, geothermal, hydropower, solar, and wind resistance measure of the opposition to current flow in an electrical circuit, measured in ohms resistor circuit component designed to control the current through the circuit secondary source of energy often called an energy carrier; requires another source, like coal, to be converted for generation; electricity and hydrogen are examples
series circuit conductor or system of conductors providing only one pathway through which electrical current can flow siting process of determining the location for an installation, such as a power plant or wind farm
48 ©2023 The NEED Project Exploring Marine Hydrokinetics www.NEED.org
sound energy movement of energy through substances in longitudinal waves substation location where step-down transformers reduce the voltage of electricity from large transmission lines before distributing it to neighborhoods and businesses thermal energy internal energy of substances that causes the atoms or molecules to move tidal barrage a facility built like a dam that allows the tides to power turbines and generate electricity tidal bulge the area of the Earth where the moon’s gravitational force creates high tides tidal energy energy stored in the movement of tides tidal fence an open structure with vertical-axis turbines mounted across a channel tidal power hydropower derived from the rise and fall of the tides tidal turbine underwater turbine driven by the movement of the tides tide ebb and flow of water due to the gravitational pull of the moon on the oceans transformer a device that changes the voltage of electricity trough lowest point of a wave turbidity cloudiness or opacity of water with suspended matter turbine machine of curved blades or buckets that transforms the linear motion of a moving fluid into rotational motion to turn a generator volt measure of electric potential or force voltage measure of the pressure or potential difference under which electricity flows through a circuit watt measure of power wave energy energy stored in waves in the ocean wavelength distance from one point on a wave to the same point on the next wave
©2023 The NEED Project Exploring Marine Hydrokinetics www.NEED.org 49
Youth Energy Conference & Awards
The NEED Youth Energy Conference and Awards gives students more opportunities to learn about energy and to explore energy in STEM (science, technology, engineering, and math). The annual June conference has students from across the country working in groups on an Energy Challenge designed to stretch their minds and energy knowledge. The conference culminates with the Youth Awards Cenermony recognizing student work throughout the year and during the conference.
For More Info: www.youthenergyconference.org
Youth AWards Program for Energy Achievement
All NEED schools have outstanding classroom-based programs in which students learn about energy. Does your school have student leaders who extend these activities into their communities? To recognize outstanding achievement and reward student leadership, The NEED Project conducts the National Youth Awards Program for Energy Achievement.
Share Your Energy Outreach with The NEED Network! This program combines academic competition with recognition to acknowledge everyone involved in NEED during the year—and to recognize those who achieve excellence in energy education in their schools and communities.
What’s involved?
Students and teachers set goals and objectives and keep a record of their activities. Students create a digital project to submit for judging. In April, digital projects are uploaded to the online submission site.
Check out:
www.NEED.org/need-students/youth-awards/ for more application and program information, previous winners, and photos of past events.
50 ©2023 The NEED Project Exploring Marine Hydrokinetics www.NEED.org
Check Out The Marine renewable energy Portal!
This portal was sponsored by the U.S. Department of Energy, Office of Energy Efficiency and Renewable Energy, Water Power Technologies office, and is part of a larger open energy information site supported and maintained by the National Renewable Energy Laboratory.
STEM Resources
openei.org/wiki/PRIMRE/STEM
Explore a variety of STEM resources for MRE and MHK, including education and training programs, educator resources, career path ways, prizes & competitions and site tours.
MRE Basics
https://openei.org/wiki/PRIMRE/MRE_Basics
The movement of water in the world’s oceans creates a vast store of kinetic energy. Marine Renewable Energy (MRE), also known as Marine Hydrokinetics (MHK), can be harnessed to generate electricity to power homes, transport and industries. MRE en compasses wave energy — power from the movement of surface waves, ocean current energy — power from the kinetic energy of ocean current, ocean thermal energy conversion (OTEC) — power from the heat differential of different thermal layers within a body of water, and salinity gradient — power from the difference in salt concentration between two fluids.
©2023 The NEED Project Exploring Marine Hydrokinetics www.NEED.org 51
AES
AES Clean Energy Development
American Electric Power Foundation
Appalachian Voices
Arizona Sustainability Alliance
Baltimore Gas & Electric
Berkshire Gas - Avangrid BP America Inc.
Bob Moran Charitable Giving Fund
Cape Light Compact–Massachusetts Celanese Foundation
Central Alabama Electric Cooperative
The City of Cuyahoga Falls
Clean Virginia CLEAResult
ComEd Con uence
ConocoPhillips
Constellation
Delmarva Power and Light Department of Education and Early Childhood Development - Government of New Brunswick, Canada
Dominion Energy, Inc.
Dominion Energy Charitable Foundation DonorsChoose
East Baton Rouge Parish Schools
East Kentucky Power Cooperative EcoCentricNow
EDP Renewables
EduCon Educational Consulting
Enel Green Power North America
ENGIE Entergy Eversource Exelon
Exelon Foundation Foundation for Environmental Education FPL
Generac
Georgia Power Gerald Harrington, Geologist Government of Thailand–Energy Ministry
Greater New Orleans STEM
GREEN Charter Schools
Green Power EMC
Guilford County Schools–North Carolina Honeywell
National Sponsors and Partners
Iowa Governor’s STEM Advisory CouncilScale Up
Iowa Lakes Community College
Iowa State University
Illinois Clean Energy Community Foundation
Illinois International Brotherhood of Electrical Workers Renewable Energy Fund
Independent Petroleum Association of New Mexico
Kansas Corporation Energy Commission
Kansas Energy Program – K-State Engineering Extension
Katy Independent School District
Kentucky O ce of Energy Policy
Kentucky Environmental Education Council
Kentucky Power–An AEP Company
Liberty Utilities
Llano Land and Exploration
Louisiana State Energy O ce
Louisiana State University – Agricultural Center
LUMA Marshall University
Mercedes Benz USA
Minneapolis Public Schools Mississippi Development Authority–Energy Division
Motus Experiential National Fuel National Grid National Hydropower Association National Ocean Industries Association National Renewable Energy Laboratory NC Green Power
Nebraskans for Solar NextEra Energy Resources Nicor Gas
NCi – Northeast Construction North Shore Gas O shore Technology Conference
Ohio Energy Project
Oklahoma Gas and Electric Energy Corporation
Omaha Public Power District
Paci c Gas and Electric Company
PECO
Peoples Gas Pepco
Performance Services, Inc.
Permian Basin Petroleum Museum Phillips 66
PowerSouth Energy Cooperative
Prince George’s County O ce of Human Resource Management (MD)
Prince George’s County O ce of Sustainable Energy (MD)
Providence Public Schools
Quarto Publishing Group
The Rapha Foundation
Renewable Energy Alaska Project
Rhoades Energy
Rhode Island O ce of Energy Resources
Salal Foundation/Salal Credit Union
Salt River Project
Salt River Rural Electric Cooperative Schneider Electric
C.T. Seaver Trust
Secure Futures, LLC Shell
Shell Carson SMUD
Society of Petroleum Engineers
South Carolina Energy O ce
Snohomish County PUD
SunTribe Solar
United Way of Greater Philadelphia and Southern New Jersey Unitil
University of Iowa University of Louisville University of North Carolina University of Northern Iowa University of Rhode Island
U.S. Department of Energy
U.S. Department of Energy–O ce of Energy E ciency and Renewable Energy
U.S. Department of Energy - Solar Decathlon
U.S. Department of Energy - Water Power Technologies O ce
U.S. Department of Energy–Wind for Schools U.S. Energy Information Administration
United States Virgin Islands Energy O ce Virginia Cooperative Extension
We Care Solar
West Virginia O ce of Energy
West Warwick Public Schools
52 ©2023 The NEED Project Exploring Marine Hydrokinetics www.NEED.org
©2023 The NEED Project 8408 Kao Circle, Manassas, VA 20110 1.800.875.5029 www.NEED.org
