Analyzing the Long Term Impact of Extreme Weather Events on Photovoltaic Systems
Design Can Reshape Our Memory: Pearl Harbor and 9/11 Memorials Influence How We Remember Historic Events
pH Effect on Saccharomyces cerevisiae Yeast Cell Proliferation
The Effect of Lemma minor on Decreasing Nitrogen and Phosphate Concentration in Contaminated Water
Abstracts
Enhancing AEM Fuel Cell Performance Using Partially Reduced Graphene Oxide
Hawthorn: A Plant-Derived Cholera Toxin Inhibitor
Psychological and Brain Connectivity Changes Following Trauma-Focused CBT and EMDR Treatment in Single-Episode PTSD Patients
Serum Arginase-1 as a Predictive Biomarker for Head and Neck Cancer
Summer Programs
Analyzing the Relationship between Intellectual Aptitude and Susceptibility to Cognitive Illusions
Hawkeye App Start-up Experience at UC Berkeley
Neurosurgery Research Internship at CHOP
Reporter Articles
Biological Anthropology HIRT
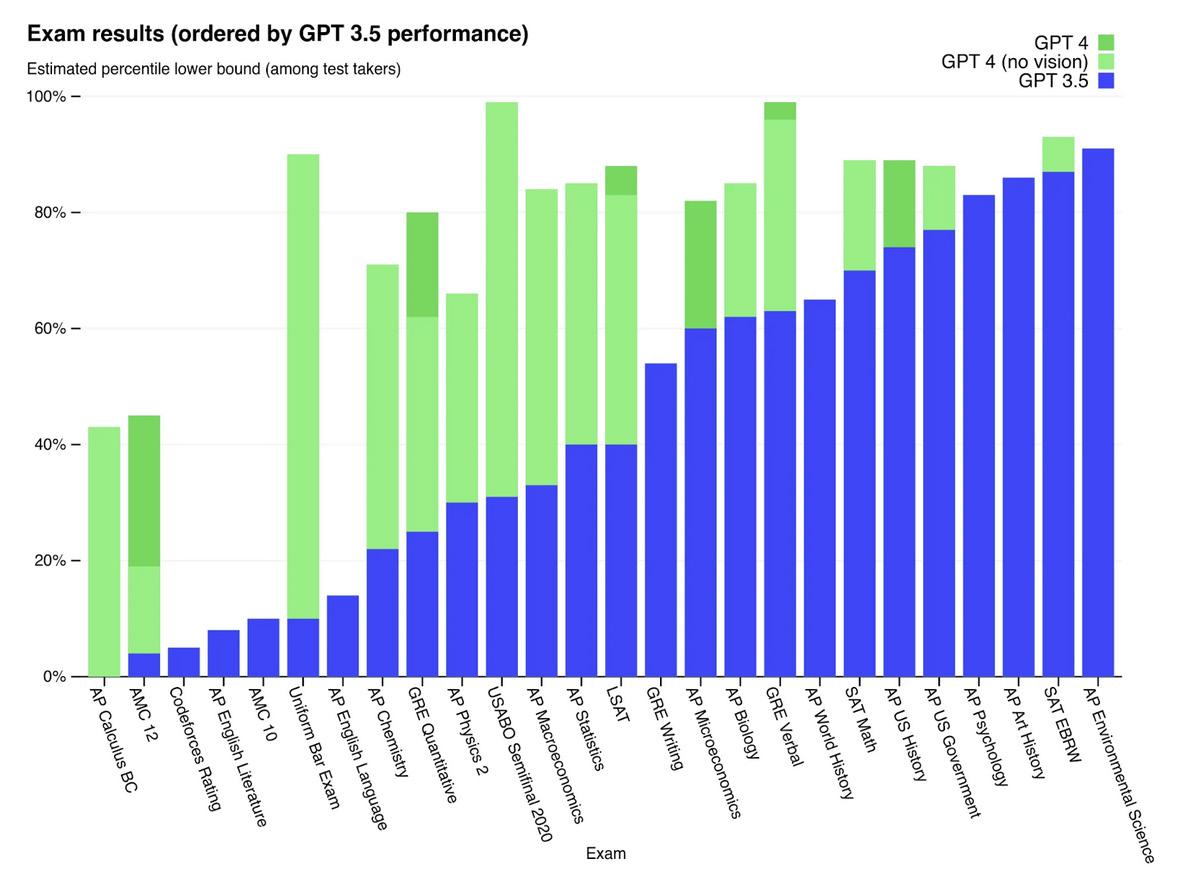
Chat GPT-4: A Leap Forward for Generative AI
CRISPR Gene-Editing and Recent Breakthroughs
Potential for Habitability on the Moon Europa
Editor’s Note
Welcome to the 2024 Fall edition of the Pingry Community Research (PCR) Journal. We are excited to showcase Pingry’s top scientific talent, both in terms of research skills and knowledge of scientific concepts and discoveries.
The PCR journal provides students the opportunity to publish novel research. Through a written medium, students demonstrate their in-depth understanding of complex, collegiate-level scientific topics, and their applications in research at Pingry.
The fall edition of PCR highlights work in four categories. Papers present the full novel research from both in and out of school. Abstracts summarize innovative work done by Pingry students. Summer research articles communicate the findings of research conducted by students during the summer in a myriad of fields. Reporter articles are written by students on a recent scientific advancement of their choosing.
Through the PCR journal, we hope to spark intellectual curiosity and promote scientific inquiry amongst the next generation of Pingry researchers.
Dive into the wonders of Pingry Research through this special edition of PCR: Pingry’s foremost journal of scientific research.
Melinda Xu (VI), Editor-in-Chief
Elbert Ho (VI), Editor-in-Chief
Editorial Staff
Editors-in-Chief:
Melinda Xu (VI)
Elbert Ho (VI)
Head Copy Editor:
Carolyn Zhou (VI)
Head Layout Editor:
Sriya Tallapragada (VI)
Faculty Advisor:
Mr. Maxwell
Copy Editors:
Alexander Recce (VI)
Jingjing Luo (VI)
Sofia Wood (VI)
Cecilia Caligiuri (V)
Christian Zhou-Zheng (V)
Edward Huang (V)
James Draper (V)
Jonah Park (V)
Julia Ronnen (V)
Katherine Jung (V)
Tingting Luo (V)
Sarah Yu (IV)
Analyzing the Long Term Impact of Extreme Weather Events on Photovoltaic Systems Papers
by Sia Ghatak (VI), Dr. Annick Anctil, Chenyoung Deng
Introduction
Extreme weather events have increased in frequency and intensity worldwide, and this upwards trend is expected to continue as climate change exacerbates weather patterns. The most significant contributions to CO2 emissions come from the power generation sector (43.5%), followed by industry (27%) and finally transport (20.7%) [1]. Renewable energy, particularly photovoltaic (PV) systems, is one of the most popular and promising technologies to mitigate environmental damage from the energy sector. The US Energy Information Association (EIA) projects that the percentage of US electric capacity additions from solar will grow from 46% in 2022 (18 GWAC/gigawatts alternating current) to 54% in 2023 (31 GWAC), 63% in 2024 (44 GWAC), and 71% in 2025 (51 GWAC) [2]. As module prices continue to drop globally, PV systems are cementing their place in the power grid and expanding in geographic diversity and abundance [2]. However, there are many challenges to the widespread adoption of PV systems. For instance, their generation is susceptible to reduction due to changes in weather patterns or extreme weather. Prior research has found that weather events, such as hail, flooding, snow, wildfires, and combinations of events such as hurricanes, cause significant short-term decreases to PV system generation. Those studies generally tracked how the power output of the plant varied in the days before, during, and after the event [3] [4] [5]. Other studies have determined that stress from large hail, extreme wind, or heavy snow causes cracking in PV modules, although the extent of the impact on power generation due to such
cracking is still actively being researched [6] [7]. This study analyzes the long-term impact of hail, extreme wind, tornadoes, and wildfires on PV systems by tracking their performance loss ratio (PLR) to compare regional and yearly differences in impact patterns. The initial analysis focused on five states: California, Florida, Massachusetts, Michigan, and North Carolina. This study aims to better understand if there is a long-term impact on PV systems from extreme weather events and characterize the extent of the damage.
Methodology
The methodology focused on determining if PV plants had been impacted by extreme weather events, and if so, the extent of long-term damage. There were three major phases: data extraction, impacted plant identification, and impacted plant analysis. Four publicly available datasets were cross-referenced: the National Oceanic and Atmospheric Administration’s (NOAA) storm events, the National Interagency Fire Center’s Wildland Fire Interagency Geospatial Services (WFIGS), and the US Energy Information Administration (US EIA) databases on plant generation and construction. The storm and wildfire reports were used to identify extreme weather over a ten-year time period from 2013 to 2023. Identified plants were characterized as plants that were less than 5 km from the weather event. Finally, we looked at plant power generation in the 6 months before and after an event, calculating the PLR of both the impacted plants and a non-impacted control group. The PLR due to a weather event was measured as the ratio between the average generation in the prior six months minus the average gener-
ation in the following six months, divided by the average generation of the prior six months. Figure 1 outlines the basic methodology of this project.
Data Collection
Initial data for hail, extreme wind, and tornado events was collected from the National Oceanic and Atmospheric Administration through their available Storm Reports dataset, a collection of storm events in the United States reported by the National Weather Service [8]. The wildfire data was collected from the National Interagency Fire Center’s Wildland Fire Interagency Geospatial Services (WFIGS), which provides geospatial data through the Wildland Fire Data Program, run by the National Interagency Fire Center [9]. Both datasets are available to the public. The type of event, location, and date of event were collected for all weather events. The US EIA database provided data about solar plant generation, capacity, and location. The data collected from the EIA-923 form provided monthly power generation data, and the EIA860 form provided the construction data, such as the first date of operation and the location [10][11]. Again, the dataset is publicly available. All plants were given a plant code which was used throughout the study to identify them.
Impacted Plants
Initially, only certain states would be studied due to limited time, testing methods, and size of the datasets. The states selected were California, North Carolina, Massachusetts, Michigan, and Florida. One of the most important factors for
this decision was the availability of complete data, such as in California. Another key factor was the complexity of storm events, with priority given to states that commonly experienced two or more types of events, such as North Carolina, which experienced both wildfires and extreme wind. To find impacted plants, the longitude and latitude of the storm events and the plants were compared to identify if any plants were within 5 kilometers of any weather events. Afterward, the plants identified as nearby were further filtered to remove PV systems that had not been operational for at least six months prior to the impact date or did not have complete generation data. The plant code, event code, location, and impact date were recorded for the remaining plants. For comparison, it was also necessary to find a control group of unimpacted plants. However, almost all of the plants had been impacted during the ten-year time frame by at least one event. Instead, the control group was limited to any plants that were not within 5 kilometers of any type of extreme weather event during the randomly selected year 2020, and their generation during that year was used for further analysis.
Performance Loss Ratio
The Performance Loss Ratio (PLR) is measured in this study as the average generation of the six months before an event minus the average generation of the six months after the event, divided by the average before the event, formulated as:
Figure 1: Outline of the methodology of this study
All events were recorded separately, so if a plant was impacted multiple times during the ten-year-long period, the impacts would be counted as separate events. The PLR of all plants that were impacted by weather events was measured, along with the PLR of the control plants during the year 2020.
Recovery
After discovering that the generation of most plants decreased after a weather event, the natural subsequent question was whether the generation ever returned to pre-event levels. The same pre-event average generation levels that had been used to calculate the PLR were marked as a baseline, and it was measured if the monthly generation ever reached or exceeded that baseline again. A plant did not recover if the monthly generation went all the way to zero or if the plant had not recovered by December 2023, exceeding the time period of the study. For the plants that recovered, it was calculated whether they recovered naturally or through replacement of the PV modules. As data for replacements is not publicly available, the month to month generation was analyzed for large increases between two consecutive months, with an increase of over 15% characterized as theorized replacements.
Results
There are two main sections of the results: the long-term decrease in generation through PLR analysis from extreme weather and the recovery process of impacted plants.
Performance Loss Ratio Comparison
The first comparison was between the PLRs of the impacted plants and the non-impacted control group. The percent of plants in each group, tornadoes, hail, wind, wildfire, and control, that experienced various levels of PLR was graphed. The PLR categories were as follows: greater than 25%, referred to as severe damage; between 25% and 15%, referred to as moderate damage; and between 15% and 5%, referred to as mild damage. In all four groups of impacted plants, a significant number of plants experienced a PLR of 25% or greater, though there were none in the non-impacted group. A number of plants also experienced a PLR of between 25% or 15%, while this was exceedingly rare amongst the non-impacted group. These findings prove that there is an impact on plant generation from an ex-
treme weather event up to 6 months afterwards, as impacted plants more commonly reported higher PLR levels than non-impacted plants. An interesting finding is that the non-impacted group actually experienced significantly higher levels of low PLR, or between 15% and 5%. This is likely due to a lower chance of replacement amongst non-impacted plants, naturally leading to minor damage from normal use. Amongst the impacted plants, tornadoes had the highest percentage of plants that had severe loss, with very few plants experiencing moderate damage. On the other hand, hail events were the only weather event where the most impacted plants experienced a moderate level rather than a severe level. For wildfires and tornadoes, a disproportionate percentage of the negatively impacted plants had severe loss, around 65.7% for wildfires and 62.5% for tornadoes, while there were more even distributions for hail and wind.
Figure 2: The PLR for identified impacted plants and a control group of non-impacted plants is shown, with the percent of impacted plants that experienced levels of 25%, 15%, and 5% PLR.
Recovery Analysis
After establishing that many plants had a decrease in generation following an extreme weather event, whether the plants ever recovered power generation was measured. For tornadoes, hail, and wind, just under twothirds of the plants never recovered: 62.5% , 65%, 63.7% respectively. However, 80.9% of the plants that were impacted by wildfires did not recover. These high percentages suggest permanent, physical damage is being caused by these weather events and left unaddressed. For the plants that did recover, between a third and quarter of the recovery was a result of the replacement; 32.14% for hail, 24.65% for
wind, and 27.03% for wildfires. However, this number was drastically higher for tornadoes, at 58.33%, suggesting that the plants impacted by tornadoes experience very severe and irreparable damage from the tornado and are more likely to be unable to recover without replacement.
Conclusion
There is a long term impact on PV energy output from extreme weather events, as impacted plants have a higher PLR than non-impacted plants within a 6-month time frame following the event. Additionally, impacted plants tend to not return to pre-event generation levels without replacement. This has both an economic implication and an environmental one, as it causes more waste to go into landfills, which partially negates the environmental benefit from clean energy. As the price of PV systems continues to drop and they grow in popularity, they will also continue to expand geographically. However, as shown by this study, the commonality and types of extreme weather events should be taken into consideration for large scale PV plant production, as they have impacts on generation output and economic cost through replacement. Although all four tested weather events have significant impacts on PV systems, tornadoes and wildfires are uniquely damaging, suggesting that optimal locations for large PV plants should avoid areas that are commonly impacted by these events.
Future Work
Future studies might continue the work of this study by assessing whether there is a correlation between PLR and chance of replacement, but there was insufficient time to do this during the seven week duration of this program. The results of this study could also be replicated using a larg-
er sample size of the entire country, to provide insight into optimal locations for larger-scale PV plants that minimize damage from solar plants.
Acknowledgements
The author would like to thank Dr. Preeti Nain for her continuous guidance and support throughout the program. She would also like to acknowledge Dr. Annick Anctil and the rest of her lab. The work done in this study was supported by the National Science Foundation.
References
[1] IEA. (2023). CO2 Emissions in 2022 – Analysis - IEA. In Global Energy (Vol. 62, Issue 10).
[2] Feldman, D., Zuboy, J., Dummit, K., Stright D., Heine M., Mirletz H., & Margolis, R. (2023). Winter 2023 Solar Industry Update. Nrel.
[3] Jordan, D. C., Perry, K., White, R., & Deline, C. (2023).ExtremeWeather and PV Performance.IEEE Journal of Photovoltaics, 13(6). https:// doi.org/10.1109/JPHOTOV.2023.3304357
[4] Donaldson, D. L., Piper, D. M., & Jayaweera, D. (2021). Temporal Solar Photovoltaic Generation Capacity Reduction from Wildfire Smoke. IEEE Access, 9. https:// doi.org/10.1109/ACCESS.2021.3084528
[5] Jackson, N. D., & Gunda, T. (2021). Evaluation of extreme weather impacts on utility-scale photovoltaic plant performance in the United States. Applied Energy, 302. https://doi.org/10.1016/j.apenergy.2021.117508
[6] Buerhop, C., Wirsching, S., Bemm, A., Pickel, T., Hohmann, P., Nieß, M., Vodermayer, C., Huber, A., Glück, B., Mergheim, J., Camus, C., Hauch, J., & Brabec, C. J. (2018). Evolution of cell cracks in PV-modules under field and laboratory conditions. Progress in Photovoltaics: Research and Applications,26(4).https://doi.org/10.1002/pip.2975
[7] Silverman, T. J., Bosco, N., Owen-Bellini, M., Libby, C., & Deceglie, M. G. (2022). Millions of Small Pressure Cycles Drive Damage in Cracked Solar Cells. IEEE Journal of Photovoltaics, 12(4). https://doi.org/10.1109/JPHOTOV.2022.3177139
[8] [Online] Storm events database. Available https://www.ncdc.noaa.gov/stormevents/. [9] [Online] Wildland Fires database. https://data-nifc.opendata.arcgis.com/pages/wfigs-page/ . [10] [Online] PV Generation database. Available https://www.eia.gov/electricity/data/eia923/. [11] [Online] PV Construction database. Available https://www.eia.gov/electricity/data/eia860/.
Figure 3: Percentage of plants that did not recover, and that were replaced
Design Can Reshape Our Memory: Pearl Harbor 9/11 Memorials Influence How We Remember Historic Events
by Kirsten Thomas (VI)
Introduction
I visited Pearl Harbor on a family vacation to Hawaii in 2015. During a vacation spent enjoying the beach, pool, and nature, a visit to a National Park centered around a memorial truly stands out. I remember passing through the visitor center and taking a ferry out to the memorial. The oil from the sunken ships still lingered in the water and made it appear otherworldly with the sun reflecting off of the rainbow film; it was both peaceful and eerie. I noticed that of the over one hundred visitors on the boat, it appeared half were from the United States and the other from Japan. This was because Hawaii is located between mainland Japan and America; this ratio seemed to be reflected across the island. When we arrived at the bright and shining bridge over the USS Arizona, it felt different from any memorial I had ever been to or seen. It felt peaceful and there was room for interpretation and individual feelings; no ‘agenda’ was forced onto the viewers. As an eight-year-old, I did not fully comprehend the scale and impact of the attack on Pearl Harbor, but I had an understanding of what had happened. After viewing the wall of names and taking in the memorial, we boarded another ferry and went to tour the USS Missouri battleship to see where the Japanese surrender was signed. Traveling to the memorial by boat and seeing the scale of the weapons on the USS Missouri put into perspective how devastating the attack had been to destroy so many large ships. After the tour, we headed back to the gift shop and continued with our vacation. This experience remained with me and changed how I viewed the attack on Pearl Harbor.
Growing up just over twenty miles from the National September 11 Memorial & Museum, the attack and subsequent remembrance were always a part of my life. My parents and close relatives were in New York at the time and many people from our town lost their lives. Similar to my understanding of Pearl Harbor, I understood what happened on September 11, 2001, but did not understand the scale or impact. The first time I visited the memorial, I remember taking in how large the building footprints were and how many names were listed across bronze on the surface of the walls. Unlike Pearl Harbor which occurred more than half a century ago, the memorial was only a small part of how my parents and other adults recounted 9/11. For them, it was oral histories: sharing stories about that day or friends they had lost, discussing how life was in Manhattan in the early 2000s, and remembering the attacks on each anniversary. To me, the memori-
Figure 1: Photo of the sunken USS Arizona.
al was only a small part of how I remember 9/11, but because I was so far removed from Pearl Harbor, the USS Arizona Memorial is how I fully associate the attack. My relationship with remembering 9/11 is personal, whereas I share the collective and general memory of Pearl Harbor. Large, violent, and tragic events hold a unique place in collective and individual memory. The memory of the collective is often twisted and molded by powerful voices to fit a narrative. On the other hand, the memory of an individual is personalized and unique but leaves space for false ideas and biases. Both Pearl Harbor and 9/11 were events that impacted our national identity and memory in the United States. They may be referred to as “flashbulb memories” or national events that disturb the day-to-day [1]. The timeline also plays a role in one’s memory and memorialization: both Pearl Harbor and 9/11 are relatively modern events, but in national memory, they feel distant from each other. The events of 2001 are recent and continue to be an uncomfortable and emotional subject. These two domestic flashbulb events signified the end of “normalcy” in their time and spurred radical change in domestic life as well as altering the country’s foreign policy and entry into war. Although the USS Arizona Memorial at the Pearl Harbor National Memorial (USS Arizona Memorial) in Honolulu, Hawaii, and the National September 11 Memorial Day (9/11 Memorial) in Lower Manhattan, New York, appear very different, they are strong case studies in the design choices of the architects to commemorate events—or in these cases the mass graves—impact how the actual flashbulb events are remembered, and how loss put into physical form alters our views, emotions, and memories.
Historical Background: The Attack on
Pearl Harbor / December 7, 1941
It is important to first understand the complex narrative of US-Japan relations and the impact of Pearl Harbor to not only have background information on the subject but also to understand the significance of the Pearl Harbor Memorial. Although the attack on Pearl Harbor is an iconic event in the history of the nation, national mem-
ory as to why the Japanese launched an attack on the US is cloudy. In FDR’s declaration of war on December 8, 1941, he called it an “unprovoked attack.” Before the United States of America was officially involved in World War II, it had already aligned with the British and Allied forces. In 1940, Japan was looking to expand its territory and had moved into French Indochina. In response to the occupation, the United States froze financial assets and placed economic sanctions to punish Japan: An embargo was placed on exports and it became difficult for Imperial Japan to purchase oil [2]. In response, Japan aimed to take out the US Pacific fleet, docked in Pearl Harbor, Hawaii. Believing that Americans had no interest in a long war, Japan thought they would reach a quick and easy victory. On the morning of Sunday, December 7, 1941, Japanese fighter planes destroyed 20 naval ships and 300 planes, killing over 2,000 American sailors and airmen [2]. The attack was successful on many levels. However, two large aircraft carriers—the USS Enterprise and USS Lexington— were not docked at Pearl Harbor, so America was able to retain its presence in the air in the region. This fortunate coincidence was very important for the American response and future war effort. In the hours following the attack, word quickly spread across the nation. The immediate response from the government in the following days set the tone and narrative for the nation. American officials conveyed a message of authority, seriousness, patriotism, unity, and vengeance. Initially, President Franklin Delano Roosevelt planned to address the nation on Monday morning, December 8. However, the First Lady, Eleanor Roosevelt, had a scheduled radio show that Sunday night. In her message, she emphasized the importance of preparation and a new sense of certainty. Speaking directly to women and children, she encouraged them to rise above their fears for the good of the nation. By framing the attack as an issue for everyone, she conveyed that the nation would face the war together, with all contributing to the effort. In a powerful declaration of unity, she proclaimed, “We are the free and unconquerable people of the United States of America” [3]. This message from the First Lady was the first message on the attack from the White House. Be-
fore delivering his address to the nation on December 8, people described FDR as the calmest in the room. In his speech to Congress, he referred to Pearl Harbor as an “unprovoked attack” and “a day that will live in infamy” and asked Congress to declare a state of war between the United States and Japan. The declaration was signed that day and in return on December 11, 1941, both Germany and Italy declared war on the United States. Many believe this action was FDR’s plan to get other nations to declare war on the US to unify the country and enter the war with the full support of the American people. Frank Knox, FDR’s Secretary of the Navy, offered the statement that the Japanese started the war, but America would finish it [4]. By the end of World War II, 416,800 American military personnel were killed [5]. After the bombs were dropped in Japan and there was victory in the Pacific, some wreckage at Pearl Harbor remained. From the time of the attack, it would take another decade for the process of memorialization to begin and another decade until the USS Arizona memorial opened to honor the sunken ship that was the site of over half the deaths occurring on the day.
Historical Background: The Attack on New
York and Washington, D.C. / September 11, 2001
On September 11, 2001, planes hijacked by members of the terrorist group al Qaeda led to the deadliest attack on US soil since the attack on Pearl Harbor 60 years earlier. Similarly to Pearl Harbor, the 3,000 civilian deaths on US soil motivated the strong military response. On September 11, four domestic flights were hijacked and rerouted towards major US buildings. At 8:46 AM, a plane headed from Boston to Los Angeles hit the North Tower of the World Trade Center. At 9:03 AM, a flight headed on the same path hit the South Tower. The gap between attacks ensured that people watched live as the second plane hit the South Tower. The initial reaction to the first plane was the assumption it was a tragic accident, and as newscasters discussed this on national TV, the second tower was hit; together the nation realized this was not an accident. At 9:37 AM, a third plane crashed into the Pentagon
in Washington, D.C. and at 10:02 AM, the fourth plane crash landed in Pennsylvania after passengers stopped hijackers from hitting either the White House or the Capitol Building. The passengers on the fourth plane knew what had happened to the other planes and had overthrown the hijackers to take control of the plane to crash land it. The nation remained in shock and all commercial flights were grounded [6]. At 8:30 PM that night, President George W. Bush, who had been reading to schoolchildren in Florida when learning about the attack, addressed the nation. Akin to Eleanor Roosevelt and FDR, he called for strength and protection, offered a message of unity, and attempted to inspire a feeling of patriotism, saying, “America was targeted for attack because we’re the brightest beacon for freedom and opportunity in the world. And no one will keep that light from shining” [7]. He called for a search for those responsible and stated that there would be no distinction between terrorists and hosts who harbored them. In response to the attack which was justified by a religious Sunni Muslim jihad, Bush offered Americans a quote from Psalms in the Bible. Beyond Bush’s claim that the attack was on the United States, the target was strategic. The Twin Towers were a symbol of America’s economic dominance and power and had functioned as an economic hub. It was a physical and symbolic target to attack the United States. Additionally, the flights hijacked were from American carriers, American and United Airlines respectively. Following the attack, Bush declared the “War on Terror” and troops were mobilized to Afghanistan
Figure 2: A model of the USS Arizona memorial and ship.
in 2001 and Iraq in 2003. Conflicts in the Middle East prompted by the 9/11 attacks continued until 2021 when the final group of American soldiers left Afghanistan. It is estimated that over 7,000 American troops and 8,000 contractors were killed in post-9/11 Middle Eastern War Zones [8].
The Timeline Between Attack and Memorialization
Unofficial memorials surrounded the sites immediately following the attack, and events were held on anniversaries at both sites [9]. The USS Arizona Memorial opened twenty years after the attack and the 9/11 Memorial opened on the tenth anniversary of the attack. America and Japan had repaired their relationship and were allies during the time the memorial was constructed and opened in Pearl Harbor. After the atomic bombs were dropped in Japan and the Japanese surrendered in 1945, the Allied powers planned to reconstruct and manage Japan. They implemented a new constitution, reconstructed the government, and rebuilt the economy [10]. Interestingly, Emperor Hirohito was kept in power after the war as a strategic move during Japan’s surrender. The United States believed that by allowing him to remain as emperor, they would ensure the Japanese government would comply with their reconstruction plans and maintain the support of its people. These actions are in stark contrast to Navy Seals breaking into Osama bin Laden’s compound and shooting him under orders from President Barack Obama in 2011 [11]. On the tenth anniversary of the 9/11 attacks, America still had troops in Afghanistan that would not be removed for another decade; there was still significant xenophobia and ongoing conflict. It would take as long as memorializing Pearl Harbor as it would for the US to finally withdraw troops in the Middle East. The relationships the rival nations built during the design and construction period impacted the design and reception of both memorials. The delay between the tragedy and the creation of a memorial was partly due to other immediate priorities, but also because both sites were filled with debris, and great care was needed to recover the remains of those who had died. Nearly a thousand servicemen were buried
at sea, entombed in the sunken USS Arizona. Oil continues to leak from their sunken grave. In lower Manhattan, roughly the same number
Figure 3: A map of the Pearl Harbor National Park visitor center, highlighting the distance between the USS Arizona site and the entrance to the park.
of victims’ remains still have not been properly identified. This led to a particularly complex process of preparing the locations for construction and the physical design of the structures.
Construction of the USS Arizona Memorial and Pearl Harbor National Park
Of the thirty-three ships that sustained damage during the attack on Pearl Harbor, fifteen were minorly damaged, eleven were medium damaged, and seven ships sunk. Of those ships, most were repaired within six months and only three were lost to the attack. The USS Arizona and USS Utah are located at the memorial, while the USS Oklahoma was stripped for parts and later sank over 500 miles off the coast [12]. In the 1950s, a committee assembled to find an architect to design a memorial for the USS Arizona and raise funds. There were minimal requirements for the design: it could not touch the ship, it had to accommodate 200 visitors, and it would not incorporate Ford Islands into the design [13]. In 1959, they chose Alfred Pries as the lead architect. Pries was trained as an architect in Vienna and first arrived in Honolulu in 1939 as a refugee fleeing Nazi-controlled Austria. He was later interred at Sand Island for just under four months. When asked in an interview, he said that he knew the war was inevitable when he came to the United States and that because he was an alien, there was risk but he still felt safer in America than in Eu-
rope. He started working in Hawaii by drawing plans at quarries, designing residential projects, and eventually working for the Governor at a major firm in Honolulu. Pries expressed gratitude for Hawaii and the natural landscape, which he fought to preserve and elevate in his work [14]. His original design was a rock wall with a floating frame and underwater portholes. Being from Vienna, Pries said that the encrustations on the exterior of the Arizona reminded him of the jeweled designs on the crypts found in the cathedrals of Vienna and Europe [13]. He viewed the ship as a modern-day sarcophagus but received feedback that the design was far too morbid. Pries then shifted his design to be an opening and soaring parabola made of white concrete and steel. He explained that the initial dip in the center represents America’s initial defeat and as it rises to strong angles on either side, it represents the rise to victory [13]. This was the physical manifestation of the powerful words of Eleanor Roosevelt to rise above our fears twenty years earlier. Motivated by his appreciation for Hawaii’s environment and landscape, he aimed to create a peaceful space for contemplation, where visitors could imagine where the planes came from and how the attack unfolded against the tropical backdrop. This is further reinforced because visitors need to take a ferry to the memorial, providing a unique perspective on the landscape. The memorial was dedicated and opened on Veterans Day, 1962, to ensure the focus was not on the attack, but on those who were killed in the attack [13]. After the National Park Service took control of Pearl Harbor in the 1980s, there were large-scale projects to study the shipwreck run by the National Parks Submerged Cultural Resources Unit. Due to the large size of the battleship, the scale of the survey/treatment was unprecedented. The team both corroborated and disproved claims about damage to the Arizona from firsthand accounts and speculation with the use of cameras and divers [13]. To this day, the USS Arizona functions as an underwater, complex biological ecosystem [15]. Although there was less knowledge about the wreck when Pries was designing the USS Arizona Memorial, it was still an obstacle that he had to design around.
The Construction of the 9/11 Memorial
Just as planning a memorial around a sunken battleship leaking oil, which serves as the final resting place for nearly a thousand men, presents unique and unprecedented challenges, so does designing a memorial for the victims of the 9/11 attacks. Debris from the site of the attack was cleaned from December 2001 to May 30, 2002, when the last piece of steel was removed [16]. The Lower Manhattan Development Corporation (LMDC) was established to rebuild the area damaged in 2001. They were responsible for the construction of the memorial, and the reconstruction and development of major projects in lower Manhattan [17]. In 2002, Daniel Libeskind won a competition by LMDC for the space. His design included new skyscrapers, a memorial, a memorial museum, and an emphasis on the balance between the memory of the victims lost in the attack and the continuation of life in the city. In 2003, LMDC held an international competition, open to anyone over the age of 18, regardless of qualification. In 2004, a subcommittee in the LMDC selected Micheal Arad and Peter Walker’s design. At the time, Micheal Arad was an unknown Israeli architect. There were specifics of the memorial never being finished due to constant conflict between Arad and the LMDC over creative control [18]. The final memorial design consisted of two reflecting
Figure 4: The official plans for name placement at the 9/11 Memorial reflecting pools.
pools in the footprint of the towers honoring the victims of the bombing in 1993 and the attacks on 9/11/2001. It was called Reflecting Absence. The center of each pool had a 30-foot-deep waterfall and Arad described it as making the absences visible [18[. The waterfalls also contributed to dampening the noise of the busy city and creating a place for quiet reflection. Names of all the victims were inscribed in bronze panels surrounding the pools, arranged based on the wishes of surviving family members. Members of the same flight crew, first responder unit, colleagues in the towers, or friends of the victims were placed together. When first responders went to clear the site, they discovered a surviving Callery pear tree. This tree was cared for and preserved, now functioning as a symbol of perseverance in the plaza. Every year, three seedlings are donated to places that have suffered tragic events such as shootings, terrorist attacks, horrific natural disasters, etc [9]. Landscape architect Peter Walker is responsible for the incorporation of nature into the memorial, similar in design to Pearl Harbor. Four hundred swamp white oak trees, which are native to all three crash sites on 9/11 (Virginia, Pennsylvania, New York) were planted at the memorial site [19]. In 2019, he worked on the 9/11 Memorial Glade which is dedicated to those who are sick or have died from disease after the attacks, and the general recovery efforts where people risked their health to help. The glade features six large rocks with steel from the original Twin Towers inlaid.
Honoring the Deceased
A great deal of thought goes into how victims are honored when memorials are designed. Both Pearl Harbor and the World Trade Center faced specific challenges in design due to the destruction of space, pollution, and unidentifiable bodies that impacted the design of these memorials. Additionally, there are lots of moving pieces in memorialization when taking into account how people remember the event and how the space will be used. A major factor impacting the memory of these events being viewed as patriotic and honorable is that many killed in the tragedies were first responders or members of the armed forces. Pearl Harbor was an active naval base and of the 2,403
Figure 5: A typical national cemetery where deceased members of the service are buried.
killed, only 68 were civilians [20]. Over 97 percent of those killed or injured were members of the service. However, on 9/11, 2,977 lives were lost in the terrorist attacks and 441 first responders and rescue workers were killed while responding [9]. Additionally, hundreds of first responders and people at the site on 9/11 died later of complications from the toxic fumes and injuries sustained. At Pearl Harbor, members of the service are honored with names on a marble wall on the USS Arizona [13]. The memorial to those veterans is also the deceased’s final resting place. Unlike many memorials, it serves as both a memorial and a cemetery. Traditionally, service members are buried in a national cemetery which was impossible in this case. To understand what a national cemetery looks like it is important to consider how the design of the USS Arizona Memorial was informed and to contrast the impact the physical space has on viewers. National cemeteries are designed to reflect the values of the armed forces and to express a protected atmosphere [21]. They are designed to be hallowed grounds that reflect the deceased’s sacrifice and service. Traditionally, they are located in rural areas or near battle sites to be isolated and enclosed. Currently, they are managed by the Department of Veteran Affairs but historically they were managed by the US Army. The layout and design of the marble headstones are uniform and are arranged in geometric patterns: either in rows to represent their tents or around a flag, in each case to reflect military precision. There is a sense of control over the burial locations in a national cemetery. In contrast, the bodies at Pearl Harbor were never recovered and veterans are honored with their
names inscribed on a white marble wall, the form similar to the uniform marble headstones. This design helped make this memorial about the lives lost and less about the attack. Pries’ design differs from the traditional model of honoring deceased members of the armed forces but uses it as a basis to create his design. The massive wall of names invokes a different and more emotional charge than a cemetery. It is a physically imposing cold presence that shadows its visitors versus traditional gravestones which also symbolizes the gravity of the events of December 7th. In contrast, the majority of deaths from the 9/11 terrorist attacks were civilian deaths, so there is no clear methodology on how to memorialize the deceased. When deciding how to honor the deceased at the memorial and create the list of names, how first responders and civilians who died would be honored was a significant debate [1]. Many argued that those who voluntarily went into the Twin Towers should be honored differently than those there at the time of the attack. Ultimately, civilians and first responders were listed together and first responders had a small shield next to their names. This design choice places significance and honor on those first responders who volunteered to enter the wreckage to save people. This debate brought up the idea of the value of life and what memorials have to say about that. How you choose to honor certain deceased groups in a memorial has a big impact on the perception of the value placed on them and in turn how they are remembered.
Figure 6: A plan for a national cemetery, highlighting the symmetrical layout of the graves.
Conclusion
Deciding to visit memorials, regardless of their physical design, brings up unresolved issues and emotions for visitors. It draws attention back to large and sometimes controversial events. It brings up old thoughts and reignites emotions. Underlying feelings and attitudes that come out when visiting memorials are greatly impacted by their design. Emotions and loss put into the physical form of a memorial make a strong impact on viewers and can shape or reshape their view of past events. Ultimately, both the USS Arizona Memorial and the 9/11 Memorial honor the victims of the attacks versus the attack itself and continue to share history. The memorials also impact how we remember these events. For example, the strategic choices made by Alfred Pries ensure that over eighty years later our remembrance focuses on the lives lost versus the destruction of the attack itself, even though the wreckage of the USS Arizona rests right below the memorial. Symbolically, the memorial does not physically touch the ship, creating a sense of separation that allows visitors to engage with the memorial’s design and reflect on the remembrance of the past.
References
[1] White, Geoffery M. “National Subjects: September 11 and Pearl Harbor.” American Ethnologist 31, no. 3 (2004): 293-310. JSTOR.
[2] Pearl Harbor. Accessed July 26, 2024. https://pearlharbor.org/.
[3] Burns, Ken. “FDR and Eleanor Roosevelt Respond to Pearl Harbor.” Video, 6:49. PBS Learning Media. Accessed August 2, 2024. https://ny.pbslearningmedia.org/resource/ fdr-eleanor-roosevelt-respond-pearl-harbor-video/ken-burns-the-roosevelts/.
[4] “World War II In Colour: Episode 5 - Red Sun Rampant (WWII Documentary).” Video. Youtube. Accessed August 9, 2024. https:// www.youtube.com/watch?v=9YLK8xge208.
[5] “Research Starters: Worldwide Deaths in World War II.” The National WWII Museum. Accessed August 24, 2024. https://www. nationalww2museum.org/students-teachers/student-resources/research-starters/research-starters-worldwide-deaths-world-war.
[6] Huiskes, Katherine, ed. “Breadcrumb Remembering September 11 Timeline: The September 11 terrorist attacks.” UVA Miller Center. Accessed August 17, 2024. https://millercenter.org/remembering-september-11/september-11-terrorist-attacks.
[7] Bush, George W. “Statement by the President in His Address to the Nation.” Speech presented at The Oval Office, The White House in Washington D.C., United States of America, September 11, 2001. George W Bush White House Archives. Accessed August 2, 2024. https://georgewbush-whitehouse.archives. gov/news/releases/2001/09/20010911-16.html.
[8] “Direct War Deaths of US and Allied Forces in Afghanistan and Pakistan.” Brown University Watson Institute of International and Public Affairs. Accessed August 24, 2024. https://watson.brown.edu/costsofwar/costs/human/military#:~:text=Over%207%2C000%20 US%20service%20members,continue%20 to%20have%20reverberating%20impacts.
[9] 9/11 Memorial and Museum. Accessed August 2, 2024. https://www.911memorial.org/.
[10]“Occupation and Reconstruction of Japan,1945–52.”Office of the Historian.AccessedAugust 17,2024. https://history.state.gov/milestones/1945-1952/ japan-reconstruction#:~:text=After%20 the%20defeat%20of%20Japan,%2C%20economic%2C%20and%20social%20reforms.
[11] “Osama bin Laden.” FBI. Accessed August 17, 2024. https://www.fbi.gov/history/famous-cases/osama-bin-laden.
[12] “Ships In Pearl Harbor, Wreckage & Memorials, Sharks & Hawaiian Names.”
Pearl Harbor Tours. Accessed August 24, 2024. https://www.pearlharbortours.com/ pearl-harbor/things-you-dont-know/#:~:text=Though%20devastating%20as%20it%20was,repaired%2C%20many%20within%206%20months.
[13] Interior Department, National Park Service, USS Arizona Memorial and Visitor Center: An Administrative and Legislative History, Doc., at 42-47 (Oct. 4, 1982). Accessed August 23, 2024. https://www.govinfo.gov/ app/details/GOVPUB-I29-PURL-gpo91160.
[14] “Spectrum Hawaii; 414; Interview with Alfred Preis.” Video. American Archive of Public Broadcasting, 09 24, 1986. https://america-
narchive.org/catalog/cpb-aacip_225-20ftth1t.
[15] Murphy, Larry. “Preservation at Pearl Harbor.” APT Bulletin 19, no. 1 (1987): 10-15.https://doi.org/10.2307/1494170.
[16] Hammond, Gabby. “The Complete History of Ground Zero: Before and After 9/11.” 9/11 Ground Zero. Last modified April 16, 2022. Accessed August 24, 2024. https://911groundzero.com/blog/the-completehistory-of-ground-zero-before-and-after-9-11/.
[17] “The Plan for Lower Manhattan.” Lower Manhattan Development Corporation.http://www.renewnyc.com/ThePlan/world_trade_center_towers.asp.
[18] Loos, Ted. “Architect and 9/11 Memorial Both Evolved over the Years.” The New York Times, September 1, 2011. https://www.nytimes. com/2011/09/04/arts/design/how-the-911-memorial-changed-its-architect-michael-arad.html.
[19] Peter Walker Works. PWP Landscape Architecture. https://www.pwpla.com/featured.
[20] “Remembering Pearl Harbor: A Pearl Harbor Fact Sheet.” The National WWII Museum. https://www.census.gov/history/pdf/pearl-harbor-fact-sheet-1.pdf.
[21] “Design History of National Cemeteries.” National Park Service. Accessed August 2, 2024. https://www.nps.gov/articles/000/national-cemeteries-design.htm.
pH Effect on Saccharomyces cerevisiae Yeast Cell Proliferation
by Maisy Webster, Kate Marine, Devan Gambello
Abstract
This experiment seeks to determine the optimal pH for Saccharomyces cerevisiae yeast cell proliferation. Yeast, particularly S. cerevisiae, is a model organism for basic biological research as the mechanisms underlying yeast cell proliferation are similar to cellular processes. Similar processes in yeast and humans, such as cell cycle regulation, offer potential insights into the development of diseases like cancer. The procedure included filling twelve conical tubes with solutions of pH 3, 5, 7, and 9–three tubes for each level–and adding 1mL of proofed S. cerevisiae to each tube. The cells were then monitored for their proliferation after each feeding of 0.1g glucose, with a direct cell count for each tube conducted using a hemocytometer. The number of yeast cells before and after feeding was compared to determine which pH allowed most cell proliferation. The results showed that yeast cells can proliferate better in a neutral and basic pH environment, as the cells in the tubes of pH 7 consistently yielded the highest growth rates but were not statistically different from pH 9. Results suggest that pH is critical in regulating yeast cell proliferation. pH 7 and 9 environments might provide the ideal conditions for cancer cells to grow.
Introduction
Yeasts are single-cell eukaryotic fungi organisms [3]. Genes in yeasts and humans encode very similar proteins, such as the Ras proto-oncogene, making S. cerevisiae a valuable model organism for experimentation [1]. The entire genome se-
quence of S. cerevisiae has been discovered, which enables comparison with humans [6]. Studies on human pathways and drug/chemical effects on humans can be tested on S. cerevisiae because of the genome similarities. [6] The hypothesis being tested in this experiment is that if yeast cells are grown in a lower pH solution, they will proliferate more than those in a high pH solution [8].
Methods
To test this hypothesis, the materials used were the baker’s yeast, glucose, pH buffer solutions, conical tubes, a microscope, pipettes, slides and coverslips, a hemocytometer, beakers, graduated cylinders, and distilled water. First, pH solutions of 3, 5, 7, and 9 were prepared using buffer capsules. Three conical tubes were filled with the corresponding pH solution. After the yeast mixture was prepared, 1 ml was added to each conical tube. After a day, a hemocytometer was used to take initial cell counts from the tubes. Each tube was then fed 0.1 gram of glucose and a final cell count was taken after 30 minutes to compare the amount of proliferation that occurred in each pH. The control variables of the experiment were the starting amount of yeast in each tube, the amount of glucose being fed, the time it takes to grow the yeast, and the temperature the tubes are experiencing. The yeast grown in conical tubes with a pH of 5 was the control group because the normal pH for yeast to grow in is around 5.5. The independent variable is the different pH solutions 3, 7, and 9 and the dependent variable is the amount of yeast cell proliferation.
Results and Future Directions
The results show varying amounts of proliferation across pH levels, with pH 7 exhibiting the highest proliferation amount. However, a statistical analysis of variance showed there is no statistical difference between pH 7 and 9. Surprisingly, the control group of pH 5 did not exhibit the most cell growth, however, this is likely due to human error. The overall findings suggest that basic environments promote increased yeast proliferation compared to acidic. Since a pH of 7 was found to be the optimal level for S. cerevisiae proliferation, future experi-
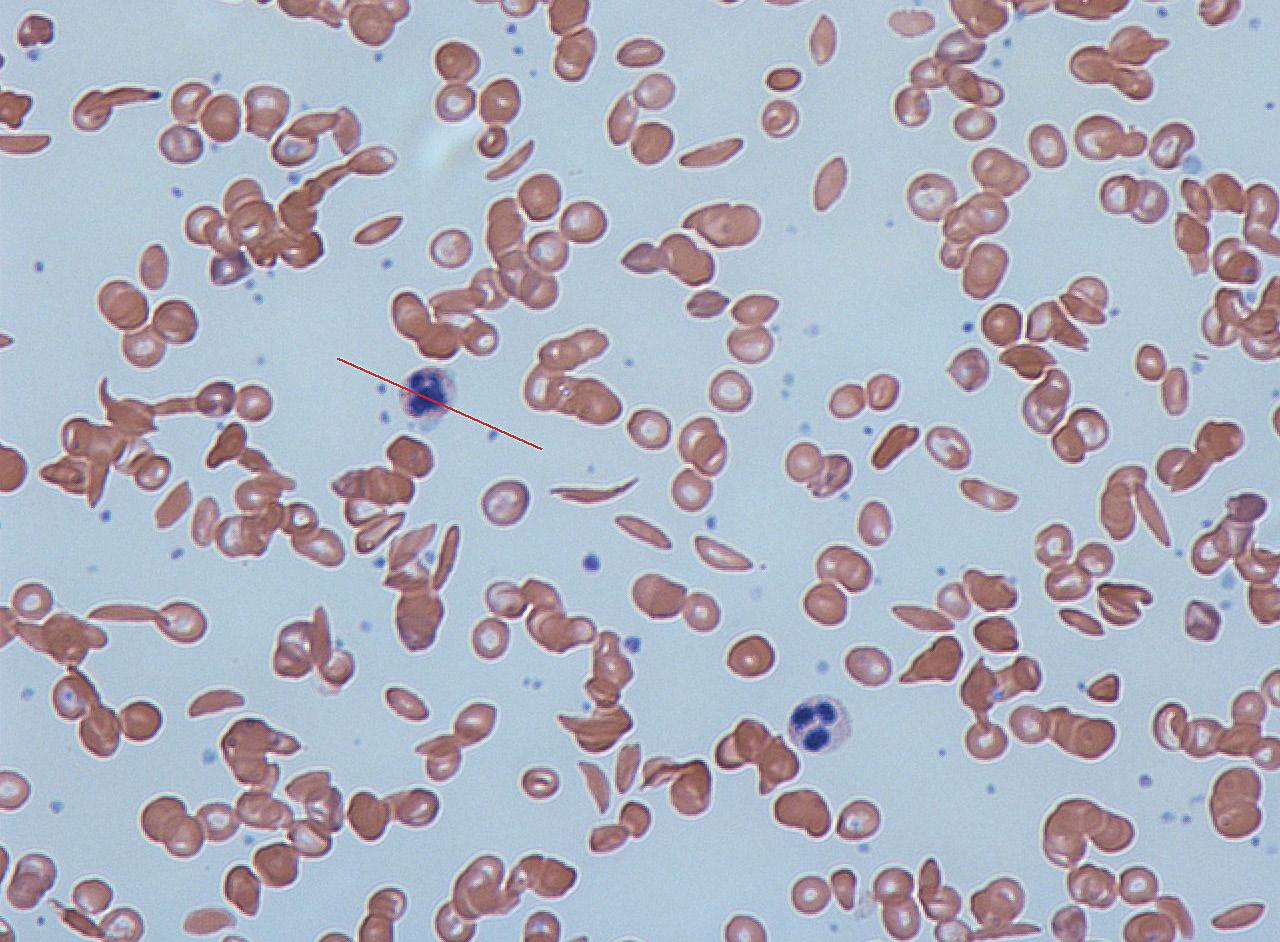
Figure 1: Yeast cells under a microscope
Figure 2: Graph comparing average cell growth in tested pH’s after proliferation (glucose addition)
ments can be done to elaborate on this data and relate it to human cancer. If yeast cells proliferate best at a pH of 7, then it can be assumed that many human cells do too, such as the cells in human blood which tend to have a pH between 7.3 and 7.4 [5]. The correlation between the optimal pH for yeast cell growth and cell growth in blood aligns to conduct future explorations in various types of blood cancer and treatments.
Conclusion
This experiment aims to find the optimal pH for S. cerevisiae yeast proliferation. According to the data accumulated throughout various trials, yeast cells proliferate best at a pH of 7 and 9. The findings also suggest that neutral and basic pH levels promote increased yeast proliferation compared to acidic environments. This means that growing yeast at pH 7 promotes the cell cycle. Scientists have been using yeast for years as a model organism for experiments. Yeast and yeast experiments are important to cancer research because the same genes that control the cell cycle in S. cerevisiae (and that malfunction in tumor cells) exist in a similar capacity in human cells. Scientists have identified more than 100 yeast genes involved in cell cycle control, known as the cell division cycle (CDC) genes. This finding led to the discovery of the human equivalent of CDC genes: the CDK1 gene [9].
References
[1] Botstein, D., Chervitz, S. A., & Cherry, J. M. (1997). Yeast as a model organism. Science (New York, N.Y.), 277(5330), 1259–1260. https://doi.org/10.1126/science.277.5330.1259
[2] Braun-Falco, O., & Korting, H. C. (1986). Der normale pH-Wert der menschlichen Haut [Normal pH value of human skin]. Der Hautarzt; Zeitschrift fur Dermatologie, Venerologie, und verwandte Gebiete, 37(3), 126–129.
[3] Duina, A. A., Miller, M. E., & Keeney, J. B. (2014). Budding yeast for budding geneticists: a primer on the Saccharomyces cerevisiae model system. Genetics, 197(1), 33–48. https://doi.org/10.1534/genetics.114.163188
[4] H. Konig et al. (eds.), Biology of Microorganisms on Grape, in Must and in Wine, Springer-Verlag Berlin Heidelberg 2009, pg. 47-56 https://wineserver.ucdavis.edu/industry-info/enology/wine-microbiology/yeast-mold/saccharomyces-cerevisiae [5] Lewis, J. L., III. (2024, March 18). Alkalosis. Merck Manuals Consumer Version. https://www. merckmanuals.com/home/hormonal-and-metabolic-disorders/acid-base-balance/alkalosis [6] Mengesha, Y., Tebeje, A., & Tilahun, B. (2022). A Review on Factors Influencing the Fermentation Process of Teff (Eragrostis teff) and Other Cereal-Based Ethiopian Injera. International journal of food science, 2022, 4419955. https://doi.org/10.1155/2022/4419955 [7] Mill, B. R. (n.d.). What temperature kills yeast. Bob’s Red Mill. https://www.bobsredmill.com/ blog/baking-101/what-temperature-kills-yeast/#:~:text=The%20bottom%20line%20is%20 that,best%20rise%20and%20flavors%20possible [8] Narendranath, N. V., & Power, R. (2005). Relationship between pH and medium dissolved solids in terms of growth and metabolism of lactobacilli and Saccharomyces cerevisiae during ethanol production. Applied and environmental microbiology, 71(5), 2239–2243. https://doi.org/10.1128/AEM.71.5.2239-2243.2005 [9] Pray, L. (2008) L. H. Hartwell’s yeast: A model organism for studying somatic mutations and cancer. Nature Education 1(1):183
Figure 3: ANOVA data summary of statistical significance
The Effect of Lemma minor on Decreasing Nitrogen and Phosphate Concentration in Contaminated Water
By Ellie Solomon (VI), Alex Rudnik, Jack Goodwin (VI)
Abstract
The aquatic plant Lemma minor, more commonly known as duckweed, can remove nitrate and phosphate from polluted marine environments. This experiment aimed to determine what concentration of duckweed most effectively removes the toxins from water. Experimental parameters involved varying concentrations of duckweed within a constant volume of water and recording the nitrate and phosphate concentrations for each duckweed concentration before and after. The study used a nitrogen probe and phosphate test tablets to record results. The water used was contaminated from the industrial region of the Raritan River. The experimental protocol was replicated across four trials. Results indicated a proportional decrease in nitrate and phosphate concentrations when increasing duckweed concentration. These findings could support duckweed as a natural and sustainable remedy for cleaning contaminated ecosystems.
Introduction
Water pollution is one of the US’s most widespread and challenging environmental problems that is expensive to reverse. Nitrogen and phosphorus are naturally occurring nutrients already found in aquatic ecosystems, but a high nitrogen and phosphate concentration can signal pollution in water. Both elements can be detrimental to animal health and the environment. Although nitrogen and phosphorus are found in natural water sources, abundant amounts can cause algae and aquatic weeds to grow faster than ecosystems can handle [1]. The creation of large algae growths and algal blooms causes an ecotoxicological issue, as these blooms cause extreme reduction or total depletion of oxygen in water [5]. Human activity like dumping industrial waste into water causes a surplus of nutrients to
enter the water. Duckweed might be seen as a nuisance to humans because they populate rapidly and cover the surface of the water, but farmers have identified that duckweed absorbs and thereby removes excess toxic nutrients from the water [1][2]. Duckweed can capture waste nutrients before they cause deadly algae blooms, and it can upcycle the nutrients it takes to reuse as valuable agricultural sources [3]. Duckweed has been examined for its exceptional ability to absorb pollutants and multiply exponentially in the correct conditions [6]. Overall, duckweed is a natural and powerful tool for bioremediation due to its inexpensiveness and high adaptability [4]. In the trials, we grew healthy duckweed and varied concentrations of duckweed in conicals with equal amounts of contaminated water from an industrial site on the Raritan River. We hypothesize that duckweed will remove excess nitrate and phosphate from historically contaminated waters. The trials also serve to determine duckweed survival in very toxic environments like the Raritan River [7]. Our alternative hypothesis is that the higher the concentration of duckweed, the more the concentration of phosphate and nitrogen in the polluted water will decrease. Our null hypothesis is that the concentration of duckweed will not affect the concentrations of nitrate and phosphate in polluted river water.
Methods and Materials
One pound of L. minor was purchased from PondPlants Online and shipped. The L. minor was placed into large buckets to multiply and become as healthy as possible. The open-air buckets were filled with 1000 mL tap water and 1000 mL 2x duckweed fertilizer solution. The containers were placed in cabinets with lights to help the L. minor multiply quickly. The L.
Figure 1: Change in nitrate concentration while varying duckweed concentration in trials 3 and 4.
minor was tended to 3 times a week and more water was added to the containers as needed. A clean bucket was used to gather half a gallon of water from a contaminated region of the Raritan River in Edison, NJ. The water used across the trials was from the same contaminated source. Before every trial, the nitrate and phosphate concentrations in the water were measured. We used a Vernier Nitrate Ion-Selective Electrode with a Nitrate Replacement Module to determine nitrogen concentration. This device uses a Bluetooth connection to display concentration reading through a graphical analysis mobile app. The probe was calibrated by soaking for 30 minutes in a high-standard and low-standard solution. When not using the probe, it was kept in a closed drawer with a consistent temperature. In addition to the nitrogen probe, LaMotte phosphate test tablets, which use 5mL of water in a test tube and change color depending on the phosphate concentration in the water, were used. For the trial setup, 35-40 mL of water was added to four 50 mL conicals. The control group was one conical with 0 duckweed plants. The other 3 groups initially contained 5 duckweed, 20 duckweed, and 40 duckweed. After seeing limited results, we increased the concentration to 20 duckweed, 40 duckweed, and 80 duckweed. The water concentration of nitrate and phosphate was measured and recorded. The conicals sat for one week untouched until the results were recorded. Trials were repeated 3 times.
Figure 2: Change in phosphate concentration while varying duckweed concentration in trials 3 and 4.
Results
In trial 1, the four conicals were filled with 0, 5, 20, and 40 duckweed pieces. Nitrate and phosphate concentrations were measured initially and after 7 days. The starting nitrate concentration of 0.6 mg/L was inaccurate due to probe error. After 7 days, the probe recorded that for 0 duckweed there was a concentration of 0.6, 1.1 for 5 duckweeds, 0.9 for 20 duckweeds, and 0.03 for 40 duckweeds. There was an initial phosphate concentration of 4 mg/L. After 7 days the 0 duckweed had a concentration of 4 mg/L, the 5 duckweed had a concentration of 3 mg/L, the 20 duckweed had a concentration of 4 mg/L, and the 40 duckweed had a concentration of 3 mg/L. In trial 2, the concentration of duckweed was increased for hypothesized better results. The initial nitrate concentration was 8 mg/L. Malfunctions to the probe hindered measurements after 7 days. The phosphate concentration was initially 2 mg/L. After failures of the nitrate probe, the entire trial was scrapped due to error. Trial 3 kept the same conditions as trial 2 and occurred over a week. Originally, the nitrate concentration was about 2 mg/L and the phosphate was around 2.5 mg/L. After a week, the levels for nitrate were: 0 duckweed was 2 mg/L, 20 duckweed was 1.8 mg/L, 40 duckweed was 1.7 mg/L, and 80 duckweed was 0.9 mg/L. The corresponding phosphate concentrations were all around 1 mg/L. In trial 4, the initial nitrate concentration in the water was 2.53 mg/L, and the phosphate concentration was 3.5 mg/L. Our levels for nitrate were: 0 duckweed was 2.03 mg/L, 20 duckweed was 2.01
mg/L, 40 duckweed was 1.92 mg/L, and 80 duckweed was 2.71 mg/L. The phosphate levels for all duckweed concentrations were around 3 mg/L. A linear regression on the data from trials 3 and 4 was run.
Discussion
Data from the trials 1 and 2 were inconclusive because the nitrate probe malfunctioned, creating sporadic and unreliable data. Results are included but do not accurately contribute to the hypothesis. Trial 3 produced convincing results for duckweed helping to remove nitrate from contaminated water. The original water source had a nitrate concentration of around 2 mg/L and showed significant reduction as the duckweed amount increased. This trial provides evidence that a larger amount of duckweed removes nitrate from the contaminated water source. If a human consumed the original nitrate concentration, they would have an increased chance of developing bowel cancer (Figure 3). The lower the nitrate concentration, the less likely the person will develop bowel cancer. Some concentrations of duckweed in trial 4 also showed the ability to remove nitrate and phosphate from the water.
Conclusion
It is important to note that sample sizes were small for this experiment. Due to trials 1 and 2 failing, only data from trials 3 and 4 were presented. If this experiment is repeated, a much larger sample size and a greater number of variations of duckweed should be used. Further analysis can be done to determine the best amount of duckweed to clean contaminated water. A more effective tool to determine nitrate and phosphate concentration is necessary for more accurate results. Duckweed is a natural way to clean contaminated water. With more successful trials, this
Figure 3: Higher nitrate concentrations in drinking water have greater potential health risks [8]
technique of adding duckweed to heavily contaminated regions of water can help purify water to even drinkable levels. It will also help animals in the region return to their natural habitats and repair the environment.
References
[1] Fertig, W. (n.d.). U.S. Forest Service. Common duckweed (Lemna minor). Retrieved January 18, 2024, from https://www.fs.usda.gov/wildflowers/plant-of-the-week/lemna_minor.shtml [2] Harvey, R. M., & Fox, J. L. (1973). Nutrient Removal Using Lemna Minor. Journal (Water Pollution Control Federation), 45(9), 1928–1938. http://www.jstor.org/stable/25037983 [3] Schley, T. (2020, December 1). Researchers aim to ‘upcycle’ nutrient waste on farms using duckweed. Penn State University. Retrieved January 18, 2024, from https://www.psu. edu/news/research/story/researchers-aim-upcycle-nutrient-waste-farms-using-duckweed/ [4] United States EPA. (2023, November 29). The Problem. United States EPA. Retrieved January 18, 2024, from https://www.epa.gov/ nutrientpollution/problem#:~:text=Too%20 much%20nitrogen%20and%20phosphorus%20in%20the%20water%20causes%20algae,aquatic%20life%20need%20to%20survive [5] Zanga, H. (2019, November 17). Tropical Marine Biology. Pressbooks. Retrieved January 18, 2024, from https://pressbooks.pub/tropicalmarinebio/chapter/harmful-algal-blooms/ [6] Zhou,Y., Stepanenko, A., Kishchenko, O., Xu, J., & Borisjuk, N. (2023). Duckweeds for Phytoremediation of PollutedWater. Plants (Basel, Switzerland), 12(3), 589. https://doi.org/10.3390/plants12030589 [7] Ziegler, P., Sree, K. S., & Appenroth, K. J. (2016). Duckweeds for water remediation and toxicity testing. Toxicological & Environmental Chemistry, 98(10), 1127–1154. https://doi.org/10.1080/02772248.2015.1094701 [8] Nitrate contamination in drinking water. (n.d.). Greenpeace. Retrieved April 28, 2024, from https://www.greenpeace.org/ aotearoa/freshwater/nitrate-contamination-in-drinking-water-what-you-need-toknow-and-some-frequently-asked-questions/
Alkaline Exchange Membrane Fuel Cells (AEMFC) are at the forefront of research in sustainable and renewable energy systems due to their higher power output than proton exchange membrane hydrogen fuel cells. However, their widespread use is limited by their short lifespans and the requirement of pure oxygen conditions [1]. Current efforts aim to improve their power efficiency and stability, particularly addressing challenges such as the migration of Platinum (Pt) ions across the Anion Exchange Membrane (AEM), which rapidly degrades fuel cell performance [2].
In this study, the use of graphene-based materials, including graphene oxide (GO) and partially reduced graphene oxide (prGO), was explored at various concentrations (6, 12, 15, 18, and 21 mmol NaBH4) to enhance AEMFC performance. It was hypothesized that adding prGO to the AEM would improve fuel cell efficiency due to graphene’s high electrical conductivity and large surface area [3].
GO, prepared by Hummer’s method, was dissolved in distilled water and partially reduced with NaBH4 to create the prGO at different concentrations. XRD results showed that 21 mmol reduction prGO had a more oxidized degree than 12 mmol prGO. Figure 1(a) shows that after air-spraying prGO solutions onto Sustainion membranes, the 12 mmol prGO sample exhibited the best performance, achieving a maximum power density of 0.604 W/cm2—a 48.8% increase over the control sample. As the concen-
tration of NaBH4 increased beyond 12 mmol, a progressive decrease in the maximum power density was seen. The 12 mmol prGO sample outperformed the GO sample by 92 mW/cm2.
Additionally, fuel cell performance was examined when only the anode or the cathode was coated with 12 mmol prGO. The anode-only sample, with an 18.23% increase over the control sample, demonstrated slightly higher performance than the cathode-only sample, with an 8.87% increase, as seen in Figure 1(b). However, the highest performance was achieved when both sides of the Sustanion membrane were sprayed, indicating a positive synergistic effect.
This study suggests that prGO, particularly at the 12 mmol concentration, is a promising material for enhancing the performance of AEMFCs, leading to significant improvements in peak power density. These findings could contribute to the proliferation of AEMFCs as a viable method of sustainable energy generation, with potential applications spanning the transportation industry, spacecraft development, and beyond.
Figure 1: (a) Power desntiy curve for various prGO concentrations. (b) Power desntiy curve for 12 mmol prGO membranes
References
[1] Ramaswamy, N.; Mukerjee, S. Alkaline Anion-Exchange Membrane Fuel Cells: Challenges in Electrocatalysis and Interfacial Charge Transfer. Chemical Reviews 2019, 119 (23), 11945–11979. https://doi.org/10.1021/acs.chemrev.9b00157.
failovich, M.; Dekel, D. R. Migration and Precipitation of Platinum in Anion‐Exchange Membrane Fuel Cells. Angewandte Chemie 2023, 135 (37). https://doi.org/10.1002/ange.202306754.
[3] Somya Samantaray; Mohanty, D.; Santosh Kumar Satpathy; Hung, I-Ming. Exploring Recent Developments in Graphene-Based Cathode Materials for Fuel Cell Applications: A Comprehensive Overview. Molecules 2024, 29 (12), 2937–2937. https://doi.org/10.3390/molecules29122937.
Hawthorn: A Plant-Derived Cholera Toxin Inhibitor
by Daniel Hall (V)
Currently, there are no effective post-exposure treatments for cholera, a deadly disease that causes severe dehydration and diarrhea. This study aimed to identify natural plant extracts with inhibitory activities against cholera toxin (CT), an AB-type toxin produced by Vibrio cholerae. CT is the main causative agent of cholera. Consequently, various extracts were screened against the binding of Fluorescein Isothiocyanate (FITC) and CTB to monitor their anti-toxin activities. Since previous studies confirmed that grape seed extract successfully inhibits CT
binding, it was used as a positive control. In the experiments, it was shown that both Hawthorn and Green Tea Extracts significantly inhibit the binding activity of CT. Considering this finding, the screening was expanded to identify additional natural products that could potentially inhibit CT and other AB-type toxins. The potential for these extracts to act as treatment for cholera comes from not only their ability to inhibit CT, but also from their accessibility and affordability. Additional experiments are being conducted to ascertain the method of inhibition these extracts use. Overall, these findings will serve as a foundational basis for natural products that can be used as post-exposure therapeutics against cholera and other bacterial diseases.
Figure 2: Hawthorn Plant
Figure 1: Vibrio cholearae
Psychology and Brain Connectivity Changes Following Trauma Focused CBT and EMDR Treatment in Single
Focused PTSD Patients
by Lizzy Nikitin (VI)
Post-Traumatic Stress Disorder (PTSD) may occur in people after a traumatic event. Since symptoms, including flashbacks, distressing thoughts, and exaggerated emotions, are detrimental to daily functioning and well-being, therapy methods targeting trauma are areas of interest [1]. In this study, researchers compared the effects of two different therapy methods on brain activity in PTSD patients.
Previous research was inconsistent in revealing activity in different brain regions of PTSD patients because of focus on specific regions. Santamecchi et al. (2019) aimed to survey the whole brain to measure the clinical improvement in PTSD patients post-psychotherapy and assess the impact on their functional connectivity patterns.
37 PTSD patients, all of whom experienced the 2002 earthquake in Italy, were randomly assigned to undergo TF-CBT or EMDR. Clinical assessments were performed before and after treatment using CAPS, DTS, and WSAS. Patients also underwent an fMRI to characterize their functional connectivity both before and after therapy.
EMDR and TF-CBT prompted two main patterns of connectivity changes. The decreased connectivity between the left visual cortex and left temporal pole may indicate that visual stimuli bring up flashbacks less often. The increase in connectivity between the superior frontal gyrus and right temporal pole may reflect altered thought patterns that help regulate emotional reactions toward trauma-related content. Greater connectivity allowed for
management of intrusive thoughts and ability to think about traumatic experiences without disturbing emotions or somatic reactions.
Overall, this study demonstrates how EMDR and TF-CBT affect functional connectivity and how that connectivity is associated with PTSD symptoms and severity. This study also offers evidence that the two therapy methods may have similar effects on the brain. However, generalization of findings to other trauma types cannot be made.
Credit: Google Images
References
Post-Traumatic Stress Disorder. (n.d.). In National Institute of Mental Health. Retrieved August 6, 2024, from https://www.nimh.nih.gov/health/ topics/post-traumatic-stress-disorder-ptsd
Serum Arginase-1 as a Predictive Biomarker for Head and Neck Cancer
by Ella Tabish (VI)
While recent advances in immuno-oncology have revolutionized how head and neck squamous cell carcinoma (HNSCC) is treated, only a subset of patients benefit from these drugs and experience deep clinical responses. Biomarker-guided identification of patients likely to respond to immunotherapy could enable superior management of HNSCC. One potential predictive biomarker is serum arginase-1 (sArg1).
While sArg1 is not readily found in healthy donor serum, unpublished data has detected it in a cohort of HNSCC patients and may be able to predict HNSCC patient survival in a regimen-specific manner. This study aims to evaluate the cellular source of arginase-1 and link its biological processes to the observed differences in the predictive potential of sArg1. In melanoma patients, sArg1 concentrations directly correlate with the absolute cell counts of circulating CD14lowCD3-CD19myeloid cells. Based on this data, the hypothesis is that sArg1 may be a surrogate biomarker for a specific CD14low myeloid population critical for HNSCC patient response to immunotherapies.
Titration of imiquimod (TLR7 agonist) was used to treat bulk peripheral blood mononuclear cells (PBMC), MACS-isolated circulatory monocytes, or dendritic cells. After treatment, cells were collected, labeled with fluorochrome-labeled antibodies, and analyzed by flow cytometry using the CytoFlex flow cytometer. Cell-conditioned media was tested using arginase-1 ELISA.
Imiquimod-induced arginase-1 production is evident in dendritic cells (DC), intermediate monocytes, and classical monocytes, but not in non-classical monocytes and monocytic myeloid-derived suppressor cells (M-MDSCs). DCs required the presence of bystander lymphocytes to produce arginase-1 in response to imiquimod.
These results indicate that sArg1 levels may serve as a surrogate measure of circulating DC frequencies and the fitness of tumor-specific lymphocytes. Further studies are needed to link these observations to the frequencies of DCs in HNSCC patient blood.
Figure 1: Flow Cytometry Data and Gating Strategy for Arginase-1 Produced by Specific Myeloid Cell Subsets in Response to Imiquimod Simulation in a Dose-Dependent Manner
Figure 2: Normalized Flow Cytometry Data for MACS-sorted Monocytes and Dendritic Cells
Figure 3: Elisa Assay Data Using Cell Conditioned Media from Previous Experiments
Summer Programs
Analyzing the Relationship Between Intellectual Aptitude and Susceptibility to Cognitive Illusions
by Elbert Ho (VI)
Over the summer, I conducted research as a part of the Governor’s School of New Jersey Program in the Sciences. Besides taking classes in neurobiology, molecular orbital theory,
Figure 1: Shepard Tables: the two tabletops are identical though they look different
and chemical principles in living systems, I worked with a team of eleven other students on the psychology team project. We studied the relationship between intellectual aptitude and susceptibility to cognitive illusions, special tasks designed to exploit the human brain to make mistakes. In particular, cognitive illusions take advantage of ‘predictive processing,’ the human mind’s unique ability to make educated guesses to fill in lapses
in sensory information. This mental shortcut can be extremely beneficial in daily life but can hamper our abilities in specific situations. Our hypothesis was that the increased general intelligence and mathematical abilities of the Governor’s School scholars would lead to a decreased susceptibility to a wide battery of cognitive illusions. We studied 16 different cognitive illusions and compared the performance of the scholars to a random sample of online surveyees. For example, one illusion we tested was Shepard’s tables, as seen below. While the two parallelograms may seem different, they are the same shape rotated 90 degrees. In the end, we found there was no significant statistical difference between the scholars and the general population on sensory tasks, like Shepard’s tables, and memory tasks, such as DRM False Memory. The scholars did perform better in judgment tasks, like deciding whether a sequence of HHHHH or HTTHH would be more likely, but were more susceptible to self-perception tasks, like the Illusory Superiority effect. This is an illusion where people are likely to consider themselves above average in ‘desirable’ traits and below average for ‘undesirable’ ones. We concluded that there is very little correlation between intellectual aptitude and susceptibility to most illusions.
Hawkeye App Start-up Experience at UC Berkeley
By Serena Lin (V)
This past summer, I started a company with three other friends. It began with four students in a dorm room and a Snapchat notification popping up on one of our screens—what we expected to be a casual “What’s up?” from a friend, horrifyingly turned out to be a deep-faked sexually explicit picture of our friend, their IP address, and a threat to spread the photo to their school, friends, and family from an unknown user. This was no ordinary message—it was a sextortion scam. All four of us immediately reported the user’s account, hoping it would be taken off the platform and prevent the scammer from reaching future victims. To our surprise, Snapchat replied within 5 minutes dismissing our case claiming that the scammer “did not violate their community guidelines.”
Online sextortion, predation, and grooming are no rare occurrences. According to the FBI, 1 in 5 children are sexually solicited online with over 500,000 registered online child predators active every day, most often targeting teen girls. The internet, intended to be a platform to increase human connection, is one of the most accessible yet dangerous places to be, as almost 90% of sexual advances on children occur online.
The four of us decided to take matters into our own hands by founding Hawkeye, an app that provides a robust, user-driven reporting and alert system. Our solution works in 3 simple steps: first, users who encounter predatory behavior can report the incident by detailing their experience and submitting supporting evidence via our built-in screen-sharing feature. Next, our team of qualified social workers, supported by our advanced AI model, carefully reviews and processes the reports. Finally, the data from these reports, combined with public metadata, is used to create a public profile of the predator, alerting other teens to avoid interaction and helping prevent future harm. Hawkeye operates on a freemium business model designed to provide essential safety features while offering enhanced capabilities through a premium plan. Free users can access a simplified risk score generated by Hawkeye’s algorithm, which evaluates report frequency and severity. If a user has been flagged for suspicious activity, their profile may display a “potential risk” warning to caution others from engaging with them. Free accounts include access to three full reports, after which users can subscribe to the premium plan, priced at $3 per month—to unlock unlimited reports.
Our dual marketing strategy focuses on both business-to-business (B2B) and direct-to-consumer (B2C) approaches. At launch, we prioritized B2B sales, partnering with school districts. The sales were primarily focused in the Bay Area through our partner SchoolMint which offered Hawkeye Premium in bulk for their students. This approach is particularly effective in centralized communities, where reports and Figure 1: Hawkeye Login Page
warnings will be highly relevant to the people that users engage with everyday. On the B2C side, targeted social media advertising campaigns are going to be launched to proactive teens who frequently use social media, young adults active on dating apps, and parents seeking to protect their children from online threats.
Positive market feedback was received following the product’s development, which validated our practices through consultations with AI and data privacy lawyers, generated leads via social media, and was awarded thousands of dollars in grants, including from Microsoft. Looking ahead, our vision includes partnering with platforms like Snapchat, Instagram, and Tinder to implement a “report on Hawkeye” feature, streamlining the reporting and search process for users. Through Hawkeye, we are building a future where teens are empowered to take control of their online interactions, making the digital world a safer and more accountable space for everyone.
Figure 4: Hawkeye App as of August 2024
Figure 3: Hawkeye Logo
Figure 2: Initial UI Design Draft
Neurosurgery Research Internship at CHOP
by Carolyn Zhou(VI)
This past summer, I got the amazing opportunity to intern at the Children’s Hospital of Philadelphia, one of the nation’s leading pediatric institutes. For three weeks, I observed the work of lab directors, research technicians, and surgeons in the Center for Data-Driven Discovery in Biomedicine, or D3b. The lab was founded in 2016 by the Chief of Neurosurgery, Dr. Jay Storm, and the Alexander B. Wheeler Endowed Chair in Neurosurgical Research, Dr. Adam Resnick. D3b is unique because of its multidisciplinary approach that sees units from the operating room to the wet lab to the computational office. The teams combine under a common goal to make clinical and genomic data on pediatric brain tumors more accessible, encouraging the sharing of data for the collective good rather than the competitive concealment often perpetuated in scientific research.
While at D3b, I mainly shadowed lab technicians in the Pre-clinical Laboratory Research Unit. There, I saw the physical structure of a vast professional lab and its functions, from maintenance to experiments to team meetings. Each lab tech had their area of expertise focused on propagating and preserving brain tumor cells and bodily fluid samples to be stored in the biorepository and shared with other interested labs worldwide. One of the fascinating things the lab was working on was characterizing and
investigating the use of organoids for drug therapy. Unlike cell lines, organoids are like miniature versions of brain tumor tissue that can replicate the structure and function of the larger organ in 3D. While they are currently much more labor-intensive and difficult to work with than cell lines, validating them for research use could provide more accurate testing of drugs due to their closer resemblance to actual tumors.
Additionally, I gained some hands-on experience in molecular biology techniques when I cultured and passaged a canine tumor cell line. Using any tools in a professional lab was quite daunting as the researchers with more experience employed these techniques with practiced ease. Still, I noticed many similarities between the equipment and protocols used in the D3b lab and our school lab,a a great advantage of the research opportunities available at Pingry.
One of the researcher technician’s jobs was to collect blood, spinal fluid, and urine samples from consenting patients in the clinic and surgery units of the hospital. Following her around, I viewed the patient-facing aspect of the clinics connected to the lab and even got the chance to watch a few brain surgeries. One of the operations I saw was an endoscopic endonasal surgery, which is a minimally invasive technique where the surgeons go up through the nose to operate on the front of the brain. I observed the precise work of the surgeons, the care of the doctors and nurses, and the overall good-natured and respectful attitudes of all those involved in the hospital and research areas which countered the difficult nature of their work.
This experience allowed me to see the many different sides of what a career in medical research could look like and reaffirmed my interest in the field of pediatrics. busy and extremely important workspace.
Reporter Articles
Biological Anthropology HIRT
by Cecilia Caligiuri (V)
Since last September, the Biological Anthropology Humanities Independent Research Team has been conducting a mitochondrial haplogroup experiment while deepening our understanding of anthropology and human evolution by reading Sapiens: A Brief History of Humankind by Yuval Noah Harari. Last year, our team collected mitochondrial haplogroup data from the National Library of Medicine database on individuals of diverse backgrounds. We examined factors such as race, age, ethnicity, sex, country of origin, time period, and, most importantly, genetic variations at DNA base 14766. Using this data, our team created specific graphs to track the prevalence of the closely related H and U mitochondrial haplogroups over time.
Eventually, we aim to understand how these two mitochondrial haplogroups may have influenced hu-
man survival during periods of famine and increased susceptibility to conditions such as diabetes and obesity in times of abundance. In addition, we aim to determine whether external environmental factors, such as natural disasters or significant human events like the Great Depression, played a role in the emergence and divergence of these two haplogroups.
During meetings, we discuss readings and explore questions about human identity, such as the diversity of Homo species that were present on Earth in the past and the ways we have evolved over time such as through the Cognitive and Agricultural Revolutions. We especially reflect on how modern humans compare to our ancestors and other hominins, like the Neanderthals and Homo erectus.
Figure 1: Map of Human Mitochondrial Haplogroups. Photo Credits: Google Images.
Chat GPT-4: A Leap Forward for Generative AI
by Eric Chen (IV)
Released on March 14, 2023, Open AI’s GPT4 represented a major leap in large language models (LLMs). Its predecessor, GPT-3.5, could only handle text-based input, but GPT4 is multimodal and versatile, accepting text and image input. GPT-4 learns user writing styles, generates code, and demonstrates stronger problem-solving capabilities than GPT-3.5. GPT-4 exhibits near-human performance on professional and academic benchmarks, scoring in the 90th percentile for the Uniform Bar Exam (UBE), the test designed to assess the knowledge and skills necessary for a lawyer to practice law in the United States.
As opposed to older AI models, GPT-4 did not require Reinforcement Learning from Human Feedback (RLHF), which consists of automated reward functions paired with human evaluations. Instead, GPT-4 was solely stimulated using real test questions.
One of the biggest weaknesses of the GPT models is hallucinations, where it generates
false or misleading information and presents it as fact. There are two types of hallucinations. The first type is open-domain hallucination, where the model confidently provides wrong information. The second type is closed-domain hallucination, where the model makes up extra information irrelevant to the prompt. Open AI has tried to address open-domain hallucinations by flagging non-factual real-world data sets and creating factual data sets in replacement. To combat closed-domain hallucinations, GPT-4 reevaluates its responses when it creates synthetic data irrelevant to the input. With these improvements, GPT-4, by factuality evaluations, has improved its accuracy by 19% compared to GPT-3.5.
Chat GPT-4 also improved on safety, being 82% less likely to respond to prompts for disallowed content and 29% more likely to respond to sensitive requests per Open AI’s policy. In its enhanced version, GPT-4o, it has learned to reason with audio, video, and text in real-time.
Figure 1: GPT-4 Performance on Various Tests. Photo Credits: Google Images.
Figure 2: GPT-4 Performance on Various Facts. Photo Credits: Google Images.
CRISPR Gene-Editing and Recent Breakthroughs
by Derek Peng (IV)
Gene editing is a modern revolutionary development with applications in medicine and cancer research. Recently, there was a breakthrough in the treatment of sickle cell disease, which affects approximately 100,000 individuals in the United States. This genetic blood disorder, caused by a genetic mutation, previously had limited treatment options, but through new gene-editing technology, might have a cure.
Red blood cells are normally round and carry oxygen smoothly, but in sickle cell disease, the abnormal cells obstruct blood flow, causing severe discomfort, difficulties with the liver and heart, and a reduced life expectancy [1]. The new CRISPR technology was seen to modify the gene responsible for the disease. The precision of CRISPR editing allows the tool to change specific portions of a gene. The Cleveland Clinic Children’s Medical Center collected 18 patients’ stem cells for gene editing. A section of the collected gene was first disrupted and then
deleted from the DNA. A new genetic template was inserted to replace the deleted one, removing the sickle cell trait from the gene. The treatment seemed initially successful and relieved the patients from prior pain.
This first application of the CRISPR technology demonstrates gene editing’s potential to cure future diseases. Curing one genetic disease indicates a bright future for curing other genetic disorders and infectious diseases.
References
[1] McMaster, Macy, and Alicia Reale-Cooney. “Novel Gene-Editing Therapy Continues to Show Positive Results in Sickle Cell Patients.” Novel Gene-Editing Therapy Continues to Show Positive Results in Sickle Cell Patients, Cleveland Clinic, 14 June 2024, newsroom.clevelandclinic.org/2024/06/14/ novel-gene-editing-therapy-continues-to-show-positive-results-in-sickle-cell-patients. Accessed 27 Sept. 2024.
Figure 1: Normal and Sickle Cells in Human Blood. Photo Credits: Google Images.
Figure 2: Cartoon of CAS-9 Function. Photo Credits: Google Images.
Potential for Habitability on the Moon Europa
by Shanti Swadia (IV)
On October 10, 2024, NASA plans to launch the Europa Clipper to assess Europa’s habitability. The $5.2 billion Europa Clipper will reach its destination in June 2030, conducting 49 close flybys of the moon, and contains various scientific instruments to collect chemical, physical, and geological data from Jupiter’s moon [1, 2].
With an equatorial diameter of approximately 1,940 miles, Europa is the fourth largest moon of Jupiter. It orbits Jupiter at a distance of roughly 417,000 miles and each orbit takes approximately 3.5 days. Europa also has a smooth surface with an ice shell about 10-15 miles thick; as evidence suggests, this ice floats on an approximately 70-mile-deep ocean [3].
The famous Italian astronomer Galileo discovered that the layer of electrically conductive fluid beneath Europa’s icy composition disrupted Jupiter’s magnetic field around the planet [3]. Modern scientists have deduced that the salty water of the ocean is likely responsible for this magnetic signature. Scientists today predict that the oceans of Europa contain twice as much water as the oceans
of Earth, making this moon a promising location for life. Moreover, Europa also contains the chemical building blocks of life: carbon, hydrogen, nitrogen, oxygen, phosphorus, and sulfur (CHNOPS). Thirdly, though Europa does not get energy from the sun, Jupiter’s powerful radiation may create fuel for life in Europa’s deep oceans.
From NASA’s Kennedy Space Center in Florida,NASA’s Europa Clipper mission will hopefully uncover the potential for habitability on Jupiter’s moon.
References
[1] Ahart, Jenna.“NASA’s Europa Clipper spacecraft is set to look for life-friendly conditions around Jupiter.” Technologyreview.com, 2 Oct. 2024, www.technologyreview.com/2024/10/02/1104818/ europa-clipper-set-to-look-for-life-friendly-conditions-around-jupiter/. Accessed 2 Oct. 2024.