RARE GROUP is known for marketing Calgary’s most elegant and luxury properties while bringing a personalized and proven approach to the art of buying and selling real estate at all price points.
With an unparalleled passion and dedication for real estate, RARE GROUP is a dynamic group of real estate professionals who believe strongly in delivering premium client service, luxurious marketing, and above all, results. Each bring an unwavering focus to educating and guiding clients as they navigate Calgary’s ever changing market. Their open and frequent communication style brings a high standard of excellence to the real estate world.
Ruth Alexander, Founder of RARE Group, has led this hard working team to over $100 million in closed transactions in a relatively short period of time and has the distinction of being ranked among the top 1% of REAL Broker, Luxury Division real estate agents nationally. Ruth and her esteemed Group share the same core values in striving for excellence and always keeping client’s needs as top priority.
As the real estate market evolves, so do the strategies RARE Group uses to market our listings. We are leaders the industry in digital, web and social media marketing which enables us to consistently reach high-end buyers locally, nationally and globally.
Whether working with first time home buyers or luxury home sellers — RARE Group treats every property and client with equal high levels of respect, collaboration, communication, and service, providing all the information, education, and guidance needed to make informed decisions. Our innovative strategies and passion for client service have led to record sales in Calgary, and lifelong client relationships.
RARE Group is more than a team, we are a family. We share the same work ethic, vision, passion and drive for excellence. Looking forward to working with our clients in 2023 and beyond.
PAGE 4-7
PAGE 8
PAGE 9
PAGE 10
PAGE 11-14
PAGE 15
PAGE 16
PAGE 17-21
PAGE 22
NORTH AMERICAN LUXURY MARKET REVIEW
13-MONTH MARKET TRENDS
SINGLE-FAMILY HOMES MONTHLY OVERVIEW
ATTACHED HOMES MONTHLY OVERVIEW
MONTHLY STATISTICS BY CITY
LUXURY REPORT EXPLAINED
WELCOME MESSAGE
LOCAL LUXURY MARKET REVIEW
THANK YOU
NORTH AMERICAN LUXURY REVIEW
THE STATE OF THE LUXURY REAL ESTATE MARKET
As we progress into 2025, the luxury real estate markets in both Canada and the U.S. are experiencing a dynamic landscape shaped by economic trends, demographic shifts, and changing buyer preferences.
While both countries entered the year with optimism, supported by declining interest rates and strong buyer demand, emerging economic concerns have led some investors to adopt a more cautious approach. However, inventory levels are rising in both markets, fueling optimism despite ongoing uncertainties.
FEBRUARY’S MARKET DATA
Market sales data from February highlights an upward trend compared to both February 2024 and January 2025. Single-family home sales increased by 4.4% year-over-year and 16.2% month-over-month, while condo and townhome sales saw a 2.3% increase compared to last year and an 18.7% rise from January. This growth has been accompanied by a notable expansion in inventory, both annually and monthly.
Single-family home inventory saw a 24.2% year-over-year increase, with new listings rising by 17.9%. On a month-over-month basis, inventory climbed by 10.9%, though new listings showed only a modest 2.3% uptick, suggesting a degree of seller caution.
Similarly, condos and townhomes experienced a 27.8% rise in available inventory and a 15.7% increase in new listings compared to February 2024. However, relative to January 2025, although inventory grew by 10.7%, new listings declined by 6.3%.
This cautious sentiment is evident as a broader market trend – despite the sales activity increasing, inventory is expanding at a slightly faster pace. Additionally, the decline in new inventory entering the market, especially for condos and townhomes, signals a measured approach by sellers, reflecting a waitand-see attitude amid shifting market conditions.
While this data reflects the overall luxury real estate market across North America, recent trends highlight
the many similarities between Canada and the U.S. as well as some notable differences.
SIMILARITIES BETWEEN CANADA AND THE U.S. LUXURY MARKETS
Interest Rates and Buyer Caution: Both markets have benefited from declining interest rates, encouraging renewed activity. However, broader economic concerns, such as stock market volatility and geopolitical factors, have tempered some of the initial enthusiasm.
Ultra-Luxury Segment Resilience: High-net-worth buyers in both Canada and the U.S. remain relatively unaffected by interest rate fluctuations, prioritizing property desirability over financing conditions. When prime properties become available, these buyers act swiftly.
Growing Inventory and Generational Shifts: An increasing number of Baby Boomers in both countries are divesting from their luxury properties, contributing to higher inventory levels. At the same time, affluent Millennial and Gen Z buyers are entering the market, bringing new preferences, such as sustainability, smart home technology, and modern design.
Single-Family Homes as a Preferred Asset: Across Canada and the U.S., single-family homes remain the most sought-after luxury property type, with demand continuing to drive the market.
Strategic Pricing and Buyer Selectivity: Buyers in both countries are becoming more discerning, making strategic pricing essential for sellers to attract interest. Location, unique property features, and overall value proposition are key considerations for high-end buyers.
KEY DIFFERENCES BETWEEN CANADA AND THE U.S. LUXURY MARKETS
Economic Concerns: While both markets face economic uncertainty, Canada’s luxury real estate sector is shaped by stronger taxation policies, restrictions on foreign investment, and historic immigration levels, as affluent newcomers drive demand for high-end homes in major cities.
In contrast, the U.S. market is more influenced by stock market performance, foreign investment, and tax incentives. More flexible inheritance tax policies offer greater flexibility for wealth preservation, and certain states with no income tax create additional financial advantages for luxury homebuyers.
Market Dynamics: Canada’s limited luxury housing supply, particularly in major cities like Vancouver and Toronto, continues to drive competition among high-net-worth buyers, leading to price stabilization, even in downturns. In contrast, the U.S. offers a more diverse luxury market, ranging from New York penthouses to sprawling Texas estates, resulting in greater variability in inventory levels and pricing trends.
Luxury condominiums are gaining traction in both countries, though regional preferences differ. In Canada, cities like Calgary and Montreal are seeing rising condo demand due to relative affordability and foreign buyer eligibility for students and workers on visas under Canadian regulations. Meanwhile, in the U.S., high-end condos are particularly sought after in Miami, New York, and Los Angeles, often driven by tax advantages and strong international investment.
Demographic Influence: The generational shift is evident in both markets, but Canada’s luxury market is seeing a pronounced influence from domestic high-net-worth individuals and wealthy immigrants. Luxury home purchases are often driven by family-oriented decisions, with a strong focus on lifestyle, education and community.
The U.S. market, on the other hand, sees more of a mix of lifestyle and investment buyers, with many secondary homes serving as wealth preservation assets. International buyers are attracted by fewer restrictions and the appeal of real estate as a safe-haven investment, with Miami, Los Angeles and New York still the top luxury destinations.
Millennials and Gen Z play a larger role in the U.S. luxury market, while in Canada, luxury homeownership still skews slightly older.
Regulatory Environment: Canada has more stringent foreign buyer regulations, which influence investment patterns in its luxury market. The U.S., in contrast, remains a top destination for international luxury investors due to its relatively open real estate market and certain state-level tax advantages.
As both countries navigate ongoing economic shifts and evolving buyer demographics, the luxury real estate markets in Canada and the U.S. remain resilient. While external pressures may cause temporary hesitations, strong fundamentals, increased inventory, and shifting buyer preferences ensure that luxury real estate continues to be a dynamic and attractive sector in both nations.
A GLOBAL PERSPECTIVE
Key insights into the current global real estate market were recently highlighted by Liam Bailey, editor of The Wealth Report by Knight Frank, a leading independent global real estate consultancy.
Despite ongoing global uncertaintyincluding AI disruptions, shifting geopolitical power, rapid investor movements in
response to financial market risks, and concerns over tariffs and inflation - global GDP growth is expected to remain strong, with interest rates anticipated to gradually decline.
This is particularly significant for real estate, where high debt costs and rising fixed income returns have led to a 60% drop in investment volumes across global property markets since their peak in 2021. However, recent data suggests a slowdown in this decline, with investment volumes in the second half of 2024 rising year over year and the report’s findings show there is now a significant, and sustained interest in real estate investment from private capital.
Key market trends include a shortage of prime office space in cities like London, where occupiers must plan years in advance, and a persistent housing supply gap across G20 nations, driving up home prices and rental costs. Investment opportunities in the residential sector, particularly build-to-rent developments, remain vast especially in cities such as Tokyo, Paris and Sydney.
Ultimately, he underscores that while global risks remain, investor opportunities in luxury residential, commercial real estate, and alternative assets are abundant for those willing to navigate the uncertainties.
IN CONCLUSION
Whether you’re looking to invest, sell, or purchase locally or globally in 2025, understanding these trends and insights is a key part of making informed decisions in this evolving luxury market, and as always, we highly recommend working with a luxury property specialist to gain insights into what is truly happening in your local marketplace.
The art of selling and buying in this market needs a critical and analytical approach. Understanding the realities and setting realistic expectations accordingly will ensure that your goals are achieved.
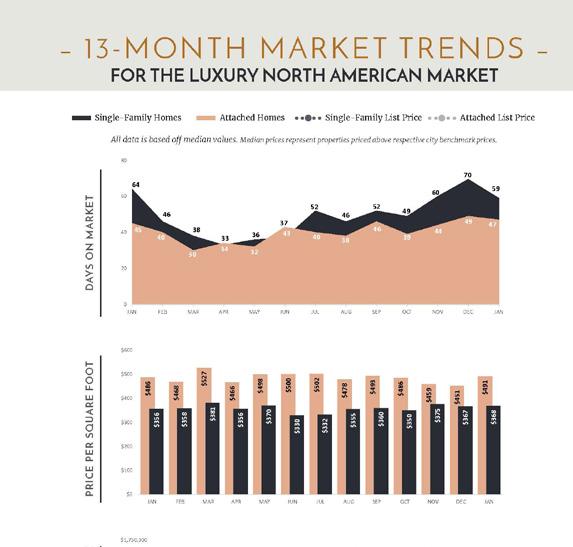
– 13 - MONTH MARKET TRENDS –
THE LUXURY NORTH AMERICAN MARKET
Single-Family Homes
Attached Homes Single-Family List Price Attached List Price
All data is based off median values. Median prices represent properties priced above respective city benchmark prices.
$1,700,000
$1,500,000
$1,300,000
$1,100,000
$900,000
$700,000
$500,000
– LUXURY MONTHLY MARKET REVIEW –
A Review of Key Market Differences Year over Year
SINGLE-FAMILY HOMES
SINGLE-FAMILY HOMES MARKET SUMMARY | FEBRUARY 2025
• Official Market Type: Balanced Market with a 19.04% Sales Ratio.1
• Homes are selling for an average of 98.30% of list price.
• The median luxury threshold2 price is $900,000, and the median luxury home sales price is $1,345,500.
• Markets with the Highest Median Sales Price: Pitkin County ($17,471,974), Telluride ($5,492,500), Ealge County ($4,850,000), and South Walton ($4,825,000).
• Markets with the Highest Sales Ratio: East Bay (70.9%), Seattle (57.2%), King County (49.2%), and Baltimore City (46.2%).
1
A Review of Key Market Differences Year over Year
February 2024 | February 2025
HOMES MARKET SUMMARY | FEBRUARY 2025
• Official Market Type: Balanced Market with a 14.99% Sales Ratio 1
• Attached homes are selling for an average of 98.65% of list price.
• The median luxury threshold2 price is $700,000, and the median attached luxury sale price is $895,600
• Markets with the Highest Median Sales Price: Sonoma County ($3,500,000), Park City ($3,370,000), Whistler ($3,160,000), and Pitkin County ($3,150,000).
• Markets with the Highest Sales Ratio: Howard County, MD (90.3%), Fairfax County, VA (89.4%), Arlington & Alexandria, VA (71.2%), and Silicon Valley (60.3%).
– LUXURY MONTHLY MARKET REVIEW –
– LUXURY MONTHLY MARKET REVIEW –
– LUXURY MONTHLY MARKET REVIEW –
– LUXURY MONTHLY MARKET REVIEW –
– LUXURY REPORT EXPLAINED –
The Institute for Luxury Home Marketing has analyzed a number of metrics — including sales prices, sales volumes, number of sales, sales-price-to-list-price ratios, days on market and price-per-squarefoot – to provide you a comprehensive North American Luxury Market report.
Additionally, we have further examined all of the individual luxury markets to provide both an overview and an in-depth analysis - including, where data is sufficient, a breakdown by luxury singlefamily homes and luxury attached homes.
It is our intention to include additional luxury markets on a continual basis. If your market is not featured, please contact us so we can implement the necessary qualification process. More in-depth reports on the luxury communities in your market are available as well.
Looking through this report, you will notice three distinct market statuses, Buyer's Market, Seller's Market, and Balanced Market. A Buyer's Market indicates that buyers have greater control over the price point. This market type is demonstrated by a substantial number of homes on the market and few sales, suggesting demand for residential properties is slow for that market and/or price point.
By contrast, a Seller's Market gives sellers greater control over the price point. Typically, this means there are few homes on the market and a generous demand, causing competition between buyers who ultimately drive sales prices higher.
A Balanced Market indicates that neither the buyers nor the sellers control the price point at which that property will sell and that there is neither a glut nor a lack of inventory. Typically, this type of market sees a stabilization of both the list and sold price, the length of time the property is on the market as well as the expectancy amongst homeowners in their respective communities – so long as their home is priced in accordance with the current market value.
REPORT GLOSSARY
DAYS ON MARKET: Measures the number of days a home is available on the market before a purchase offer is accepted.
LUXURY BENCHMARK PRICE: The price point that marks the transition from traditional homes to luxury homes.
NEW LISTINGS: The number of homes that entered the market during the current month.
PRICE PER SQUARE FOOT: Measures the dollar amount of the home's price for an individual square foot.
SALES RATIO: Sales Ratio defines market speed and determines whether the market currently favors buyers or sellers. A Buyer's Market has a Sales Ratio of less than 12%; a Balanced Market has a ratio of 12% up to 21%; a Seller's Market has a ratio of 21% or higher. A Sales Ratio greater than 100% indicates the number of sold listings exceeds the number of listings available at the end of the month.
SP/LP RATIO: The Sales Price/List Price Ratio compares the value of the sold price to the value of the list price.
REMAINING INVENTORY: The total number of homes available at the close of a month.
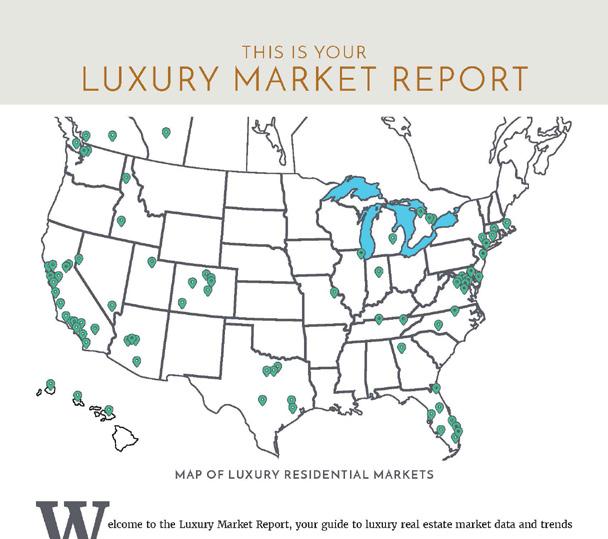
LUXURY RESIDENTIAL MARKETS
The Luxury Market Report is your guide to luxury real estate market data and trends for North America
Produced monthly by The Institute for Luxury Home Marketing, this report provides an in-depth look at the top residential markets across the United States and Canada. Within the individual markets, you will find established luxury benchmark prices and detailed survey of luxury active and sold properties designed to showcase current market status and recent trends. The national report illustrates a compilation of the top North American markets to review overall standards and trends.
The Luxury Market Report is a monthly analysis provided by The Institute for Luxury Home Marketing. Luxury benchmark prices are determined by The Institute. This active and sold data has been provided by REAL Marketing, who has compiled the data through various sources, including local MLS boards, local tax records and Realtor.com. Data is deemed reliable to the best of our knowledge, but is not guaranteed.
CALGARY ALBERTA
2025
CALGARY SINGLE - FAMILY HOMES
LUXURY INVENTORY VS. SALES | FEBRUARY 2025
$2,000,000
$2,300,000+
$1,500,000 - $1,699,999
$1,300,000 - $1,499,999
$1,200,000 - $1,299,999
$1,100,000 - $1,199,999
$1,000,000 - $1,099,999
$950,000 - $999,999
$900,000
The median luxury sales price for
is $920,250. • The median days on market for February 2025 was 19 days, up from 14 in February 2024.
LUXURY INVENTORY VS. SALES | FEBRUARY 2025
$2,400,000
$1,800,000
$1,200,000
$3,000,000+
$640,000
$620,000
$600,000
Benchmark Price 1: $600,000
13 - MONTH LUXURY MARKET TREND 4
• The attached luxury market is a Seller's Market with a 28% Sales Ratio
• Homes sold for a median of 98.15% of list price in February 2025.
• The most active price band is $720,000-$739,999, where the sales ratio is 100%.
• The median luxury sales price for attached homes is $752,800.
• The median days on market for February 2025 was 22 days, up from 14 in February 2024.