
The Ha mptons Luxury M arket Leader Q2 EAST END MARKET REPORT 2023
Tim Davis
2ND QUARTER REPORT 2023
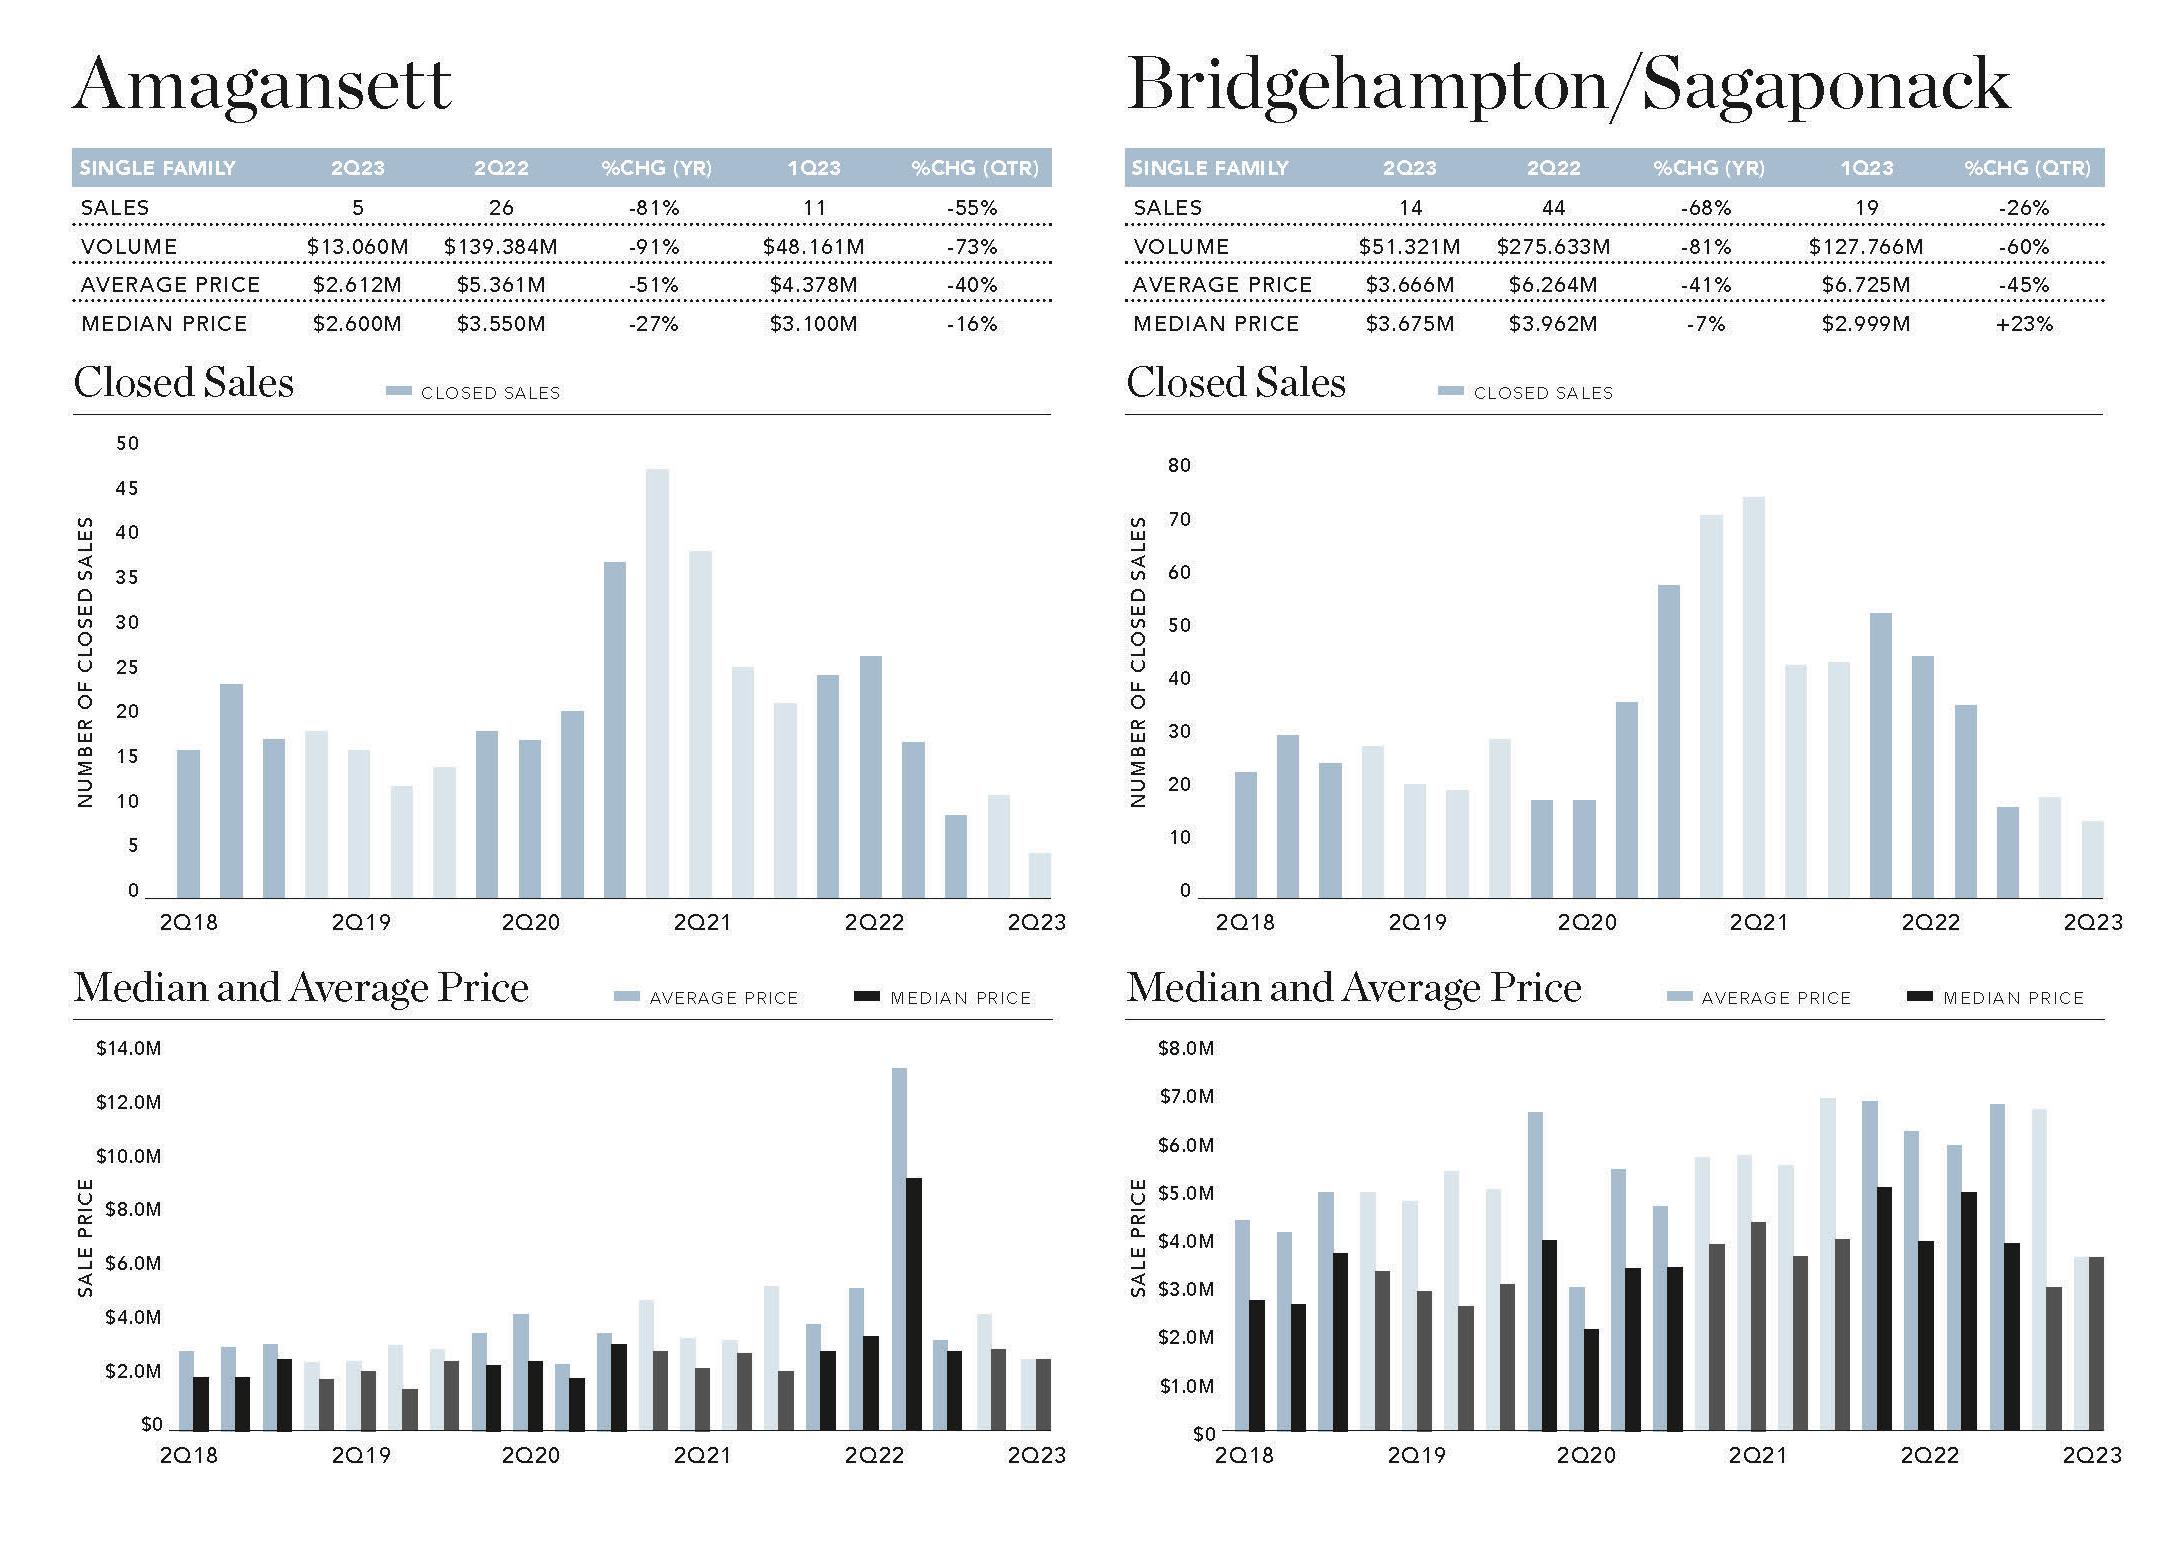
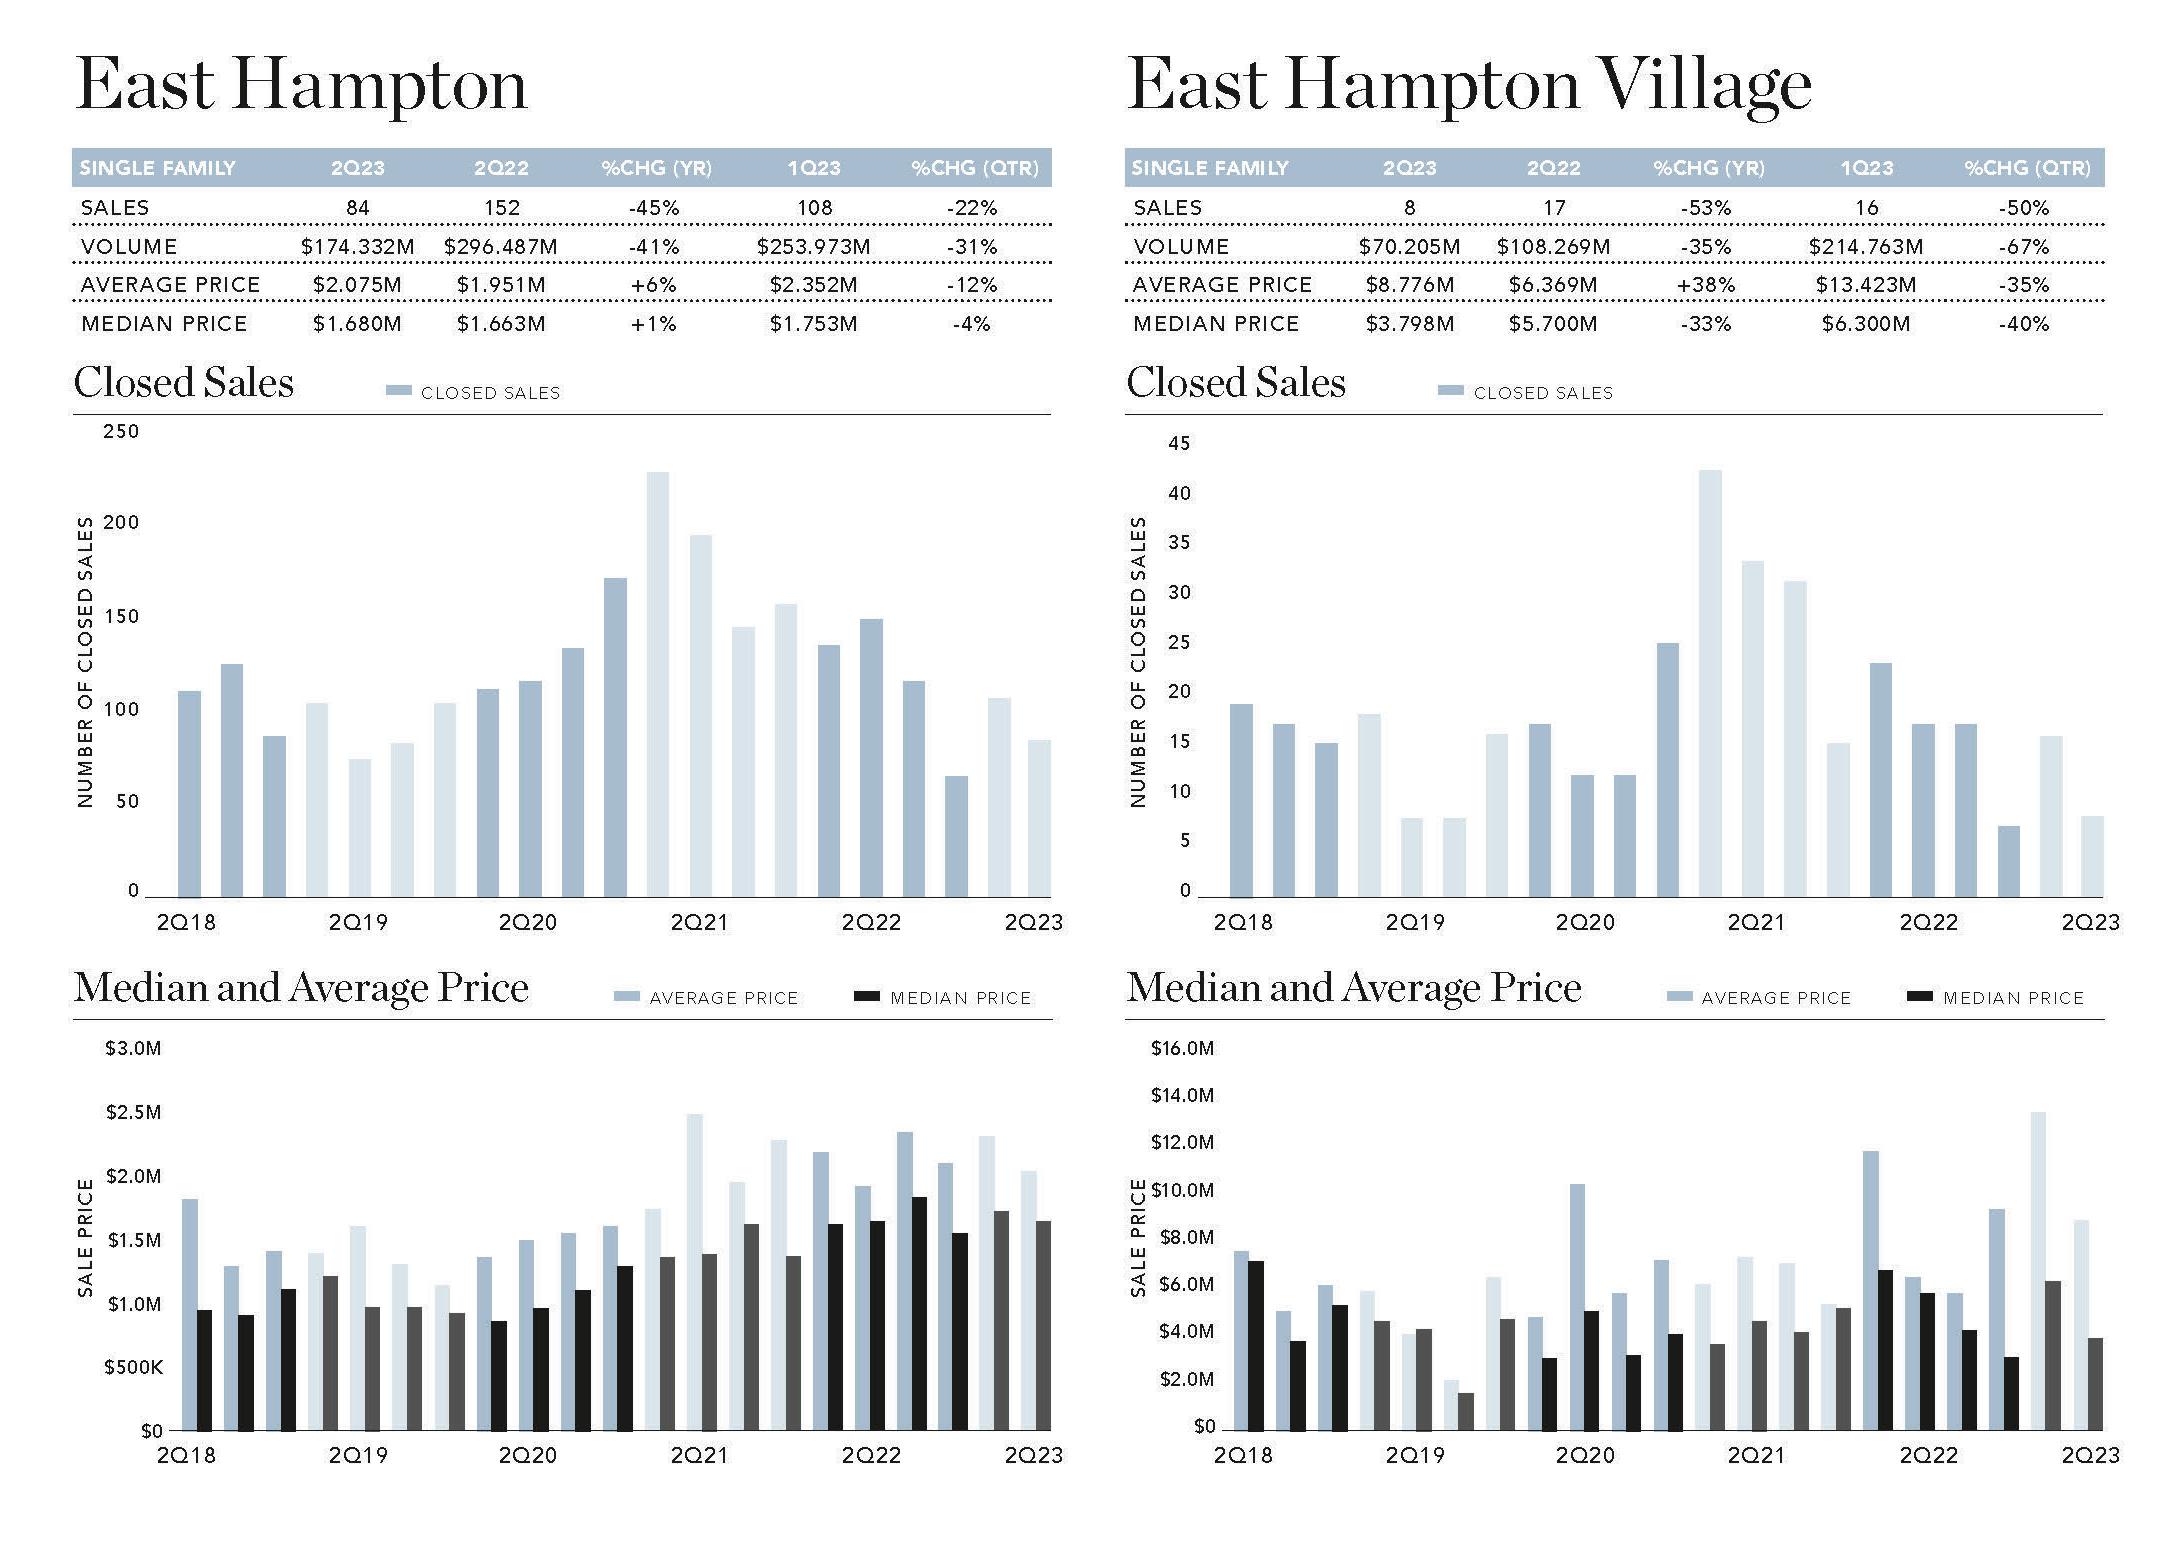
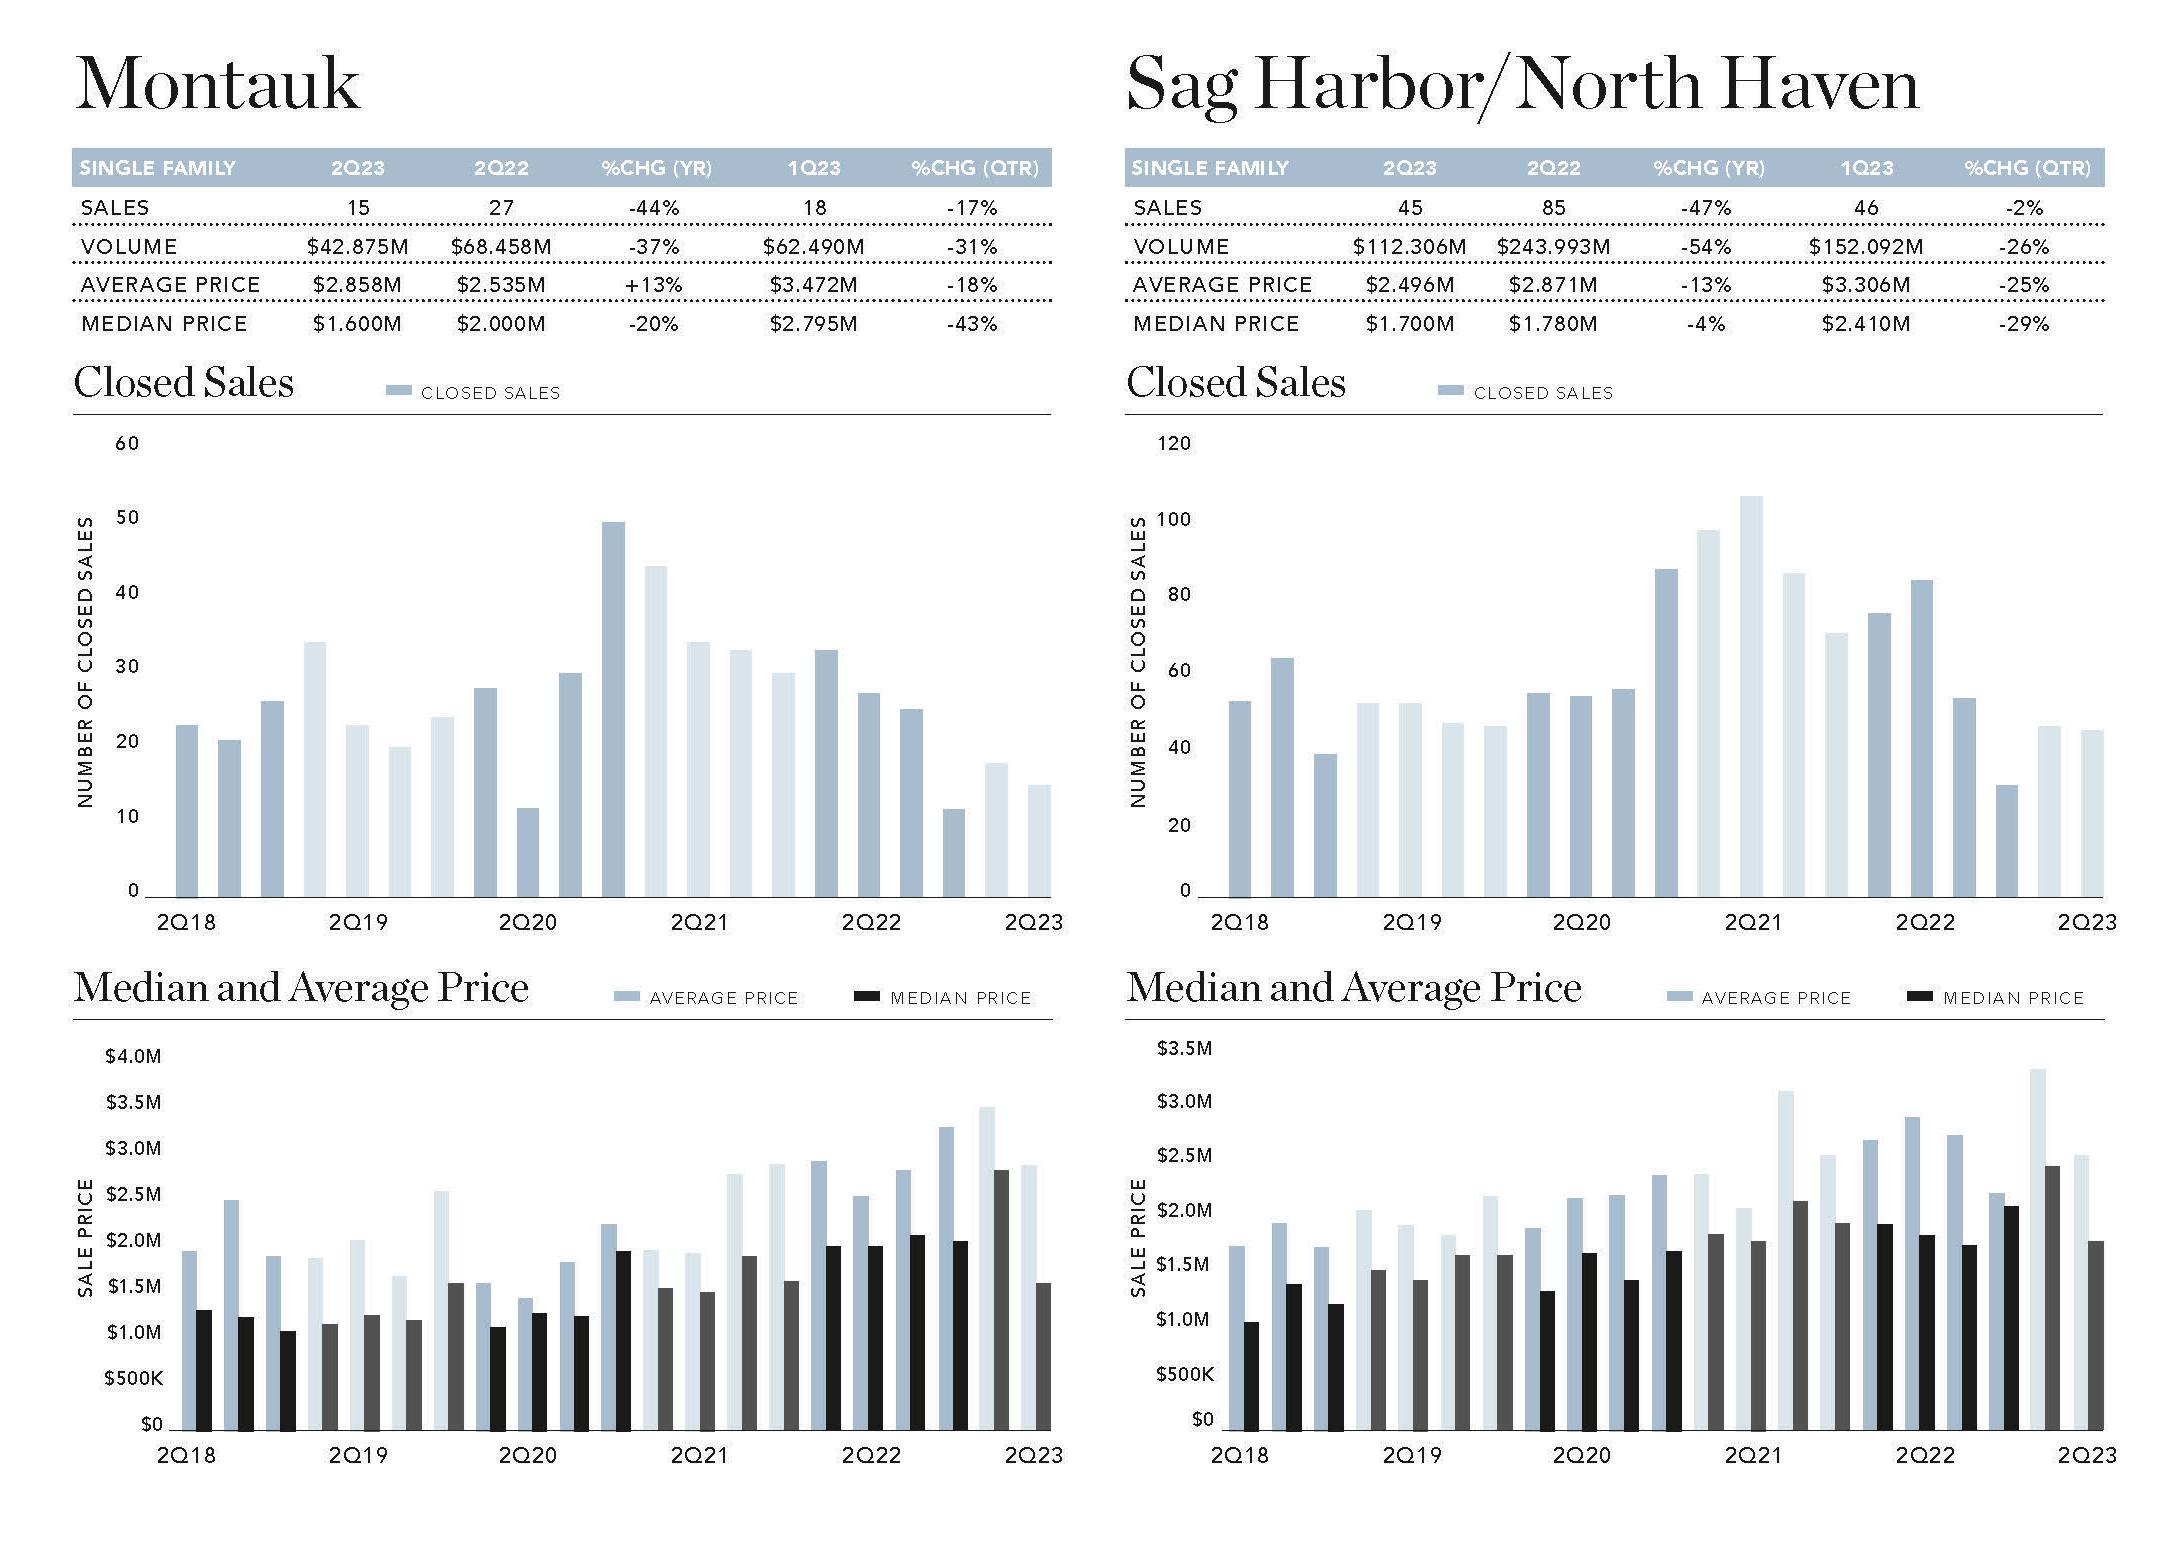
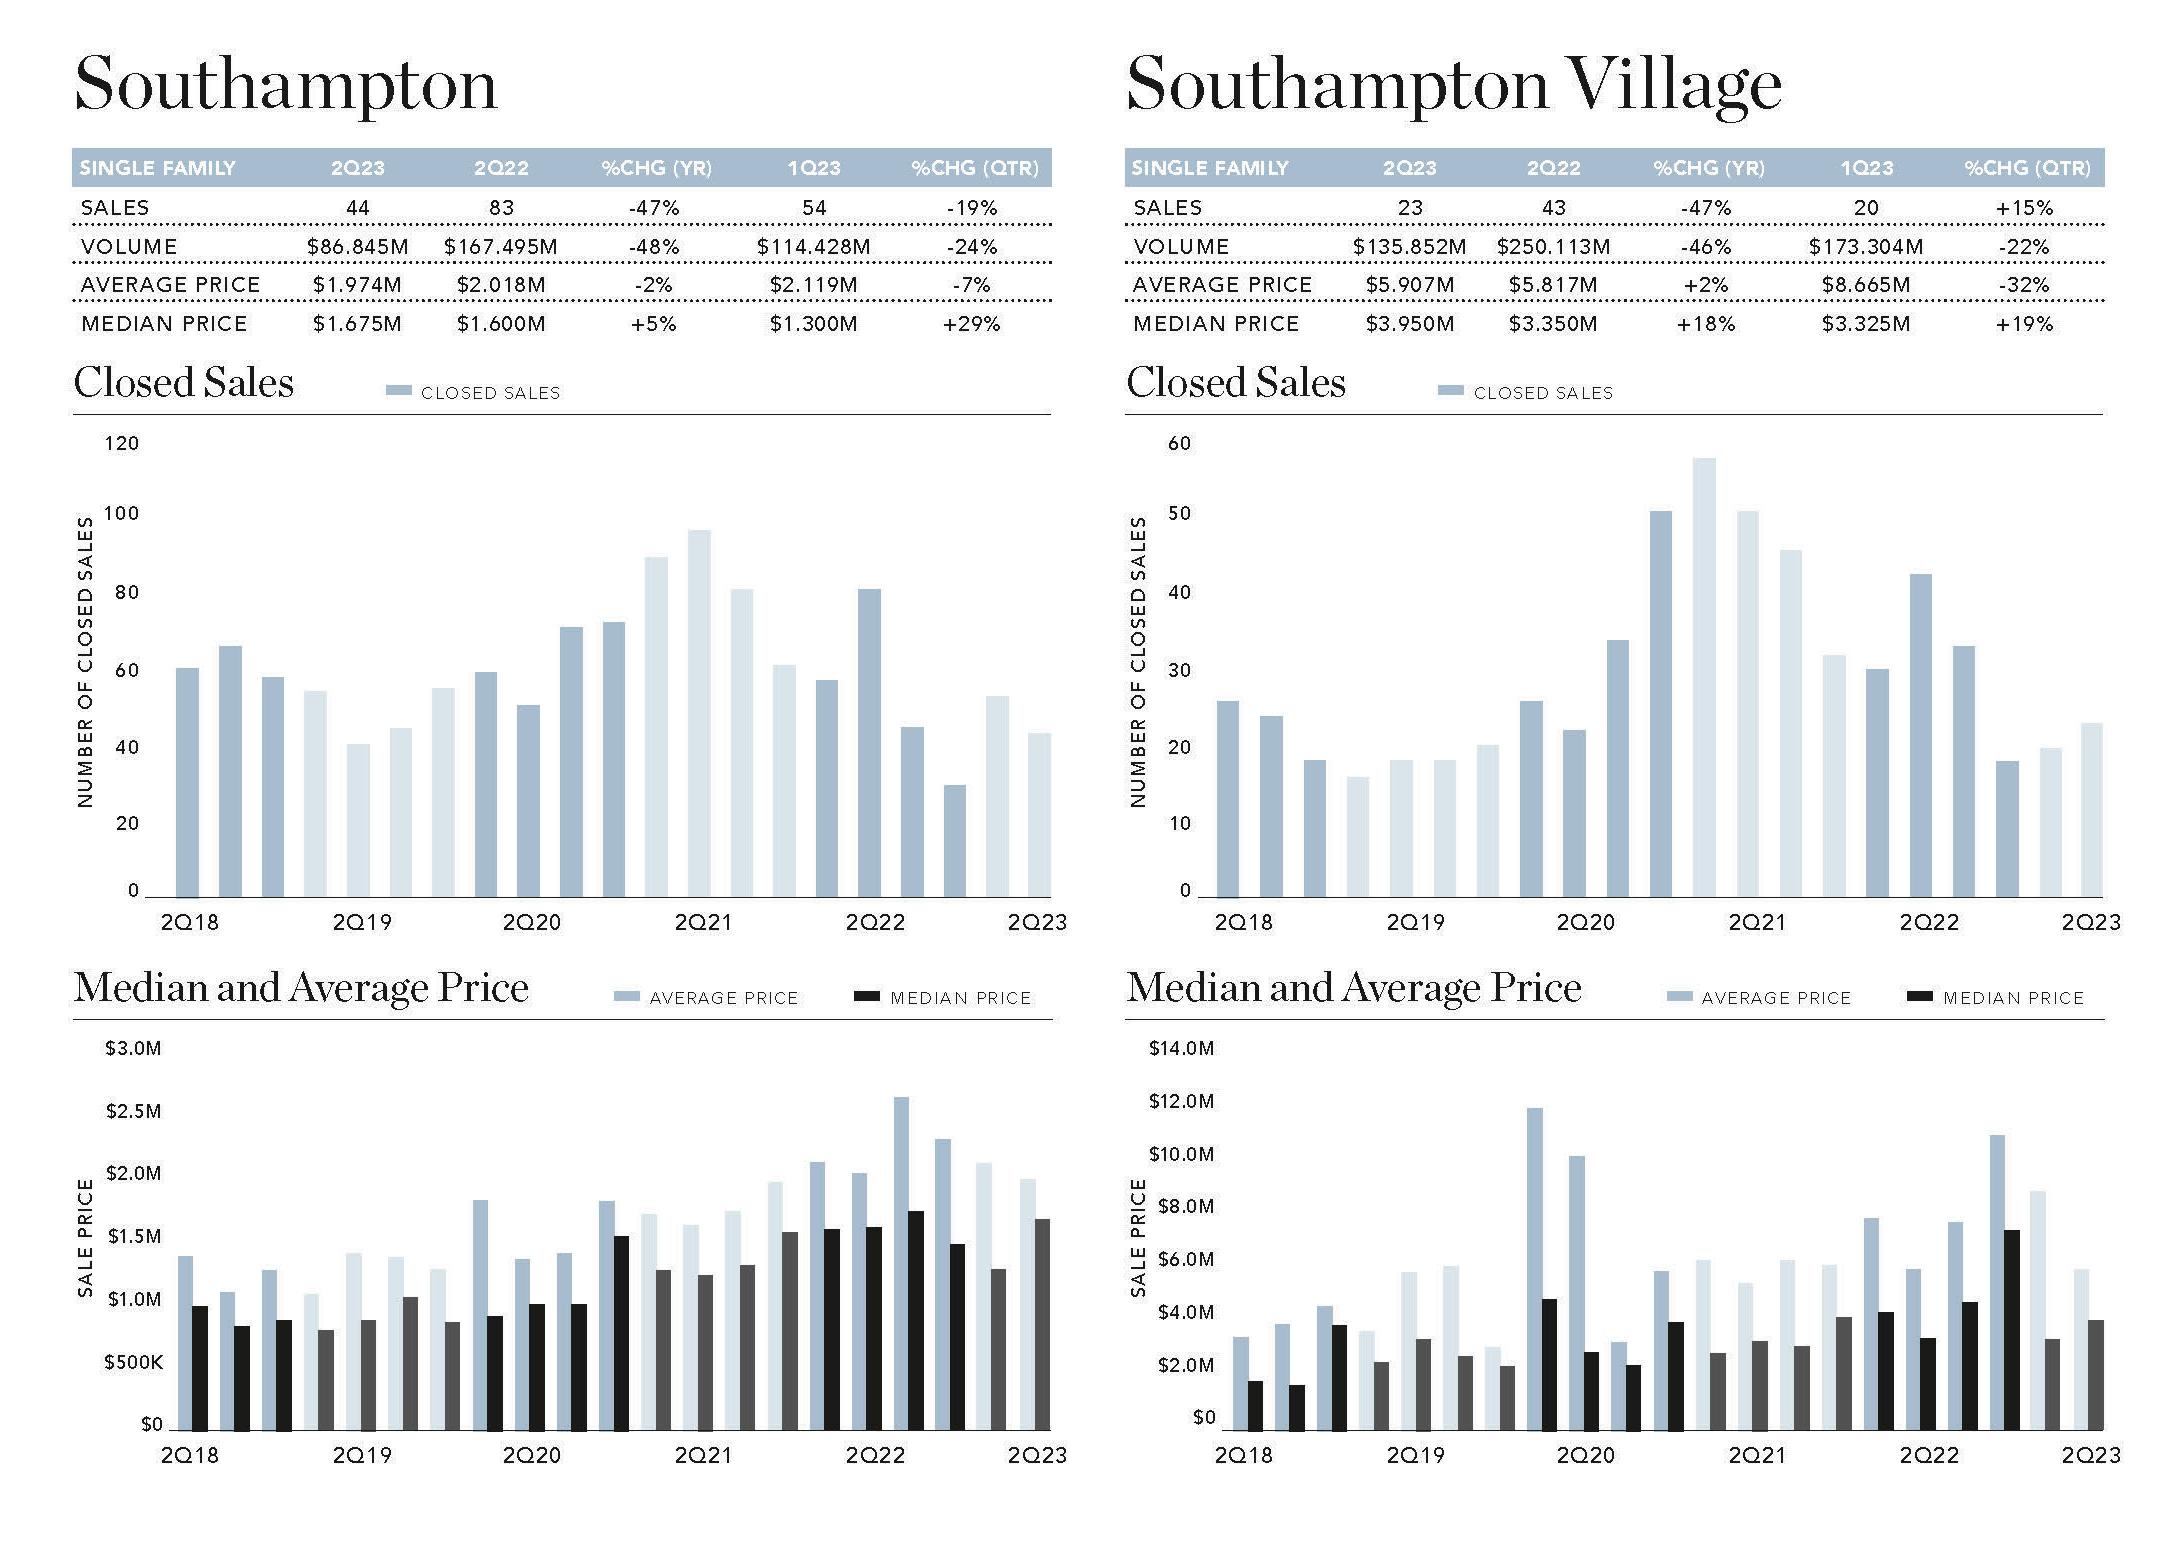
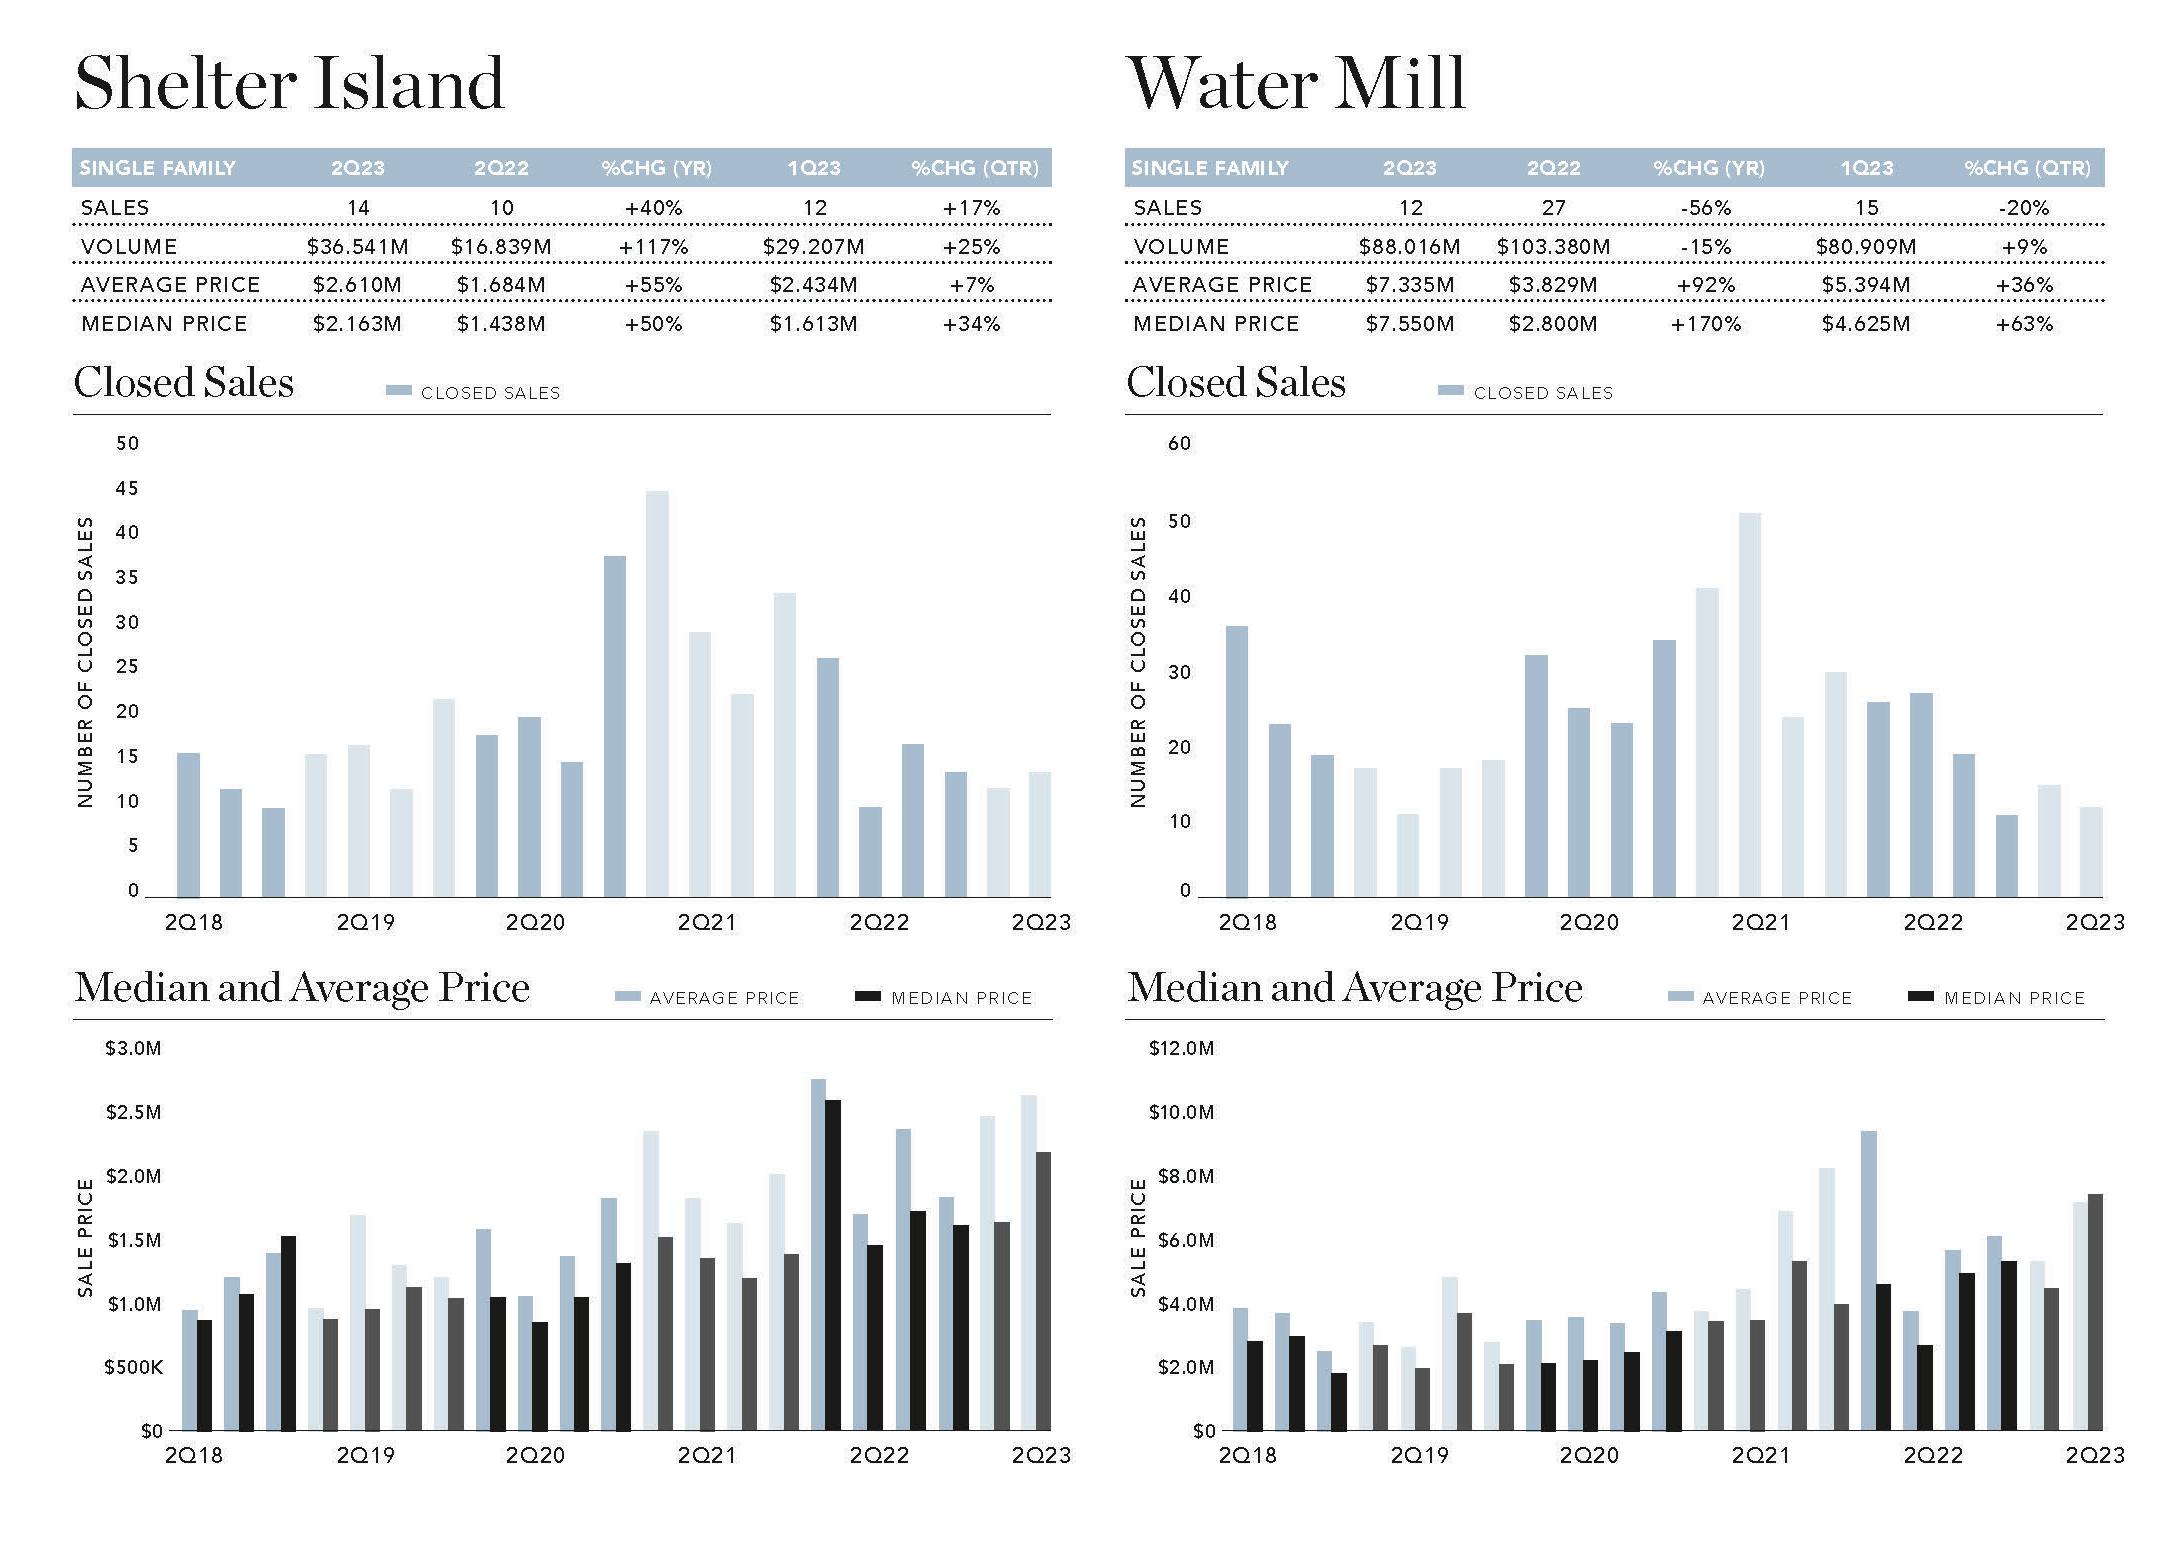
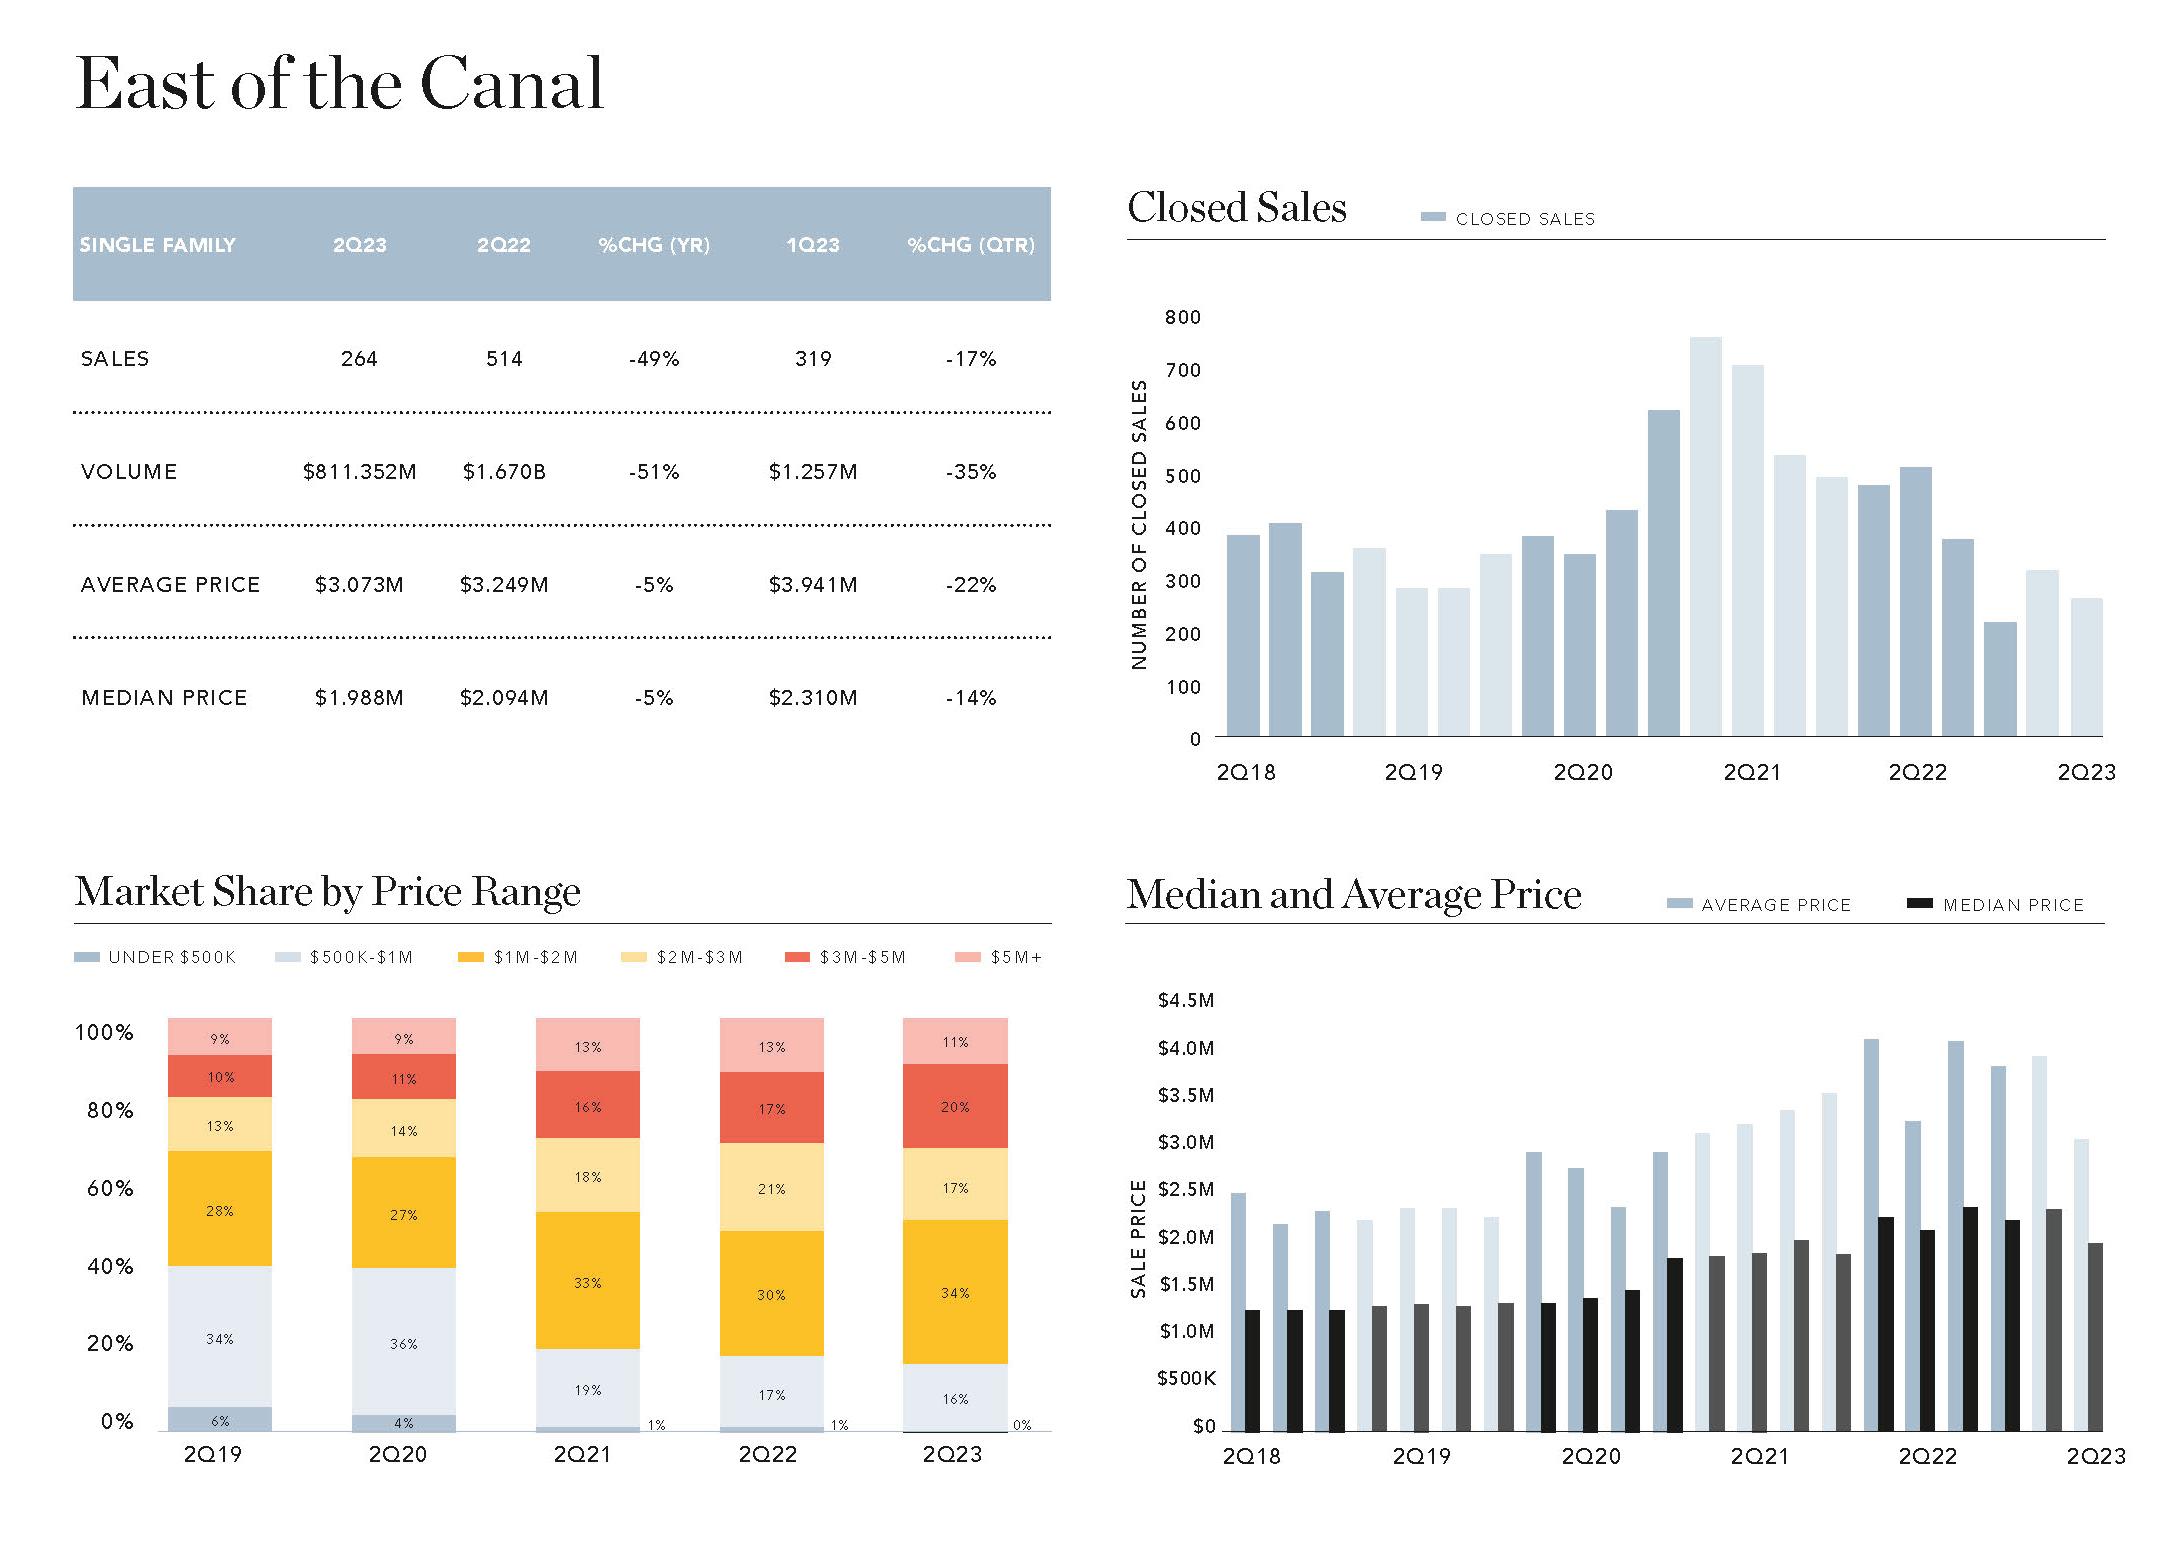
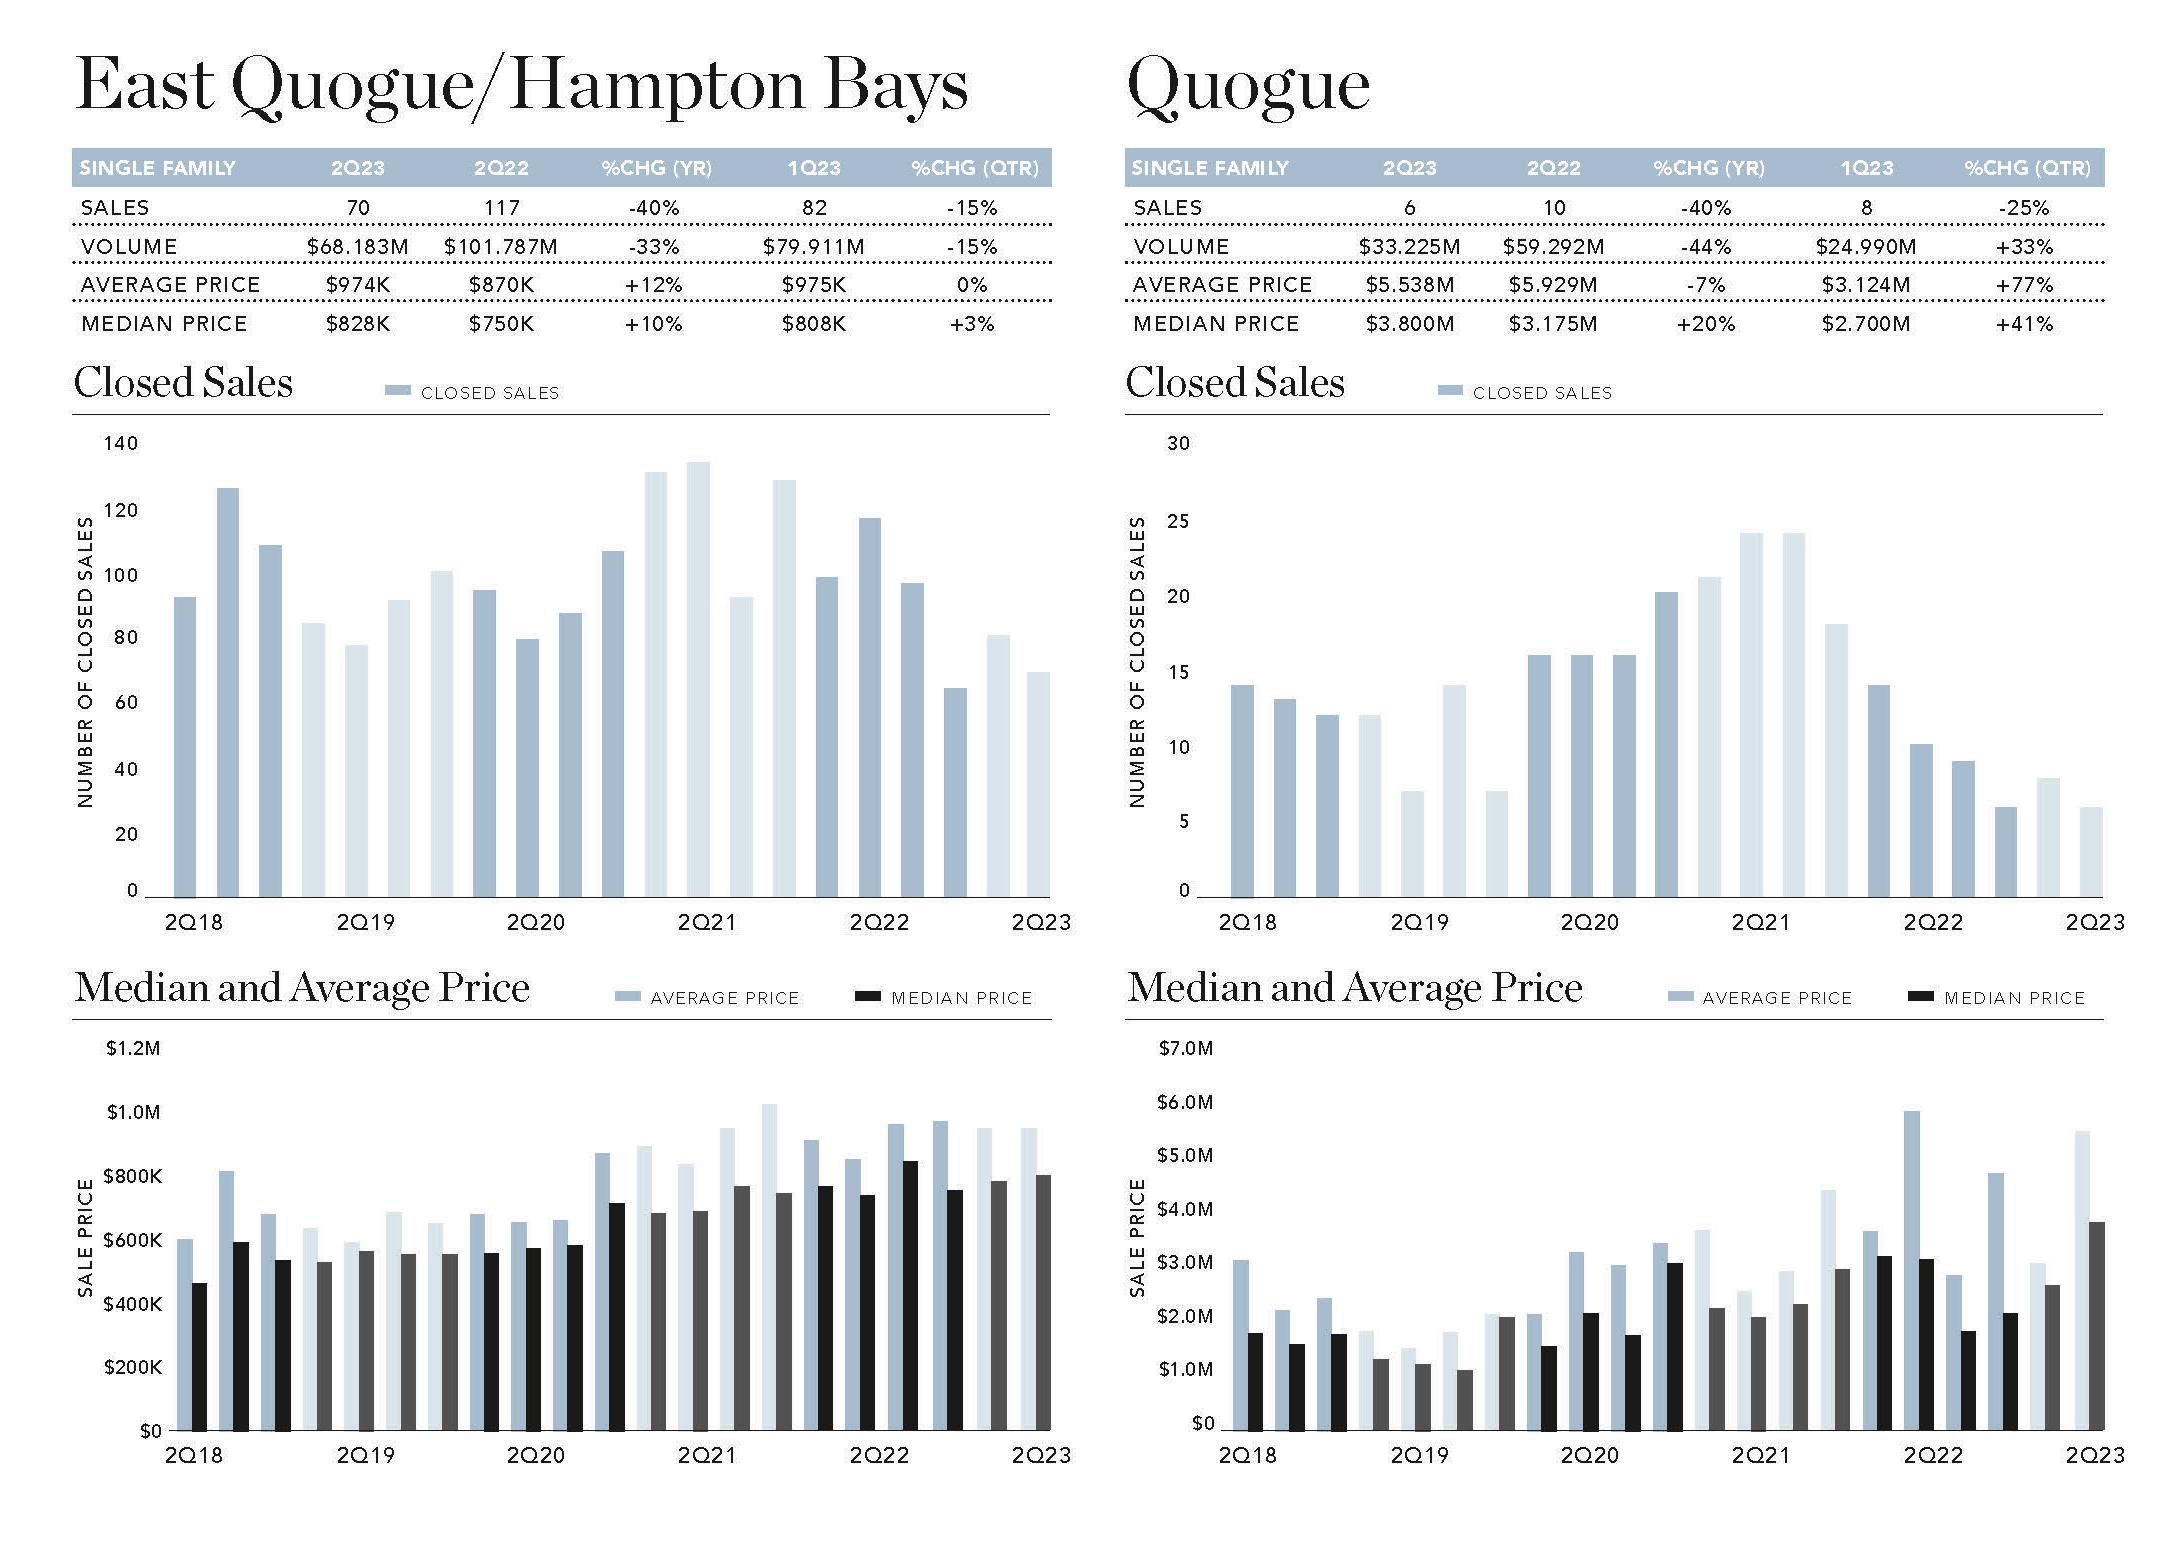
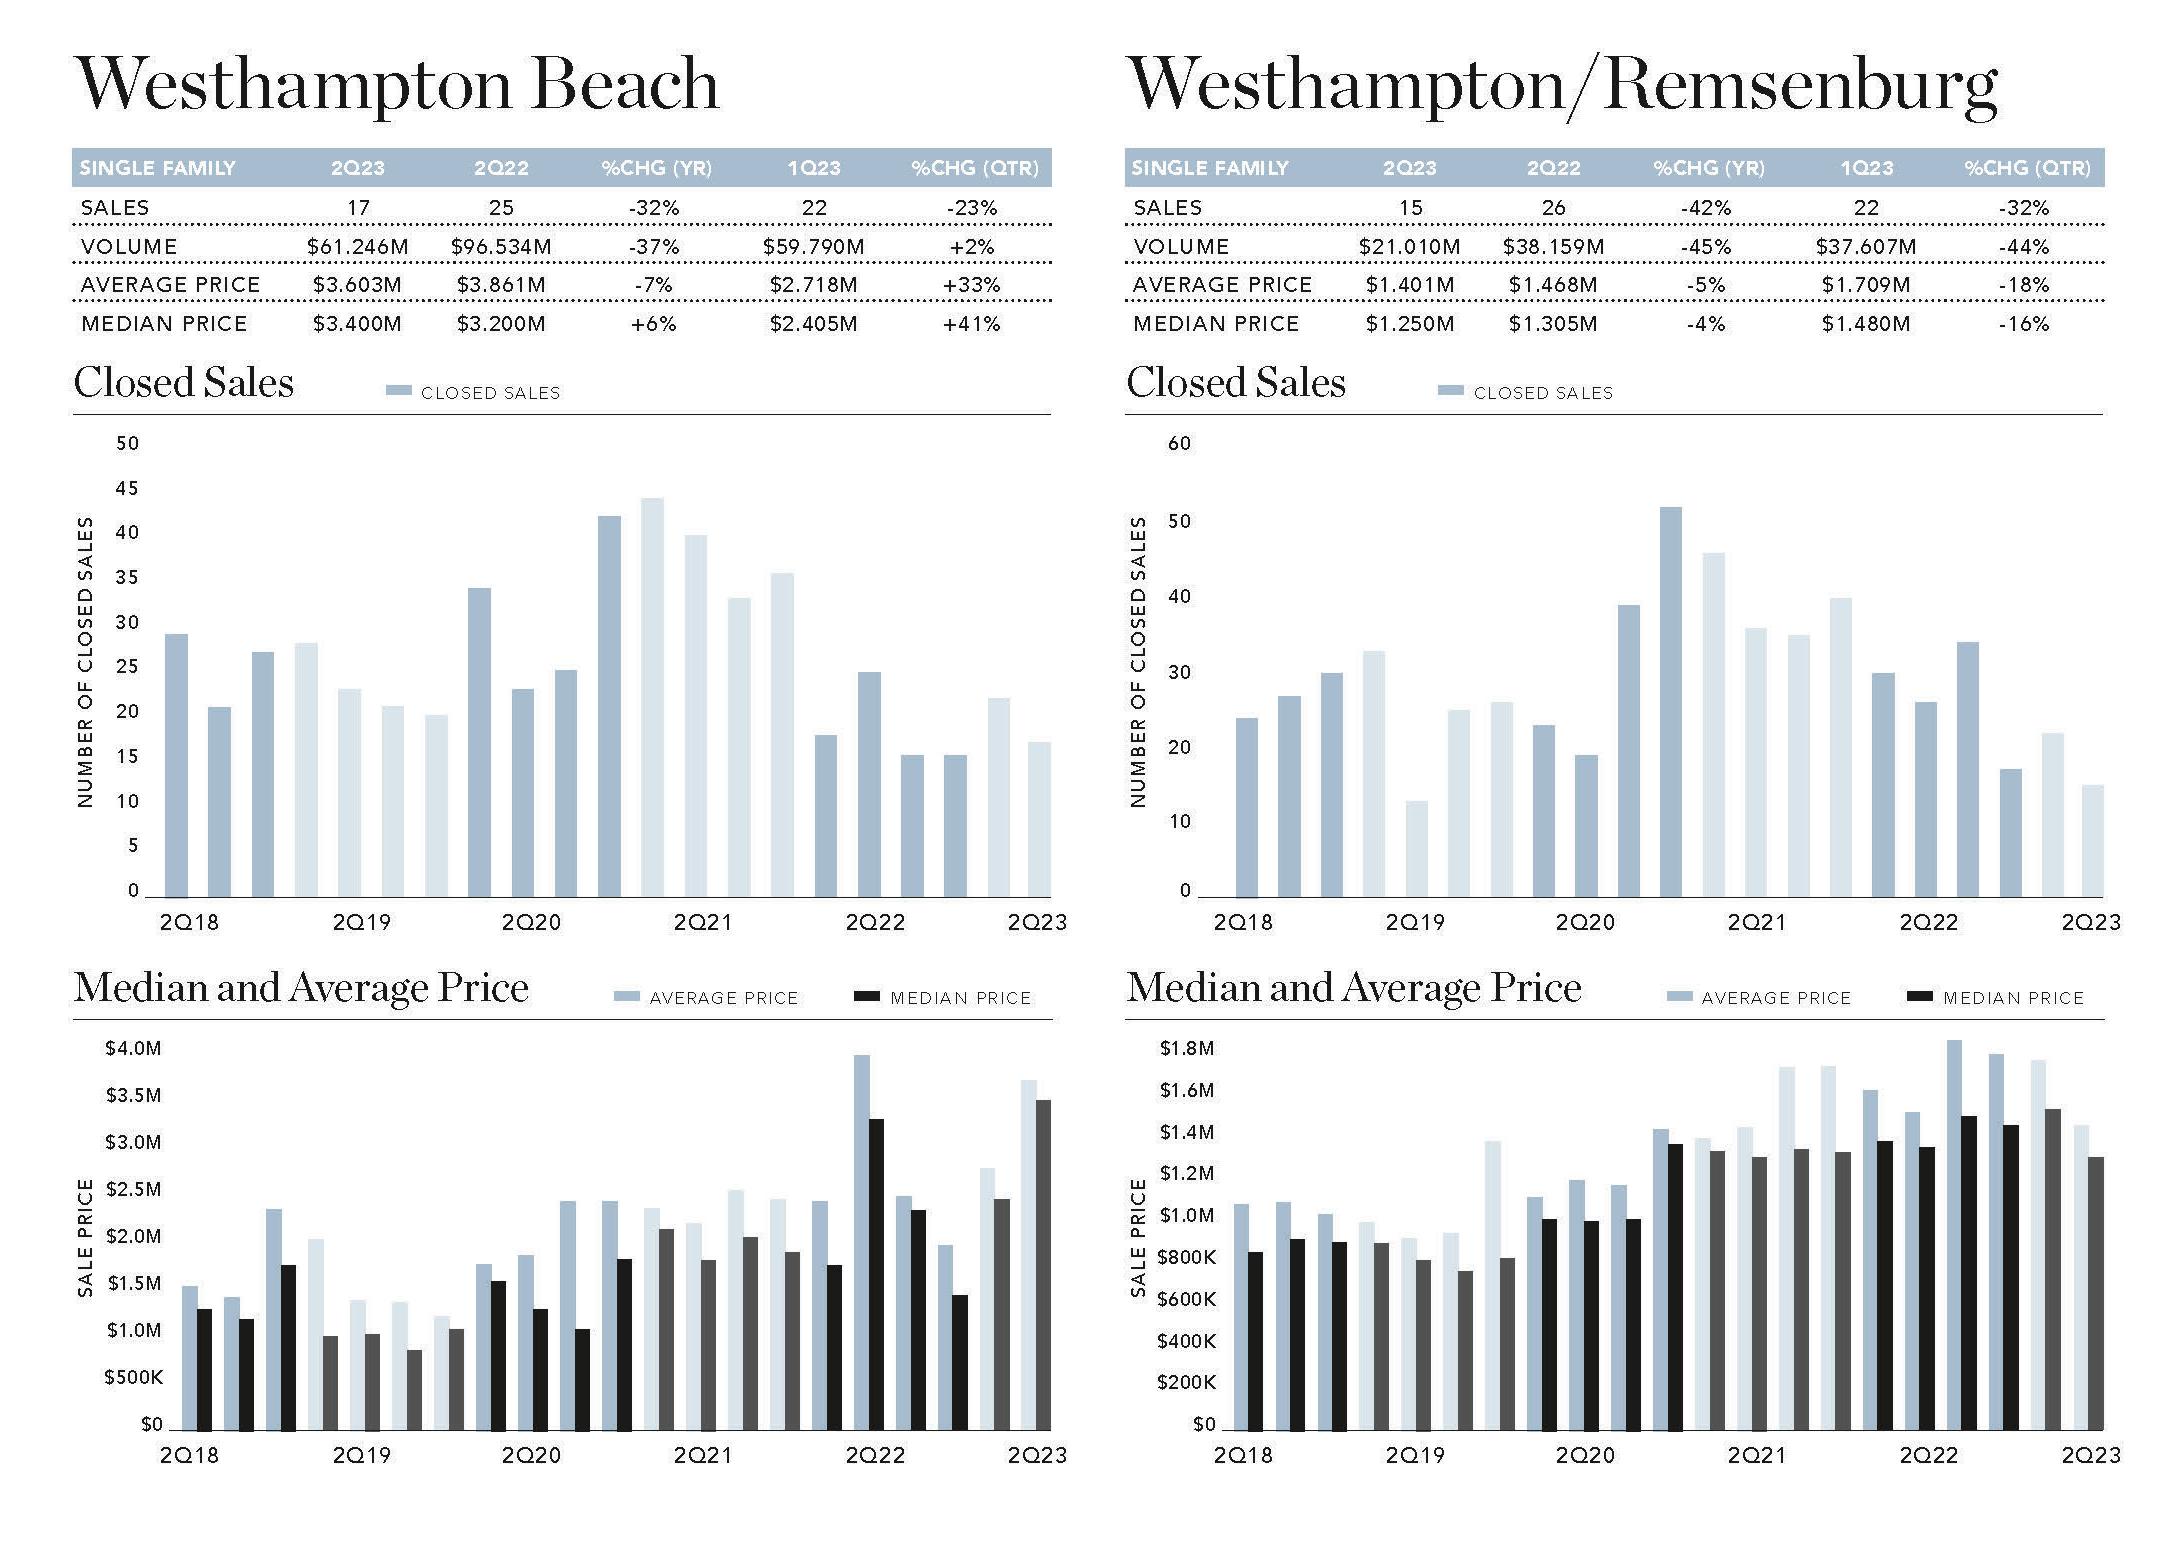
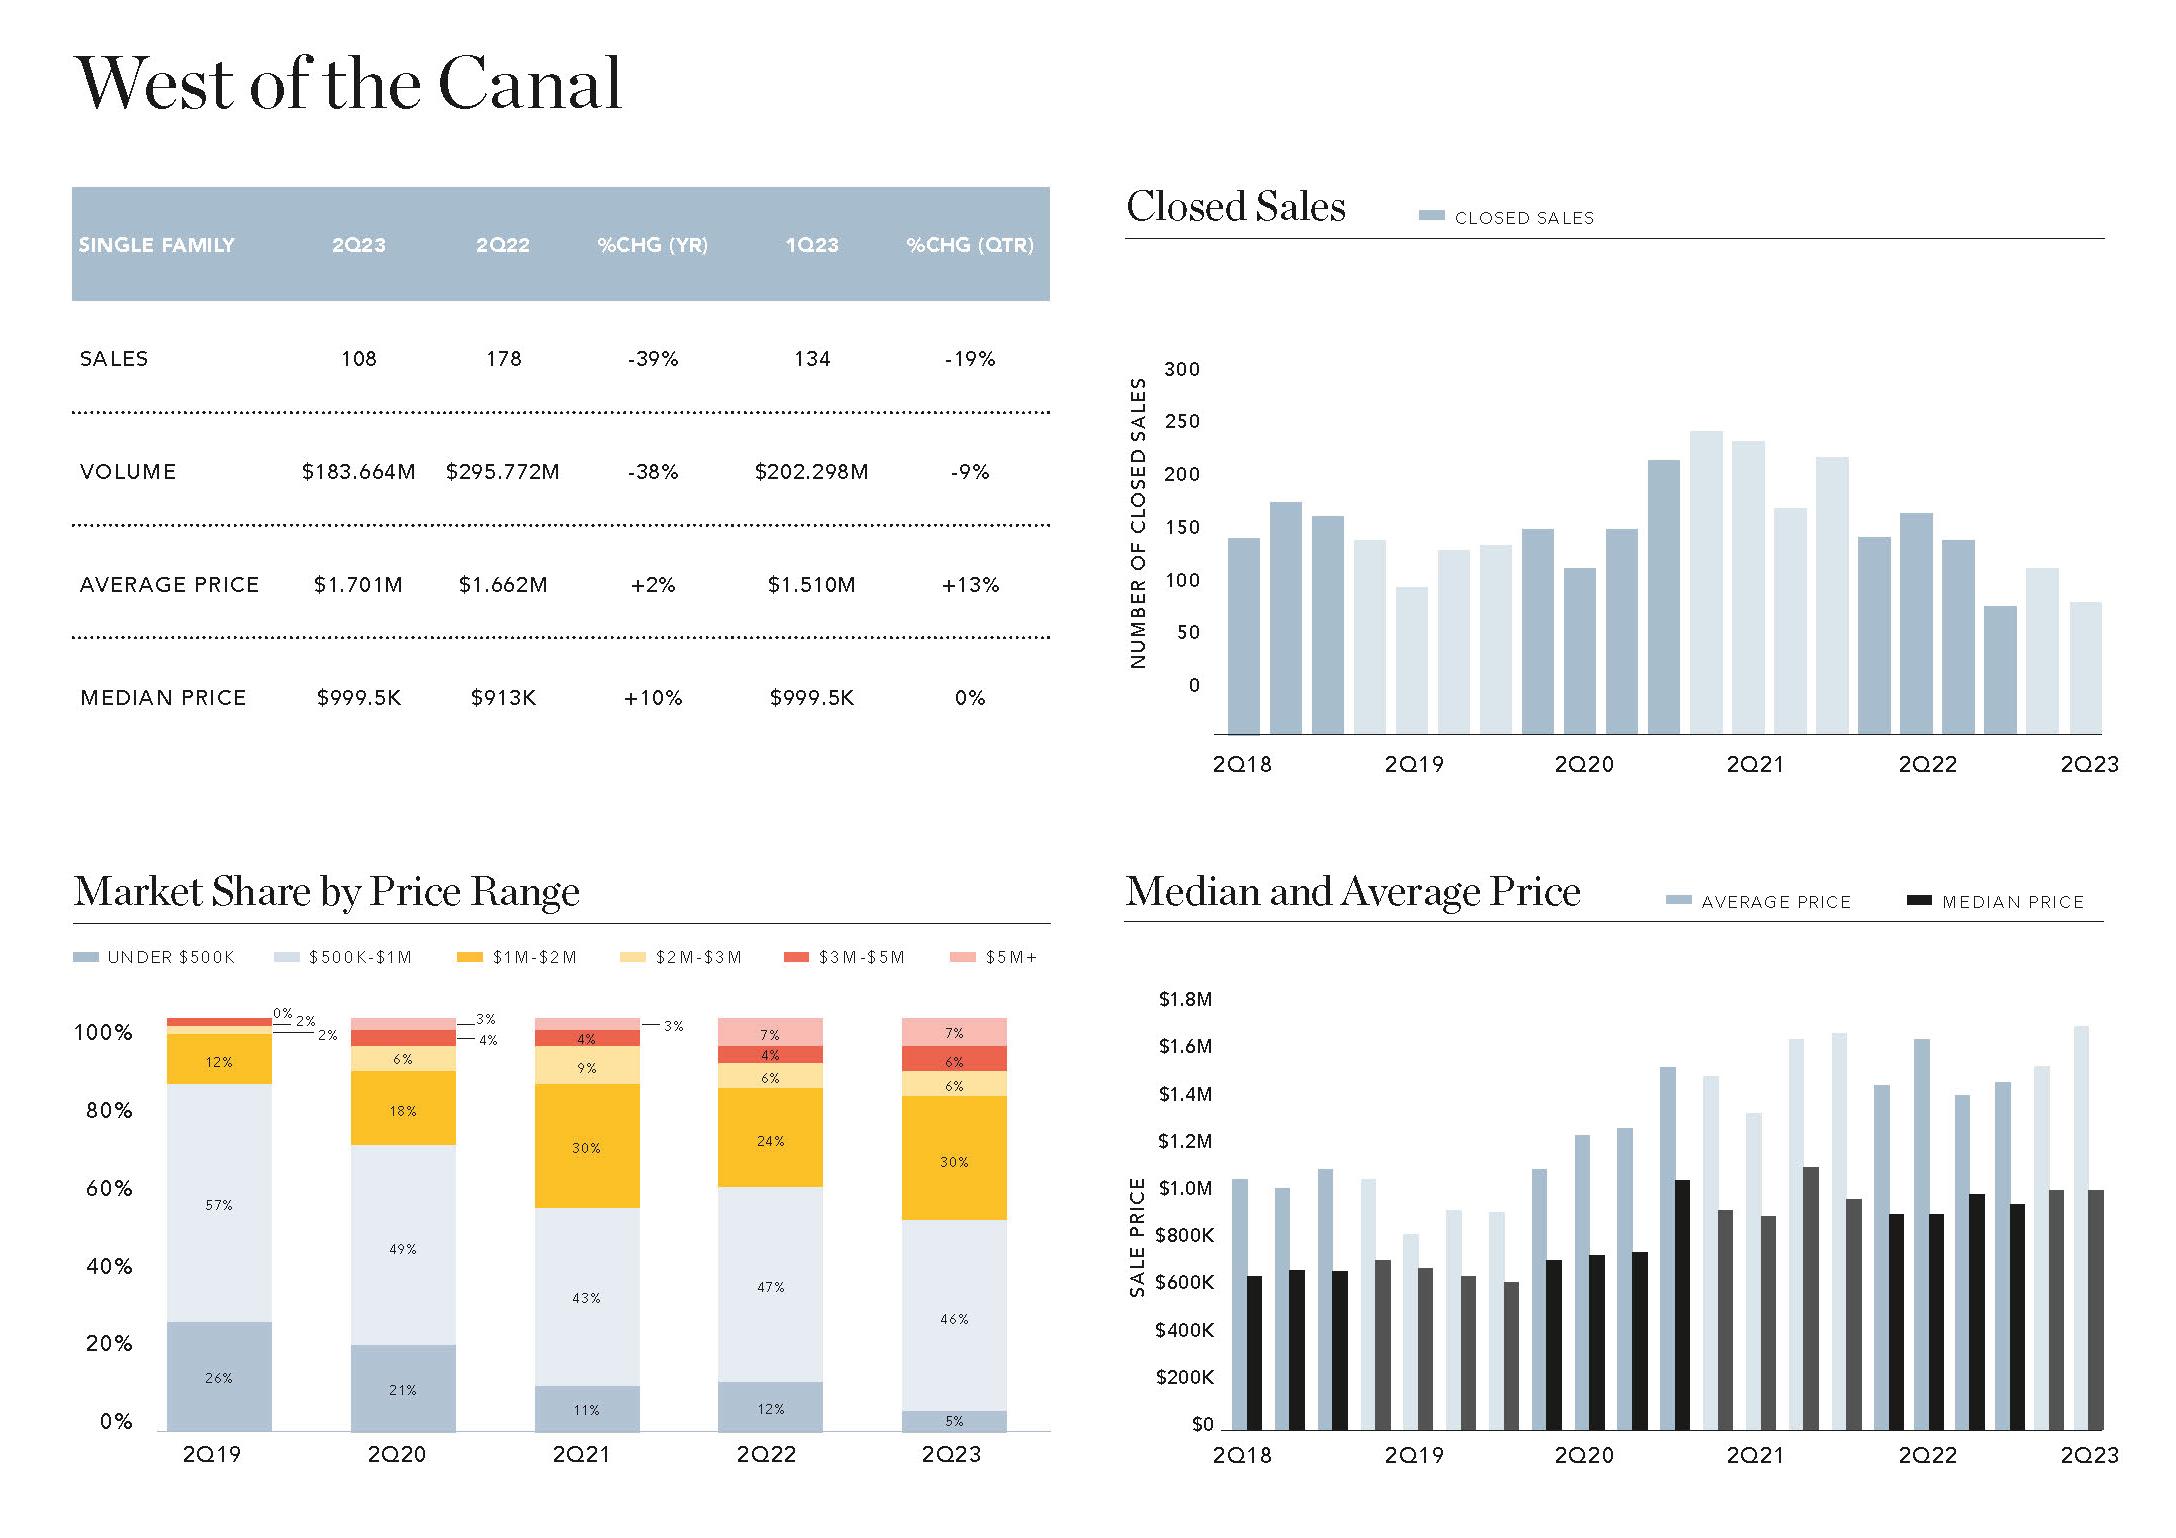
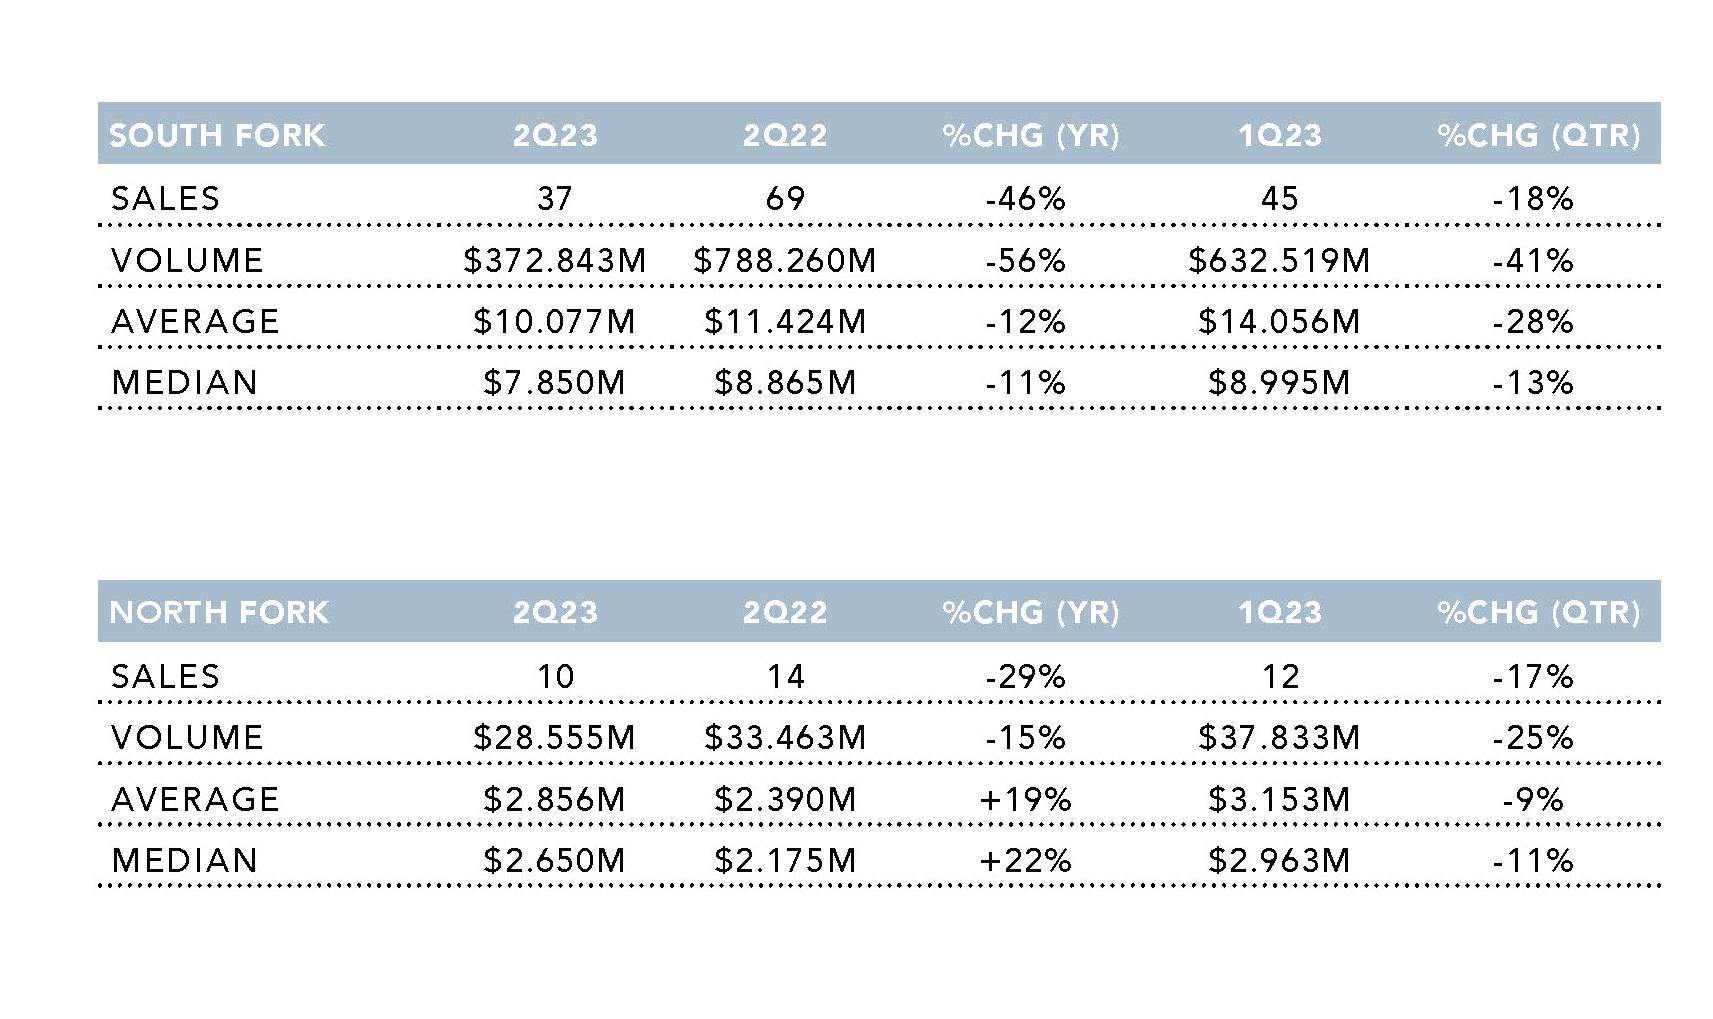
With the frenzied post-Covid market in the rear-view mirror, low inventory and higher mortgage rates further slowed the Hamptons market. In Second Quarter 2023, South Fork single-family home sales declined a substantial 46% year-over-year, marking the seventh consecutive quarter of annual decline. This was the slowest second quarter since 2012, surpassing the previous low from Second Quarter 2019. All but one South Fork village and hamlet reported signifi cant decreases in sales, with most seeing annual declines of 40% or greater. Westhampton Beach exhibited the smallest decline at 32%, whereas Bridgehampton/Sagaponack reported the most signifi cant drop with 81% fewer sales. Shelter Island was the only submarket to report a jump in sales, increasing 40% annually. The major decrease in sales heavily impacted sales volume, which fell 49% annually. Except for Shelter Island, which had an increase of 117% due to an $8.7M sale, all other submarkets saw annual declines of at least 15% in sales volume.
Second Quarter 2023 was the second consecutive quarter with an annual decline in average and median price, which had not happened in four years. Price metrics by submarkets portrayed a more mixed picture. Median price increased in more than half of the submarkets. Notably, Water Mill had the most signifi cant increase, up 170% year-over-year as nearly 60% of sales were over $5M versus 15% in Second Quarter 2022. Amagansett had the largest decline in average price, at 51%, because this year there were no reported closings over $4M.
SOUTHAMPTON SOLD | LAST ASK $16.95M
2 TIMDAVISHAMPTONS.COM
103 GREAT PLAINS , SOUTHAMPOTN SOLD | LAST ASK $18.95M
SINGLE FAMILY SOUTH FORK
372 Sales -46% ANNUAL CHANGE
$995.02M Volume -49%
$2.675M Average Price -6%
$1.65M Median Price -3%
TIMDAVISHAMPTONS.COM 3
4 TIMDAVISHAMPTONS.COM
TIMDAVISHAMPTONS.COM 5
6 TIMDAVISHAMPTONS.COM
TIMDAVISHAMPTONS.COM 7
8 TIMDAVISHAMPTONS.COM
TIMDAVISHAMPTONS.COM 9
10 TIMDAVISHAMPTONS.COM
TIMDAVISHAMPTONS.COM 11
12 TIMDAVISHAMPTONS.COM
LUXURY MARKET
THE RESIDENTIAL LUXURY MARKET
The luxury market is defined as the top 10% of all residential sales made within the reported quarter. As various factors redefine the high-end market in any given period, these numbers may exhibit more volatility than the market overall. Because the luxury market is a fixed percentage of the overall market, the change in reported luxury sales will always match the overall market.
In Second Quarter 2023, South Fork luxury average price decreased 12%; last year three closings were reported over $30M while this year there were none. On the North Fork, all luxury sales were above $2M, whereas last year several were below that threshold, increasing the average sale price by 19%.
Souhthampton and Water Mill made up 40% of South Fork luxury sales with Southhampton recording the highest number at ten deals. Easthampton was the only submarket in the East End to have multiple deals above $20M.
LAND MARKET & INVENTORY
LAND MARKET
Nearly 70 vacant land transactions occurred on Long Island’s East End overall in Second Quarter 2023, down 41% from a year ago and 6% from the previous quarter. South Fork had fewer than half the number of transactions from last year. Despite the decline, average price for the South Fork increased 25% with median price expanding 54% due to a larger share of land sales being above $1M. Five land sales closed at the $5M and above price point. There were 19% more reported vacant land closings on the North Fork versus a year ago. Average price increased 21% largely due to two land sales above $3M. Southhold made up 32% of North Fork land sales with ten transactions.
INVENTORY
Inventory is the total number of East End properties listed for sale at the end of a particular period. Second Quarter 2023 inventory was 1,850 listings. This represented a minimal decrease of 0.6% annually and an increase of 6.6% quarterly. Second Quarter 2023 marked the seventh consecutive quarter with fewer than 2,000 listings.
8 STUDIO LANE , SOUTHAMPTON SOLD | LAST ASK $7.995M
TIMDAVISHAMPTONS.COM 13
9 FIRST NECK LANE, SOUTHAMPTON SOLD | LAST ASK $3.35M
Methodology & Source
For the purposes of the South Fork market comparison, this report contrasts the villages and hamlets from Remsenburg to Montauk, plus Shelter Island, while the North Fork encompasses the area extending from Aquebogue to Orient. In September 2022, an attack on Suffolk County government systems caused a significant disruption in recorded real estate data. As a result, no closings were reported during the first three weeks of Fourth Quarter 2022. Sales counts and volume totals shown in the report may be affected. The Corcoran Report uses market-wide data from the Long Island Real Estate Report and is based upon transactions reported from April through June 2023. It compares data to that reported in the same period of 2022 as well as the prior quarter. There can be a significant period between when a contract is signed, the sale is closed, and then reported publicly. As a result, many transactions in this analysis actually occurred prior to being reported in Second Quarter 2023.
Real estate agents affiliated with The Corcoran Group are independent contractors and are not employees of The Corcoran Group. The Corcoran Group is a licensed real estate broker located at 1936 Montauk Highway, Bridgehampton, NY 11932. All material presented herein is intended for information purposes only and has been compiled from sources deemed reliable. Though information is believed to be correct, it is presented subject to errors, omissions, changes or withdrawal notice.
TimDavisHamptons.com

