
Tim Davis
The Ha mptons Luxury M arket Leader

3RD QUARTER REPORT 2024
The South Fork reported 389 single-family home sales in Third Quarter 2024, up 9% versus last quarter but down 21% year-over-year. This was the third consecutive annual decline in closings. Versus 2023, nine of the 14 South Fork submarkets saw closings decline, while five reported increases in activity. Quogue had the greatest year-over-year percentage gain in closings, up 58% (seven sales). Bridgehampton/ Sagaponack saw the deepest annual drop in sales, down 57% (17 sales) versus last year. Amid fewer sales, dollar volume fell 11% year-over-year. Annually, six submarkets reported drops in volume while eight saw volume increase. Southampton Village saw the greatest year-over-year drop, down 69% as sales over $10M dropped from five last year to zero this quarter. Quogue had the greatest yearly increase for the third consecutive quarter, as two closings over $15M boosted dollar volume 156%. Median price rose year-over-year for the fifth consecutive quarter, up 17% to a record high of $2.175M. Average price climbed 13% year-over-year to $3.201M. A boost in the market share of closings above $5M drove the annual gains. All but one South Fork submarket had an annual increase in median price. Water Mill’s median price nearly doubled as the market share of sales over $5M rose to 54% this quarter from 28% a year ago. Westhampton/Remsenburg had the only drop in median price, down 14% year-over-year, as the number of sales reported above $2M dropped by more than half compared to last year.


THE RESIDENTIAL LUXURY MARKET
The luxury market is defined as the top 10% of all residential sales by price for the reported quarter. As various factors redefine the high-end market in any given period, these numbers may exhibit more volatility than the market overall. Because the luxury market is a fixed percentage of the overall market, the change in reported luxury sales will always match the overall market.
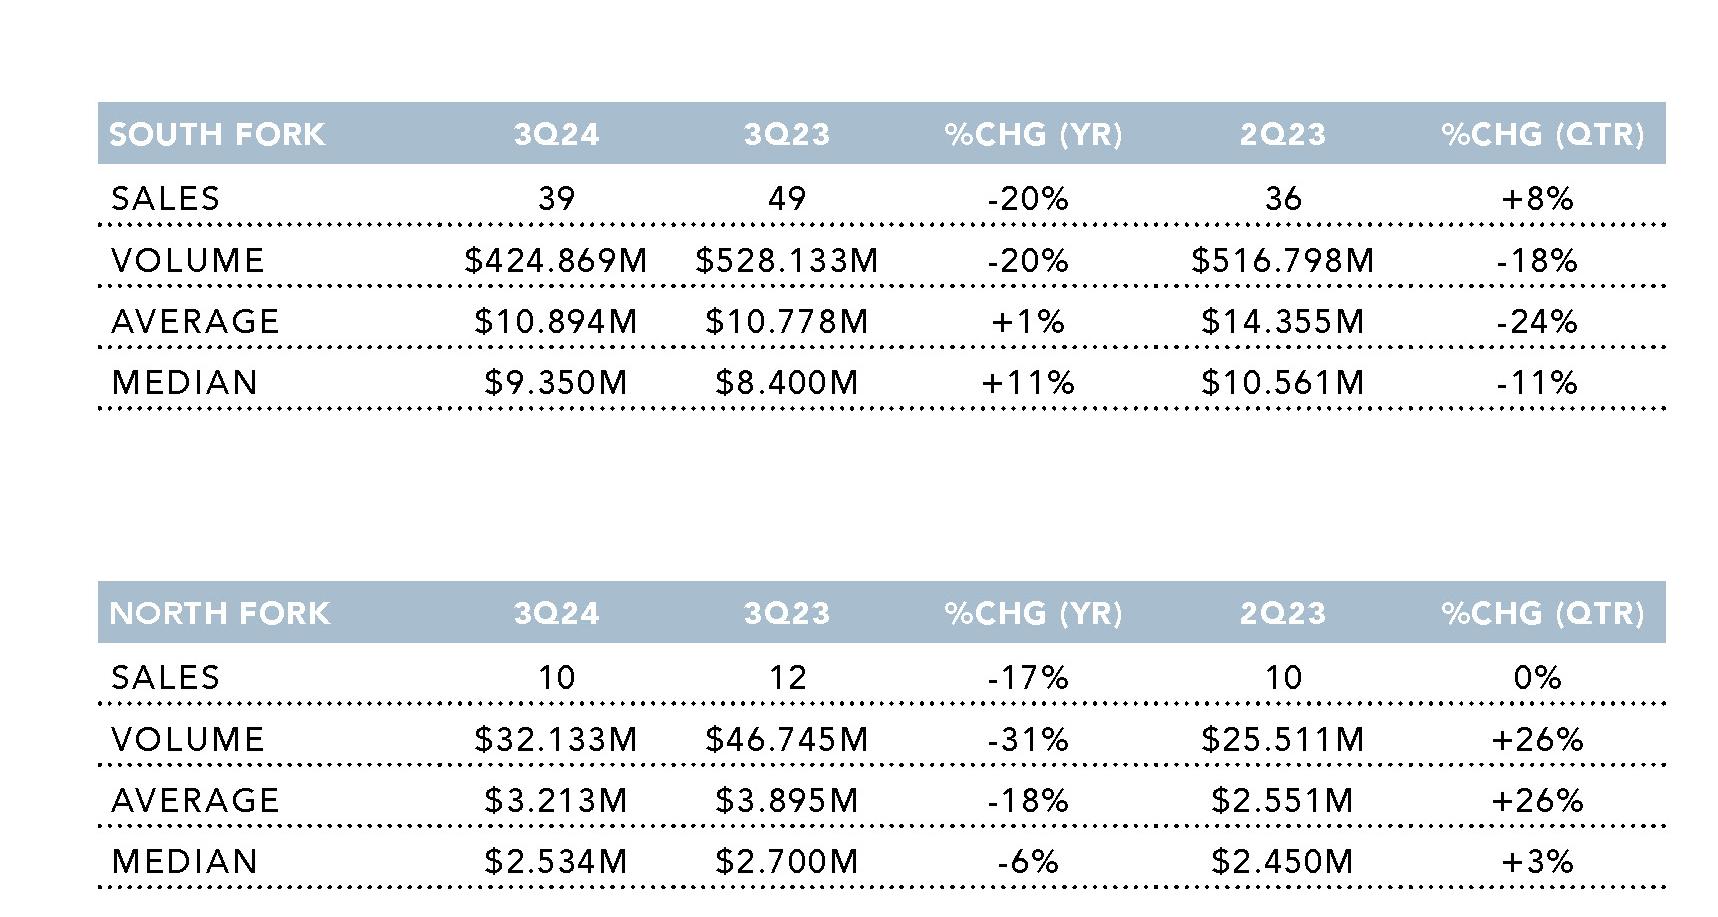
In Third Quarter 2024, South Fork luxury median and average sale price rose 11% and 1% year-over year, respectively. A greater share of sales over $10M drove median price higher. Average price would have climbed more than 1% year-over-year were it not for one $51M sale in 2023 that skewed last year’s average. Third Quarter 2024’s top closing was a six-bedroom, nine-bathroom estate on Sagaponack Pond with unobstructed ocean views. Bridgehampton/Sagaponack accounted for more of the South Fork’s luxury sales than any other submarket. Sagaponack, Southampton, and Quogue were the only villages/hamlets with reported sales above $20M, with one each.


LAND MARKET & INVENTORY
LAND MARKET
The land market is defined as the total sales of all vacant land on the East End regardless of zoning classifications. The commercial market encompasses sales of existing buildings classified for non-residential use only. Traditionally, both Forks experience relatively few commercial transactions in any given quarter.
INVENTORY
Inventory is the total number of East End properties listed for sale at the end of the quarter. As of the end of September, inventory was 2,219 listings. This represented an increase of 15% annually and 8% versus Second Quarter 2024. Year-over-year, inventory expanded for the third consecutive quarter and had the largest annual percentage gain in over ten years.
