
The Ha mptons Luxury M arket Leader Q4 EAST END MARKET REPORT 2022
Tim Davis

In September 2022, an attack on Suffolk County government systems caused a signifi cant disruption in recorded real estate data. As a result, statistics in this report are missing several weeks of closing data for September and October. Sales counts and volume totals for the Third Quarter 2022 and Fourth Quarter 2022 are negatively affected. Had the breach not occurred, reported fi gures likely would have been higher than what is shown in this report. The South Fork of Long Island reported 56% fewer closings than in the Fourth Quarter of 2021. All villages and hamlets reported sales falling year-over-year by at least half, except for Southampton Village, which saw a 44% decline. The drop in sales led overall dollar volume to contract 54% annually to $964M. Southampton Village was the only submarket to report increased sales volume, while volume declined the most in Quogue, Westhampton Beach, and Sag Harbor/North Haven. The overall average and median price of a single-family home on the South Fork increased 3% year-over-year. However, the shift in prices varied greatly by submarket. Southampton Village reported the most sales over $10M, and its growing share of luxury deals helped its average and median prices jump by more than 75% annually. East Hampton Village had the East End’s most expensive sale of the quarter. The $35M closing at 47 West End Road helped the hamlet’s average price swell 76% year-over-year to over $9M. Conversely, the average price in Amagansett fell nearly 40% to under $7M as there was only one deal over $15M versus fi ve in Fourth Quarter 2021. The share of sales priced under $1M shrank 3% annually to account for 27% of the South Fork market. The share of sales over $5M was unchanged year-over-year, comprising 12% of all transactions but slightly over 50% of total dollar volume. Two-thirds of submarkets east of the canal saw an annual increase in median price, while only half of all areas west of the canal saw an increase year-over-year. Westhampton/Remsenburg was the only area west of the canal to see double-digit growth in median price. The area reported no sales under $1M in the quarter, whereas in Fourth Quarter 2021, one-third of its 41 closings sold for under $1M.

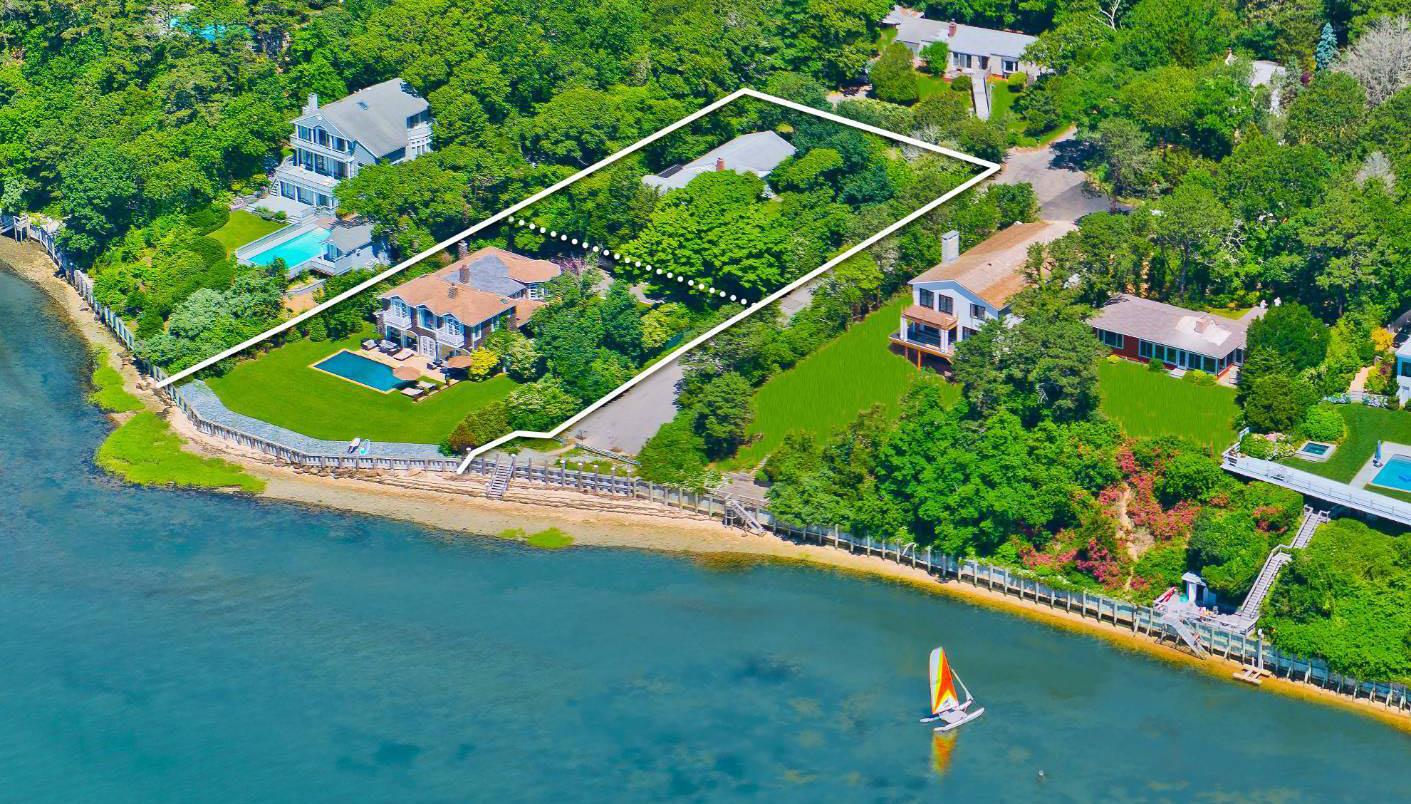
146 FOSTER CROSSING , SOUTHAMPOTN SOLD | LAST ASK $18.95M

317 Sales -56% ANNUAL CHANGE
$964.1M Volume -54%
$3.04M Average Price +3%
$1.65M Median Price +3%


The luxury market is defined as the top 10% of all residential sales made within the reported period. As various factors redefi ne the high-end market in any given period, these numbers may exhibit more volatility than the market overall. Because the luxury market is a fi xed percentage of the overall market, the change in reported luxury sales will always match the overall market. The top 10% of the market saw annual increases in price statistics, with the South Fork median price up 667% to $13.7M and the North Fork up 163% to $2.85M. Compared to Fourth Quarter 2021, closings over $10M fell by more than two-thirds, dropping from 35 deals to ten. Bridgehampton/ Sagaponack and Southampton Village accounted for more than half of the South Fork’s luxury transactions. Cutchogue and Mattituck/Laurel took all but one of the North Fork’s luxury sales.

Nearly 50 vacant land transactions occurred overall in Fourth Quarter 2022, down 65% from a year ago and 57% quarter-over-quarter. South Fork transactions fell more significantly, decreasing 71% annually and 63% from Third Quarter 2022. Sales volume was down 65% on the South Fork, but median and average price increased 8% and 22%, respectively. The double-digit increase in average price was skewed by a $30M oceanfront closing on Meadow Lane in Southampton Village. There were 45% fewer reported vacant land closings on the North Fork versus a year ago. Average price fell 57% largely due to one very large land sale at $16M in Peconic a year ago. Excluding that sale, average price would have dropped 19%. Median price decreased 20% due to fewer sales over $500K.

INVENTORY
Inventory is the total number of East End properties listed for sale at the end of a particular period. Fourth Quarter 2022 inventory was 1,733, marking the fifth consecutive quarter with fewer than 2,000 listings. Active listings decreased 5% year-over-year and 11% quarter-over-quarter, reaching the second lowest inventory statistic since 2019.
33&39 LENAPE ROAD , SOUTHAMPTON IN CONTRACT | LAST ASK $6.5M