Letter to Investors


2022

© 2023 Enterprise Products Partners L.P. XX X X PIPELINES 20,815 miles Natural Gas 19,820 miles NGL 5,681 miles Crude Oil 3,041 miles Refined Products 1,555 miles Petrochemical 20 IMPORT/EXPORT SHIP DOCKS 75 MMBbls CRUDE OIL TERMINAL/STORAGE 116 MBPD BUTANE ISOMERIZATION CAPACITY 28 MMBbls REFINED PRODUCTS TERMINAL/STORAGE 1 OCTANE ENHANCEMENT FACILITY 64 TOW BOATS AND 157 TANK BARGES INLAND MARINE FLEET 25 MBPD DEHYDROGENATION FACILITY (PDH) 18 NGL FRACTIONATORS 14 B cf NATURAL GAS STORAGE 7 PROPYLENE FRACTIONATION FACILITIES 29 NATURAL GAS PROCESSING PLANTS 177 MMBbls NGL TERMINAL/STORAGE Asset Overview

NATURAL GAS PIPELINES CRUDE OIL PIPELINES BARGES CRUDE OIL STORAGE NGL STORAGE NATURAL GAS STORAGE CRUDE OIL REFINING * CRUDE OIL PIPELINES PROPYLENE SPLITTER/PDH BUTANE ISOMERIZATION/ i BDH NGL FRACTIONATION NATURAL GAS PIPELINES MIXED NGL s NATURAL GAS ETHANE, PROPANE, BUTANE, ISO-BUTANE, N GASOLINE OCTANE ENHANCEMENT REFINED PRODUCTS PIPELINES OCTANE ENHANCEMENT EXPORTS CRUDE EXPORTS NGL PIPELINES CHEMICAL MARKET * NGL WHOLESALE NGL EXPORTS NATURAL GAS PIPELINES TRUCKS CRUDE OIL PRODUCTION * NATURAL GAS PRODUCTION * REFINED PRODUCTS STORAGE NATURAL GAS PROCESSING * 3rd Party Activity AS GENERALLY USED IN THE ENERGY INDUSTRY AND IN THIS REPORT, THE ACRONYMS BELOW HAVE THE FOLLOWING MEANINGS: Bcf = billion cubic feet Bcf/d = billion cubic feet per day MMBbls = million barrels MBPD = thousand barrels per day MMBPD = million barrels per day NGLs = natural gas liquids LPG = liquefied petroleum gas PDH = propane dehydrogenation iBDH = isobutane dehydrogenation PGP = polymer grade propylene NGL Terminal Other Liquids Terminal Dock NGL Pipeline Crude Pipeline Other Liquids Pipeline Natural Gas Pipeline Fractionation Facility Gas Processing Facility Gas Treating Facility Underground Liquids Storage Crude Storage Other Liquids Storage Natural Gas Storage ^ X $ ! ! ! # # ! Midstream Energy Services
Map Key
Partnership Profile
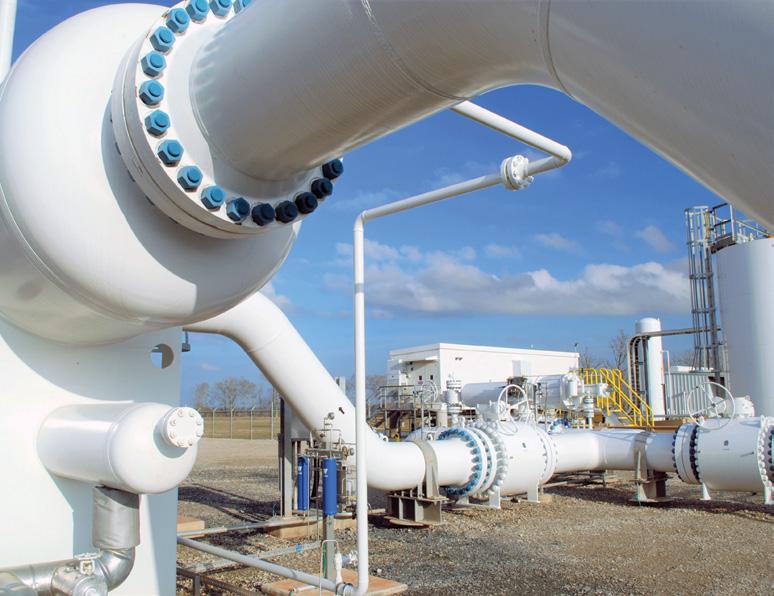
Enterprise Products Partners L.P. (“Enterprise”) is one of the largest publicly traded partnerships and a leading North American provider of midstream energy services to producers and consumers of natural gas, natural gas liquids (“NGLs”), crude oil, petrochemicals and refined products.
General Financial Data
(Dollars in millions, except per unit amounts)
GENERAL FINANCIAL DATA
(1) See page 9 for a reconciliation of this Non-Generally Accepted Accounting Principles (GAAP) financial measure to its most directly comparable GAAP financial measure.
(2) Cash distributions declared per common unit represent cash distributions declared with respect to the four fiscal quarters of each year represented. The annual cash distribution rate at December 31 is the annualized quarterly rate declared for the fourth quarter each year.
(3) Represents ratio of DCF to distributions declared with respect to the period. See page 10 for a reconciliation of DCF (a Non-GAAP financial measure) to its most directly comparable GAAP financial measure.
(4) Reflects actual number of Enterprise common units outstanding at December 31 for the periods presented.
FOR THE YEAR ENDED DECEMBER 31, INCOME STATEMENT DATA 2022 2021 2020 Revenues $58,186 $40,807 $27,200 Operating income 6,907 6,103 5,035 Net income attributable to common unitholders 5,487 4,634 3,775 Diluted income per common unit 2.50 2.10 1.71 BALANCE SHEET DATA Total assets $68,108 $67,526 $64,107 Total debt 28,295 29,535 29,866 Total equity 27,702 26,439 25,378 CAPITAL INVESTMENTS Sustaining capital expenditures $372 $430 $294 Growth capital investments, including net cash used in business combinations(a) 4,802 1,815 3,031 Cash contributions from noncontrolling interests (b) 7 72 31 Net growth capital investments (a - b) 4,795 1,743 3,000 OTHER FINANCIAL DATA Total gross operating margin (non-GAAP) (1) $9,309 $8,561 $8,103 Adjusted EBITDA (non-GAAP) (1) 9,309 8,381 8,057 Cash distribution declared per common unit (2) 1.9050 1.8150 1.7850 Annual cash distribution rate at December 31 (2) 1.96 1.86 1.80 Cash distribution coverage (3) 1.9x 1.7x 1.6x Number of common units outstanding at December 31 (4) 2,171 2,176 2,182
Letter to Our Investors
ENTERPRISE REPORTED RECORD PERFORMANCE IN 2022, ESTABLISHING 25 SAFETY, OPERATING, AND FINANCIAL RECORDS. The partnership reported record Adjusted Earnings Before Interest, Taxes, Depreciation and Amortization (“Adjusted EBITDA”) of $9.3 billion. The partnership also generated record cash flow whether measured by Adjusted Cash Flow from Operations (“Adjusted CFFO”) or Operational Distributable Cash Flow (“Operational DCF”), which were $8.1 billion and $7.6 billion, respectively. Our cash flow growth supported a 5 percent increase in cash distributions declared and paid to our partners for 2022 compared to 2021, and our 24th consecutive year of distribution growth. The partnership’s Operational DCF provided 1.8 times coverage of our distributions. We retained $3.4 billion of Operational DCF to reinvest in the growth of the partnership, repurchase common units and reduce debt.
The partnership’s 2022 performance was generated by record volumes across many of our assets, higher margins in our natural gas processing and octane enhancement businesses, and contributions from our February 2022 acquisition of Navitas Midstream, LLC. The Navitas purchase, our largest acquisition since 2014, enabled us to establish a natural gas gathering and processing presence in the Permian’s active Midland Basin. This acquisition was immediately accretive to Enterprise’s cash flow per unit and exceeded our initial expectations. During the year, we increased the value of our partnership by investing $1.4 billion in organic growth capital projects, completing $3.4 billion of acquisitions for Navitas and costefficient purchases of existing pipelines

that expand our midstream system, and repurchasing $250 million of our common units while also reducing the principal amount of our senior notes by $1.4 billion. We finished the year with a strong balance sheet and
2022 Volume Highlights
financial flexibility that positions us to execute on our $5.8 billion portfolio of growth capital projects currently under construction. These projects will provide new sources of cash flow for the partnership.
2022 LETTER TO INVESTORS | 1
2022 2021 Change Natural Gas Transportation Volumes (TBtus/d) 17.1 14.2 20.4% NGL, Crude Oil, Refined Products, and Petrochemical Transportation Volumes (MBPD) 6,672 6,390 4.4% Fee-based Natural Gas Processing Volumes (Bcf/d) 5.2 4.1 26.8% Marine Terminal Volumes (MBPD) 1,713 1,537 11.5% NGL Fractionation Volumes (MBPD) 1,339 1,253 6.9% TBtus/d = trillion British thermal units per day NGL = natural gas liquids MBPD = thousand barrels per day Bcf/d = billion cubic feet per day
TRIR & LTIR
Each of our four business segments reported strong, if not record, results. We are proud of our employees’ continuous focus on performing tasks safely, as reflected in our Operations and Trucking groups’ record safety performance.
During 2022, we completed construction of more than $500 million of organic growth projects. These projects were primarily smaller pipeline projects to link incremental supplies of crude oil, natural gas, NGLs, petrochemical and refined products to our midstream system, expand our system to facilitate volume growth and deliver products to our customers. We also completed purchases of approximately 580 miles of existing pipelines from third parties for $160 million. These cost-effective acquisitions will enable us to expand and extend our NGL and petrochemical pipeline system on the Texas Gulf Coast.


2 | ENTERPRISE PRODUCTS PARTNERS L.P.
Operations Total Ending 12/31/2022 2011 2012 2013 2014 2015 2016 2017 2018 2019 2020 2010 2021 2022 0.0 0.2 1.4 1.6 0.8 1.0 1.01 1.00 0.45 TRIR LTIR 0.76 0.91 0.70 0.61 0.65 0.41 0.57 0.80 0.48 0.38 0.33 0.27 0.22 0.23 0.10 0.13 0.15 0.17 0.19 0.32 0.14 0.14 0.14 Historical
2 | ENTERPRISE PRODUCTS PARTNERS L.P.
Note: Excludes marine and trucking performance. TRIR means Total Recordable Incident Rate. LTIR means Lost Time Incident Rate.
Major Growth Capital Projects Under Construction
Delaware Basin are scheduled to be completed in the third and fourth quarters of 2023, respectively.
In keeping with our history of optimizing assets, we are undertaking an innovative project to serve refined products markets in West Texas, New Mexico, Colorado, and Utah utilizing a combination of new and recently underutilized existing pipeline assets. The Texas Western Products (“TW Products”) system is designed to provide a new supply of up to 60 MBPD of U.S. Gulf Coast gasoline and diesel to western regions that historically have paid significant premiums for these products compared to the Gulf Coast. In addition to introducing much needed competition for refined products into these previously captive markets, the partnership will also retain the ability to continue supplying mixed NGLs on the TW Products system.
INVESTING FOR FUTURE GROWTH
We currently have $5.8 billion of major capital projects under construction, scheduled to come into service in 2023–2025. Substantially all of these projects are underwritten by longterm, fee-based contracts.
Approximately $3.6 billion of these projects are expected to begin commercial service during 2023. The largest project is our second propane dehydrogenation (“PDH 2”) plant scheduled to be completed in the second quarter of 2023. This project remains on time and on budget. PDH 2 is located at our Chambers County, Texas complex. It will have the capacity to convert up to 35 MBPD of propane into 1.65 billion pounds of high purity, polymer grade propylene.
Demand for propylene has historically grown at a rate of 1.4 times that of global gross domestic product (“GDP”) growth. By
comparison, demand for crude oil typically grows at approximately half the rate of global GDP. Propylene is an important petrochemical building block for consumer goods such as durable plastics, consumer electronics, personal protective equipment, pharmaceuticals, carpets, upholstery, and diapers, just to name a few important consumer staples in everyday life.
This facility is fully underwritten by long-term, fee-based agreements. We have designed PDH 2 to significantly reduce its carbon footprint and operating expenses by modifying the facility to recycle the hydrogen it produces as a zero-emission fuel source for the plant.
Enterprise is also building four natural gas processing plants in the Permian Basin to facilitate production growth in the basin. The partnership’s Poseidon plant in the Midland Basin and the Mentone II plant in the
OFFSHORE SEA PORT OIL TERMINAL (“SPOT”)
In January 2019, Enterprise submitted an application to the U.S. Department of Transportation’s Maritime Administration (“MARAD”) and the U.S. Coast Guard (“USCG”) for a license to construct, own, and operate a deepwater crude oil port terminal in the Gulf of Mexico. Our proposed SPOT project is comprised of a fixed platform, deepwater port terminal that will be connected to an onshore crude oil storage facility with approximately 4.8 MMBbls of capacity in Brazoria County, Texas. The platform will be located approximately 30 nautical miles off the coast of Texas in 115-feet of water. The platform will be connected to the onshore storage facility by two 36-inch, bi-directional pipelines. SPOT is designed to load Very Large Crude Carriers (“VLCCs”) and other crude oil tankers
2022 LETTER TO INVESTORS | 3 Total
principle
financial
later in this letter.
Gross Operating Margin, Adjusted EBITDA, Adjusted CFFO, DCF, FCF and Adjusted FCF are non-generally accepted accounting
(“non-GAAP”)
measures that are defined and reconciled
per hour.
at rates up to 85,000 barrels
Forecast In-Service NGLs Midland Basin Poseidon Gas Processing Plant 3Q 2023 Midland Basin Leonidas Gas Processing Plant 1Q 2024 Delaware Basin Gas Processing Plant Mentone II 4Q 2023 Delaware Basin Gas Processing Plant Mentone III 1Q 2024 Shin Oak NGL Pipeline Expansion 1H 2025 NGL Fractionator #12 3Q 2023 New Ethane Export Terminal 2H 2025 Natural Gas Acadian Natural Gas Pipeline Expansion 2Q 2023 Permian Gathering Pipeline Expansion 2023 Petrochemicals PDH 2 Facility 2Q 2023 Texas Western Products Pipeline System 4Q 2023 Ethylene Export Facility Expansion 2H 2024 & 2H 2025
Responsibly Returning Capital to Unitholders
24 consecutive years of distribution growth; $47.4 Billion returned to unitholders via LP distributions and unit buybacks
Past results may not be indicative of future performance (1) Operational Distributable Cash Flow represents DCF excluding proceeds from asset sales and other matters and net receipts/payments from the monetization of interest rate derivative instruments. Adjusted CFFO per unit is defined as net cash flows provided by operating activities, excluding the net effect of changes in operating accounts, divided by the diluted weighted-average number of units outstanding. 4 | ENTERPRISE PRODUCTS PARTNERS L.P. $0 $1,000 $2,000 $3,000 $4,000 $5,000 $6,000 $7,000 $8,000 2011 2012 2013 2014 2015 2016 2017 2018 2019 2020 2010 2021 2022 1999 2000 2001 2002 2003 2004 2005 2006 2007 2008 1998 2009 LP Distributions GP Distributions DCF & Coverage $ in MMs 0.6X 1.5X 2.0X 1.8X 1.0X 0.9X 1.1X 1.3X 1.2X 1.1X 1.4X 1.3X 1.3X 1.3X 1.4X 1.5X 1.4X 1.3X 1.2X 1.2X 1.5X 1.7X 1.6X 1.7X 1.9X Eliminated 50% IDRs Moderated Distribution Growth; Reinvested Retained Cash Flow Completely Eliminated IDRs and Collapsed GP Holdco Moderated Distribution Growth; Self-Funded Equity Self-funded Capex
Durability A Track Record of Resilience Operational DCF per Unit (1) Adjusted CFFO per Unit (1) Operational DCF and Adjusted CFFO per Unit (1) 2011 2012 2013 2014 2015 2016 2017 2018 2019 2020 2010 2021 2022 2006 2007 2008 2009 $0.00 $0.40 $0.80 $1.20 $1.60 $2.00 $2.40 $2.80 $3.20 $3.60 Financial Crisis Oil Price Collapse COVID-19 Pandemic $1.10 $1.01 $0.94 $1.14 $1.37 $1.30 $1.29 $1.40 $1.58 $1.72 $1.97 $2.06 $1.99 $1.93 $2.05 $2.65 $3.00 $2.92 $2.94 $3.47 $1.51 $1.52 $1.73 $1.92 $2.12 $2.20 $2.14 $2.00 $2.14 $2.78 $3.17 $3.03 $3.24 $3.68
History of Cash Flow per Unit
The 4 pillars of Modern Civilization
Depend on Crude Oil, Natural Gas & NGLs
MODERN CIVILIZATION
SPOT is one of the world’s most environmentally focused energy infrastructure projects that includes state-of-the-art pipeline control, vapor control, and leak detection systems. SPOT is designed to reduce carbon dioxide and volatile organic compound (“VOC”) emissions by approximately 65 percent and 94 percent, respectively, compared to current industry practices. It also significantly reduces spill and collision risk and enhances overall maritime safety by eliminating the current industry practice of ship-to-ship oil transfers, or reverse lightering, at sea.
Enterprise received the Record of Decision (“ROD”) from MARAD in November 2022. We have begun work to satisfy the remaining conditions and expect to receive the deepwater port (“DWP”) license in 2023.
MARAD and the USCG led the nearly four-year, comprehensive review
of this project. The ROD includes the opinions of more than a dozen Federal governmental agencies, including the Army Corps of Engineers and Environmental Protection Agency, as well as reviews and approvals by the State of Texas. The notable findings from the ROD included:
“The construction and operation of the Port is in the national interest because the Project will benefit employment, economic growth, and U.S. energy infrastructure resilience and security. The Port will provide a reliable source of crude oil to U.S. allies in the event of market disruption and have a minimal impact on the availability and cost of crude oil in the U.S. domestic market.”
“Construction and operation of an offshore export terminal and the installation of a vapor combustion system at the DWP will reduce the
number of ship-to-ship transfers of crude oil and lessen emissions from conventional crude oil loading, thus providing a more efficient, less impactful crude oil transport facility within the offshore waters of the United States.”
“ENERGY TRANSITION” VS. “ENERGY ADDITION”
Now, as it has been throughout history, access to affordable and reliable energy is critical to human development and quality of life. Fossil fuels have been and will continue to be intrinsic to modern civilization. Noted author and professor, Vaclav Smil, posits there is no practical substitute for fossil fuels in the four pillars of modern civilization: ammonia-based fertilizers, steel, cement, and plastics/petrochemicals, as noted in the diagram above.
The last two centuries have featured multiple breakthroughs in energy
2022 LETTER TO INVESTORS | 5
Source: Excerpts from “How the World Really Works” by Vaclav Smil
Crude Oil, Natural Gas & NGLs
Natural gas is primary raw material; 80% of ammonia production used for fertilizer
Ammonia Steel Cement Plastics / Petrochemicals
Natural gas fueled blast furnace to synthesize iron ore, coke & limestone at 2,900° F
Natural gas fueled kilns heat limestone, shale & clays to 2,600° F
NGLs are primary raw material; Natural gas needed to fuel crackers to 1,900° F
Has the World Ever Done Energy “Transition”?
Global Population Growth Drives Energy “Addition”
Energy demand has dramatically increased over time, with a rapidly increasing global population and growing dependence on fossil fuels.
development involving coal, then crude oil and natural gas, followed by hydroelectric and nuclear, and most recently wind and solar. Two notable observations from this history: 1) with maybe the exception of whale oil, the world has never “transitioned” away from one dominant energy source to another; and 2) access to affordable energy led to industrialization and the advancements in science, engineering, agriculture, and medicine that have supported rapid population growth and quality of life. As seen in the graph above, despite advances in energy, the world currently burns nearly twice as much wood (traditional biomass, which emits more carbon than coal) than it did in the 1800s. The world’s insatiable demand for energy is a product of
population growth and desire for better living conditions in developing regions. According to the World Population Prospects 2022 report from the United Nations, the world’s population reached 8 billion in 2022 and is expected to peak around 10.4 billion during the 2080’s before remaining at that level until the end of the century.

We believe in the premise of “energy addition” or “energy evolution” one that features an all-of-the-above approach to energy. This approach recognizes the necessity of fossil fuels in our world; the need to produce, transport, and consume energy more responsibly; and the importance of the addition of low-carbon energy sources to support the world’s growing energy needs. We believe the U.S.
energy industry will continue to play a meaningful role in the coming energy evolution, both in the context of cleaner, more efficient operations and in meeting the needs for affordable, lower-emission energy solutions.
Our Evolutionary Technology group has made significant strides since its formation in May 2021. This group has identified practical, cost efficient, and economic projects to lower our own carbon footprint and support our customers’ objectives to improve theirs. Our principal areas of focus are carbon capture and storage, the hydrogen/ammonia value chain, low carbon fuels, and circular products. We believe these frontier areas will take a number of years to commercially develop, construct and implement.
6 | ENTERPRISE PRODUCTS PARTNERS L.P.
Historical Energy Demand by Source vs. Population Growth Energy Usage (TWh) Population (Billions) 0 20,000 40,000 60,000 80,000 100,000 120,000 140,000 160,000 180,000 0 1 2 3 4 5 6 7 8 9 Wind Solar
1800 1807 1814 1821 1835 1842 1849 1856 1863 1870 1877 1884 1891 1898 1905 1912 1919 1926 1933 1940 1947 1954 1961 1968 1975 1982 1989 1996 2003 2010 2017 1828 Traditional biomass Biofuels Wind Coal Hydropower Solar Crude Oil Nuclear Global Population Natural Gas Other renewables Source: https://ourworldindata.org/energy-mix
In Closing Snapshot
The global economy has become more fragile as a result of increasing geopolitical volatility, trends toward reduced globalization, evolving supply chain challenges, and low commodity inventories. We believe the United States will still be advantaged due to our ample and lower cost natural resources, strong bank and financial markets, rule of law, technological improvements across industries, and “can do” spirit. We believe Enterprise will continue to innovate in providing essential cost-effective midstream energy services to our producing and consuming customers, both domestic and international, and provide attractive returns to our investors.
We are proud 2022 was another record year for Enterprise in terms of safety, operational, and financial performance. We are grateful for the everyday efforts of our 7,300 employees who facilitated this record performance. We value our employees’ initiative, creativity, and strong work ethic, which enabled us to safely serve our customers and realize our successes. We would also like to thank our suppliers, capital providers, and fixed income and equity investors who are integral to our achievements.
As we embark on our 25th year as a public company, we will continue to explore opportunities to responsibly grow the partnership, build long-term value, and provide a resilient and growing stream of cash distributions to our limited partners. We are looking forward to pursuing new opportunities for our partnership in 2023 and beyond.
Randa Duncan Chairman of the Board
Jim Teague Co-Chief Executive Officer
Hank Bachmann Vice Chairman of the Board
Randy Fowler Co-Chief Executive Officer and Chief Financial Officer
$9.3 Billion record Adjusted EBITDA
$47.4 Billion returned to unitholders via cash distributions since IPO
24 Consecutive Years of cash distribution growth
30% Improvement(1) in C02e emission per barrel of equivalent (“BOE”) since 2011
ESG Metrics incorporated into management compensation

2022 LETTER TO INVESTORS | 7
(1) Based on 2021 data; 2022 data not yet available.
Board of Directors
Randa Duncan Chairman of the Board C
Richard H. Bachmann Vice Chairman of


Murray E. Brasseux Director
William C. Montgomery Director
John R. Rutherford Director
W. Randall Fowler Director, Co-CEO
* As of March 1, 2023
Executive and Senior Vice Presidents
A.J. Teague
Co-Chief Executive Officer
W. Randall Fowler
Co-Chief Executive Officer and Chief Financial Officer
Graham W. Bacon
Executive Vice President and Chief Operating Officer
R. Daniel Boss
Executive Vice President–Accounting, Risk Control and Information Technology
Anthony C. Chovanec
Executive Vice President, Fundamentals and Commodity Risk Assessment
Christian M. Nelly Executive Vice President–Finance and Sustainability and Treasurer
Robert D. Sanders
Executive Vice President, Asset Optimization
Brent B. Secrest Executive Vice President and Chief Commercial Officer


Harry P. Weitzel
Executive Vice President, General Counsel and Secretary
James P. Bany
Senior Vice President, Crude Oil Pipelines and Terminals
F. Christopher D’Anna
Senior Vice President, Petrochemicals
Natalie K. Gayden
Senior Vice President, Natural Gas
Michael C. Hanley
Senior Vice President, Hydrocarbon Marketing
Penny R. Houy
Senior Vice President, Tax
Justin M. Kleiderer
Senior Vice President, Pipelines and Terminals
Yvette M. Longonje
Senior Vice President, Asset Optimization
Robert E. Moss
Senior Vice President, Houston Region Operations
Angie M. Murray
Senior Vice President, Technical Services
Phu V. Phan
Senior Vice President, Western Region Operations
Kevin M. Ramsey
Senior Vice President, Capital Projects
Zachary S. Strait
Senior Vice President, Unregulated NGLs
Karen D. Taylor


Senior Vice President, Human Resources

8 | ENTERPRISE PRODUCTS PARTNERS L.P.
A
A C
A. J. Teague Director, Co-CEO
C
the Board
C
G
C
and CFO
Harry P. Weitzel Director, EVP, General Counsel, and Secretary
C
G C
Carin M. Barth Director
A
Rebecca G. Followill Director
G Governance Committee A Audit & Conflicts Committee C Capital Projects Committee
James T. Hackett Director
G C
Reconciliation of Non-GAAP Financial Measures to GAAP Financial Measures
expenses (excluding amortization of major maintenance costs of reaction-based plants), non-cash asset impairment charges, gains and losses from asset sales and related matters, and general and administrative costs. Our calculation of gross operating margin may or may not be comparable to similarly titled measures used by other companies. The GAAP financial measure most directly comparable to total gross operating margin is operating income.
ADJUSTED EBITDA
Adjusted EBITDA is commonly used as a supplemental financial measure by our management and external users of our financial statements, such as investors, commercial banks, research analysts and rating agencies, to assess the financial performance of our assets without regard to financing methods, capital structures or historical cost basis; the ability of our assets to generate cash sufficient to pay interest and support our indebtedness; and the viability of projects and the overall rates of return on alternative investment opportunities. Since adjusted EBITDA excludes some, but not all, items that affect net income or loss and because these measures may vary among other companies, the adjusted EBITDA data presented in this Letter to Investors may not be comparable to similarly titled measures of other companies. The GAAP measure most directly comparable to adjusted EBITDA is net cash flows provided by operating activities.
TOTAL GROSS OPERATING MARGIN 2022 2021 2020 REVENUES $58,186 $40,807 $27,200 Subtract operating costs and expenses (51,502) (35,078) (22,371) Add equity in earnings of unconsolidated affiliates 464 583 426 Add depreciation, accretion and amortization expense amounts not reflected in gross operating margin 2,107 2,011 1,962 Add non-cash impairment charges not reflected in gross operating margin 53 233 890 Add net losses or subtract net gains attributable to asset sales and related matters not reflected in gross operating margin 1 5 (4) TOTAL GROSS OPERATING MARGIN (NON-GAAP) $9,309 $8,561 $8,103 TOTAL GROSS OPERATING MARGIN (NON-GAAP) $9,309 $8,561 $8,103 Adjustments to reconcile non-GAAP total gross operating margin to GAAP total operating income: Subtract depreciation, amortization and accretion expense amounts not reflected in gross operating margin (2,107) (2,011) (1,962) Subtract non-cash impairment charges not reflected in gross operating margin (53) (233) (890) Add net gains or subtract net losses attributable to asset sales and related matters not reflected in gross operating margin (1) (5) 4 Subtract general and administrative costs not reflected in gross operating margin (241) (209) (220) OPERATING INCOME (GAAP) $6,907 $6,103 $5,035 ADJUSTED EBITDA NET INCOME (GAAP) $5,615 $4,755 $3,886 Adjustments to GAAP net income to derive Non-GAAP Adjusted EBITDA: Subtract equity in earnings of unconsolidated affiliates (464) (583) (426) Add distributions received from unconsolidated affiliates 544 590 615 Add interest expense (including related amortization) 1,244 1,283 1,287 Subtract benefit from or add provision for taxes 82 70 (124) Add depreciation, amortization and accretion in costs and expenses (excluding amort. in interest exp.) 2,156 2,055 2,010 Add non-cash asset impairment charges 53 233 890 Add net losses or subtract net gains on asset sales and related matters 1 5 (4) Add non-cash expense attributable to changes in fair value of Liquidity Option Agreement - - 2 Add or subtract changes in fair value of derivative instruments 78 (27) (79) ADJUSTED EBITDA (NON-GAAP) $9,309 $8,381 $8,057 ADJUSTED EBITDA (NON-GAAP) $9,309 $8,381 $8,057 Adjustments to Non-GAAP Adjusted EBITDA to derive net cash flows provided by operating activities: Subtract interest expense, including related amortization (1,244) (1,283) (1,287) Add benefit from or subtract provision for income taxes (82) (70) 124 Subtract distributions received for return of capital from unconsolidated affiliates (98) (46) (188) Subtract deferred income tax benefit or add deferred income tax expense 60 40 (148) Add or subtract net effect of changes in operating accounts (54) 1,366 (768) Add miscellaneous non-cash and other amounts to reconcile Non-GAAP Adjusted EBITDA with GAAP net cash flows provided by operating activities. 148 125 101 NET CASH FLOWS PROVIDED BY OPERATING ACTIVITIES (GAAP) $8,039 $8,513 $5,891 FOR THE YEAR ENDED DECEMBER 31, GROSS OPERATING MARGIN We evaluate segment performance based on our financial measure of gross operating margin. Gross operating margin is an important performance measure of the core profitability of our operations and forms the basis of our internal financial reporting. We believe that investors benefit from having access to the same financial measures that our management uses in evaluating segment results. Total gross operating margin is exclusive of other income and expense transactions, provision for income taxes, the cumulative effect of changes in accounting principles and extraordinary charges. Total gross operating margin is presented on a 100 percent basis before any allocation of earnings to noncontrolling interests. We define total gross operating margin as operating income exclusive of depreciation, amortization and accretion
(Dollars in millions)
DISTRIBUTABLE CASH FLOW NET INCOME ATTRIBUTABLE TO COMMON UNITHOLDERS (GAAP)
Adjustments to GAAP net income attributable to common unitholders to derive Non-GAAP distributable cash flow:
SUBTOTAL DISTRIBUTABLE CASH FLOW BEFORE PROCEEDS FROM ASSET SALES AND MONETIZATION OF INTEREST RATE DERIVATIVES
distributable cash flow to derive GAAP net cash flow provided by operating activities:
provided by operating activities to Adjusted Cash flow from
DISTRIBUTABLE CASH FLOW
Our management compares the distributable cash flow we generate to the cash distributions we expect to pay our partners. Using this metric, management computes our distribution coverage ratio. Distributable cash flow is an important Non-GAAP financial measure for our common unitholders since it serves as an indicator of our success in providing a cash return on investment. Specifically, this financial measure indicates to investors whether or not we are generating cash flows at a level that can sustain our declared quarterly cash distributions. Distributable cash flow is also a quantitative standard used by the investment community with respect to publicly traded partnerships because the value of a partnership unit is, in part, measured by its yield, which is based on the amount of cash distributions a partnership can pay to a common unitholder. The GAAP measure most directly comparable to distributable cash flow is net cash flows provided by operating activities.
FREE CASH FLOW AND ADJUSTED FREE CASH FLOW
Free cash flow (“FCF”) is a non-GAAP measure of how much cash a business generates after accounting for capital expenditures such as plants or pipelines. Additionally, Adjusted FCF is a non-GAAP measure of how much cash a business generates, excluding the net effect of changes in operating accounts, after accounting for capital expenditures. We believe that FCF is important to traditional investors since it reflects the amount of cash available for reducing debt, investing in additional capital projects and/or paying distributions. We believe that Adjusted FCF is also important to traditional investors for the same reasons as FCF, without regard for fluctuations caused by timing of when amounts earned or incurred were collected, received, or paid from period to period. Since we partner with other companies to fund certain capital projects of our consolidated subsidiaries, our determination of FCF and Adjusted FCF appropriately reflect the amount of cash contributed from and distributed to noncontrolling interests. Our use of FCF and Adjusted FCF for the limited purposes described above is not a substitute for net cash flows provided by operating activities, which the most comparable GAAP measure to FCF and Adjusted FCF.
ADJUSTED CASH FLOW FROM OPERATIONS
Adjusted Cash Flow from Operations (“Adjusted CFFO”) is a non-GAAP measure that represents net cash flow provided by operating activities before the net effect of changes in operating accounts. We believe that it is important to consider this non-GAAP measure as it can often be a better way to measure the amount of cash generated from our operations that can be used to fund our capital investments or return value to our investors through cash distributions and buybacks, without regard for fluctuations caused by timing of when amounts earned or incurred were collected, received, or paid from period to period. Our use of Adjusted CFFO for the limited purposes described above is not a substitute for net cash flows provided by operating activities, which the most comparable GAAP measure to Adjusted CFFO.
$5,487 $4,634 $3,775
Add depreciation, amortization and
in costs and expenses 2,245 2,140 2,072 Add distributions received from unconsolidated affiliates 544 590 615 Subtract equity in income of unconsolidated affiliates (464) (583) (426) Subtract sustaining capital expenditures (372) (430) (294) Add net losses or subtract net gains related to assets sales and related matters 1 5 (4) Add changes in fair value of Liquidity Option Agreement - - 2 Add or subtract changes in fair value of derivative instruments 78 (27) (79) Subtract deferred income tax benefit or add deferred income tax expense 60 40 (148) Add non-cash impairment charges 53 233 890 Add or subtract miscellaneous adjustments to derive Non-GAAP distributable cash flow (3) (133) 24
accretion
(“OPERATIONAL DCF”) $7,629 $6,469 $6,427 OPERATIONAL DCF $7,629 $6,469 $6,427 Add cash proceeds from asset sales and other matters 122 64 13 Subtract losses or add gains from monetization of interest rate derivative instruments accounted for as cash flow hedges - 75 (33) DISTRIBUTABLE CASH FLOW (NON-GAAP) $7,751 $6,608 $6,407 DISTRIBUTABLE CASH FLOW (NON-GAAP) $7,751 $6,608 $6,407 Adjustments to Non-GAAP
Add sustaining capital expenditures 372 430 294 Subtract cash proceeds from asset sales and other matters (122) (64) (13) Add losses or subtract gains from monetization of interest rate derivative instruments accounted for as cash flow hedges - (75) 33 Add or subtract net effect of changes in operating accounts (54) 1,366 (768) Add or subtract miscellaneous non-cash and other amounts to reconcile Non-GAAP distributable cash flow with GAAP net cash flow provided by operating activities 92 248 (62) NET CASH FLOWS PROVIDED BY OPERATING ACTIVITIES (GAAP) $8,039 $8,513 $5,891 NET CASH FLOWS PROVIDED BY OPERATING ACTIVITIES (GAAP) $8,039 $8,513 $5,891 Adjustments to reconcile GAAP net cash flow
operations: Add or subtract net effect of changes in operating accounts 54 (1,366) 768 ADJUSTED CFFO (NON-GAAP) $8,093 $7,147 $6,659 NET CASH FLOWS PROVIDED BY OPERATING ACTIVITIES (GAAP) $8,039 $8,513 $5,891 Adjustments to reconcile GAAP net cash flow
to Non-GAAP free cash flow and adjusted free cash flow: Subtract net cash used in investing activities (4,954) (2,135) (3,121) Add cash contributions from noncontrolling interests 7 72 31 Subtract cash distributions paid to noncontrolling interests (163) (154) (131) FREE CASH FLOW (NON-GAAP) $2,929 $6,296 $2,670 Add or subtract net effect of changes in operating accounts 54 (1,366) 768 ADJUSTED FREE CASH FLOW (NON-GAAP) $2,983 $4,930 $3,438 2022 LETTER TO INVESTORS | 10
provided by operating activities
Company Profile
Cash Distributions
Enterprise has increased its cash distribution rate for 24 consecutive years. On January 5, 2023, Enterprise announced that the Board declared a quarterly cash distribution of $0.49 per common unit with respect to the fourth quarter of 2022, or $1.96 per unit on an annualized basis. This distribution was paid February 14, 2023 to unitholders of record as of the close of business on January 31, 2023. This quarterly distribution was a 5.4 percent increase over the distribution declared with respect to the fourth quarter of 2021.
The payment of any quarterly cash distribution is subject to management’s evaluation of our financial condition, results of operations and cash flows in connection with such payments and Board approval.
Publicly Traded Partnership Attributes
Enterprise is a publicly traded limited partnership, which operates in the following ways that are different from a publicly traded stock corporation:
• Unitholders own limited partnership units instead of shares of common stock and receive cash distributions rather than dividends.
• A partnership generally is not a taxable entity and does not pay
federal income taxes. All of the annual income, gains, losses, deductions or credits flow through the partnership to the unitholders on a per-unit basis. The unitholders are required to report their allocated share of these amounts on their income tax returns whether or not any cash distributions are paid by the partnership to its unitholders.
• Cash distributions paid by a partnership to a unitholder are generally not taxable, unless the amount of any cash distributed is in excess of the unitholder’s adjusted basis in their partnership interest.
Stock Exchange and Common Unit Information
Enterprise common units trade on the New York Stock Exchange under the ticker symbol EPD. Enterprise had 2,170,806,347 common units outstanding at January 31, 2023.
K-1 Information
Enterprise provides each unitholder a Schedule K-1 tax package that includes each unitholder’s allocated share of reportable partnership items and other partnership information necessary to be reported on state and federal income tax returns. The K-1 provides required tax information for a unitholder’s ownership interest in the partnership, just as a Form 1099DIV does for a stockholder’s ownership interest in a corporation.
Information concerning the partnership’s K-1s can be obtained by calling toll free 800.599.9985 or through the partnership’s website.
FORWARD-LOOKING STATEMENTS
Registered Public Accounting Firm
Deloitte & Touche LLP
Houston, TX
Transfer Agent, Registrar and Cash
Distribution Paying Agent
EQ Shareowner Services
1110 Centre Point Curve Suite 101 Mendota Heights, MN 55120 855.235.0839 shareowneronline.com
Additional Investor Information
Additional information about Enterprise, including our SEC annual report on Form 10-K, can be obtained by contacting Investor Relations by telephone at 866.230.0745, writing to the partnership’s mailing address or accessing the partnership’s website.
Headquarters Enterprise Products Partners L.P. Enterprise Plaza
1100 Louisiana Street, 10th Floor Houston, TX 77002-5227 713.381.6500
enterpriseproducts.com
Mailing Address
P.O. Box 4324
Houston, TX 77210-4324
This Letter to Investors includes “forward looking statements” as defined by the SEC. All statements, other than statements of historical fact, included herein that address activities, events or developments that Enterprise expects, believes or anticipates will or may occur in the future are forward-looking statements. These forward-looking statements are subject to risks and uncertainties that may cause actual results to differ materially, such as the required approvals by regulatory agencies and the impact of competition, regulation and other risk factors included in the reports filed with the SEC by Enterprise. Readers are cautioned not to place undue reliance on these forward-looking statements, which speak only as of their dates. Except as required by law, Enterprise does not intend to update or revise its forward-looking statements, whether as a result of new information, future events or otherwise.
WWW.ENTERPRISEPRODUCTS.COM


