This report was compiled through the collaborative work of dozens of community organizations, the Town of Hilton Head Island Staff, and elected officials. Thank you to all those parties who dedicated their time and information to this important work. The Planning Team would like to specially thank these individuals:
Town Council
Alan Perry, Mayor
David Ames, Mayor Pro-Tem
Alex Brown
Patsy Brison
Tamara Becker
Steve Alfred
Glenn Stanford
Town of Hilton Head Island Staff
Marc Orlando, Town Manager
Shawn Colin, Assistant Town Manager- Community Development
Missy Luick, Director of Planning
Katie Kabala, Customer Service Manager
Nicte Barrientos, Planner-Economic Development
Shea Farrar, Principal Planner
Zenos Morris, Director of Built Environment
Bryan McIlwee, Director of Public Projects & Facilities
Matthew Carey, GIS Administrator
Kris Kronlein, Senior GIS Analyst
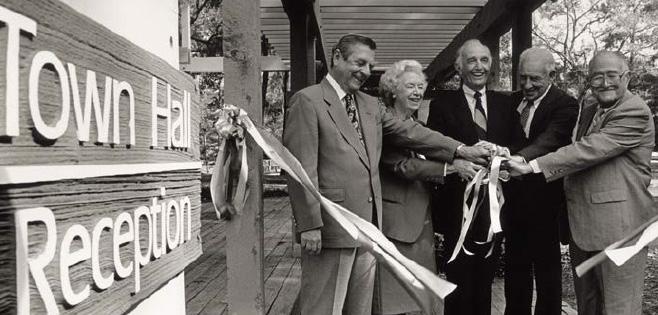
An Important Moment. . . In 2023, the Town of Hilton Head Island staff initiated a process to better understand and document the critical conditions and trends that are – or will – have an impact on the community over the next 20 years. This effort is an informing component for major, forthcoming plans like decennial Comprehensive Plan, Capital Improvements Program, and Strategic Action Plan. It provides an objective inventory of available data and research. The 2020s mark the start of a new era for the communities of the Island. This analysis will help leadership better understand these emerging trends and prepare policy that is timely and data-informed.
Why
now?
This is an inflection point. Community leaders have identified this moment as an important time to pause and better understand the implications and connections of various data. Through this analysis, the team has assessed the position of the Town across multiple measures and contextualized the potential impact of present and emerging trends. These are documented in the report through ten topical chapters including: demographics, workforce, economics, real estate, environment, housing, governance, community, systems, and land use.
This is the time to pause and better understand the moment. This is an opportunity to consider the future of the community through forthcoming planning efforts while also determining which trends to reinforce and which trends to mitigate. This report will do four things:
• Collect and organize a baseline of critical data. Through an investigation of available sources and existing research the planning team has assembled a comprehensive database organized around ten topics.
• Identify major trends. The findings from the analysis are curated and presented through the report as critical trends. This work is supplemented by a database containing all information collected through analysis.
• Clearly communicate the information. This report focuses on key findings and is presented in a clear, graphically rich format.
• Consider “next steps.” The report and data will be leveraged by forthcoming plans and studies including the Growth Framework and District Plans.
The Conditions and Trends Assessment will be used by the Town through future planning processes to establish a data-informed approach to decision making. The research can be repeated on a regular basis to mark progress on key community goals. The process was initiated by the Town Manager and managed through the Community Development department and their consultants MKSK and Kimley Horn.
USER GUIDE
The Conditions and Trends Assessment provides a snapshot of the Town of Hilton Head Island from multiple angles. The report and dataset are designed to enhance the community’s shared understanding of current and emergent issues. This work will help inform the findings and recommendations for critical Town planning initiatives like the decennial Comprehensive Plan, Capital Improvements Program, and Strategic Action Plan.
HOW WILL THE ASSESSMENT BE USED?
The assessment provides the community with benchmark information and statistics from which it can evaluate and assess the overall health of the Town and its systems. The report is a collection and distillation of this comprehensive database of information, research, and primary data sources. The findings and analysis identify major trends and provide a baseline of critical information. This report will be used as a building block for Town leadership to make data-driven decisions through future community plans, development strategies, public policies, and strategic actions. This assessment will be used by the Town in several ways including:
Provide a common starting point ...
• Add context to community conversations with respect local and regional trends
• Connect key information; share source data and resources
• Remove the mystery on community needs, gaps, or opportunities
Inform future plans and studies ...
• Provide base set of findings to help initially focus and direct work
• Accelerate the data assembly process with ready-made resources, tables, maps, and other resources
• Uncover pressing or emergent issues, opportunities, and/or needs
• Synchronize data across multiple planning efforts, departments, and community partners
Measure progress ...
• Take a moment-in-time “snapshot” of the Island across multiple trends
• Measure progress or movement against this benchmark
• Evaluate policy effectiveness
• Quantify short and long-term impacts of major projects
WHO WILL USE THE ASSESSMENT?
The purpose of the Conditions and Trends Assessment is to present an objective view of the Town’s most significant conditions and trends in 2023. The use of this information – for planning, prioritizing, budgeting, etc. – should be considered through subsequent, futurefocused conversations. There are several intended users for the information including:
The general public
• Move from notional to knowledge-based community conversations
• Build a common understanding of community conditions
• Provide a starting point for reviewing Town policy and Town actions
• Feed the general curiosity about the position and direction of the Island
Town Council
• Provide real information compared to perceptions or political influences
• View and understand impacted issues or trends from a regional to Island-wide scale
• Build an understanding of interconnecting or causal factors
• Assign indicators to track the progress of major policies or projects
The Town Manager and Senior Staff
• Establish planning and capital priorities that address major community needs or issues
• Assist in capital project identification and budgeting
• Craft public/private partnering opportunities based on shared opportunities
• Prioritize future planning efforts
Town Planners and Development Partners
• Provide a factual background to specific issues
• Develop priming “common knowledge” base for consultants in various areas of concentration
• Establish a starting point for Town planning efforts
• Inspire and influence focused conversations.
Updating information and measuring progress
The Conditions and Trends Assessment is a broad dataset that complements the Town’s Comprehensive Plan. It will be regularly updated as data is refreshed and new data is made available. Major resources and datasets used to build the report include the US Census, American Communities Survey, Bureau of Labor Statistics, along with dozens of additional resources. This assessment will be updated in concert with the Town’s decennial comprehensive plan. Senior planning staff will oversee these updates in conjunction with the Town’s Comprehensive Planning process. To learn more about the data used to build the Conditions and Trends Assessment, refer to the Sources and Resources chapter on page 113.
EXECUTIVE SUMMARY OF FINDINGS
The Conditions and Trends Assessment presents findings across ten broad topic areas. Each section features the most important data points related to the topic along with the long-term implications for the Town and community. This executive summary is a collection of the most important findings from the assessment. Each point includes a page reference to the related section where more information and sources are provided.
»Population growth has stalled, but demographic shifts continue to drive socio-economic change.
• After tremendous growth through the 1970s, ‘80s, and ‘90s, Hilton Head Island’s population began to plateau; between 2000 and 2020 it only grew by 11% compared to 55% across the region.
• The two fastest growing segments were households over 65, which were up 50% (3,500 units), and persons living alone are up 57% (1,900 units). Households with children decreased 35%, with 1,200 fewer units.
• The African American segment has decreased by 400 residents (or 15%) from 2000. The median age for African American residents, 61, is three years older than the overall Island median of 58.
LOCAL JOBS FILLED BY NON-LOCALS
63%
Nonresidents hold the majority of jobs on the Island, increasing 12% since 2002
Workforce
Labor force makeup, participation, commuting, wages
Read more on p. 22
»SHARE OF RESIDENTS OVER 65
37%
This segment increased from 24% in 2000, the only growing age segment
Demographics
Population, households, change by season /day, citizen age, diversity
Read more on p. 14
Competition for labor pre-dated the COVID-19 Pandemic but was drastically accelerated through these two years of disruption.
• Mainland economic growth is exacerbating this challenge as the Island’s workforce is traveling through similarly paying and more proximate job centers on their way to work on the Island.
• Hiring challenges on the Island are growing—housing costs are rising, and with more employment opportunities emerging in Beaufort and Jasper Counties, crossing the bridge to Hilton Head Island each day is becoming less desirable to workers.
• Other regions in the Lowcountry have more land available to accommodate greater job growth, increasing by 30–40% since 2000, while the Island’s employment has only grown by 7% in the same time frame.
Regional economic growth has diversified and solidified the Town’s local economy, but this broader growth is stressing regional systems –transportation, infrastructure, labor demands, housing, and others – on which the Town depends.
• The Town is unique among peer communities for its year-round population and relatively diverse local economy. Tourism and hospitality, however, drive all major sectors and have set records following the disruption caused by the COVID-19 pandemic.
• The local economy has since recovered and job growth over the next ten years is expected to be a continuation of recent trends. In the five years leading up to the pandemic, approximately 550 jobs were added.
• According to a 2021 Tourism Impact Report from the Hilton Head Island-Bluffton Chamber of Commerce, visitor expenditures generated a net total local revenue of $23.4 million in the region through the accommodations tax, the hospitality tax, and beach preservation fees.
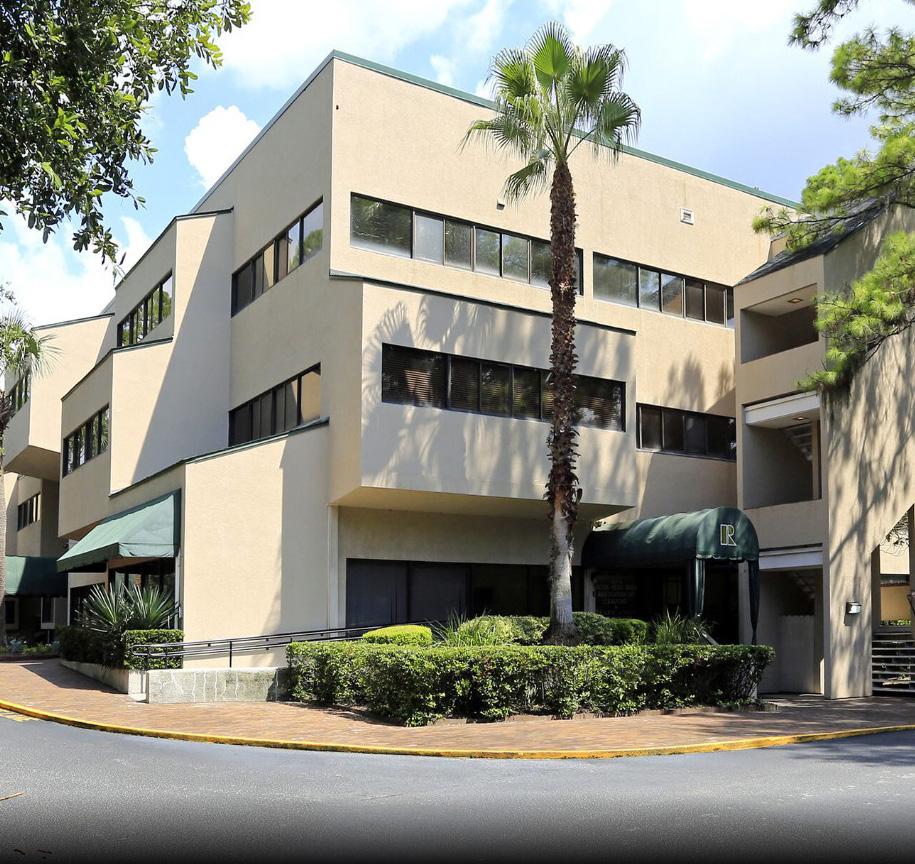
OFFICE REAL ESTATE SQUARE FOOTAGE BUILT SINCE 2010
<1%
Much of the office space on the Island is aging and new product is not being delivered
Real Estate
Retail, office, and residential property type and value
Read more on p. 38
TOTAL VISITORS, 2021
3.1m
Visitor levels returned to and exceeded pre-pandemic levels in 2021, up 16.5% from 2019
FUTURE ISLAND JOB GROWTH
+5%
Jobs growth is expected through 2030, adding 1,000 new jobs
»Major shifts in retail and office demand have impacted the rent potential for existing, older real estate.
• Very little new inventory has been added in the previous two decades. As buildings age, the redevelopment pressures are increasing, but unevenly depending on access, location, ownership, and additional factors.
• Between April 2022 and March 2023, there were 153 building permits issued for new structures. Nine were accessory structures, ten were commercial structures and the remaining 134 were single family homes.
• Almost 85% of the retail inventory was built prior to 2000, with limited renovations.
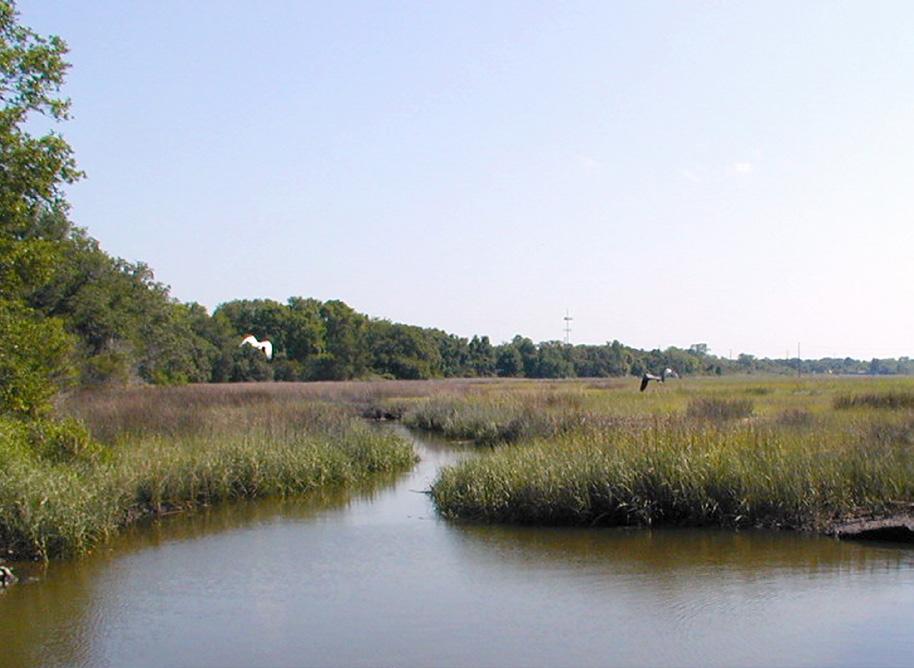
Sea level rise makes the Island more vulnerable in major storm and hurricane events.
• The secondary impacts of the changes – saltwater intrusion, high heat days, insurance and financing, and others – can be reasonably predicted.
• Because flooding will increase in coastal areas as sea levels rise, it is likely that insurance rates will increase. More frequent storms could lead to an increase in the deductible for wind damage in homeowner’s insurance policies, or much higher premiums for communities like Hilton Head Island.
• As sea levels rise, many of the coastal wetlands and salt marshes may turn to open water and alter the ecosystems where many shellfish, birds, and fish reside.
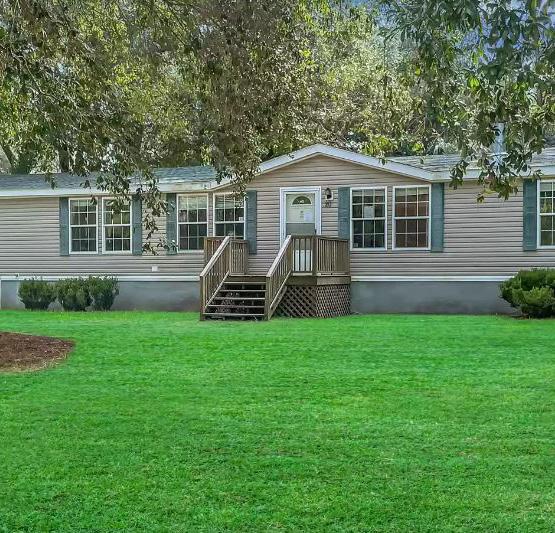
Home values are accelerating at their fastest rates ever and pulling even modest residential real estate properties to record highs.
• Diminishing affordability means more Island workers are non-local and are liable to join other jobs centers growing around the region.
• The average home cost tipped over $724,000 in 2022, outperforming the county average by more than $200,000, as well as every other community in the region. In May of 2023 that cost rose to $768,000.
• This intense growth in value followed national trends, but the acceleration in the Lowcountry was much greater. About half of the Island’s nearly 34,000 housing units are defined as “vacant,” meaning without a year-round occupant.
SEA LEVEL RISE
2ft
Potential sea level rise by 2050
Environment
Ecology, hydrology, geography, climate change, parks
Read more on p. 46
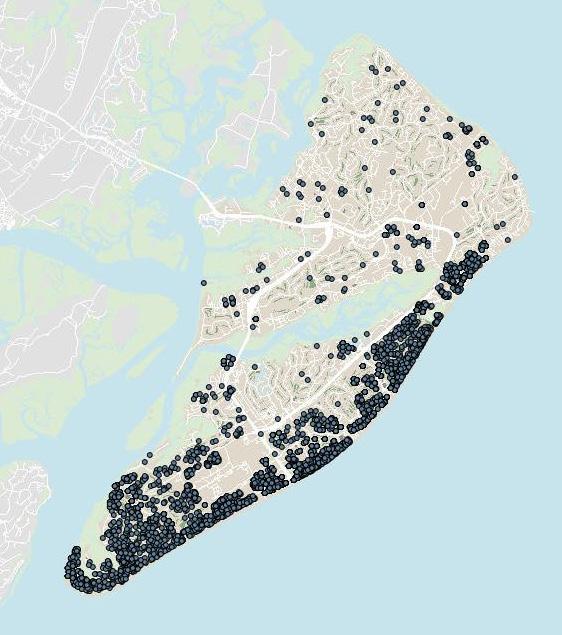
SHORT-TERM RENTAL PROPERTIES COMPARED TO ALL PROPERTIES
1
in 5
Just over 7,000 properties are actively permitted as short-term rentals
»YEAR-TO-YEAR INCREASE IN HOME VALUE, 2021 TO 2022 +33%
Fastest year-to-year increase in history, 20% increase in 2020
Housing
Permitting, home values, short-term rentals, new development and redevelopment
Read more on p. 56
Short-term rentals are a relatively new and fastemerging use across the Town.
• The trend is impacting unit values and driving new trends in small-scale redevelopment.
• Short-term rental properties have quickly surpassed hotels and resorts in number of units. These properties, however, have also strained existing neighborhoods and infrastructure with increased parking demand, nuisance management, and other issues.
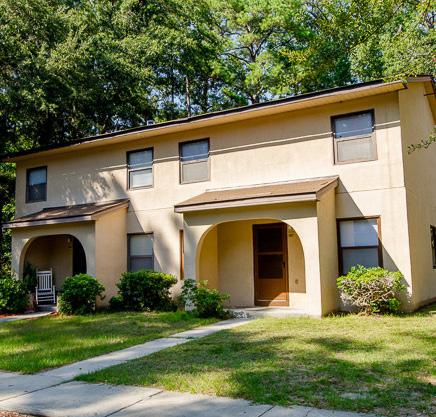
Housing affordability for lower-wage residents is reaching an inflection point.
• The small share of the existing and naturally occurring affordable housing is not protected from redevelopment and has been the target for recent development proposals. Losses in the category are not likely to be made up in a new locations in the Town given the scarcity and cost of land.
• Naturally occurring affordable housing (NOAH) units are housing units at affordable price points that are not protected by income restrictions or state and federal subsidies. These units are “unrestricted,” meaning there is little to no protection for them to stay affordable in perpetuity.
• The Island has around 2,000 NOAH units and just under 400 protected, income-restricted units.
TOWN FACEBOOK FOLLOWERS
38k
Total followers of the Town of Hilton Head Island’s Government facebook page have grown steadily since its launch
Timeline of key events, staffing, service capacity, tax revenues, strategic planning
Read more on p. 64
»NATURALLY OCCURRING AFFORDABLE UNITS
~2k
Estimate is based on existing properties with "affordable" rent and US Census cost-of-living estimates
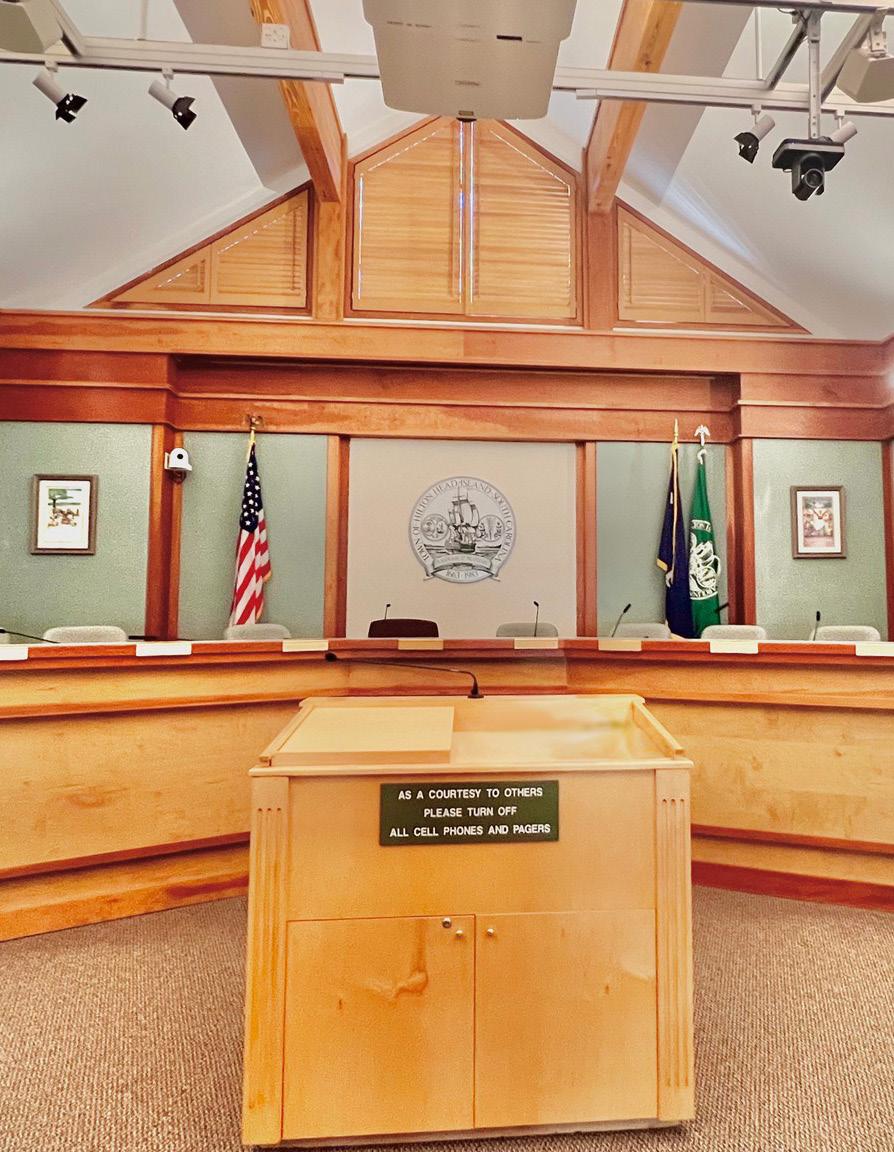
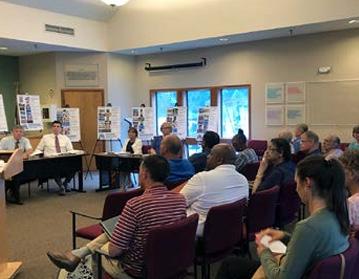
The Town’s record of transparency and commitment to community engagement are a national best practice.
• This growing relationship between residents and leadership will be critical as the Town manages challenging planning and development questions through the coming decade.
• The Our Future and Our Plan community engagement process was two years long and involved the Town Council, a community vision process consultant, a vision project management team of diverse community leaders, and the broader community.
• Direct communication from the government though multiple digital platforms allows timely communications to residents and visitors in hurricane events and other emergencies. Governance
» The Town’s staffing is small compared to similarly sized, tourism-based communities.
• Hiring, amidst rising housing costs, has been a challenge for administrators and public safety officers.
• The Town provides critical services, like fire and safety, which includes fire rescue, emergency medical services, and emergency management.
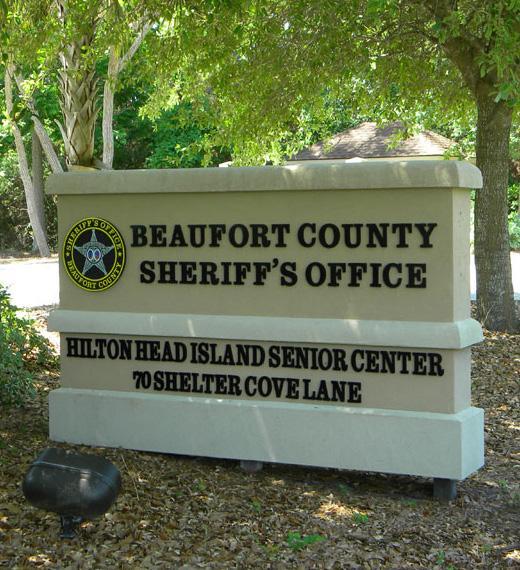
• The Town outsources services like law enforcement, which is currently served by the Beaufort County Sheriff’s Office. Other services are privatized like recreation and park management.
TOWN RESIDENTS
PER STAFF
238:1
Town staffing has increased at a slower pace than the increase in population and visitors since 2012.
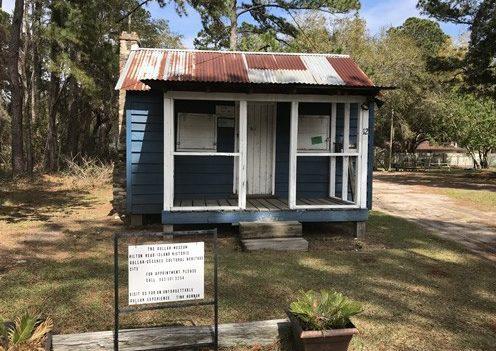
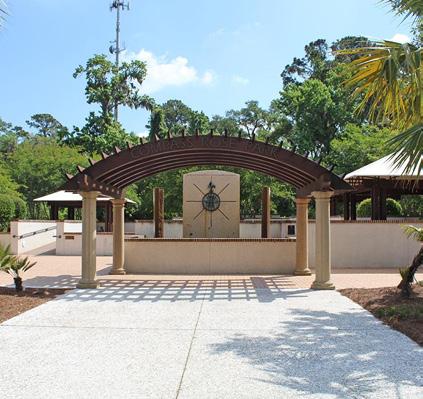
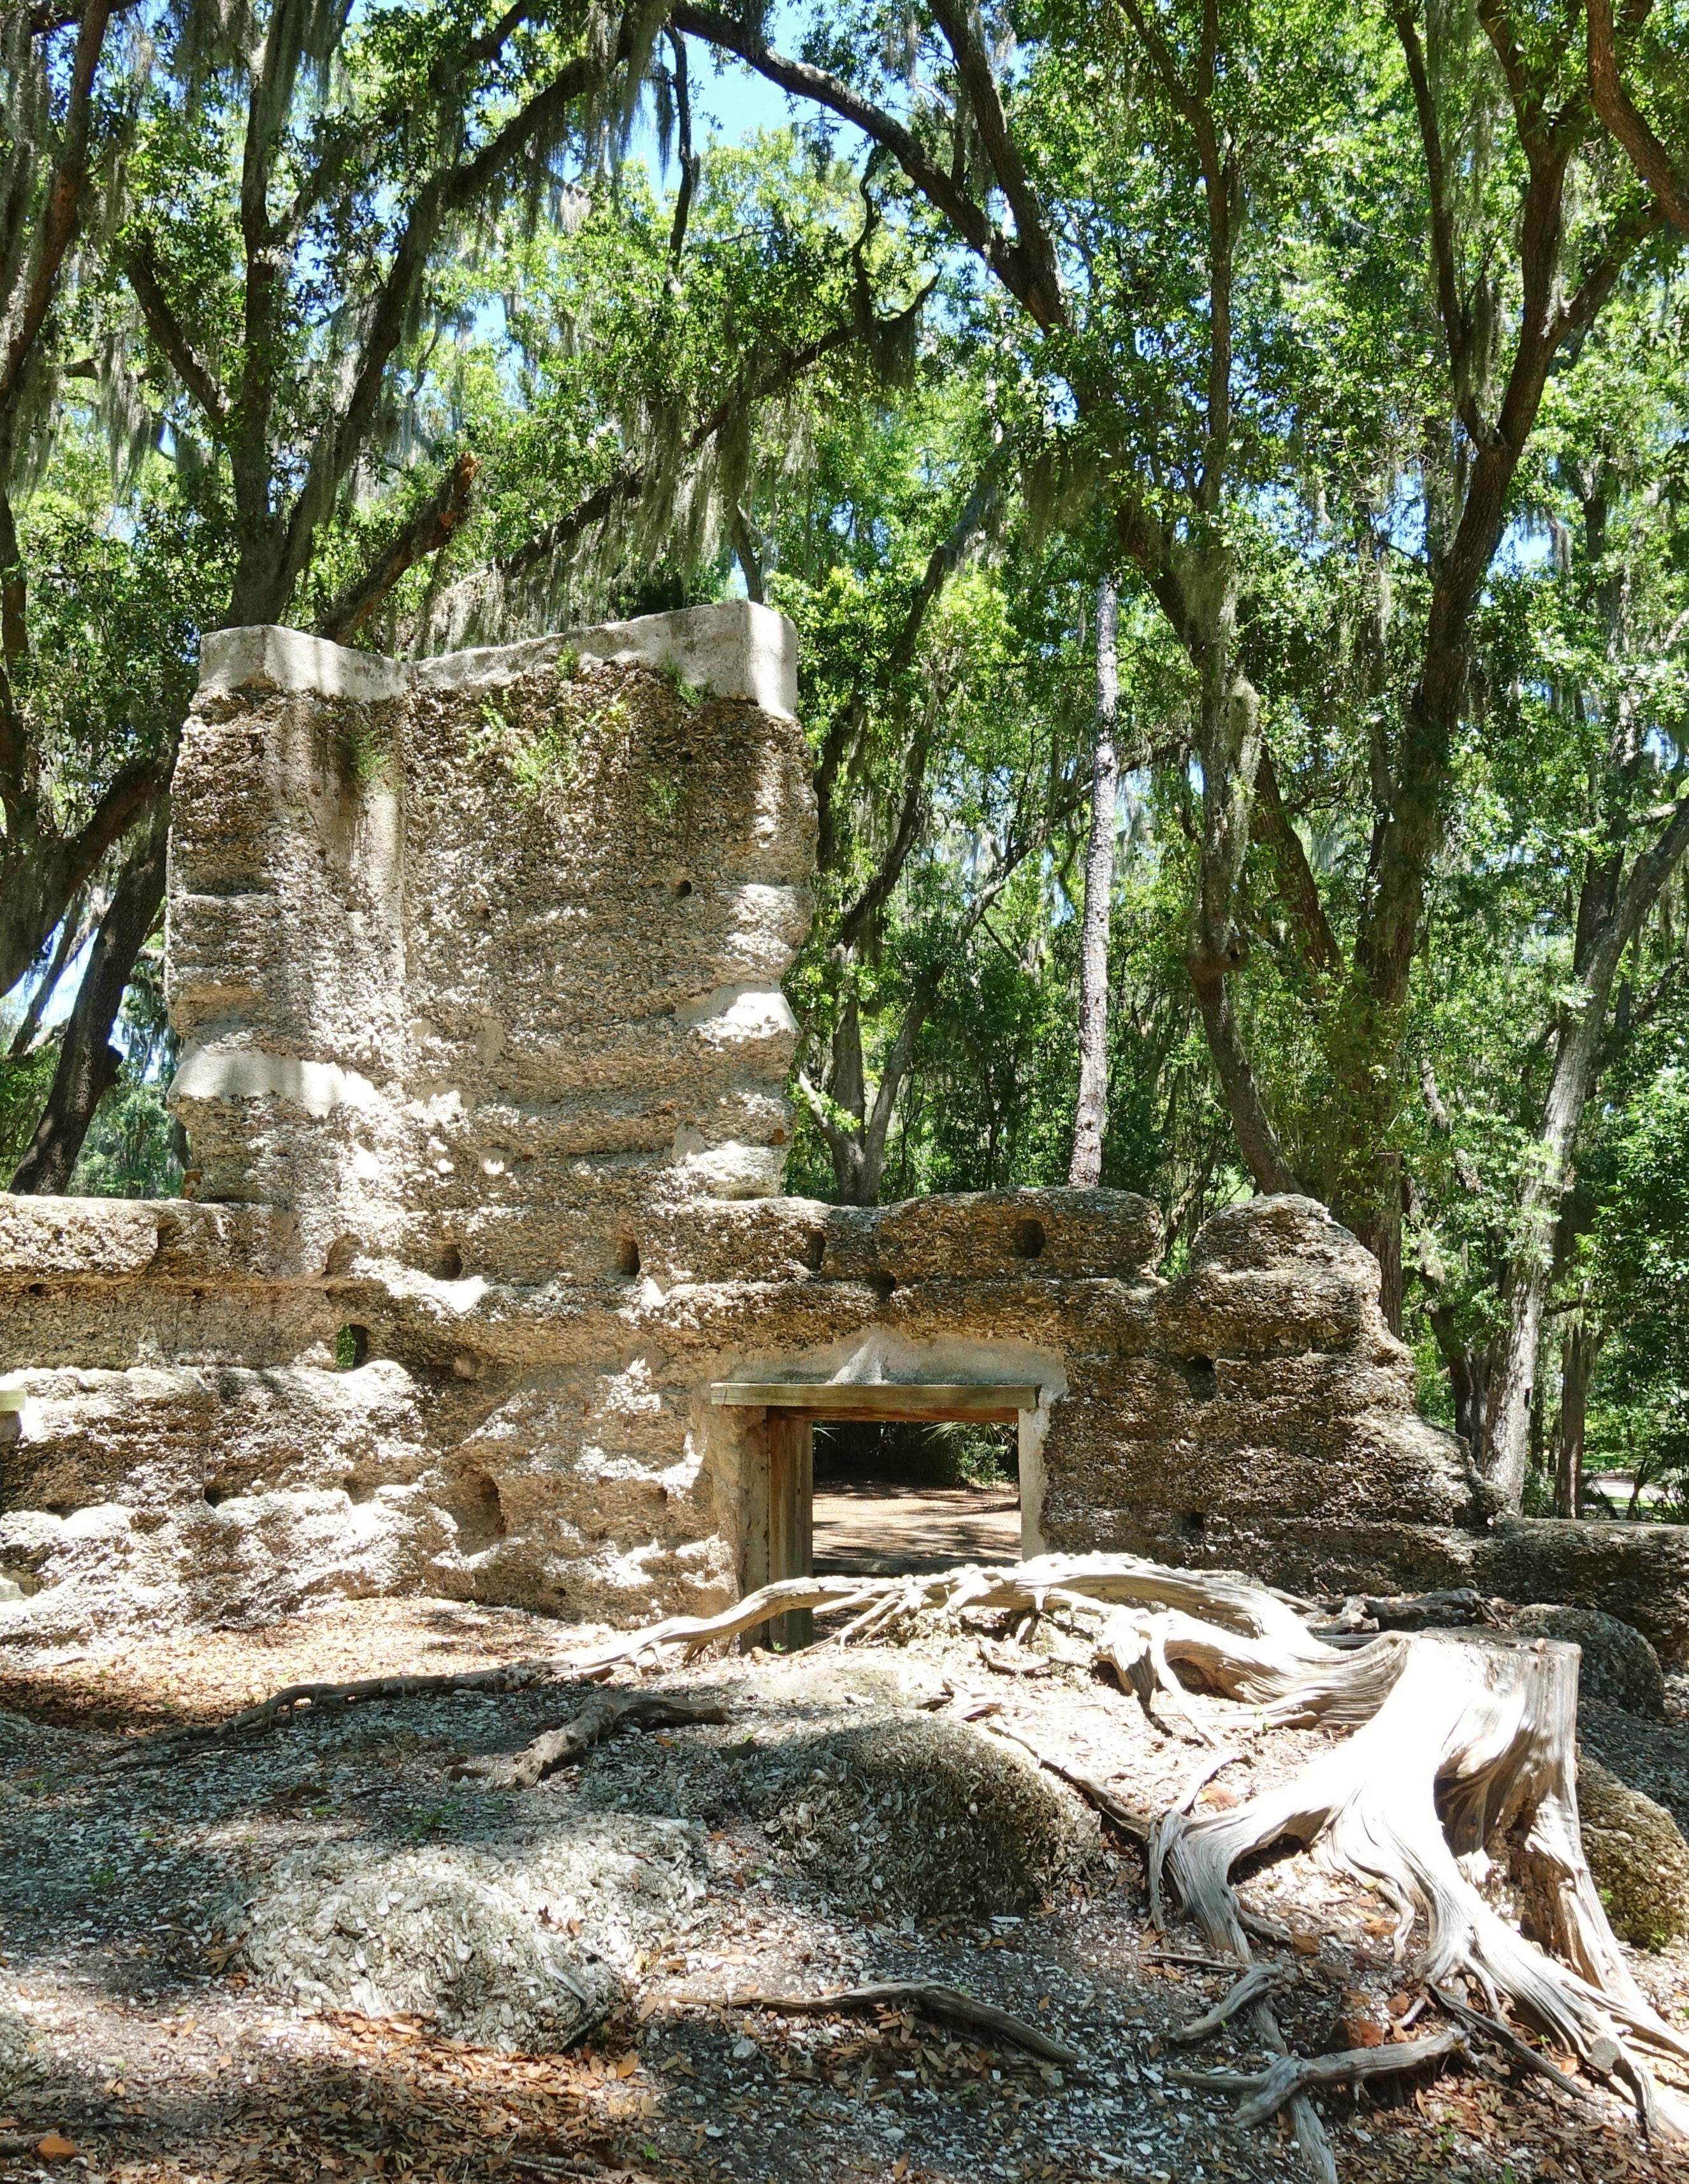
»Cultural and historical assets are critical to the Island’s unique story but are under increasing threat from development pressure and a general decrease in native population.
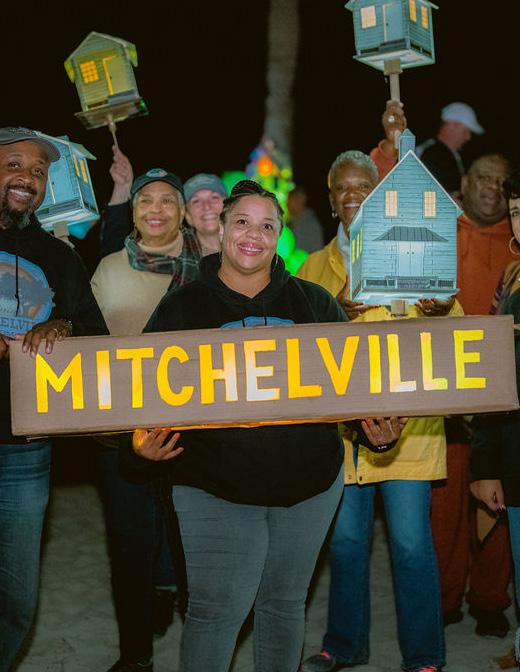
• The Town has several initiatives to preserve Gullah culture, including the Gullah-Geechee Land and Cultural Preservation Task Force, the Gullah Geechee Historic Neighborhoods Community Development Corporation, and other initiatives.
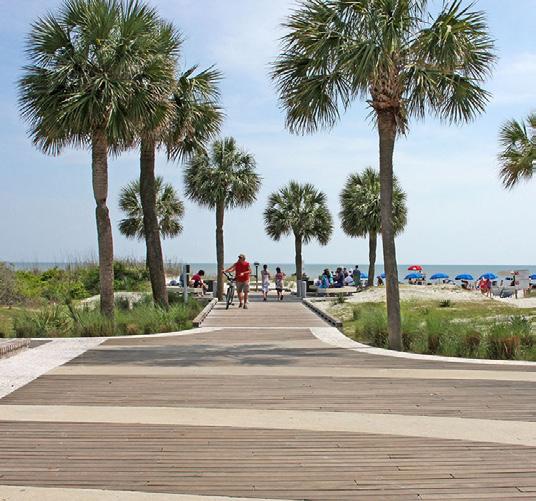
MILES OF PUBLIC PATHWAY
72
The Town's pathway network is extensive and one of the most comprehensive in the nation
Systems
Water infrastructure, roadway and pathway network, healthcare, service provision
Read more on p. 82
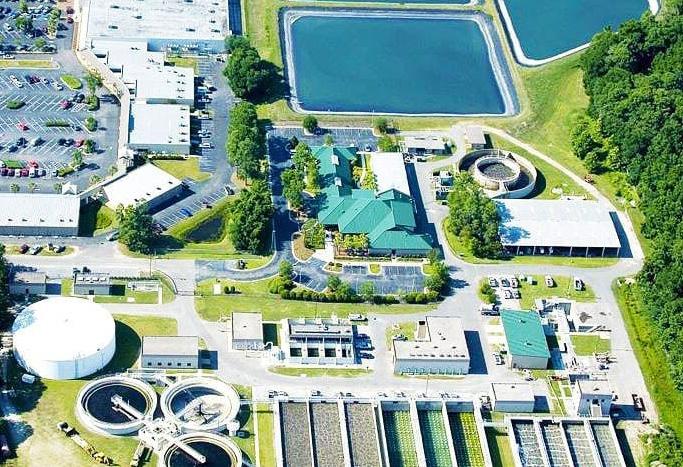
PEAK DAILY USAGE OF WATER (GALLONS) 26m
Total gallons of water sourced from point sources (wells, bulk, etc.)
»Community
Engagement culture, civic infrastructure, Town planning processes, communication networks
Read more on p. 72
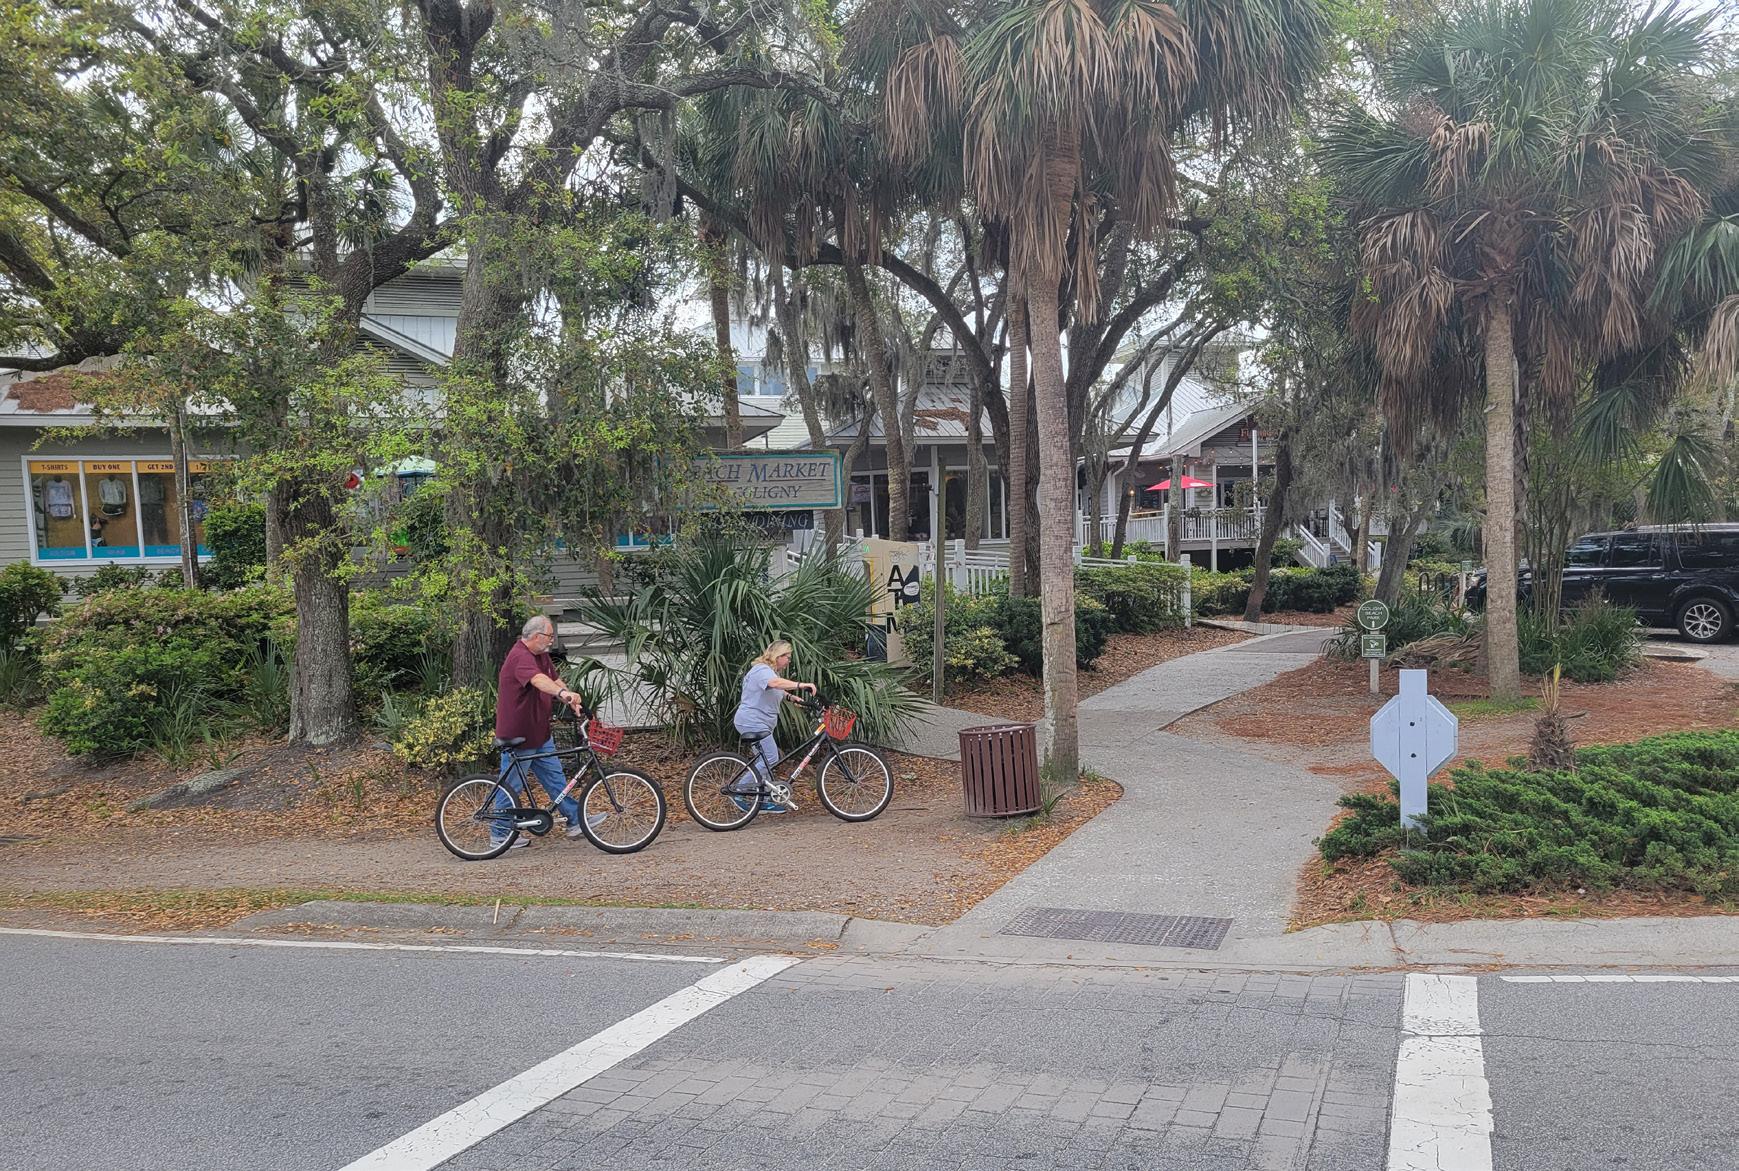
The pathways network is a key amenity but is also ready for its next round of investment and upgrades to improve safety and access.
• Rental bikes are affordable and widely accessible. Over 30 rental shops within the Town provide nearly 15,000 bikes for rent. Rental users, however, are less-likely to regularly bike at home.
• The Town’s pathways provide critical multi-modal connections to neighborhoods and destinations while contributing to the creation of Complete Streets throughout the Island.
• In 2022, the Town initiated the Corridors Plan to serve as a guide for future pathways projects establish base references for issues to do with vehicular, bicycle, and pedestrian traffic.
»The explosive growth on the mainland is putting pressure on below-ground water resources supplied by the Floridian Aquifer.
• The Hilton Head PSD has lost 11 drinking water wells to saltwater intrusion into the Upper Floridan freshwater aquifer from 2000 to 2023. As a response, the Island’s Public Service Districts are exploring new methods to secure point sources including very deep wells into the Cretaceous aquifer.
• Intrusion can have serious consequences for communities that rely on the aquifer for their water supply, as the increased salinity can make the water unusable for drinking, irrigation, and other purposes.
»Transit can play an important role in addressing multiple community issues like labor, housing cost, and congestion.
• A regional issue in scope, the Town has a large stake in expanding the frequency and coverage of the existing system to better connect workers with jobs.
• Access to public transportation is proven to be a leading driver of increasing economic mobility for under-served communities.
• Palmetto Breeze’s “Ride Free - New Job Pass” provides a free, 7-day transit pass for any rider starting a new job. Initiatives such as these are centered around utilizing public transportation as a catalyst for lowering poverty rates, driving down housing costs, and increasing workforce mobility.
• A transit development plan prepared for the Lowcountry Council of Governments in 2018 identified higher areas of need along and northwest of Beach City Road (including Hilton Head Hospital) and the south end of the Island extending southwest of Pope Avenue.
UNDEVELOPED LAND ON THE ISLAND (ACRES)
1,500
Out of the total 21,862 acres of land above mean high tide. 28% of undeveloped property is Town-Owned
Land Use
Development trends and patterns, constraints, and tools
Read more on p. 92
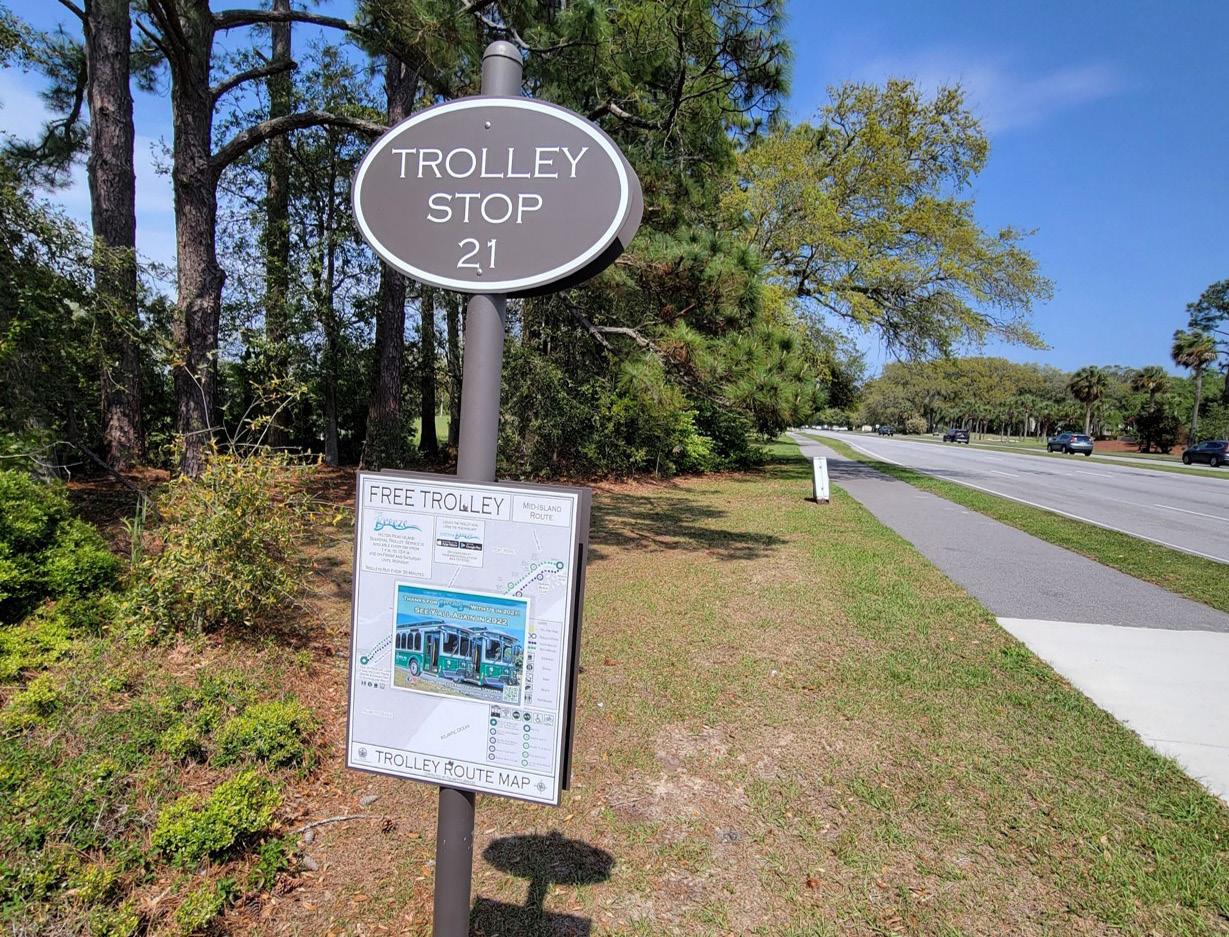
THE BREEZE TROLLEY STOPS
The Breeze Trolley currently serves 21 stops around the Island, with opportunities for expansion toward the airport
»The decreasing developable acreage and increasing community scrutiny is driving up the cost of projects at all scales.
• With fewer large lots available, major subdivision projects (greater than 5 acres) are increasingly rare.
• Infill projects - development within existing subdivisions or smaller lots - and major redevelopment proposals are occurring more regularly.
• This will continue to increase the value and susceptibility for change of the Town’s older commercial properties.
TOPIC A
DEMOGRAPHICS
Demographics is an assessment of the make-up of a population with respect to age, race, ethnicity, household makeup, education, tenure, and other measures. In many ways, a community’s demographics are its destiny.
KEY TRENDS
Understanding the Island as a collection of individuals, families, and neighborhoods is the critical first step to holistic and inclusive community planning; it helps define not just who the community is, but who it is becoming.
All places are changing. Even in a community like Hilton Head Island, where the population has begun to plateau, movement is continual. There are trends related to the age of residents, makeup of households, diversity of neighborhoods, and so on. These movements can play out quickly. Whatever shape the Island’s future community takes, it may have different needs or expectations compared to yesterday’s and today’s residents. It will require new investments in infrastructure and supportive services.
This section explores several key trends related to demographics and their connection to other community systems.
1
2
3
4
5
6
7
The full-time resident population of the Island is plateauing amid intense regional growth.
Households are getting smaller, older, and are less likely to include school-age children.
The number of people on the Island can vary significantly from its full-time population based on the time of day or the time of year.
The average age on the Island is getting older and the 55+ segment is driving a modest increase in population.
The Town is a relatively diverse community, but there has been a long-term decrease in the overall share of African American residents.
The Hispanic community is growing at the fastest rate of any ethnic segment, both locally and regionally.
Foreign-born residents are a growing segment and mostly from Latin America.
37,660
Total Full-Time Residents
After tremendous growth through the 1970s, '80s, and '90s, Hilton Head Island’s population began to plateau; between 2000 and 2020 it only grew by 11%. By comparison, Beaufort County’s population grew by 55%, with places like Bluffton (2,074%) in Beaufort County and Hardeeville (317% ) in Jasper County growing at a much faster rate than the Island during the same 20-year period. The broader Savannah metropolitan area also grew by 45% between 2000 and 2020, with an increase of 70,000 additional residents.
Hilton Head Island’s population dynamics are more complicated than a simple measure of full-time residents, however. The amount of people on the Island at any given moment varies greatly depending on a number of factors, including the tourist season and the number of workers who live off-Island. Such fluctuations mean that the Island’s daytime population increases by roughly one-third on average as people commute in for work.
POPULATION CHANGE SINCE 1960
1.2%
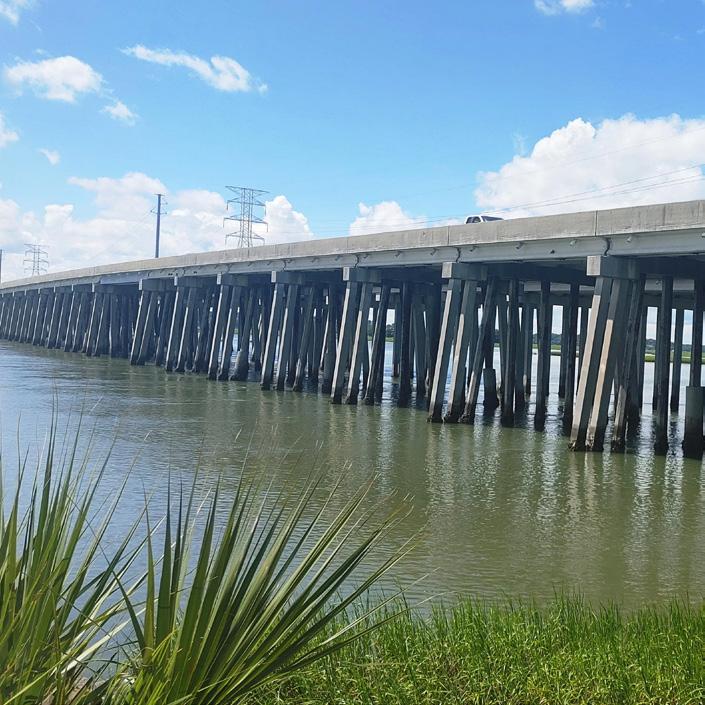
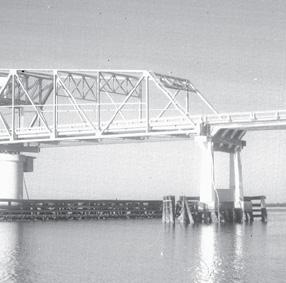
The completion of the James F. Byrnes Bridge in 1956 transformed access to the Island and facilitated massive growth, both in terms of full-time residents and seasonal tourists.
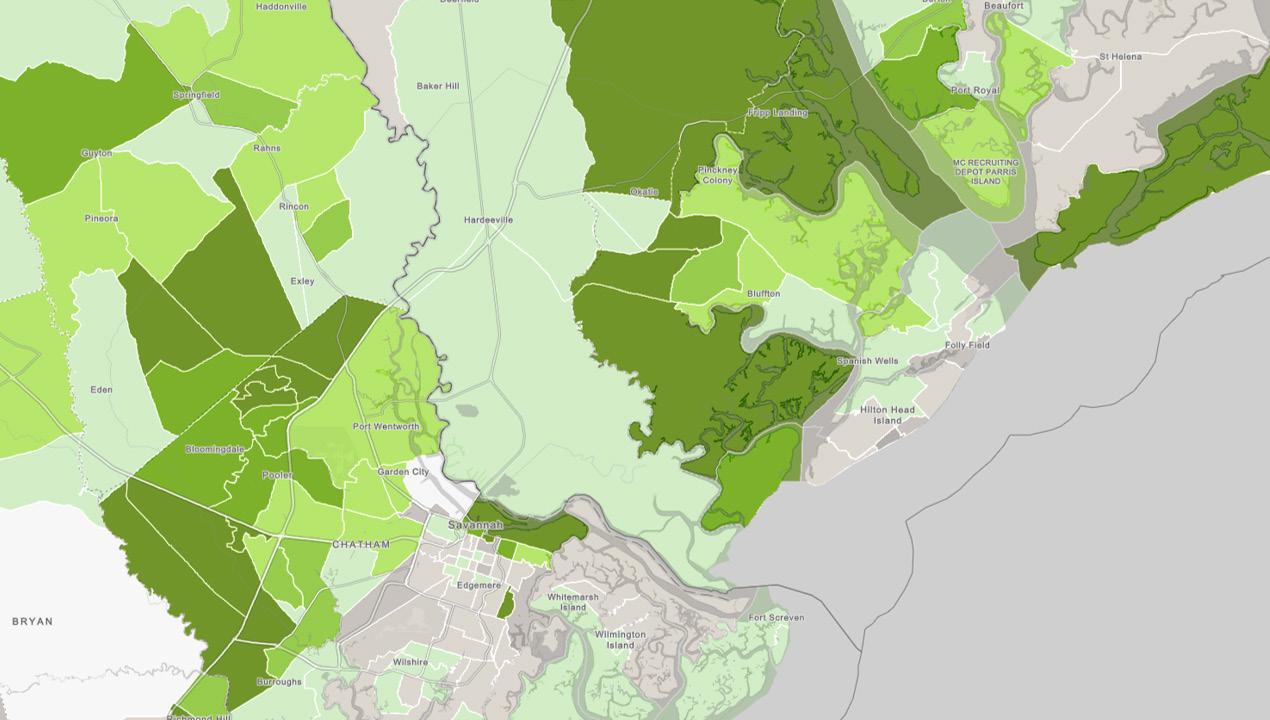
REGIONAL POPULATION CHANGE, 2000 TO 2020
Source: Esri
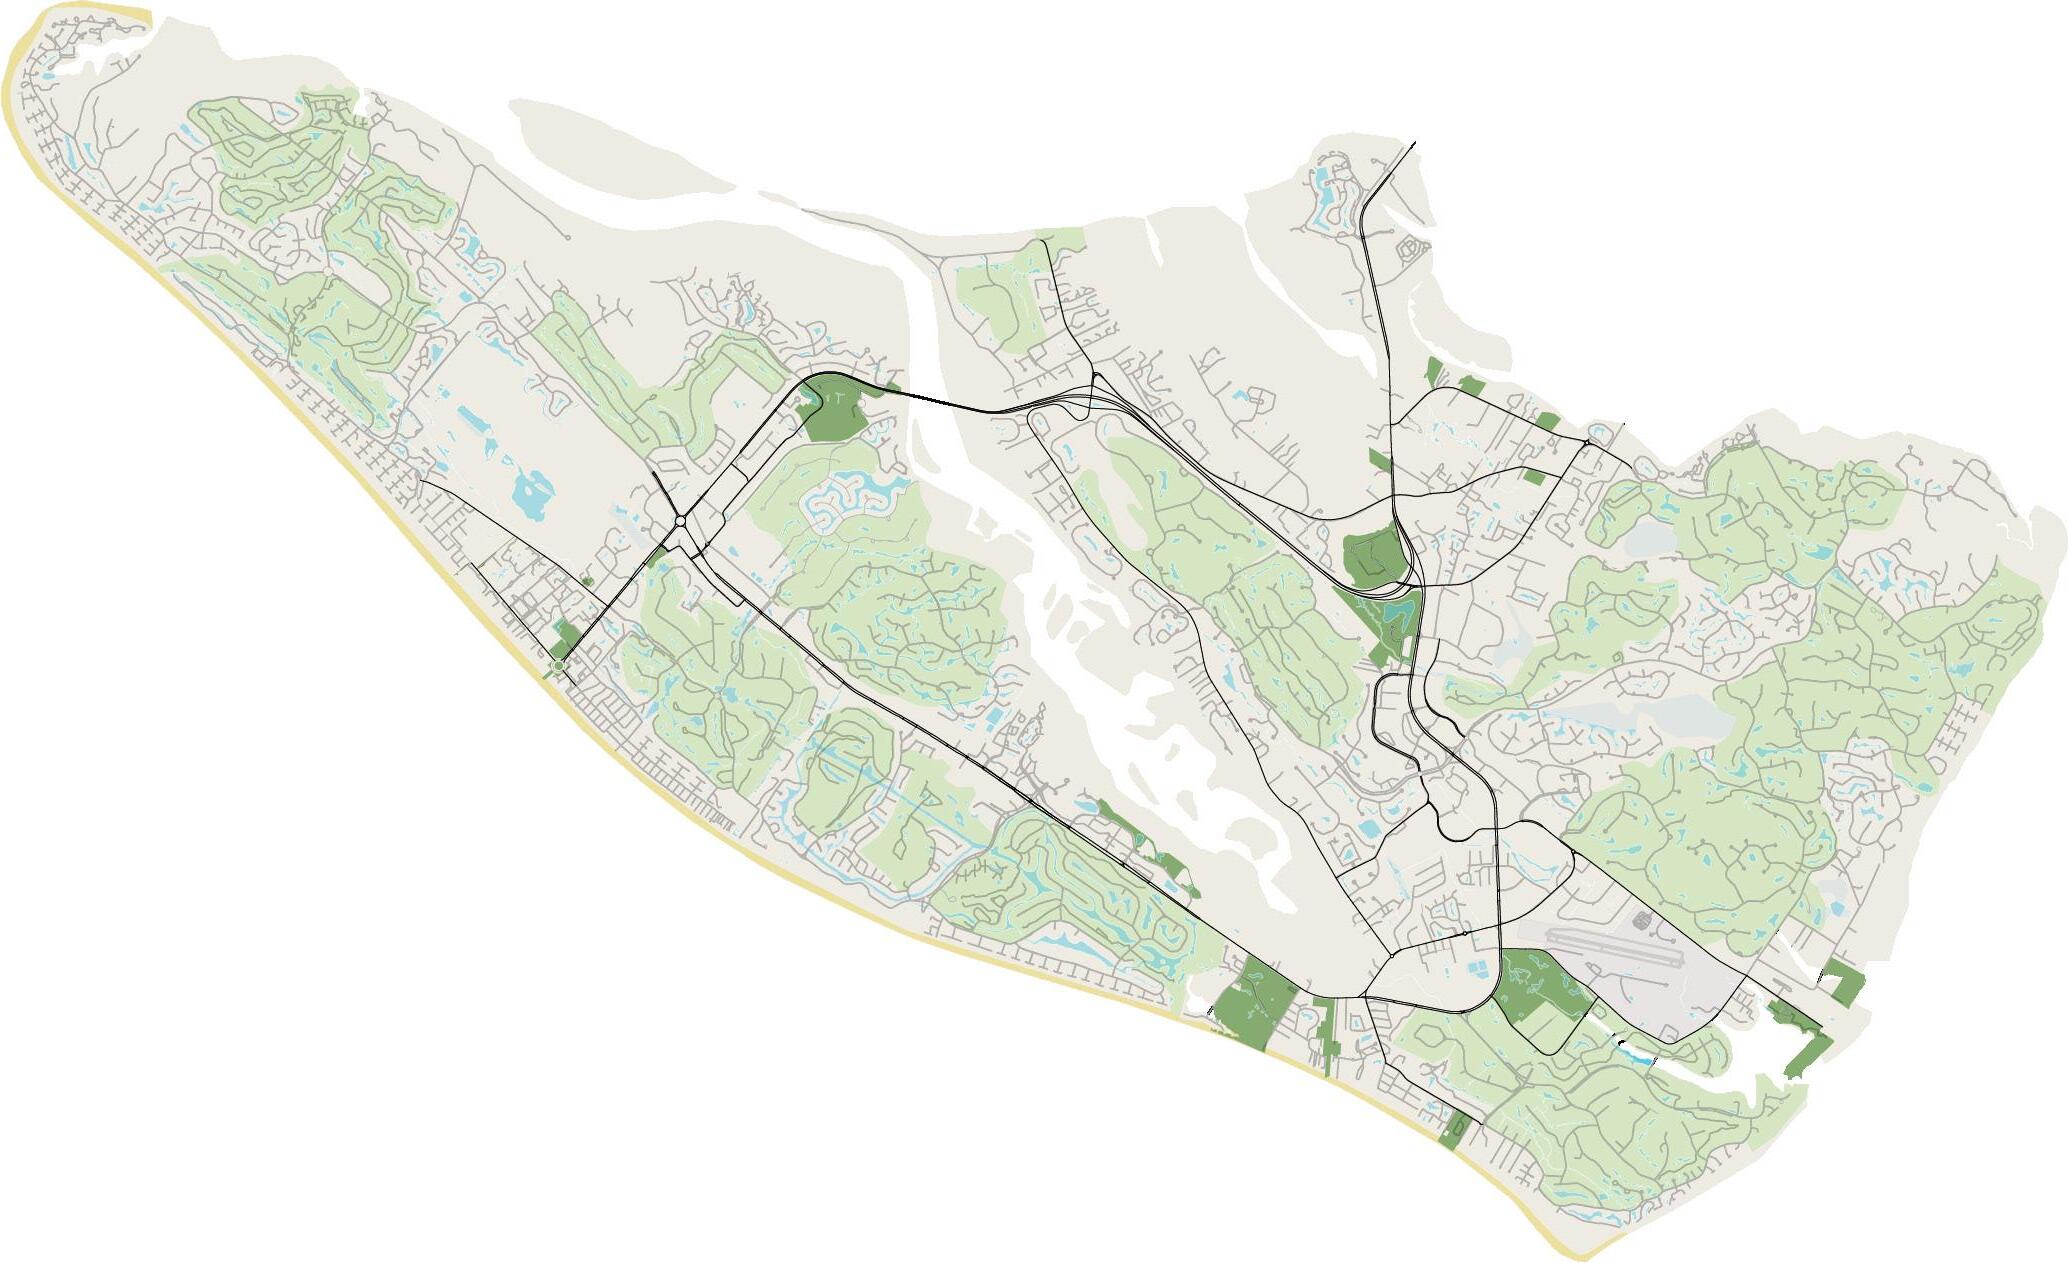
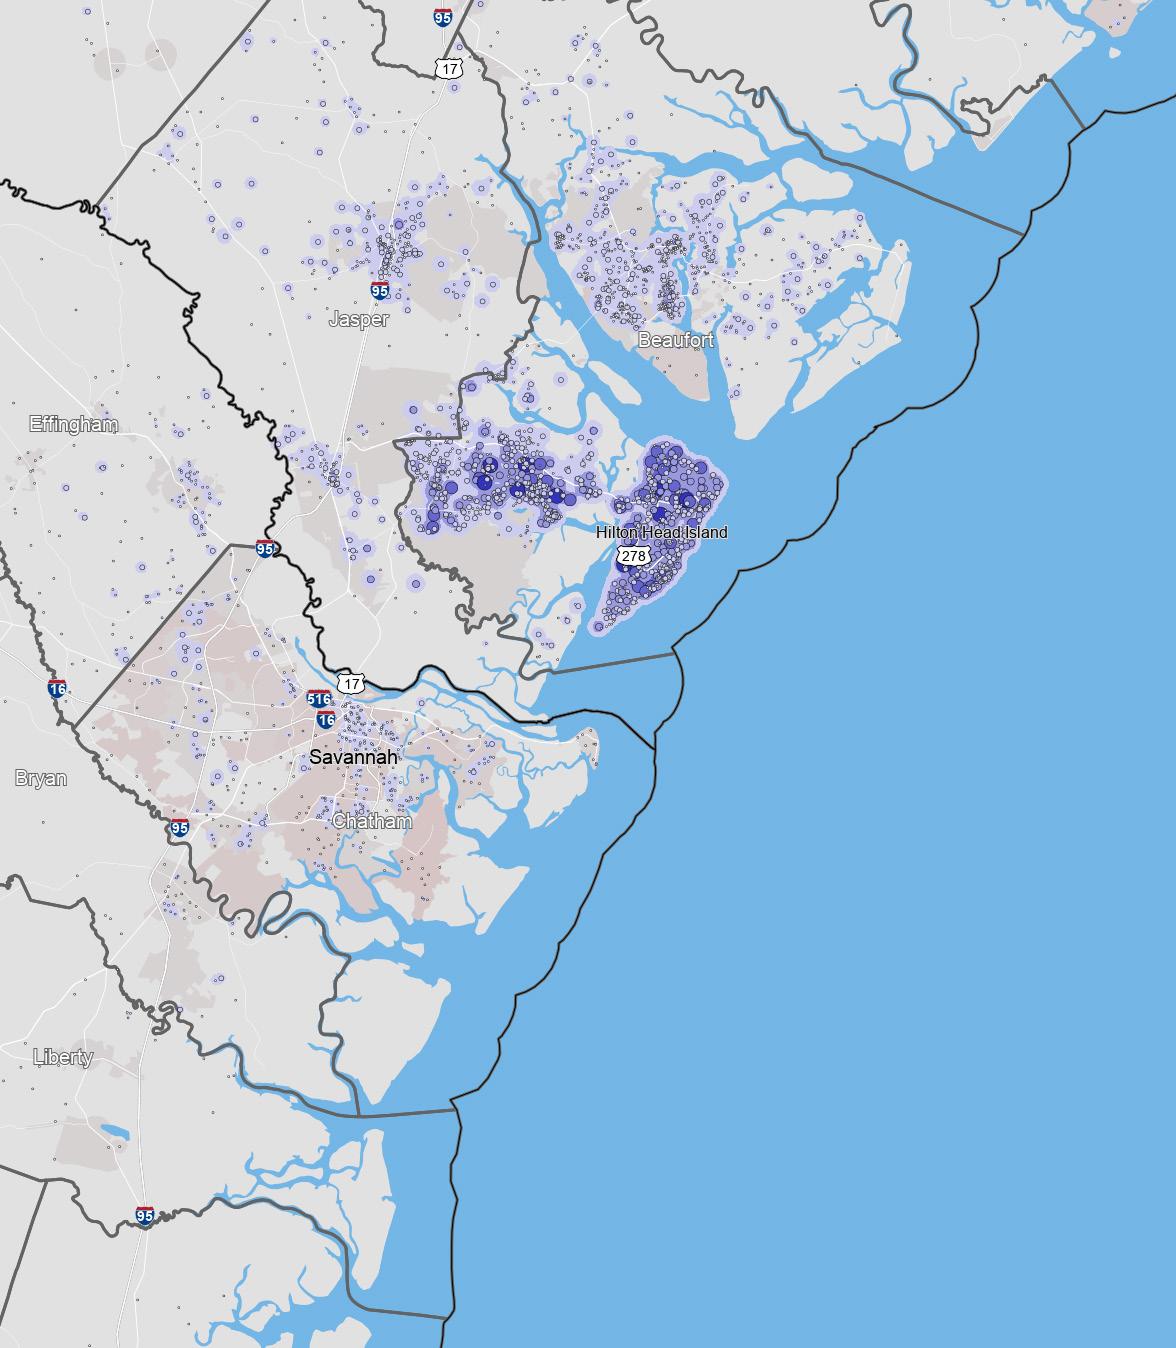
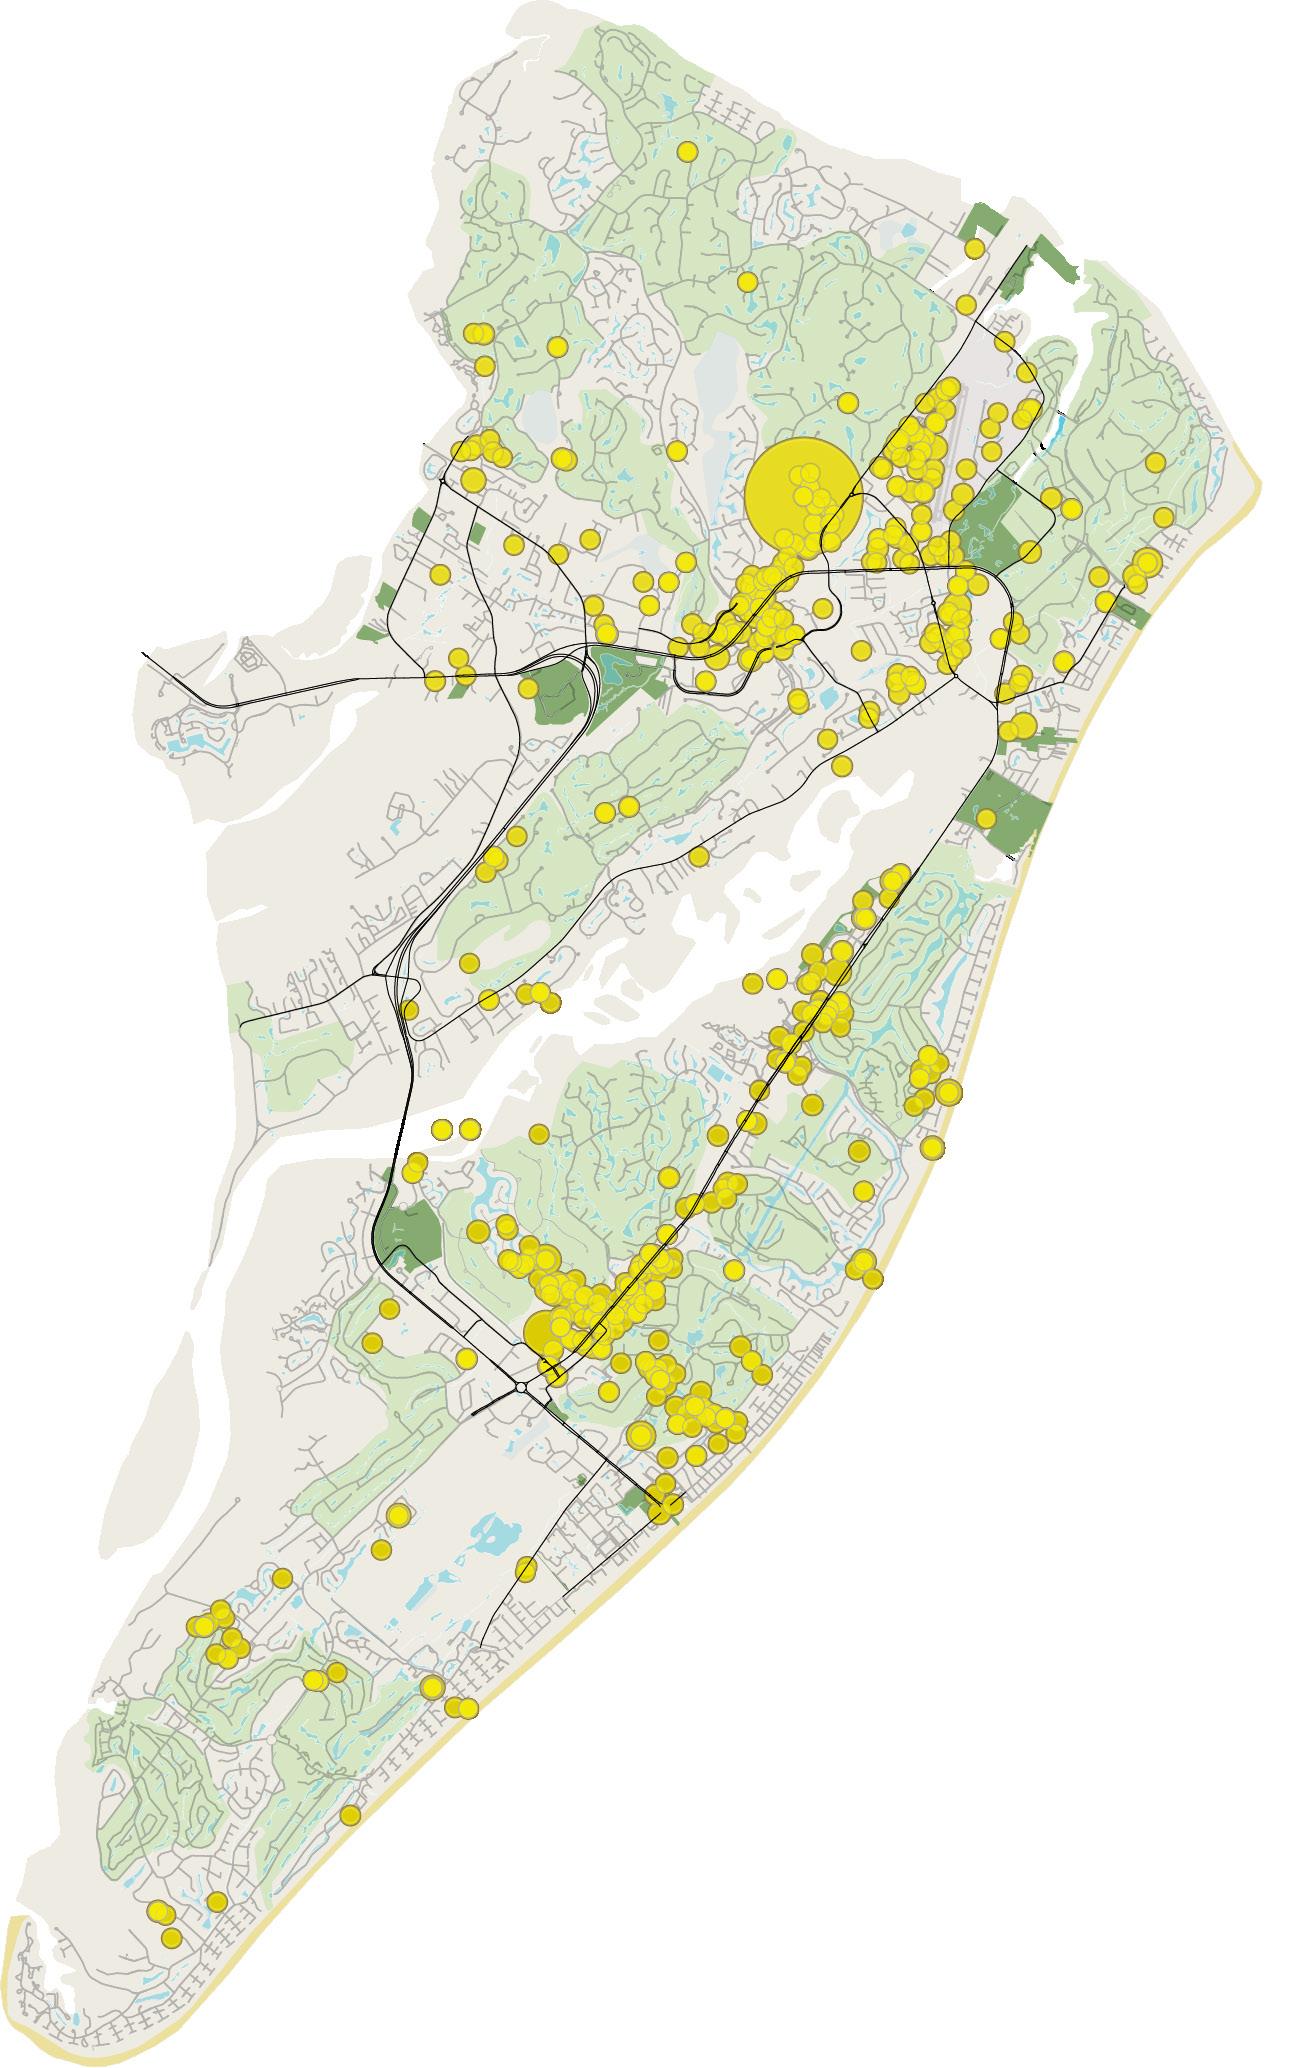
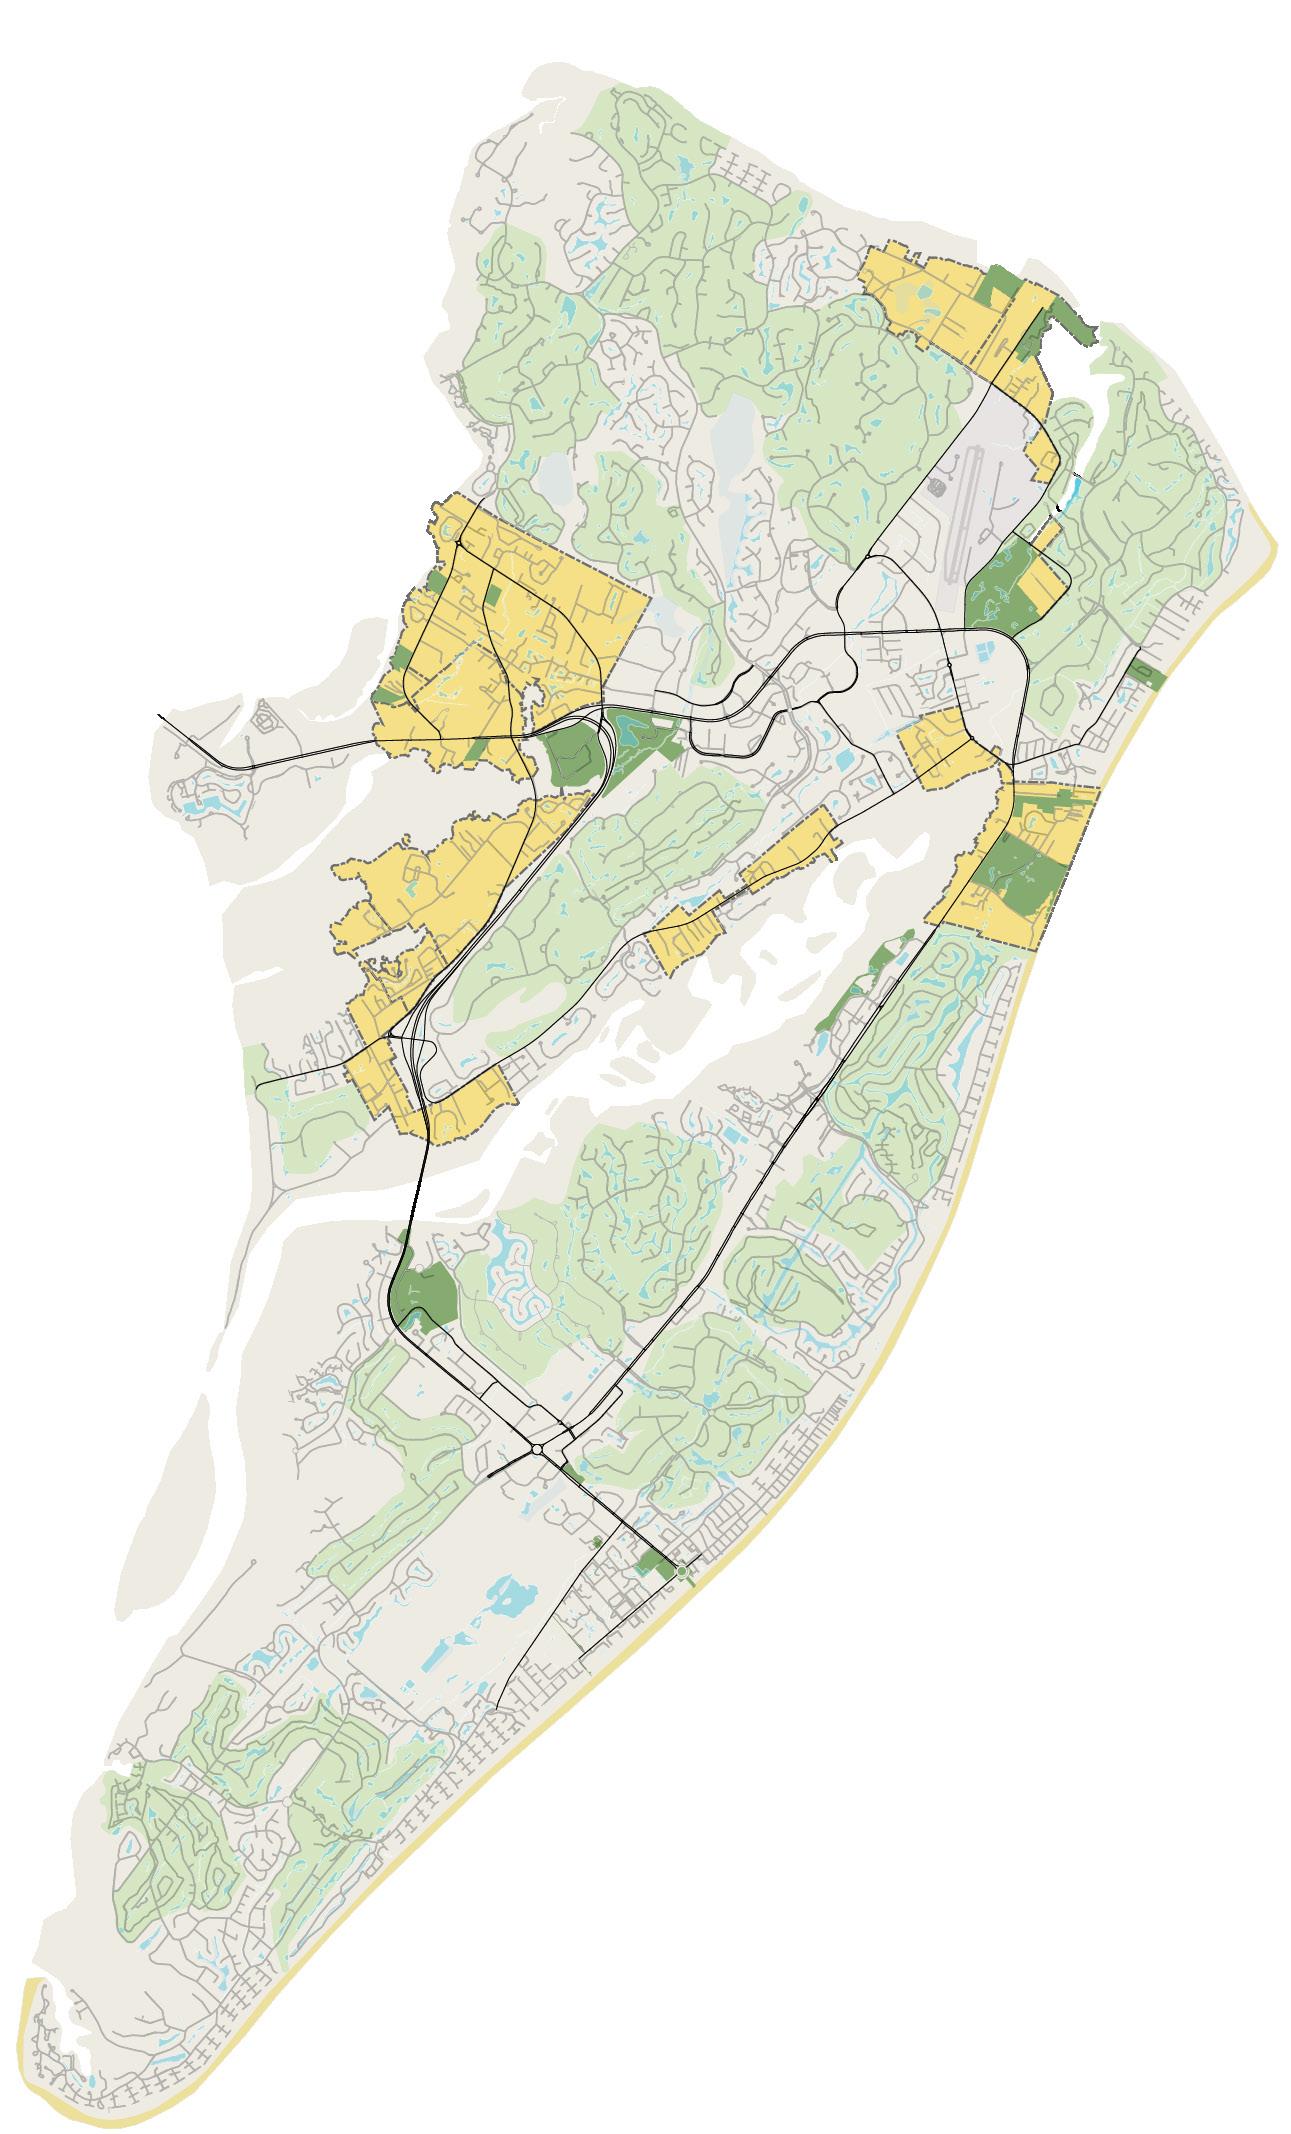
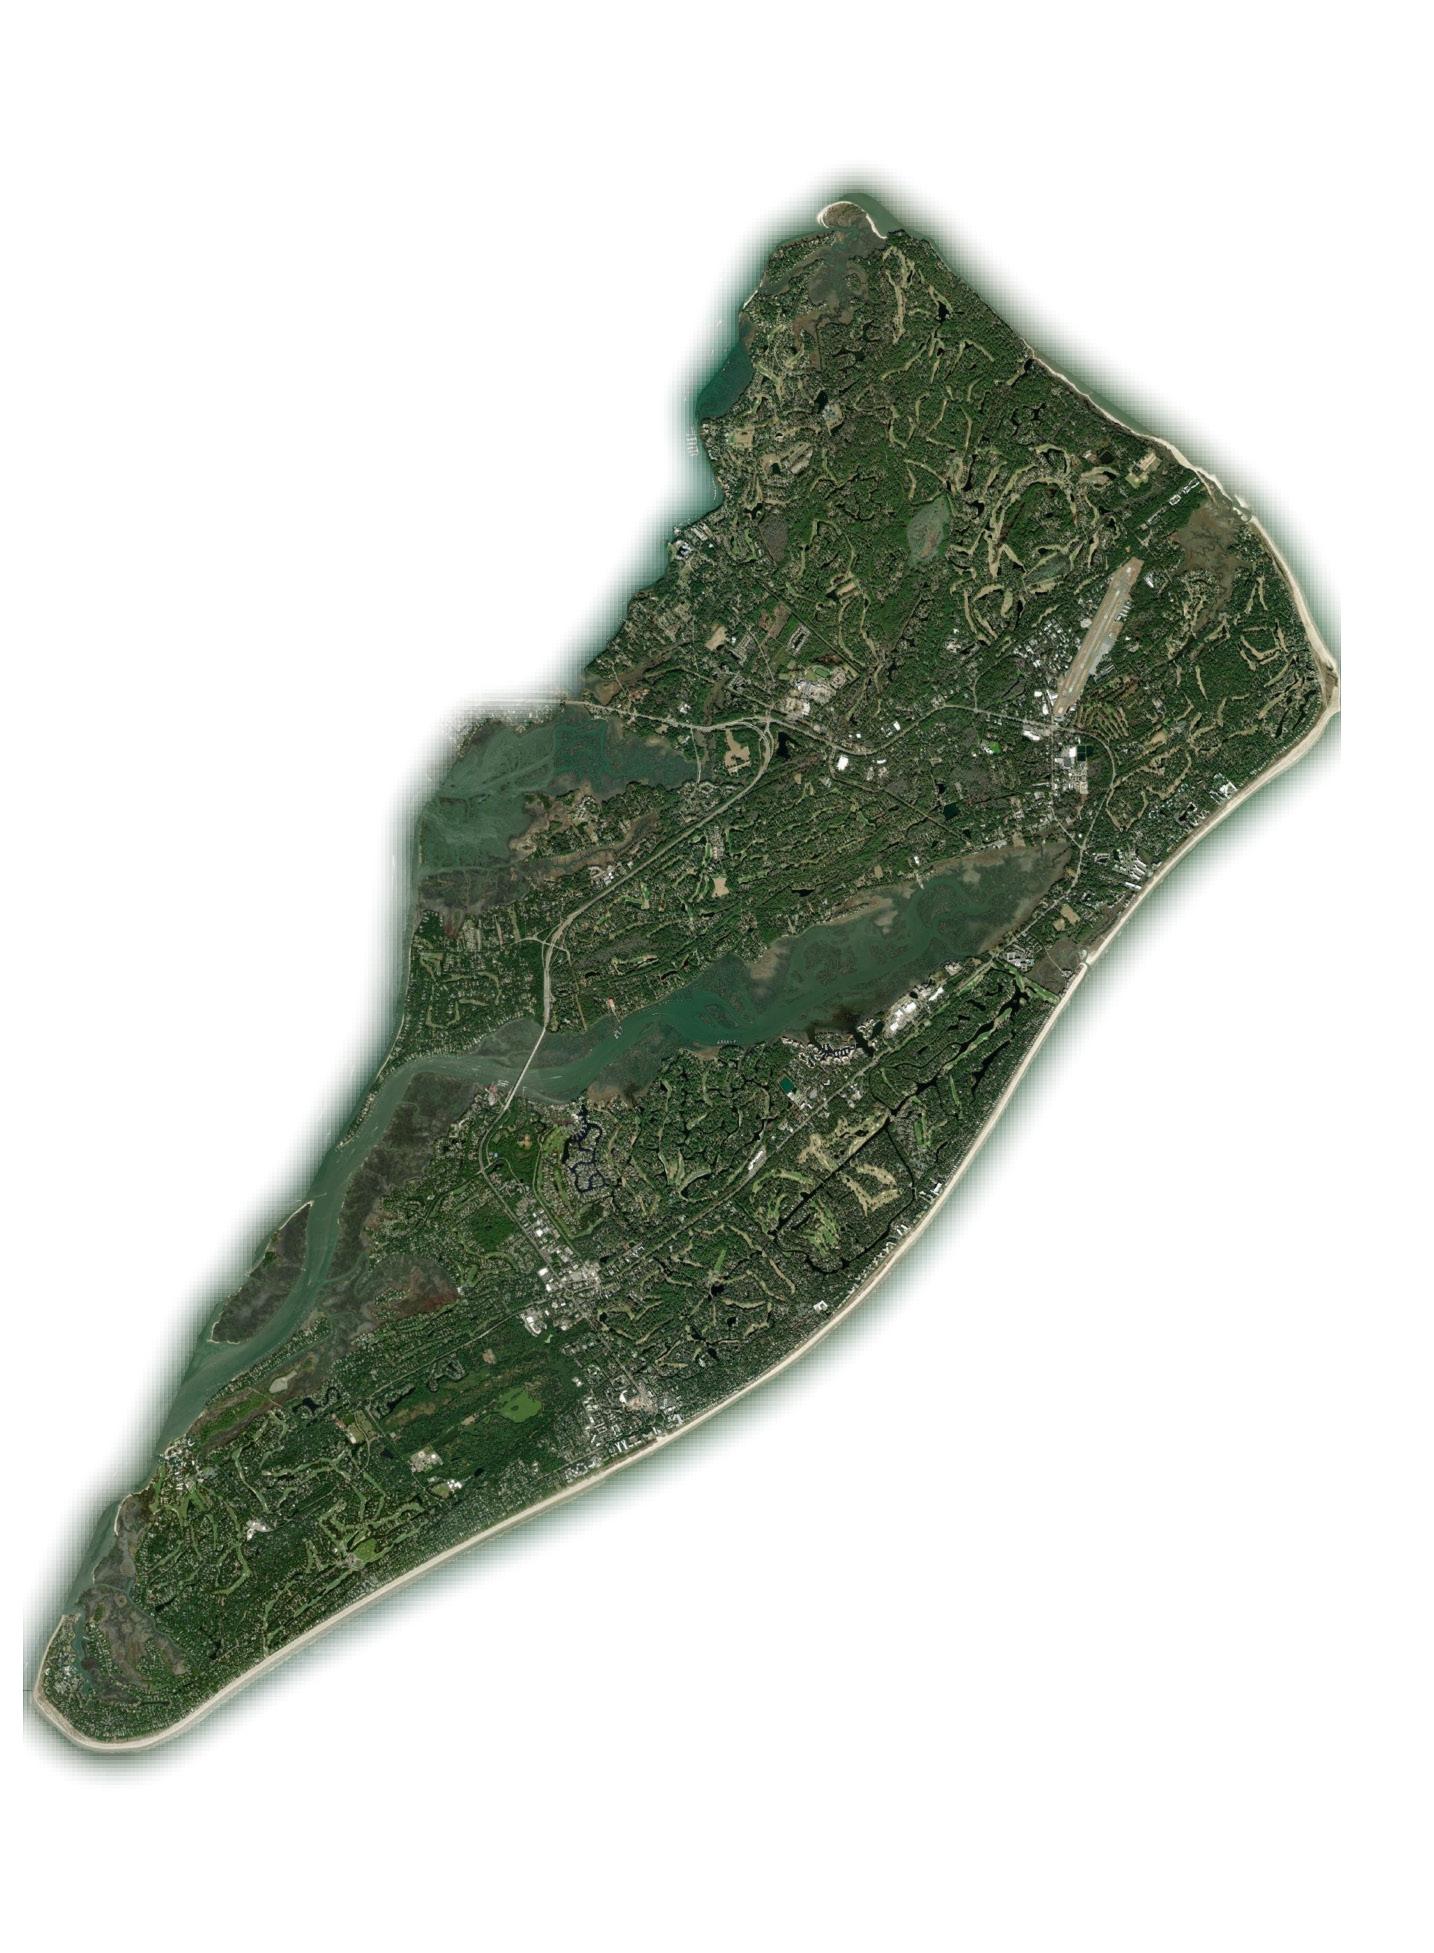
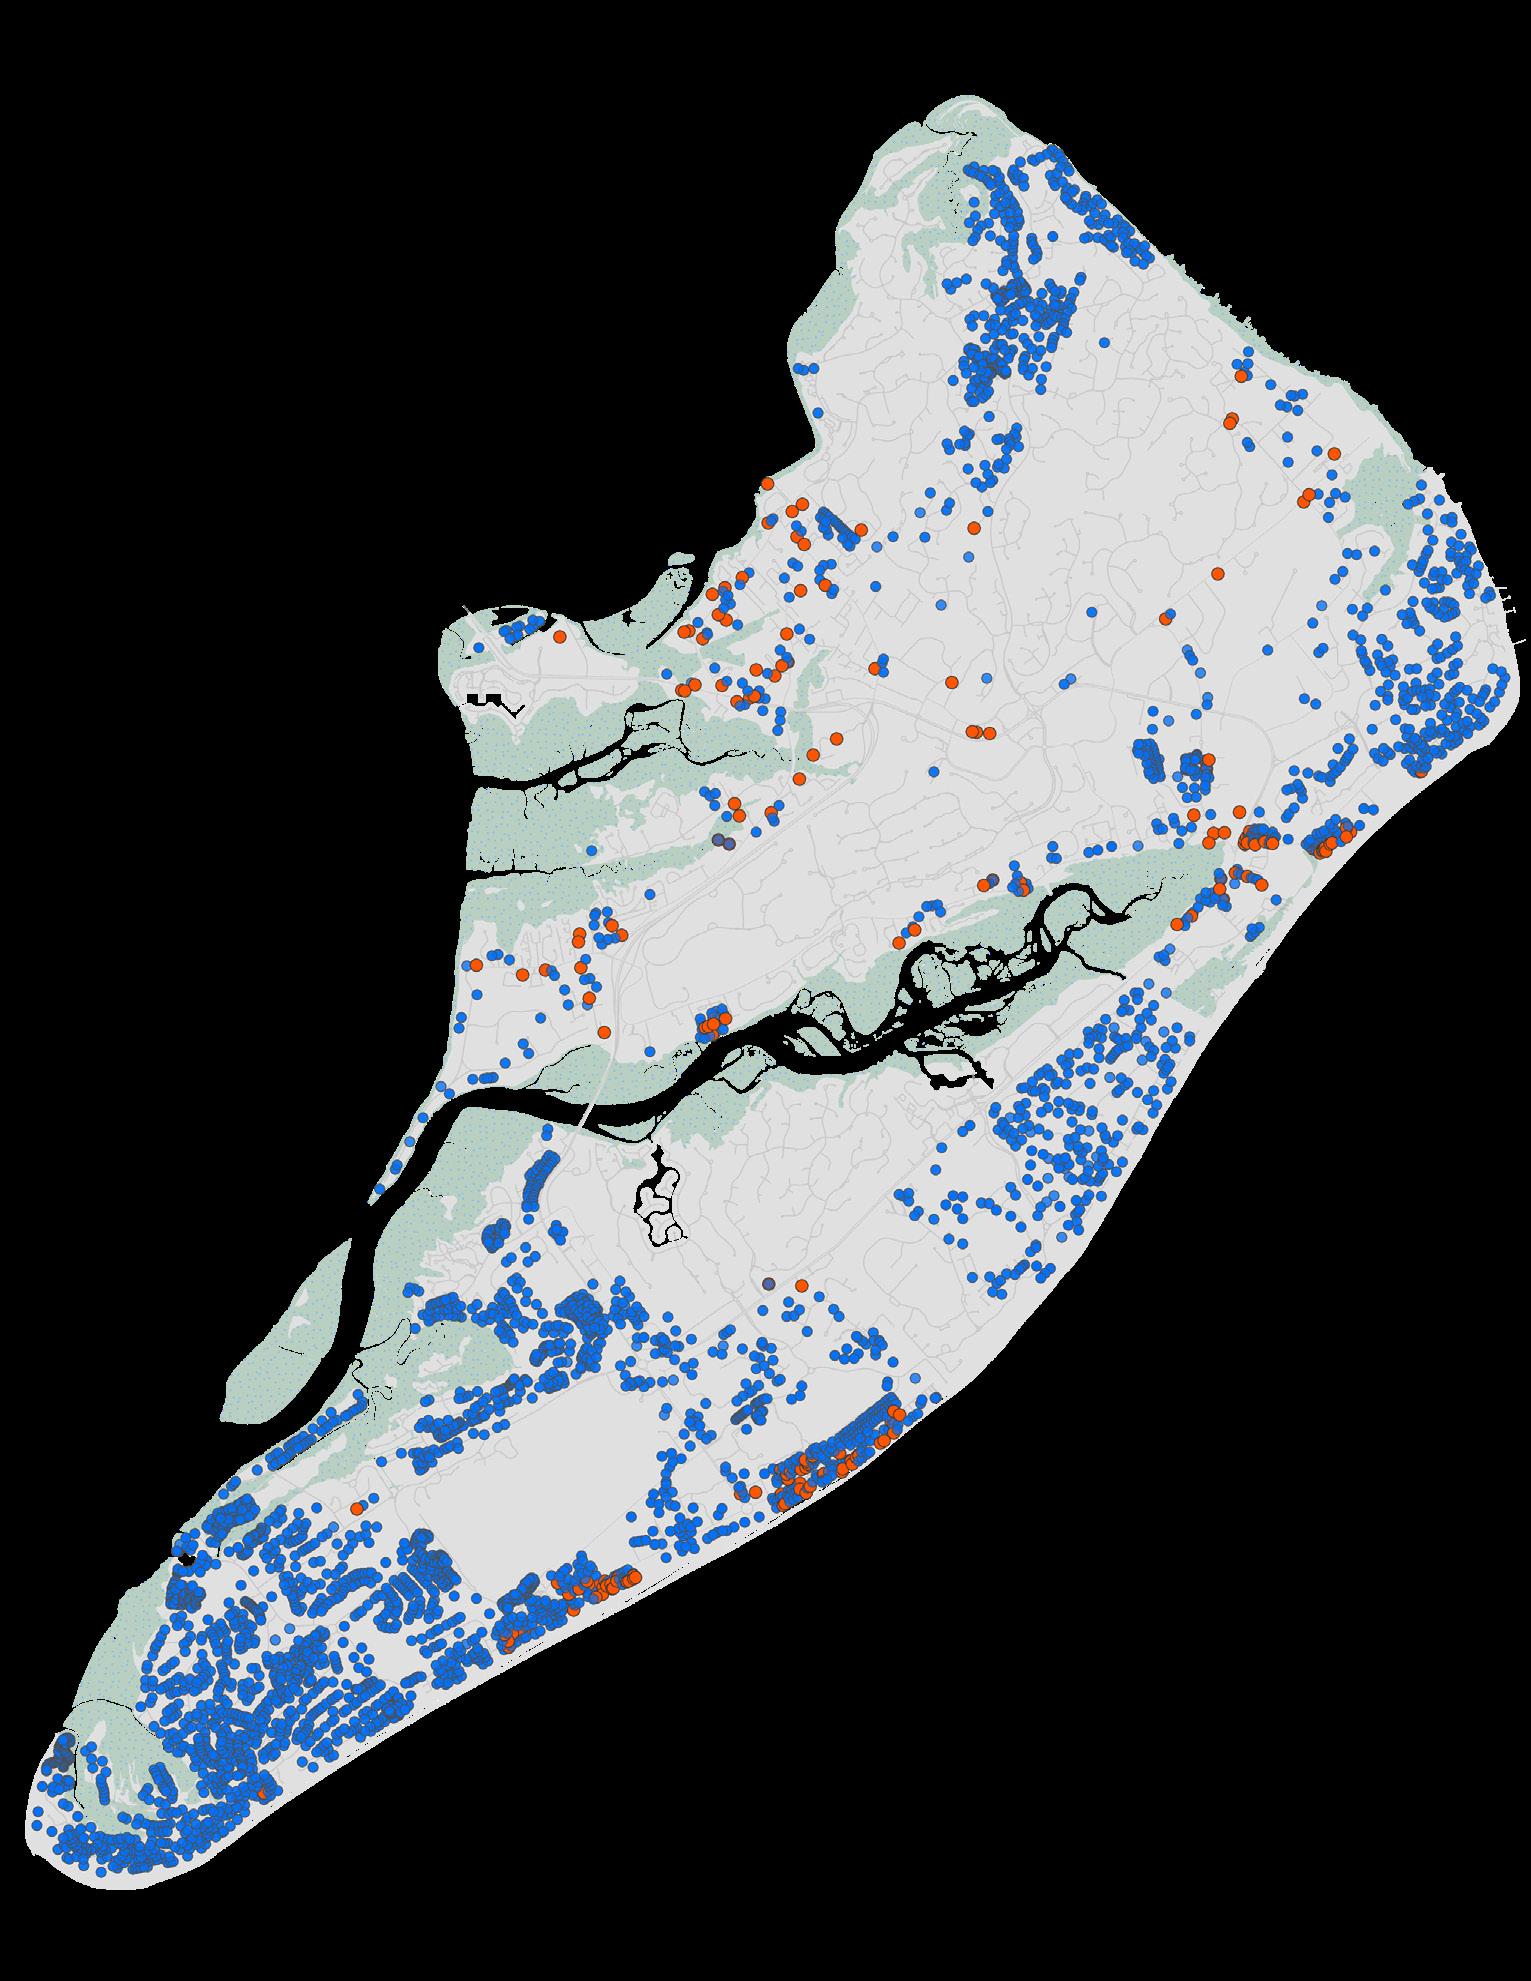
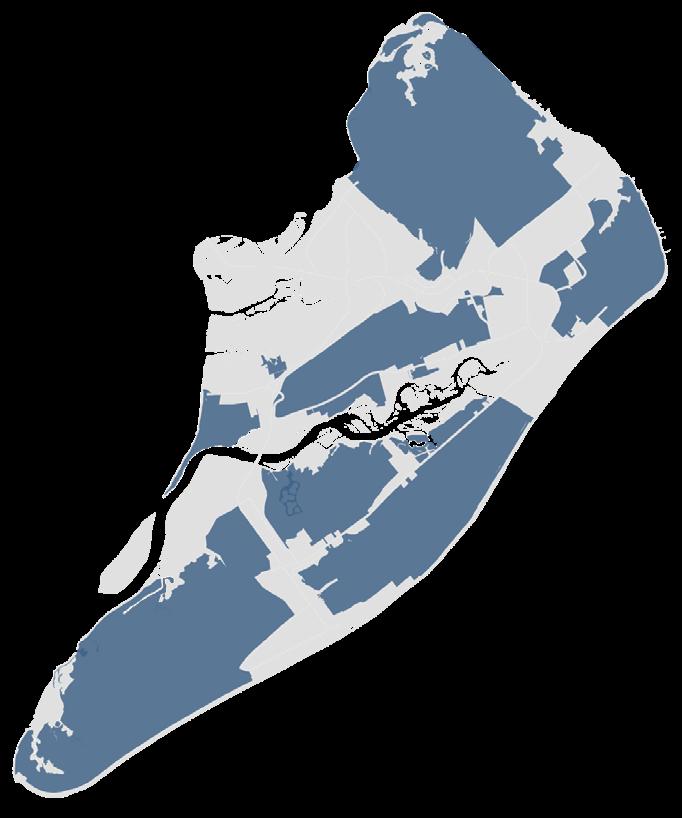
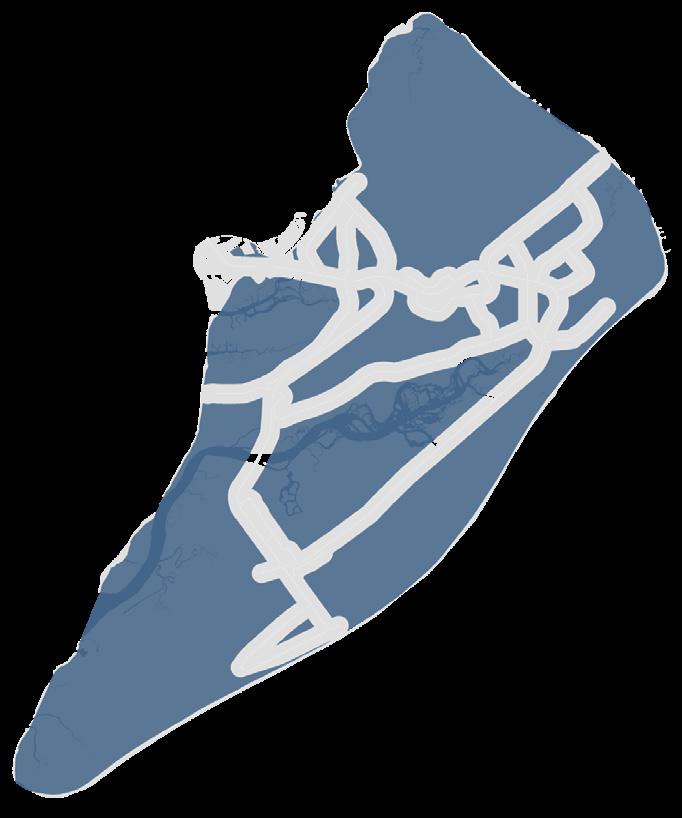
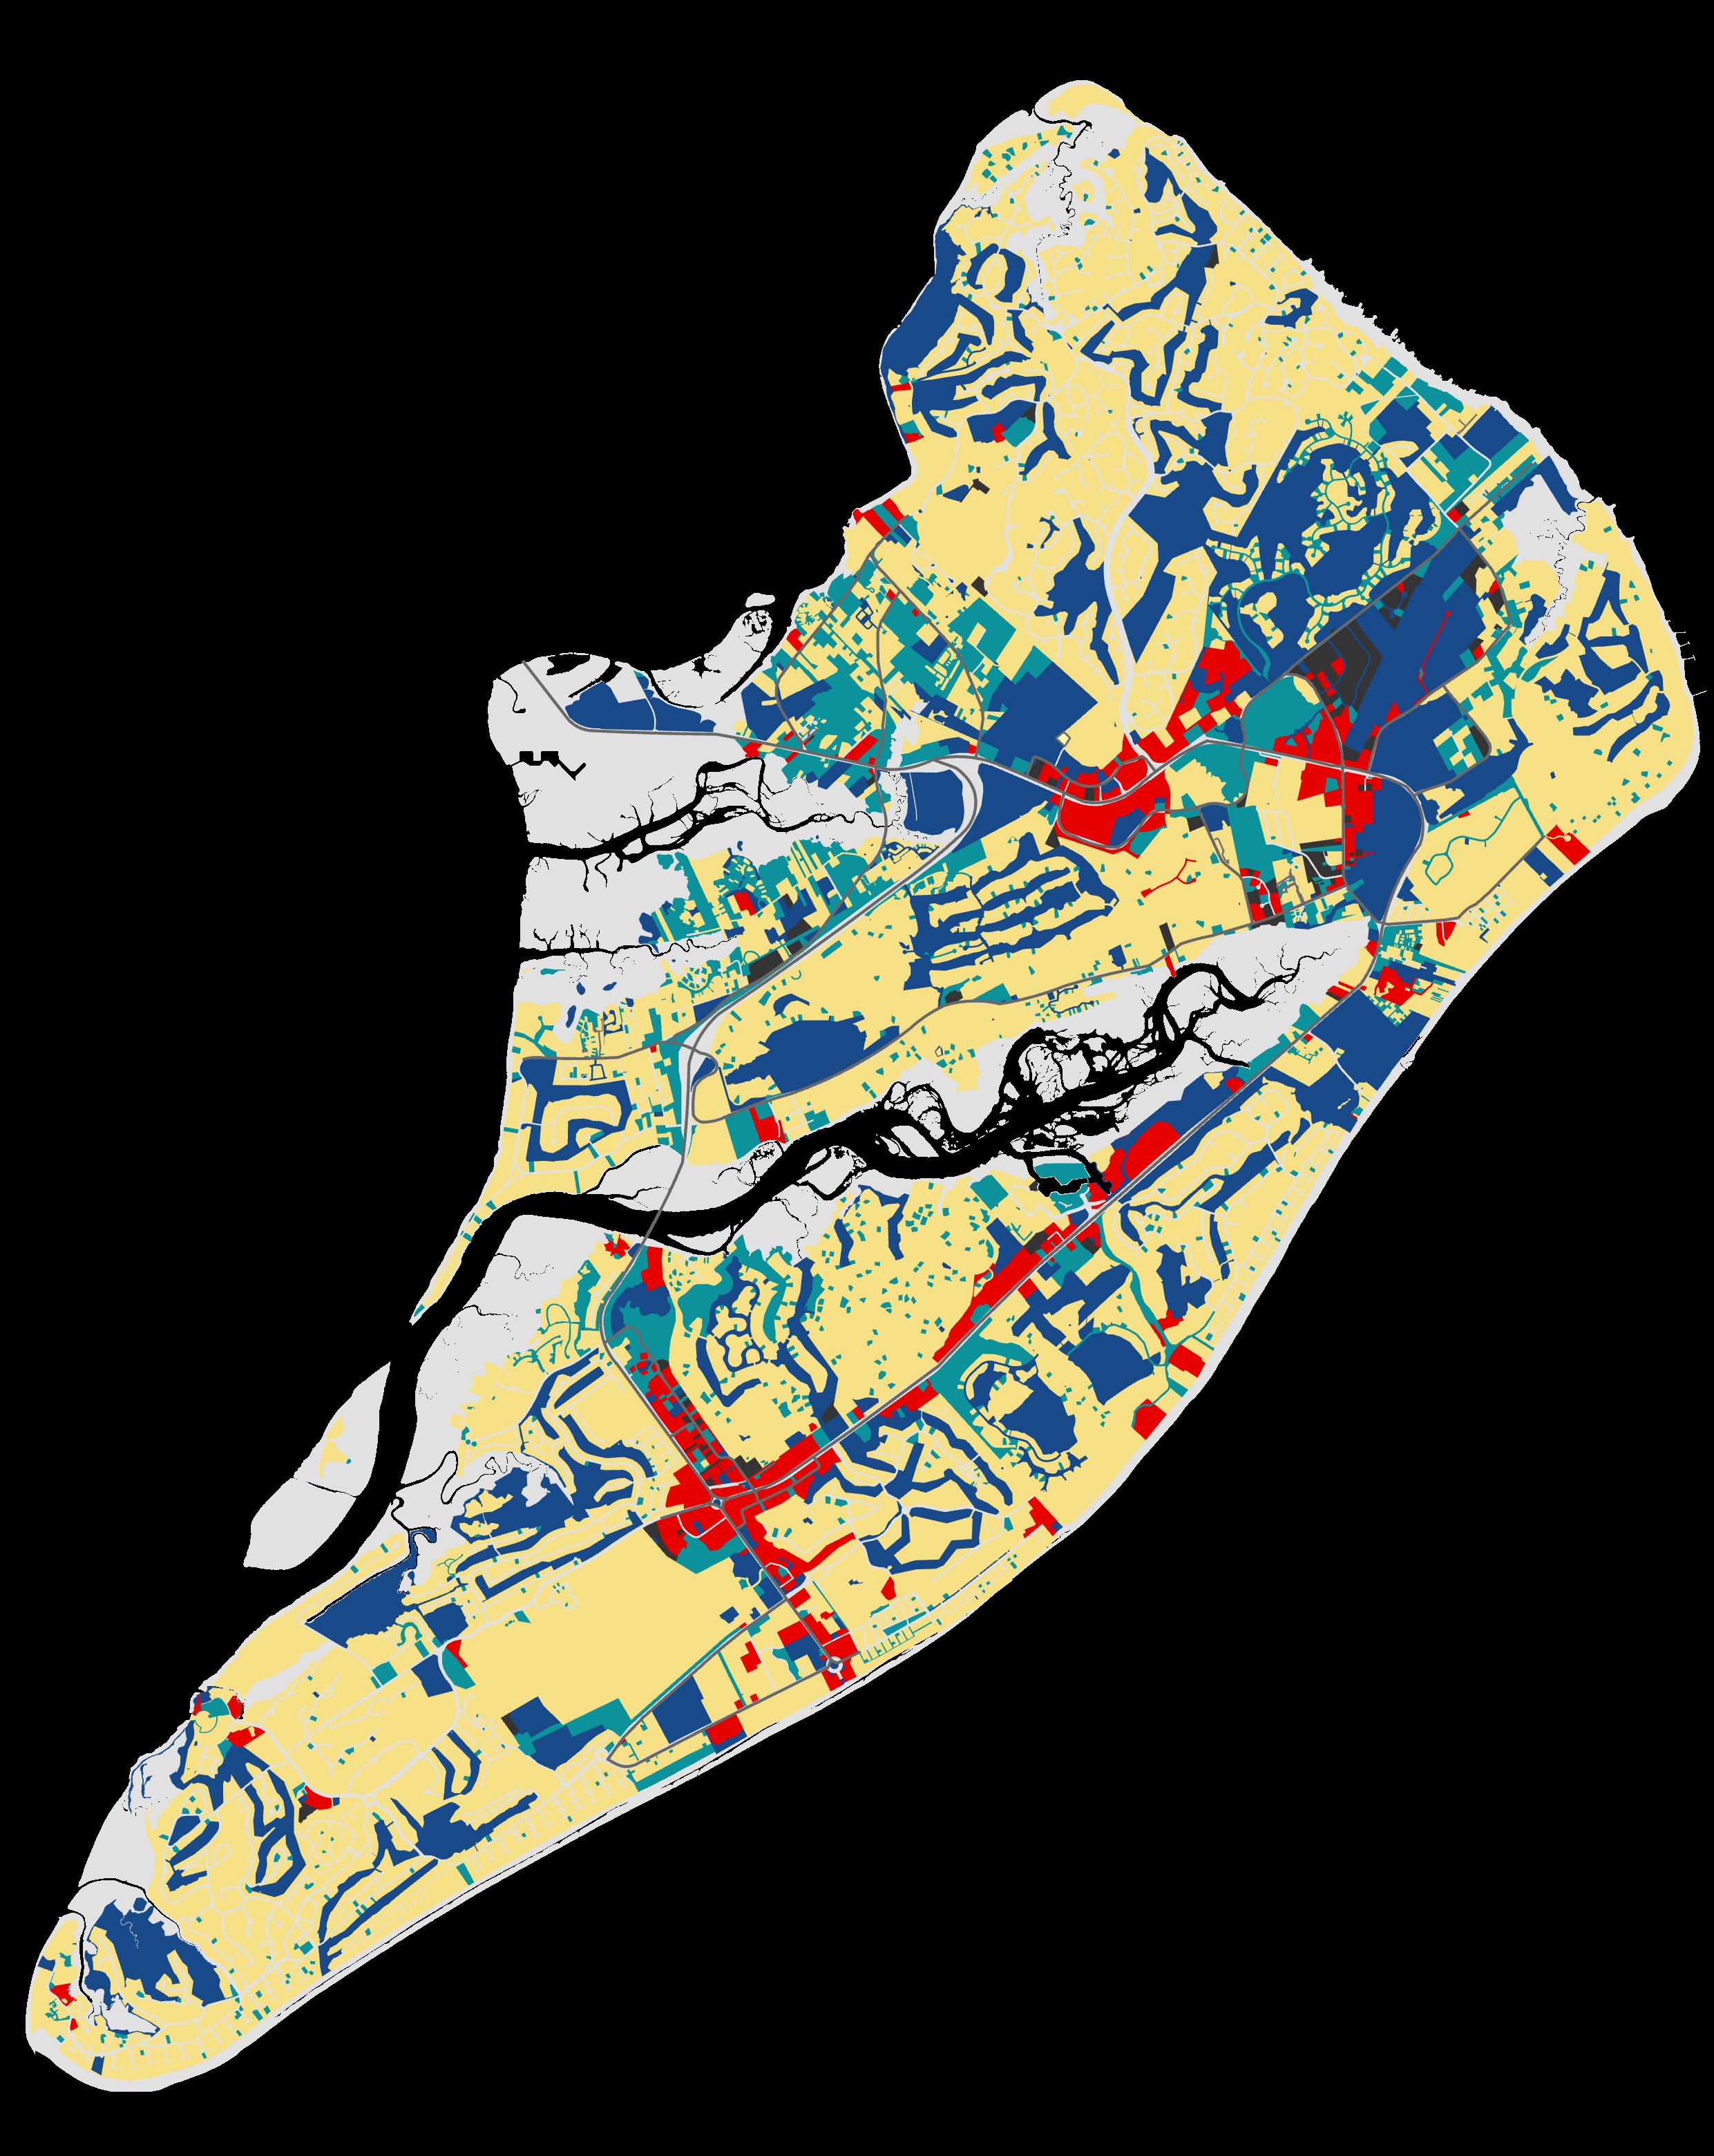
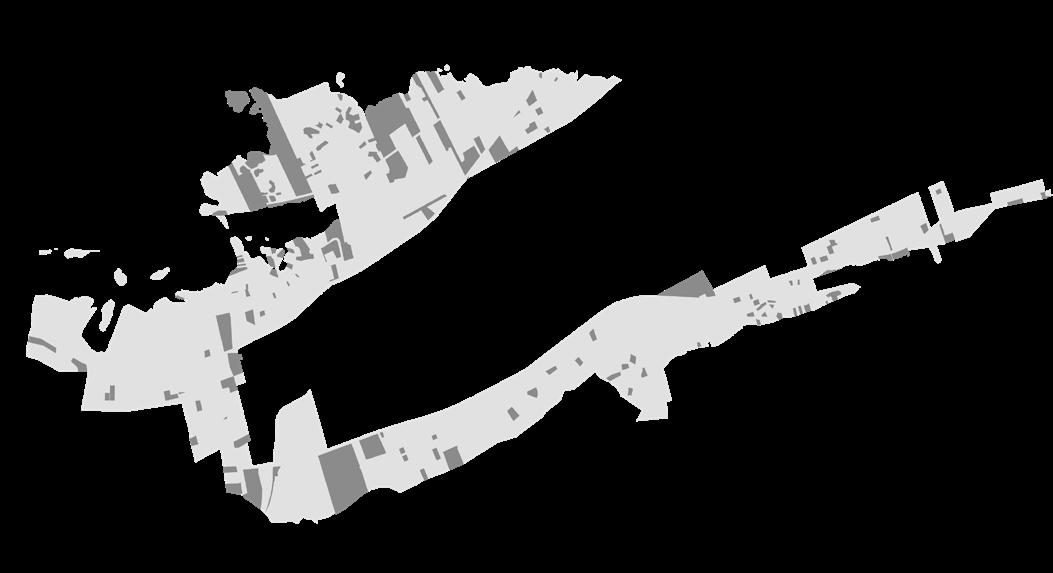
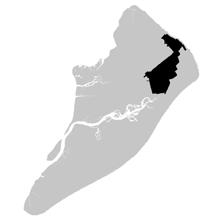
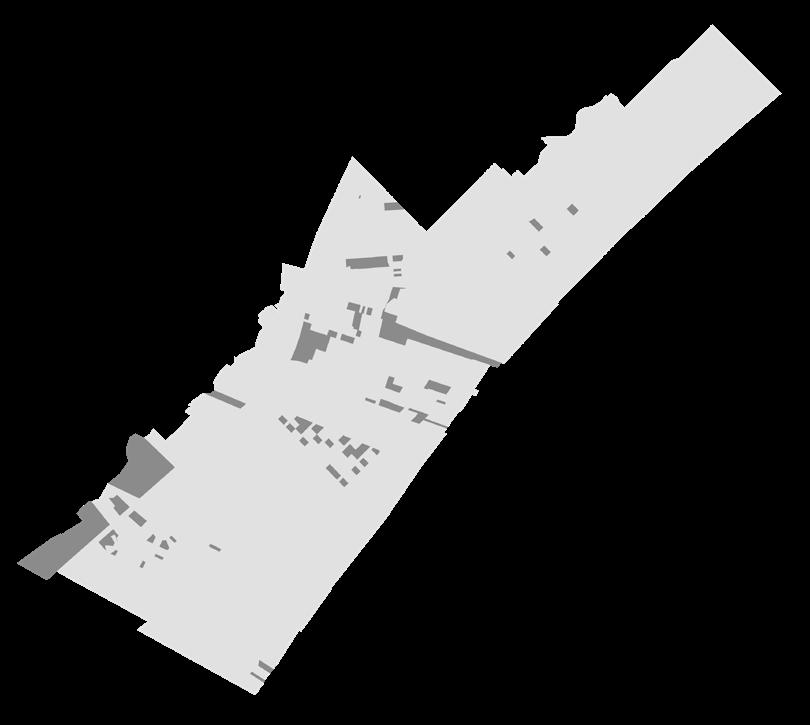
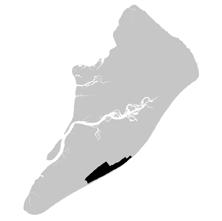
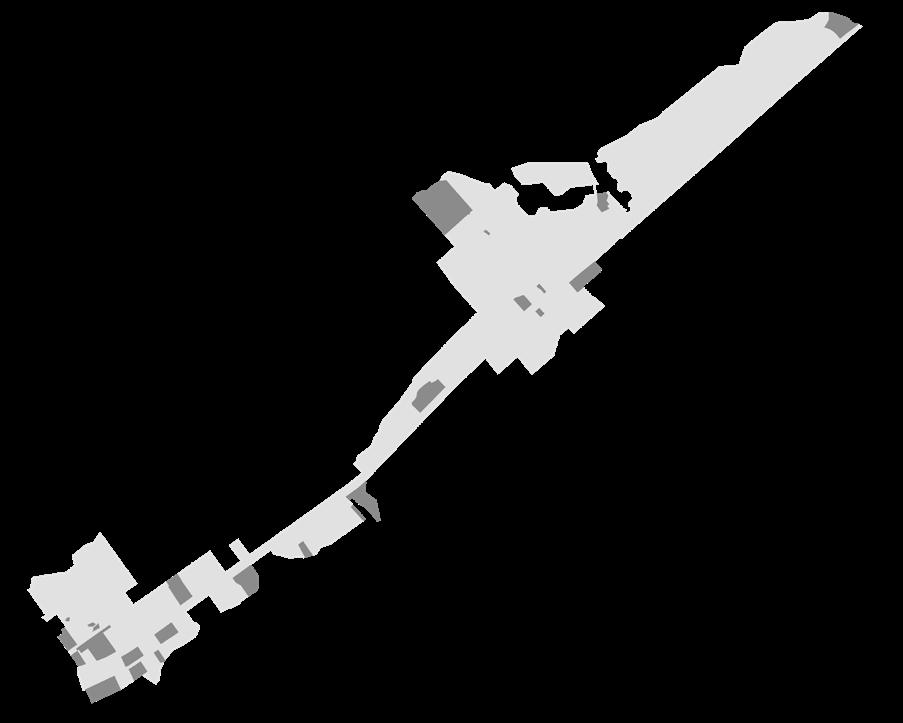
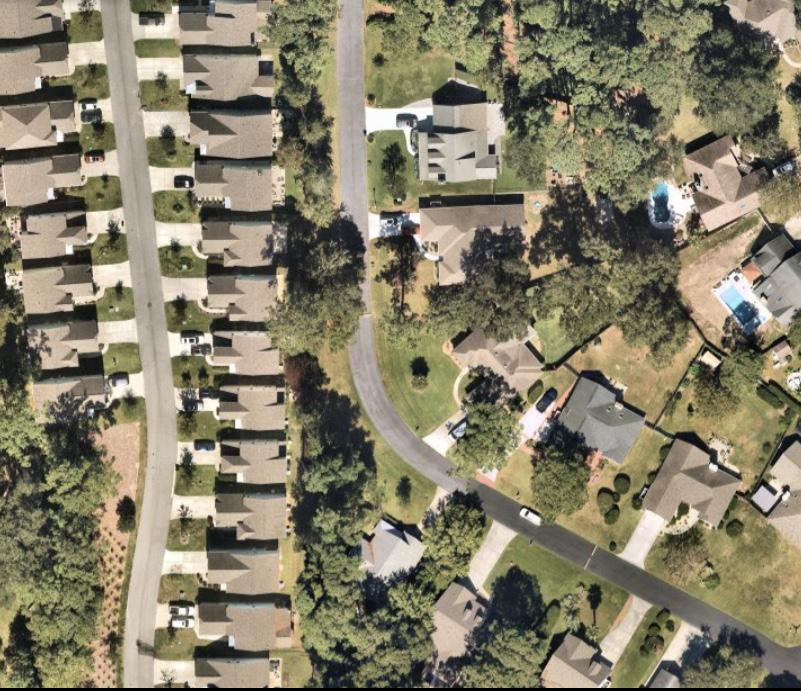
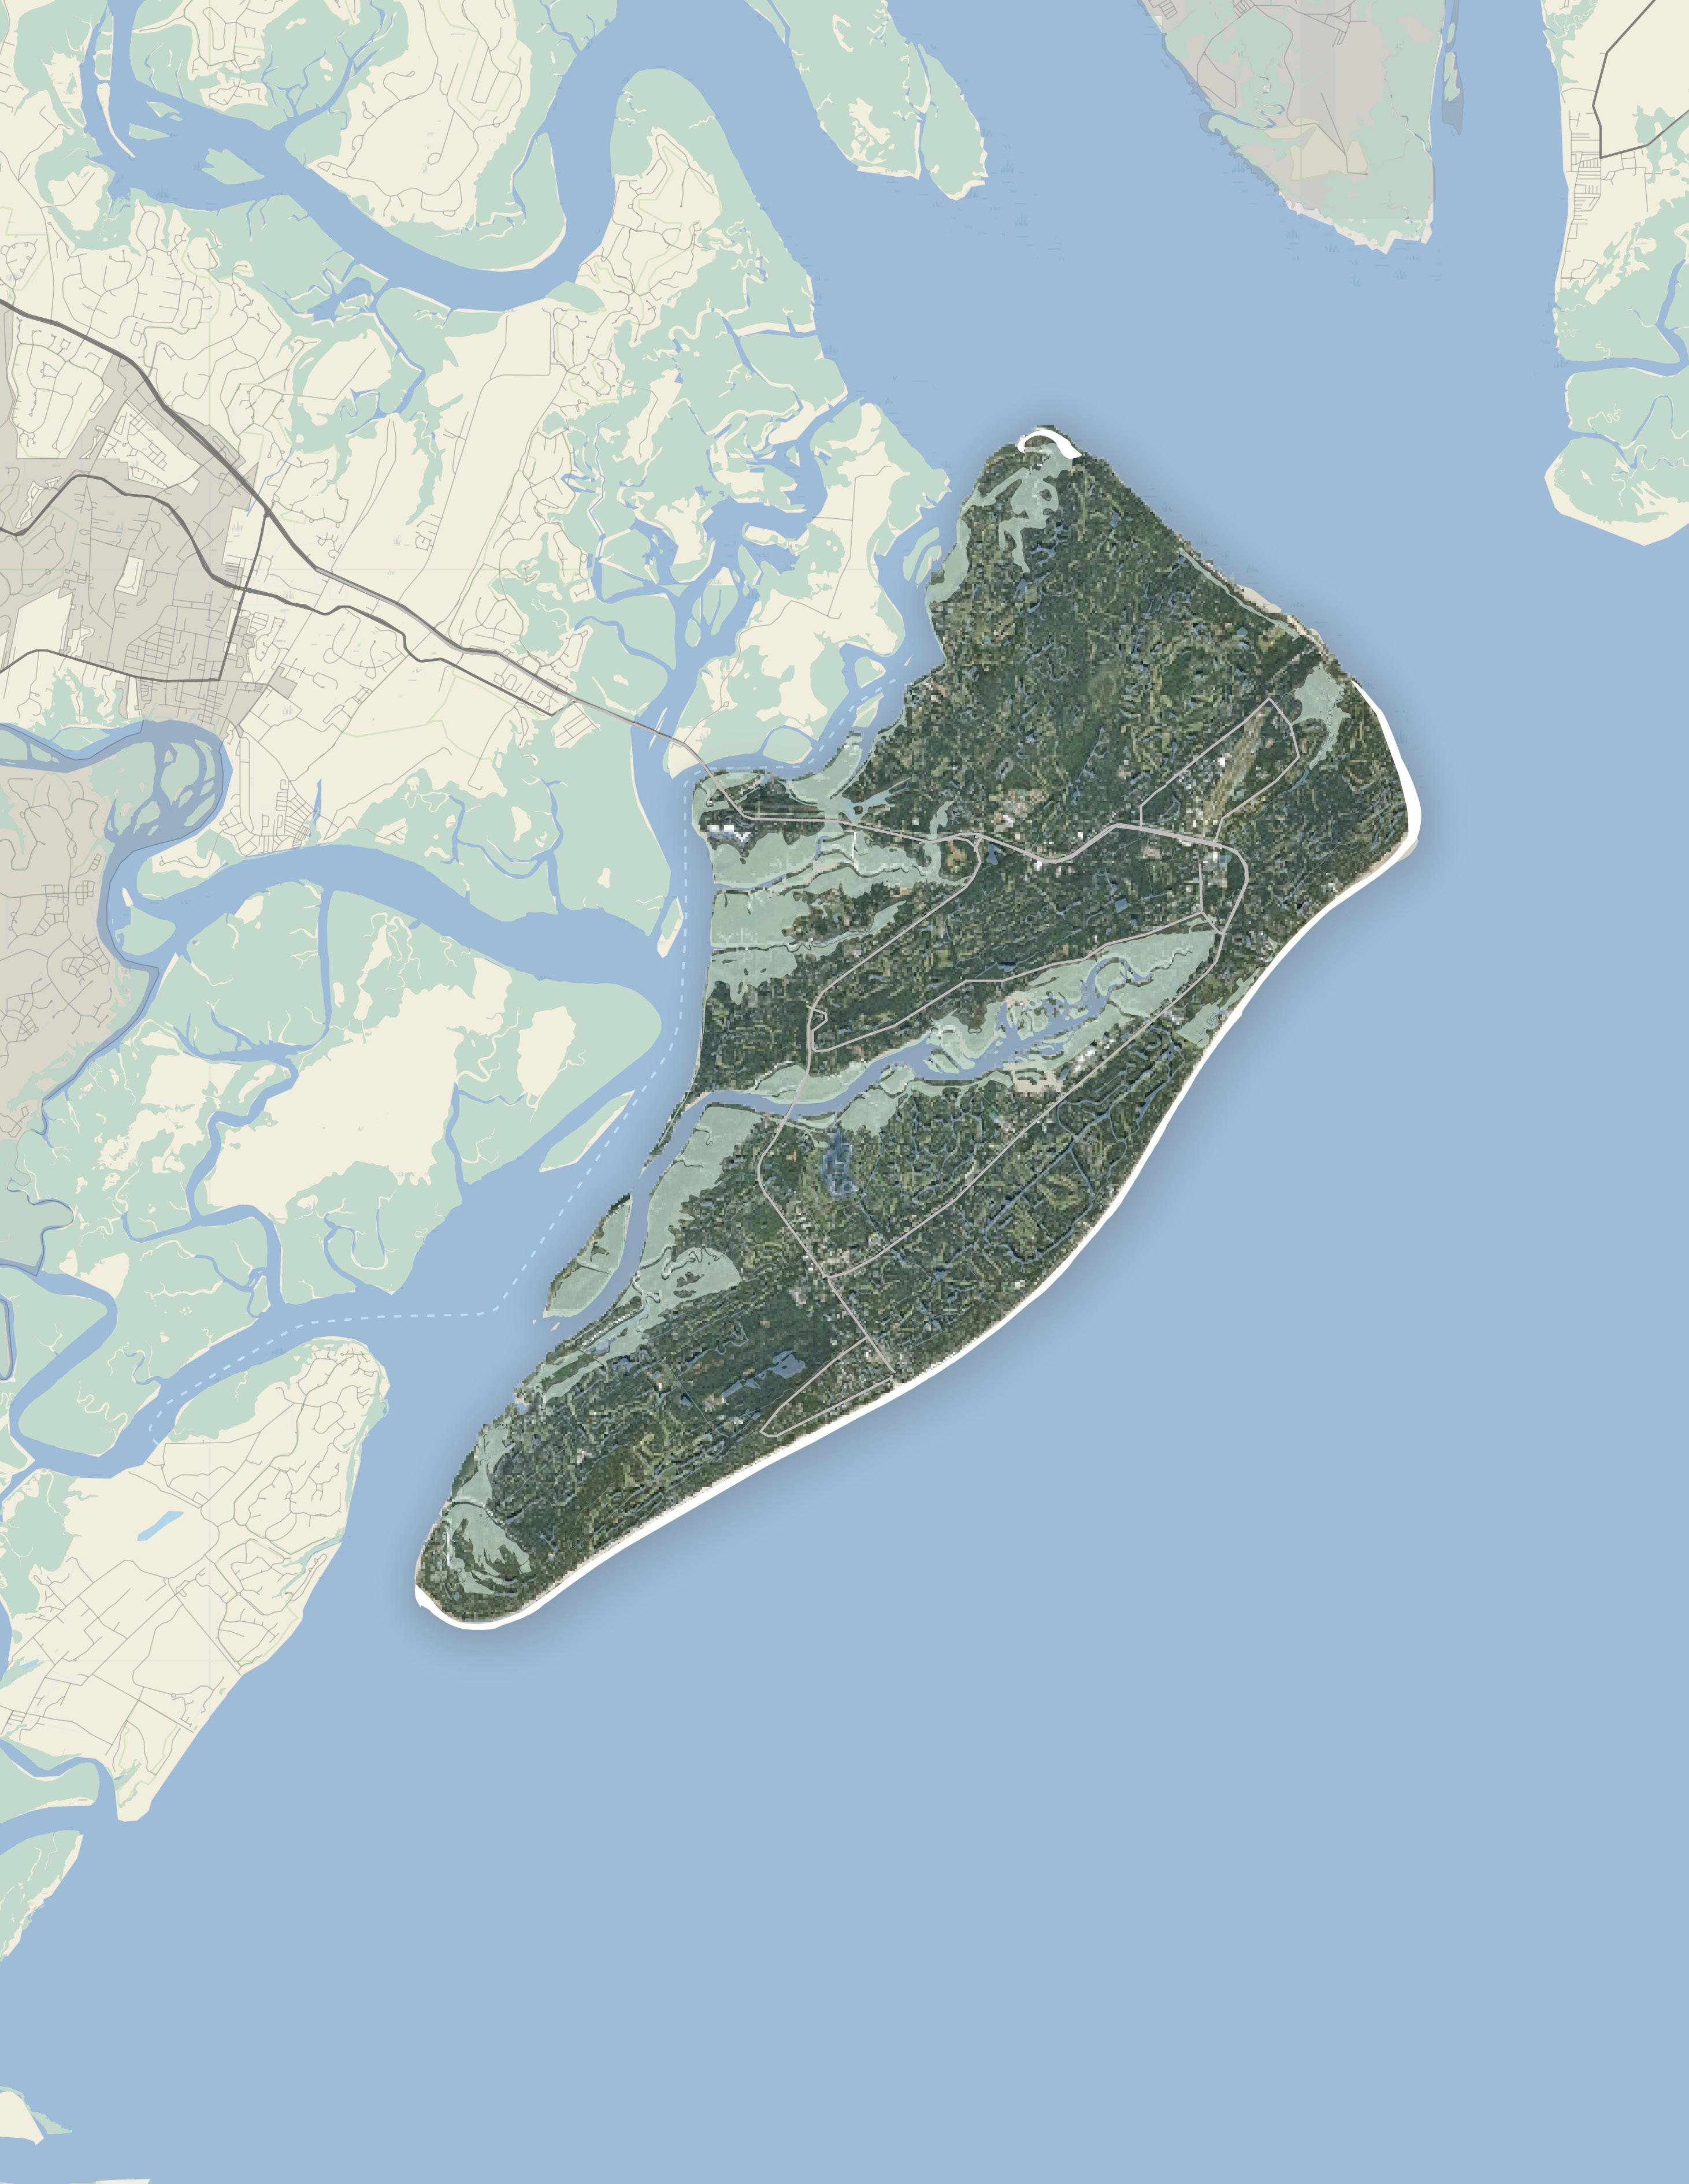
DAYTIME POPULATION CHANGE BY INFLOW AND OUTFLOW OF WORKERS
Island population increases by 33% during the
This map shows the relative change in population during the day caused by the influx of workers on top of the population of full time residents. A negative score shows an area with a net decrease in daytime population.
2
3
Households are getting smaller and older, and are less likely to include school-age children.
• While the total number of households did increase 24% over this period, the makeup of these households is smaller and older. Family sizes on the Island are decreasing faster than in the county and the state.
• Between 2000 and 2020, the average household size decreased 4.3%, compared to 1% for other areas of Beaufort County.
• The two fastest growing segments were households over 65, which were up 50% (3,500 units), and persons living alone are up 57% (1,900 units). Households with children decreased 35%, with 1,200 fewer units.
The number of people on the Island can vary significantly from its full-time population based on the time of day or the time of year.
• The daytime population measures the net gain in workers coming over the bridge each morning. This number varies with time of year, but on average there are 53,000 people on the Island during the day.
• Tourism is another major variable. More than 3.1 million people visit throughout the year, with higher-volume seasons starting in March and ending in September.
• On any given day, there are 8,500+ visitors on the Island, or one visitor for every five full-time residents. The visitor count does not include second home owners. The Island exceeded prepandemic visitor numbers in 2021 after a dip in total visitors in 2020. The increase in daily flights to HHH and growth in short term rentals could drive visitor totals beyond 3.5 million in 2025, this according to the Hilton Head Island-Bluffton Chamber of Commerce.
DAYTIME POPULATION TRENDS, 2017–2021
Source: Town of Hilton Head Island
*Estimates based on yearly visitor averages
HOUSEHOLD SIZE
2.2 4% decrease in household size
TOTAL VISITORS, 2021
3.1m
Visitor levels returned to and exceeded pre-pandemic levels in 2021, up 16.5% from 2019
VISITOR TRENDS, 2018–2025
(ESTIMATED) 3,500,000
Source: Town of Hilton Head Island, Hilton Head Island-Bluffton Chamber of Commerce
*Partial year full-count total
SHARE OF FIRST-TIME VISITORS, 2020
13%
A 2020 survey indicated a significant share of tourists were visiting the Island for the first time.
The average age on the Island is rising and the 55+ segment is driving a modest increase in population.
• The median age for Island residents is increasing quickly, moving from 46 in 2000 to 58 in 2020. During this period, people over 55 drove a population increase, adding just over 9,000 new residents. Every other segment decreased in size.
• The 65 and over segment alone added 6,500 new residents, an 80% increase. This is consistent with regional trends, as Beaufort County’s population grew by 175% in this older segment.
• The county tracked increases in all other age segments; this was not the case for the Island. The under-18, or school-age, population is decreasing. This segment lost 13% of its share from 2000, and the decline is reflected in public school enrollment.
• The public school system lost 400 students from 2012 to 2022, and is experiencing its largest loss among younger students below second grade.
SHARE OF RESIDENTS OVER 65
%
This segment increased from 24% in 2000, the only growing age segment
The Town is a relatively diverse community, but there has been a decrease in the overall share of African American residents.
• Eight out of ten residents on the Island identify as white, but the share of this segment decreased from 2000 to 2020, from 85% to 79%, despite moderately increasing in absolute numbers.
• The number of residents identifying their race as “other” or as “two or more races” increased significantly over this period, growing from 6% to 13% of the Island’s total.
• The African American segment lost population over this period, decreasing by 400 residents (or 15%). The median age for African American residents, 61, is three years older than the overall Island median of 58.
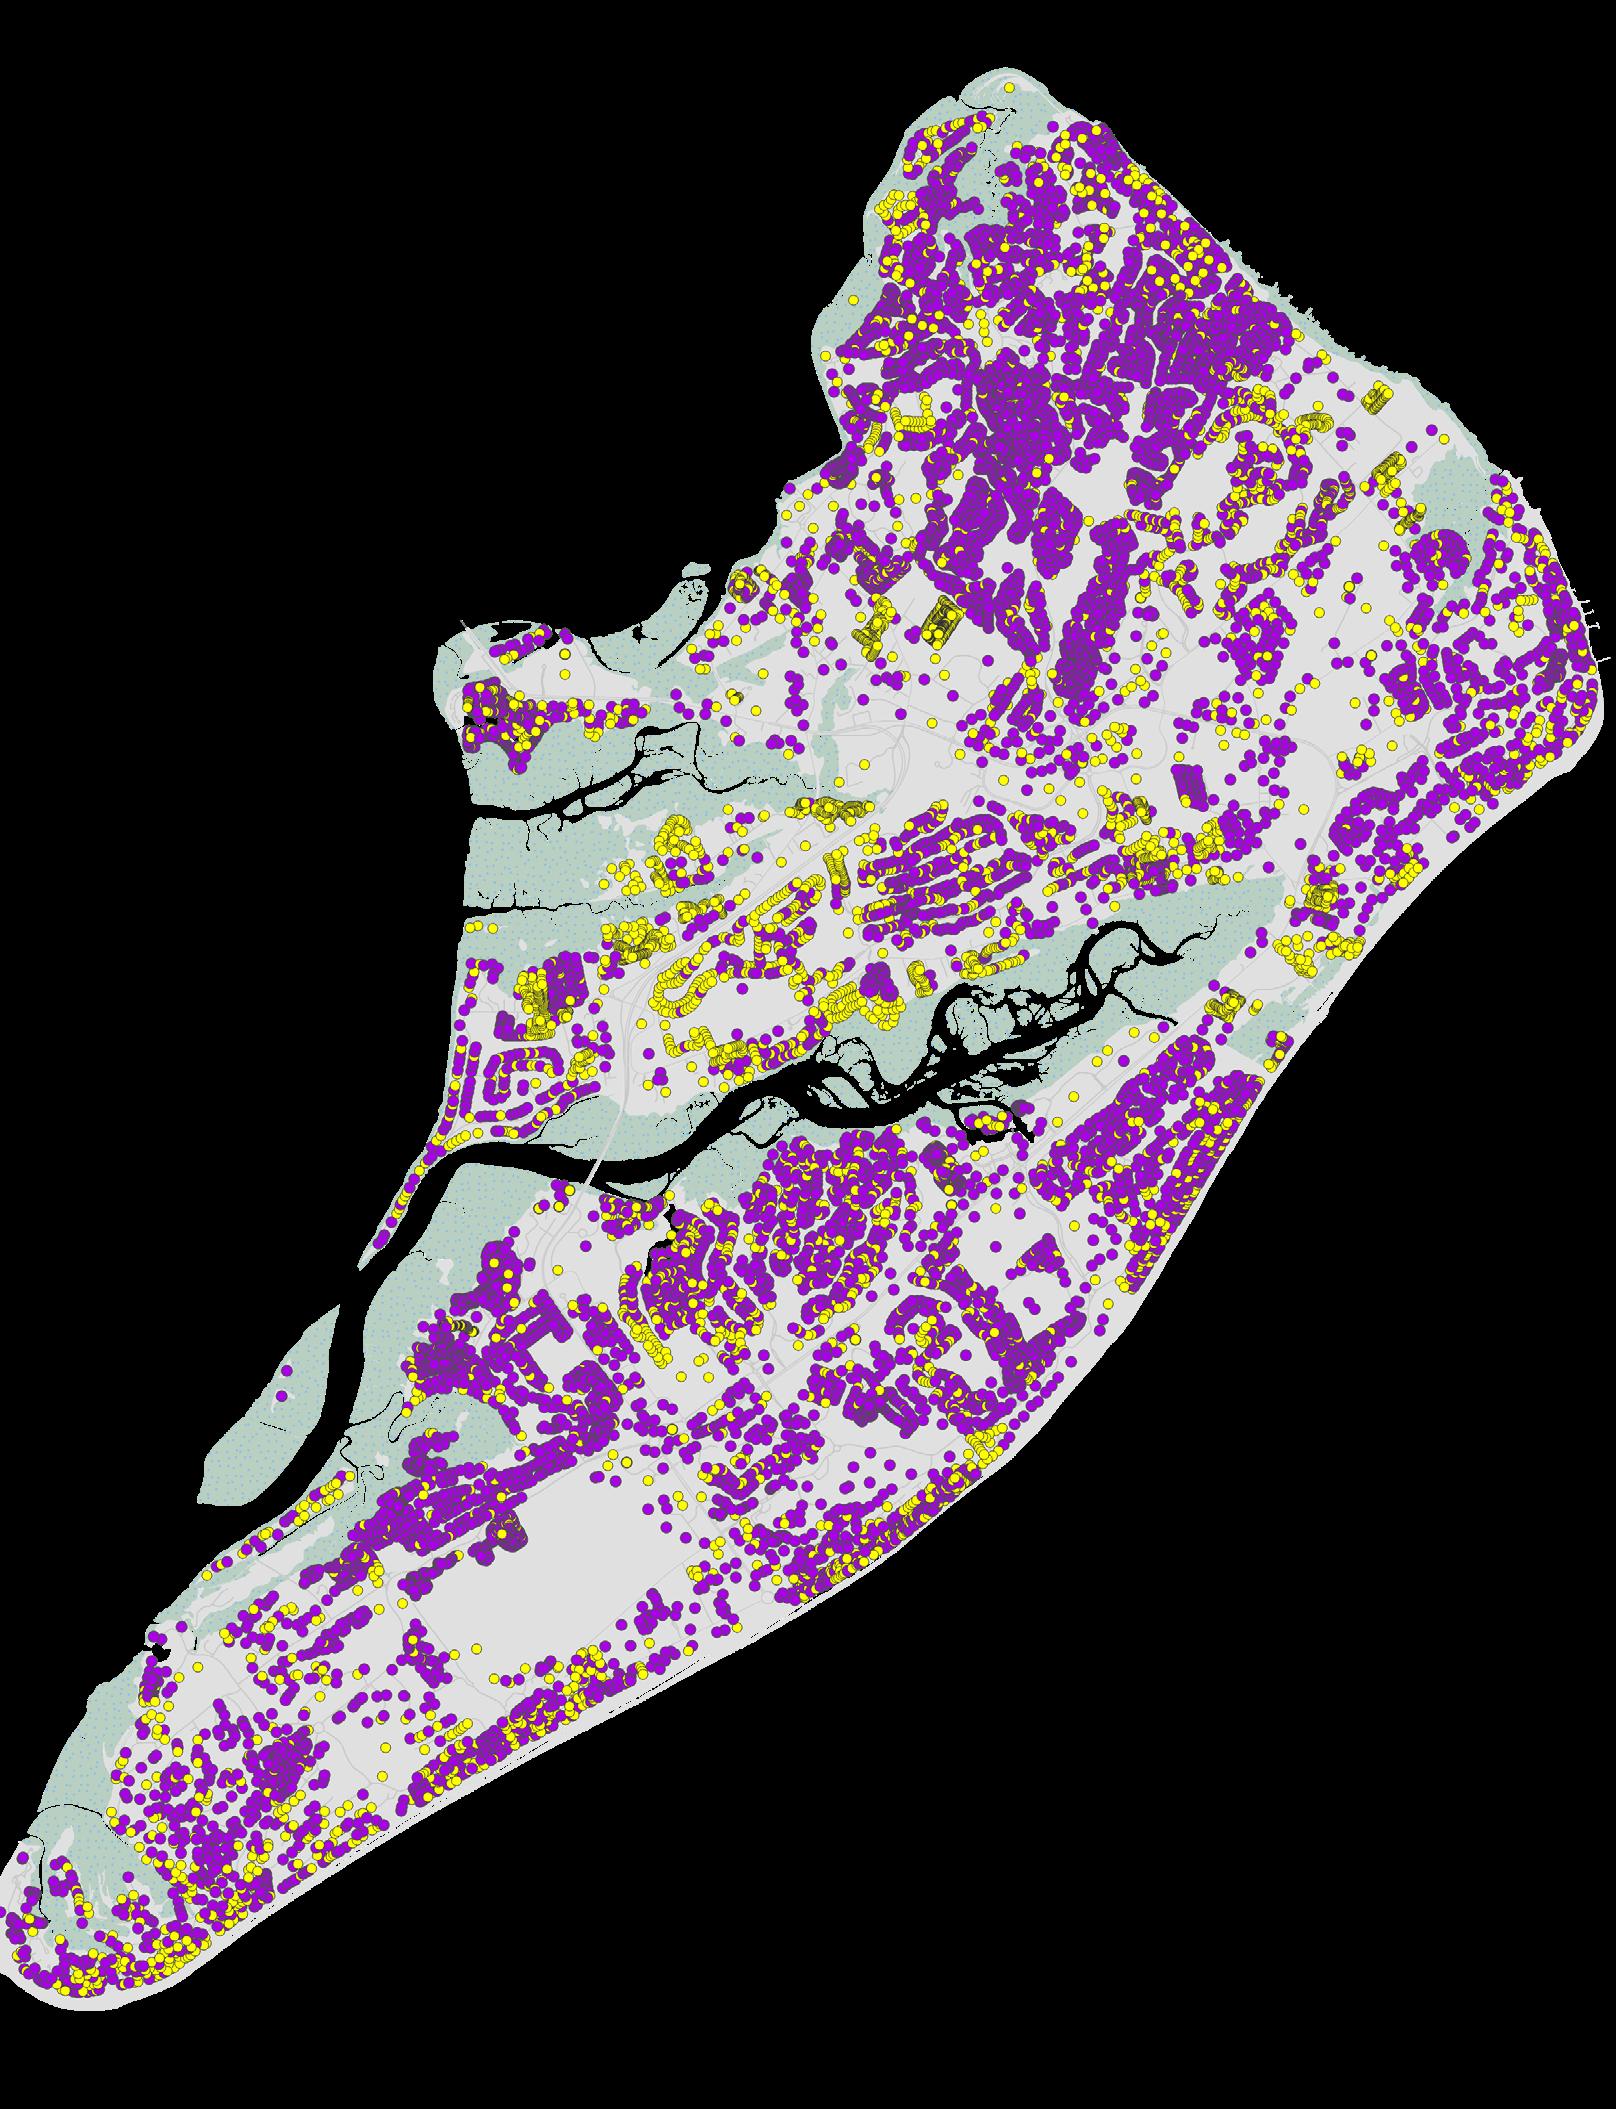
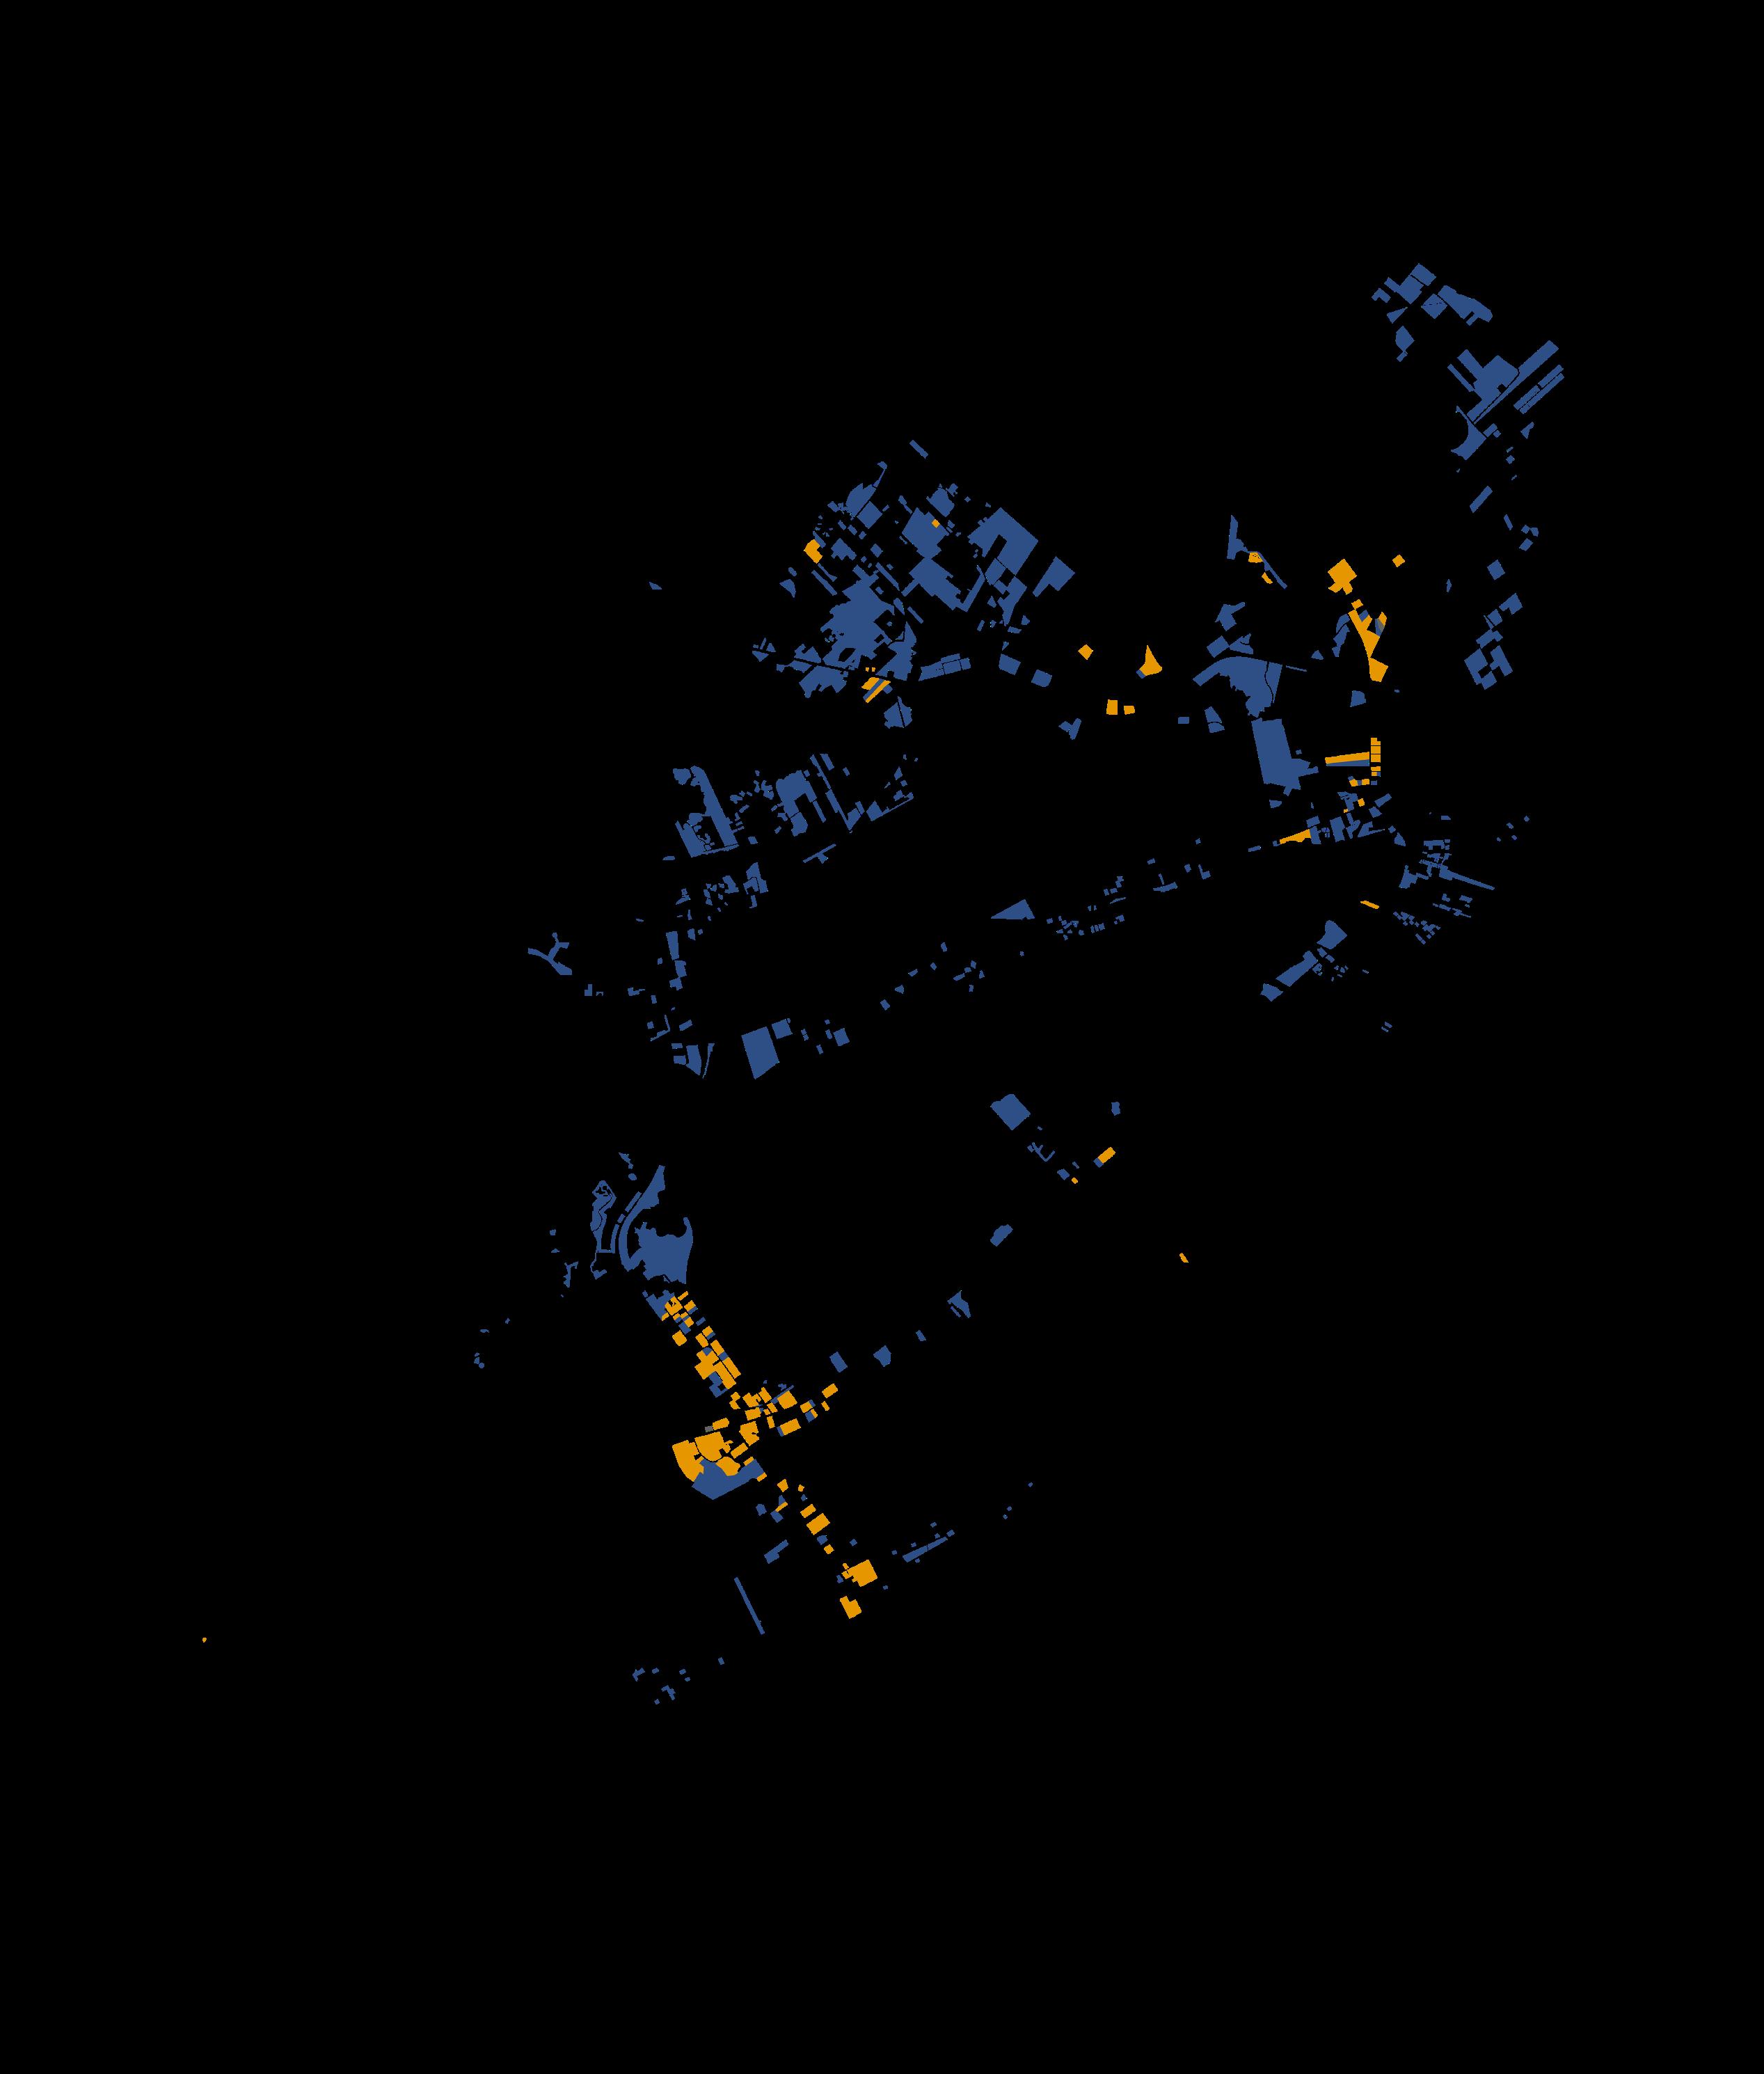
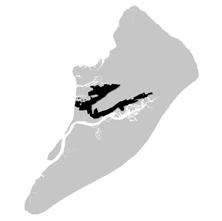
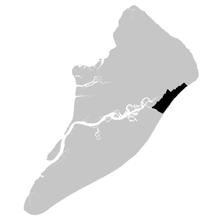
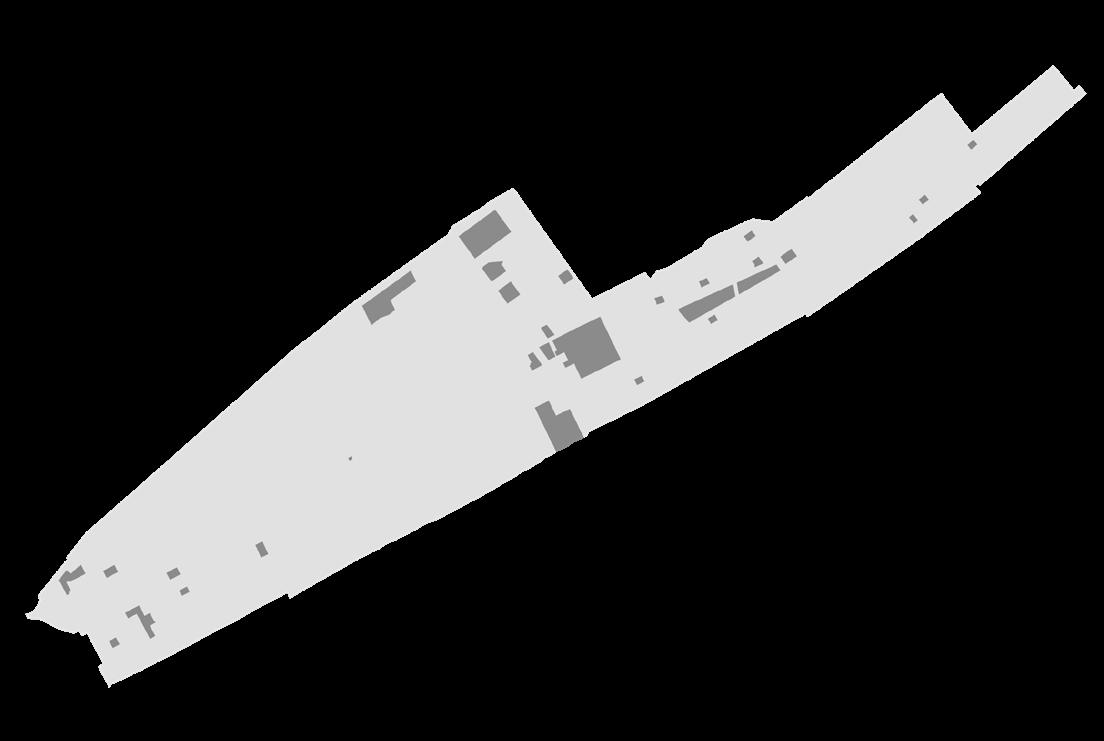
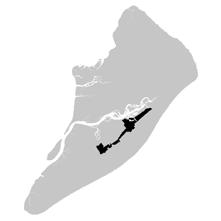
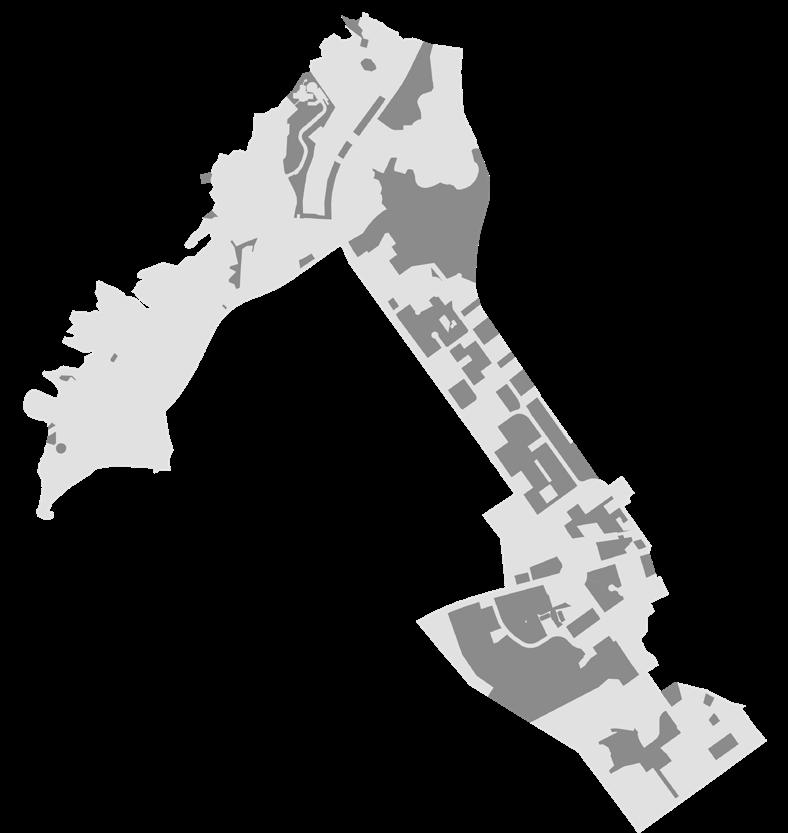
CHANGE IN AFRICAN AMERICAN POPULATION, 2000 TO 2020
The overall share of African American residents decreased from 8% to 6%
MULTIPLE INDICATORS FOR AFRICAN AMERICAN RESIDENTS COMPARED TO ISLAND AVERAGE
Source: US Census Bureau, 2000 to 2020 Censuses
The Gullah Geechee Community
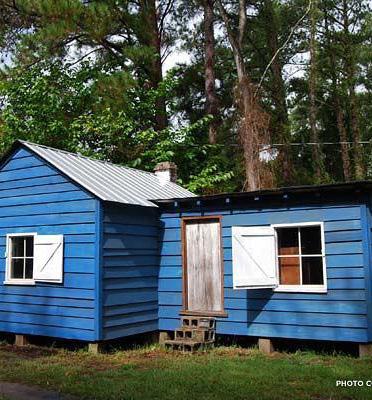
“A century ago, Hilton Head Island was dominated by the Gullah Geechee people. Because of years of geographic and social isolation, their distinct culture reflects their West African roots in many ways, including language, crafts, foodways, storytelling, traditions, farming, fishing, and relationship to the land.” - The Gullah Geechee Culture Preservation Project Report, 2019.
Click to read more about the Gullah Geechee community and the recommendations from the report.
6
The Hispanic community is growing at the fastest rate of any segment, both locally and regionally.
• Mirroring trends across the region and the country overall, the share of Island residents of Hispanic or Latino ethnicity rose by 28.2% between 2000 and 2020 from 3,934 to 5,045.
• According to the Island Packet, the Beaufort County School District is now home to the third-largest Hispanic student population in South Carolina, with more than 6,000 students concentrated mostly on Hilton Head Island and in Bluffton.
• Hispanic students now make up almost half of the Island’s public school population. The growth was even faster, however, across the region, where Hispanic and Latino residents grew by 187%, nearly doubling in size as a segment.
• At Hilton Head Island Middle and High Schools, about one in every three students is multilingual and developing fluency in English. Less than a third of those students met language proficiency targets in 2020, lagging at least 11 percentage points behind their peers across South Carolina.
INCREASE IN HISPANIC POPULATION, 2000 TO 2020
28%
The overall share of the Hispanic population rose 11.6% from 2000 to 2010, and 15.8% from 2010 to 2020
STUDENTS LEARNING ENGLISH IN SCHOOL
1 in 3
Hilton Head Island public schools has increased its English as a Second Language (ESL) resources and offerings to meet the rising need
ENROLLMENT BY RACE IN HILTON HEAD ISLAND ELEMENTARY SCHOOLS (2012 TO 2021)
Source: SC Department of Education student headcounts
7 Foreign-born residents are a growing segment and mostly from Latin America.
• The region has also attracted a large number of foreign-born residents from 2000 to 2020. Just under 12% of residents on Hilton Head Island were not born in the United States, with twothirds of this group migrating from Latin America.
• Europe was the second-largest region of origin, representing 18% of the total foreign-born population.
Multilingual classrooms like the one pictured above are more common with the increase in English as a Second Language students. Credit: Drew Martin and the Island Packet
TOPIC B
WORKFORCE
Workforce refers to the size, composition, and productivity of an area’s labor pool. It can include full-time, part-time, and contract workers.
KEY TRENDS
The scale and composition of an area’s workforce can have a significant impact on its overall productivity and economic potential. Hilton Head Island’s economy relies largely on the tourism industry, which represents a significant proportion of the local labor force. The tourism industry on the Island is supported by the region’s location and abundance of recreation, resorts, and beaches. Other notable workforce categories on the Island include retail services, professional services, and healthcare.
Generally, the workforce on Hilton Head Island is diverse and reflective of the area’s distinctive economic and demographic characteristics, but there is a growing dependence on the larger region to meet the local workforce demands. Each year, more workers commute from off-Island. While wages have increased, they’ve not kept pace with the rise in housing costs. The divergence is forcing local employers to work harder to source labor and considering the long-term impacts of the scarcity.
1
2
3
4
Competition for labor is intensifying as the region experiences strong job and population growth.
Recent Island worker shortages have impacted local businesses.
Unemployment rates have been and continue to be low when compared to the region.
Median annual earnings have been increasing over the last decade, most notably for high school graduates, who experienced a 76% increase in earnings during that time.
5
6
7
8
Higher education facilities on or near Hilton Head Island will continue to add to the workforce with high-demand local industry skills.
Residents have comparatively higher levels of educational attainment than the overall populations of Jasper and Beaufort Counties.
One in five resident occupations are in the food preparation and serving industry.
Commuting for Island residents decreased by almost 10% over the last decade while the share of residents that work from home has steadily increased.
21,400
Total Island Jobs in 2021
The Town of Hilton Head Island is part of a dynamic and evolving region that has experienced significant job growth over the last 20 years. While the COVID-19 global pandemic and related economic shutdowns dealt a temporary setback to the Island’s job growth, the total employment in the Town quickly recovered and exceeded pre-COVID totals. Now topping 21,000 employees, the number of jobs is forecast to increase. The total jobs picture in the larger Hilton Head Island-Bluffton-Beaufort Metropolitan Statistical Area (MSA), which includes Beaufort and Jasper counties, has increased by nearly 24% during period between 2000 and 2022. The region’s growth in most job industries, with healthcare, education, retail trade, and construction posting the strongest increases. Although tourism continues to be an important driver of growth in the region, its economic profile has become more diverse over time. With comparatively ample land for development on the mainland, the overall Savannah and Charleston MSAs have both experienced comparatively stronger economic growth as a result of their rapidly expanding job bases during the same period.
Source: US Census Bureau, Longitudinal Employer-Household Dynamics
HILTON HEAD ISLAND
The Lowcountry boasts strong hospitality and food service industries, which influenced the Technical College of the Lowcountry to open the Culinary Institute of the South in Bluffton in order to support training and development for these workforce sectors. Credit: Culinary Institute of the South
2
3
Recent Island worker shortages have impacted local businesses.
• Recent shortages of Island workers have led to a delayed opening for tourist season, reduced hours of operation, and business closures.
• Hiring challenges on the Island are growing—housing costs are rising, and with more employment opportunities emerging in Beaufort and Jasper Counties, crossing the bridge to Hilton Head Island each day is becoming less desirable to workers.
• Limited non-residential development on the Island tends to impede new job growth. The limited developable land going to nonresidential uses leaves less opportunity to create workforce housing, driving workers to other emerging job markets.
• Other regions in the Lowcountry have more land available to accommodate greater job growth, increasing by 30–40% since 2000, while the Island’s labor force has only grown by 7% in the same time frame.
• Despite this, the Island had a 96% average labor force participation rate from 2000 to 2021, a slightly higher measure when compared to the Hilton Head Island MSA (95%) as well as the Charleston (95%) and Savannah (94%) MSAs. This shows residents are employed, but do not fill the labor needs of the Island.
While unemployment rates on the Island fluctuate with economic cycles, they have historically been lower when compared to surrounding regions.
• The Island’s unemployment rate as of 2021 is 3.1% lower than the Hilton Head Island, Savannah, and Charleston MSAs.
• The all-time high unemployment rate on Hilton Head Island was 6.8% during the national recession; it peaked again during the COVID-19 pandemic, but recovered quickly.
CHANGE IN UNEMPLOYMENT, 2000 TO 2021
LABOR FORCE PARTICIPATION
96%
This measures those locals that can and do work (non-retired, nonminor, etc.); Up 7% from 2000
RECESSION
Source: US Census Bureau, 2000 to 2020 Censuses
UNEMPLOYMENT RATE, 2021
3.1%
The Island is nearing full employment, including the portion of residents that work off-Island
HILTON HEAD ISLAND
SAVANNAH MSA
Median annual earnings have been increasing on the Island over the last decade, most notably for high school graduates.
COMPARATIVE INCOME AND RENT, 2020
• There has been a 33% increase in median annual wages across the Island over the last decade, with high school graduates experiencing a 76% increase in earnings.
• All levels of educational attainment experienced some form of growth in earnings from 2010 to 2021.
• While wages on the Island have increased, housing costs remain a challenge for many residents. The maximum monthly housing cost the average single worker can afford before being housing cost-burdened is $1,043. This measure is based on the standard recommendation of spending less than 30% of monthly earnings on housing costs. The median rent in the Town of Hilton Head Island is $1,330 according to the US Census 2022 American Communities Survey.
Source: US Census Bureau, 2020 Census
MEDIAN EARNINGS BY EDUCATIONAL ATTAINMENT, HILTON HEAD ISLAND
Source: US Census Bureau, 2000 to 2021 Censuses
Path to payroll: growing hiring challenges
Hilton Head Island is facing significant workforce challenges. In 2016, the Island’s tourism-based economy relied on over 8,400 workers to keep businesses open. However, with the rising cost of housing and increased employment opportunities in nearby Beaufort and Jasper Counties, workers are being pulled off the Island. This shortage of workers has led businesses to delay opening for the tourist season, cut hours of operation, or shutter locations altogether.
5
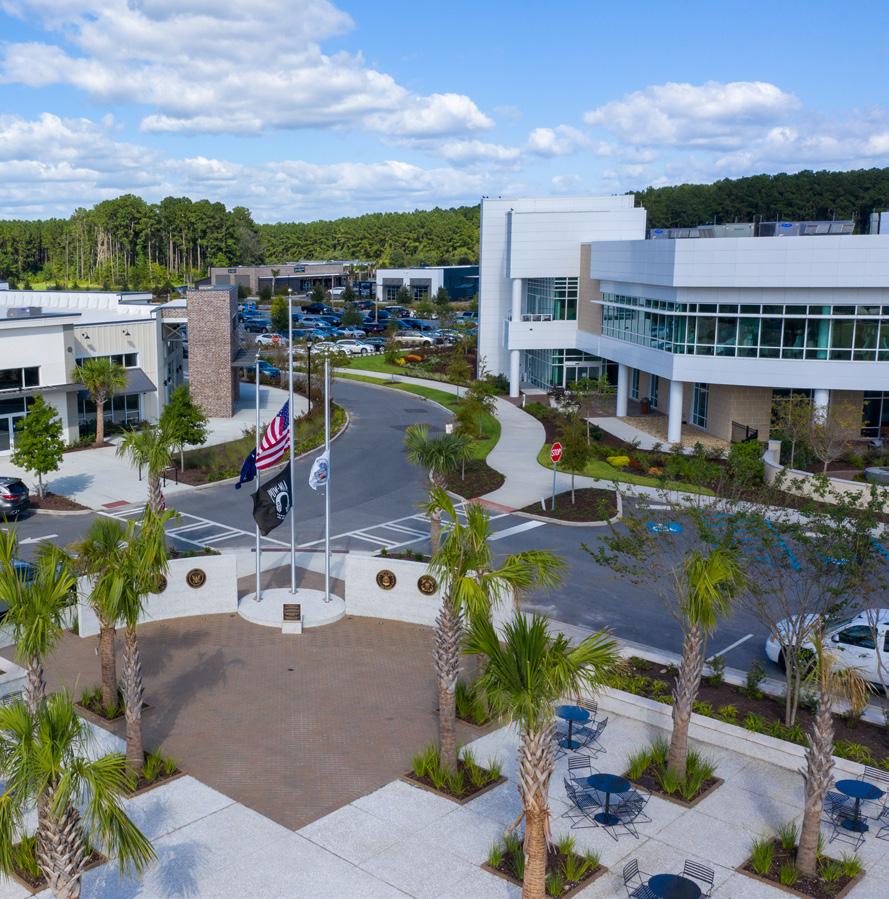
Higher education facilities on or near Hilton Head Island will continue to infuse the workforce with high-demand local industry skills.
• Higher education institutions include University of South Carolina at Beaufort (USCB) and Technical College of the Lowcountry (TCL). The schools have a combined student population of over 8,000.
• Many higher education opportunities in the area are geared toward the tourism industry, including USCB-Hilton Head’s Hospitality Management program and the Culinary Institute of the South, a subsidiary facility created by TCL to advance the hospitality and food service workforce in the region.
6 Residents have comparatively higher levels of educational attainment than the overall populations of Jasper and Beaufort Counties.
CULINARY INSTITUTE OF THE SOUTH
Associate Degree in Culinary Arts
Restaurant Cooking Skills Certificate
Degrees & Certificates
• 52% of the residents of the Town of Hilton Head Island age 25 years or older had at least a bachelor’s degree in 2021, while the comparable figures were 42% for Beaufort County and 24% for Jasper County.
• All three geographic areas have experienced strong increases in education attainment levels since the 2010 US Census.
Partner Advocates
Associate Degree and Certificate in Baking & Pastry Arts
Associate Degree and Certificate in Hospitality & Tourism Management
The Sea Pines Resort SERG Group
The Omni Hilton Head Oceanfront Resort
The Sonesta Resort Hilton Head
The Westin Hilton Head Island Resort & Spa
US Foods
Fat Patties
Source: Technical College of the Lowcountry
7
One in five resident occupations are in the food preparation and serving industry, making it the most common job.
• Food preparation and serving accounts for more than 20% of the Island’s labor force. The average salary of a worker on the Island in this industry is $34,106.
• The second most common occupations on the Island are in office & administrative support, a sector which employs 13% of the labor force. This is closely followed by the sales industry, which employs around 12%.
• Office and administrative support occupations have an average annual salary of $47,880 on the Island, and sales occupations have average annual earnings of nearly $62,000.
8 Commuting for Island residents decreased over the last decade while the share that work from home has increased.
• The majority of local workers live off-Island, totaling about 14,800 workers crossing the bridge each day to get to work. This number has increased by 26% from 2002, while the number of workers who live on the Island has decreased by 34%, for a total of roughly 8,400.
• Approximately 28% of workers commute to work after 9:00 A.M., and for most it takes between 10 and 19 minutes to commute.
• The tourism-based economy of the Island means that commuting hours for Island workers do not necessarily align with traditional business hours.
• When compared to the surrounding regions, residents on the Island have shorter commutes. The mean travel time to work was estimated to be around 18 minutes in 2021, which was only a slight difference from the average mean time of 17 minutes in 2010. Over 80% of workers use personal means of transportation such as a car, truck, or van to commute to work.
• Commuting has decreased by about 10% since 2010 while the work-from-home trend has increased from 7% in 2010 to 15% in 2021.
Source: US Census Bureau, Longitudinal Employer-Household Dynamics
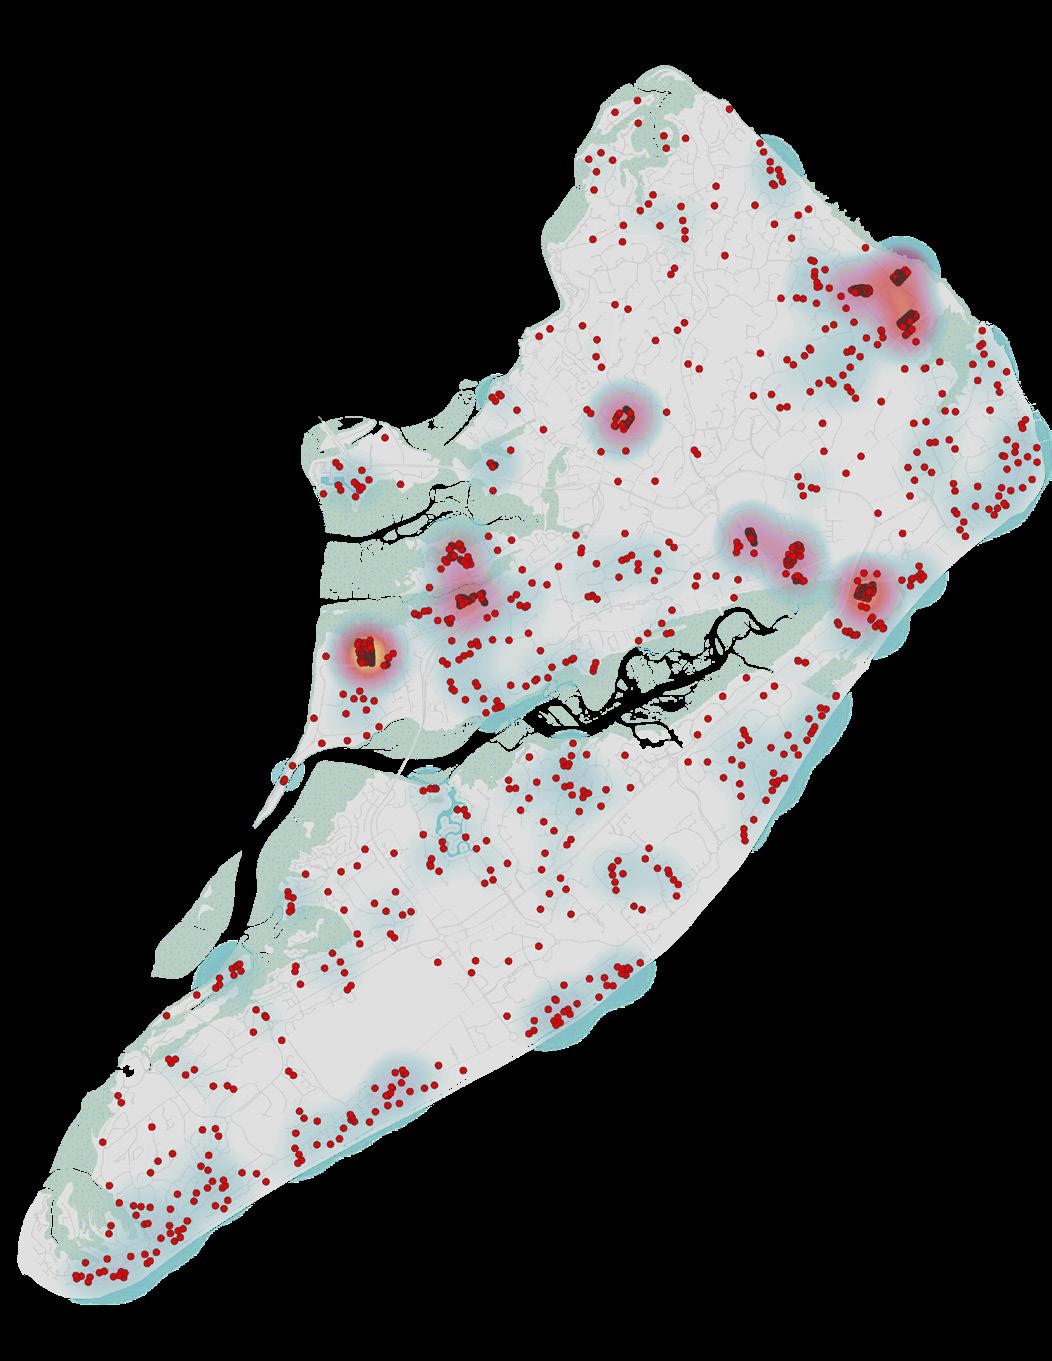
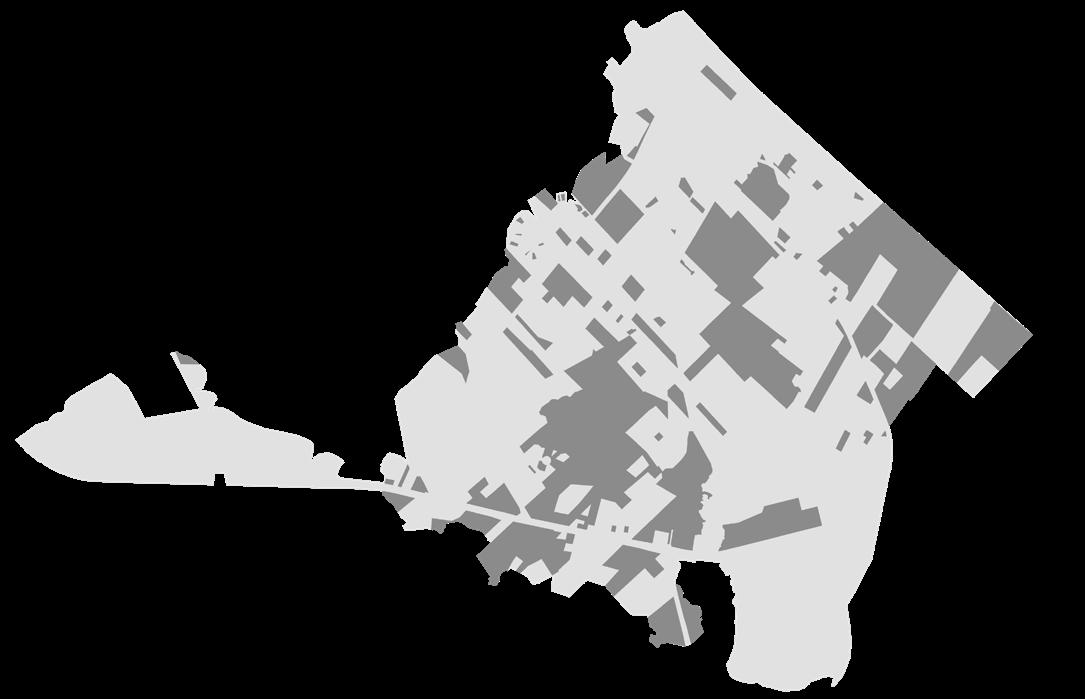
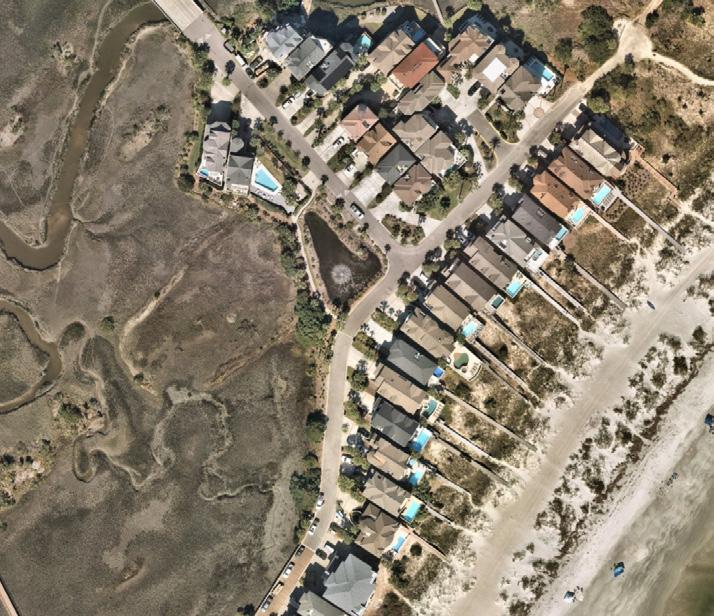
WHERE ISLAND WORKERS LIVE, 2019
Source: US Census Bureau, Longitudinal Employer-Household Dynamics
INFLOW/OUTFLOW ANALYSIS, 2002 TO 2020
14,800
8,400
6,400
Note: increases measured from 2002 to 2020.
Source: US Census Bureau OnTheMap Tool
JASPER CO.
HAMPTON CO.
CO.
LIBERTY CO.
TOPIC C
ECONOMICS
Economics is an examination of the individual and market forces that influence businesses, revenues, expenditures, and capital projects. This section provides insight on the local economic conditions on Hilton Head Island and the overall region.
KEY TRENDS
While some trends have remained consistent over the last two decades, there have also been significant changes within Hilton Head Island’s economy. COVID-19’s impact on the tourism industry, though brief, exposed vulnerabilities within this sector and underscores the need for economic diversification. This unique moment in time also set off a host of new local trends, with more residents working from home, a ratcheting up of real estate activity, and a broad increase in business activity.
Meanwhile, maintaining and improving accessibility to the Island is an economic imperative. Economically, the Island is not an island. Commuting and spending patterns show a tight connection between the Town and the broader region.
This section examines the dynamics of the local economy and breaks down major trends following the pandemic and other regional impacts.
1
2
After the pandemic-related disruption in 2020, tourism has bounced back and continues to drive the Island’s economy.
The number of applications for business licenses shot up after 2020, almost two-thirds of which have been for short-term rental properties.
3
4
5
6
7
Hilton Head Island Airport (HHH) has played a growing role in local economic development since its 2018 expansion.
The local economy has recovered since the shock from the COVID-19 pandemic and historic trends are expected to continue.
Tourism drives local revenues and has recovered and surpassed pre-pandemic levels.
Non-tourism related jobs grew the most over the last two decades.
Several capital projects planned in and around Hilton Head Island are expected to positively impact economic outcomes.
$2.8 billion Economic Impact of Tourism
After the COVID-19 disruptions in 2020, tourism has bounced back and continues to be Hilton Head Island’s leading economic driver. In 2021, Travel & Leisure’s World’s Best Awards named it America’s number one island; that same year the MSA saw a total gross domestic product of $9.2 billion.
As one of the most popular visitor destinations in the South and a record high of over 3 million visitors in 2021, it is no surprise that industries supporting tourism host the largest shares of jobs on the Island. Along with retail trade, accommodation and food services account for more than onethird of the Island’s jobs. This share has been relatively stable over the last two decades.
GROWTH IN REGIONAL GDP, 2001 TO 2021 $3.3b
The Island still dominates regional contributions to GDP, but more recent growth can be attributed to mainland development
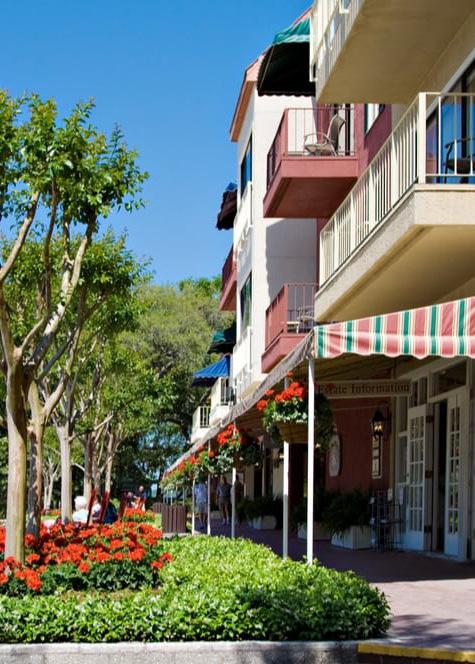
Destinations like the Sea Pines Resort draw in large amounts of visitors each year, driving economic prosperity and maintaining a strong workforce.
The number of applications for business licenses shot up after 2020, almost two-thirds of which have been for short-term rental properties.
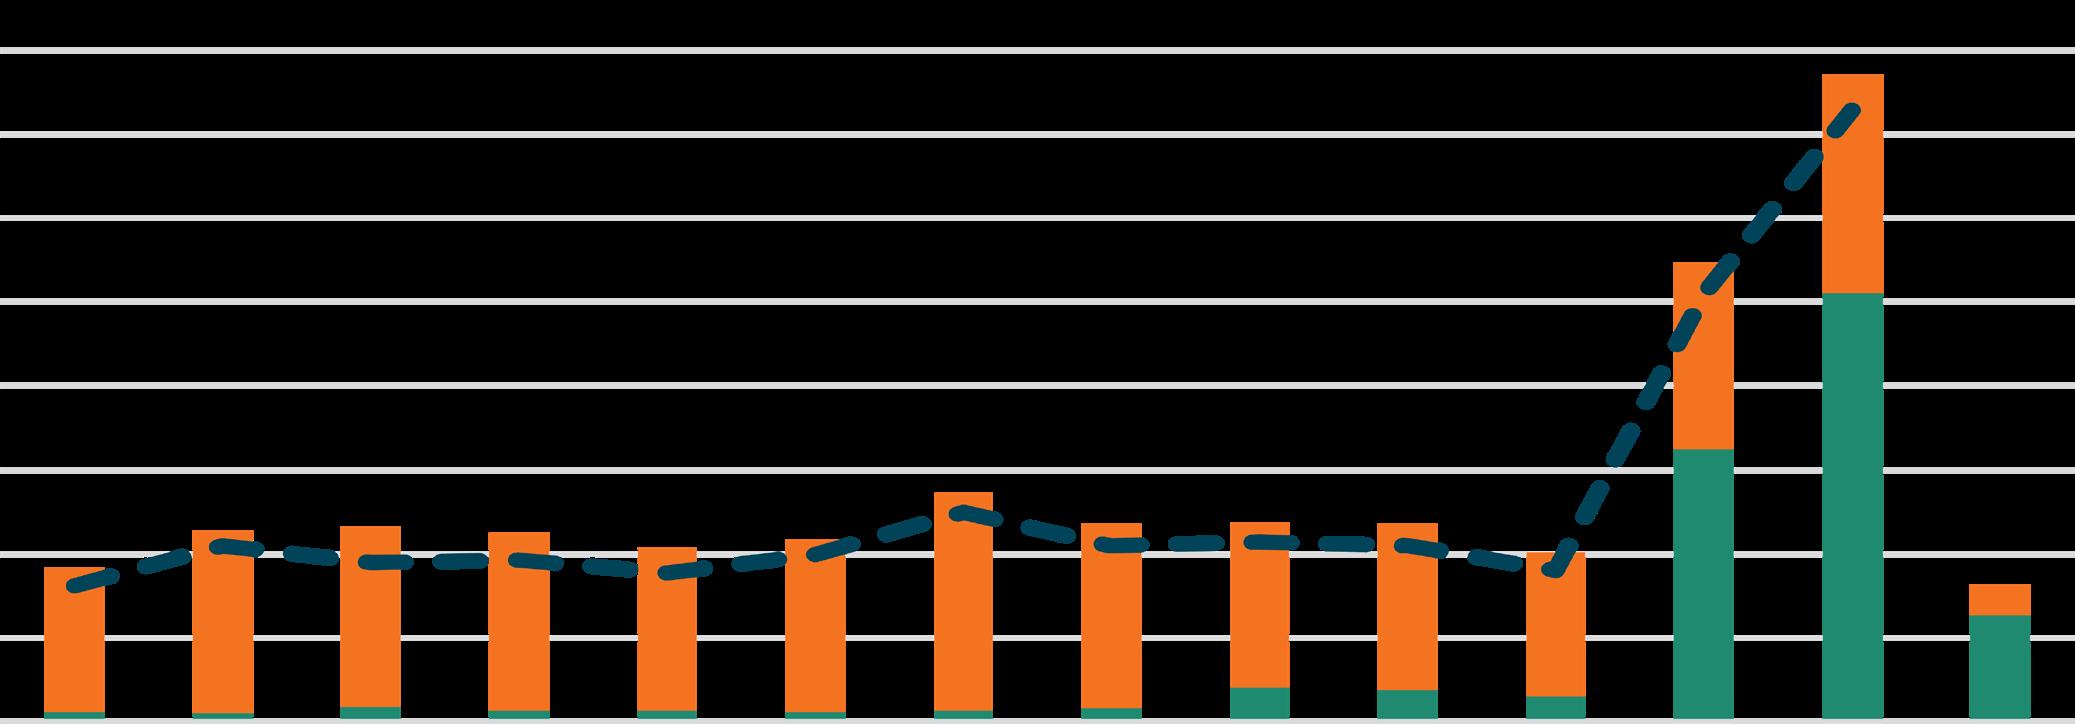
• Between 2010 and 2020, the number of business license applications submitted per year ranged from a low of 917 (in 2010) to a high of 1,362 (in 2016).
• Prior to 2022, anyone who owned more than one short term rental unit was required to have a business license. Beginning in 2022, all short term rental units were required to have a town business license. Applications began increasing exponentially in 2021 in anticipation of this requirement.”
• The past two years have been record breaking, with 2,742 applications in 2021 and 3,863 in 2022. Requests for licenses for short-term rentals (STRs) have primarily driven this growth.
• Prior to 2021, applications for construction contractors and subcontractors were the most popular type, making up more than one-fifth in some years. Since 2021, they are the second most popular type after STRs.
• Approximately 99% of requests for licenses have been approved since 2010, and the elevated number of applications is expected to continue.
• Beginning in 2023, short term rental owners were required to have a short term rental permit for each rental unit owned in addition to their town business license.
Managing the Short Term Rental Wave
In an effort to manage the proliferation of short term rentals on the Island, the Town passed a rule requiring home owners to acquire a permit if they intend to list and rent their home through a short term rental portal like Airbnb or VRBO. The permits are annual and non-transferable, costing the homeowner $250. The Town can suspend or cancel short-term rental permits if a property is deemed a nuisance, if the owner neglects tax or fee payments, or if more than two convictions for town code violations related to short-term rentals happen within a year, among other conditions.
Source: Town of Hilton Head Island
3
4
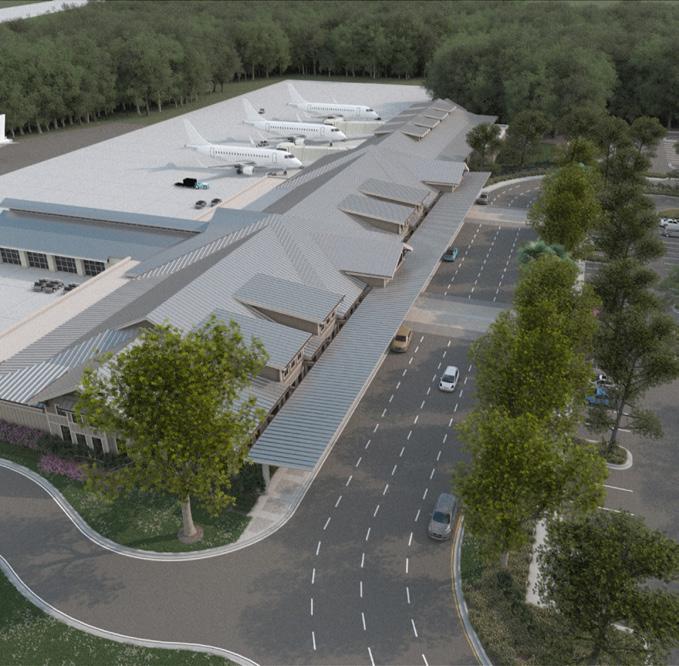
Hilton Head Island Airport (HHH) has played a growing role in local economic development since its 2018 expansion.
• The 2018 runway extension allowed HHH to accommodate larger airplanes traveling from further distances. Prior to the expansion, American Airlines was the only airline serving the Island; now the Island is also served by United Airlines and Delta Airlines.
• Passenger volume nearly tripled between 2018 and 2019. After a sharp decline in 2020, the volume spiked to a record-high of almost 350,000 passengers in 2021.
• While passenger counts in 2022 were down from the 2021 peak, the ~245,000 enplanements and deplanements was 10% more than in 2019.
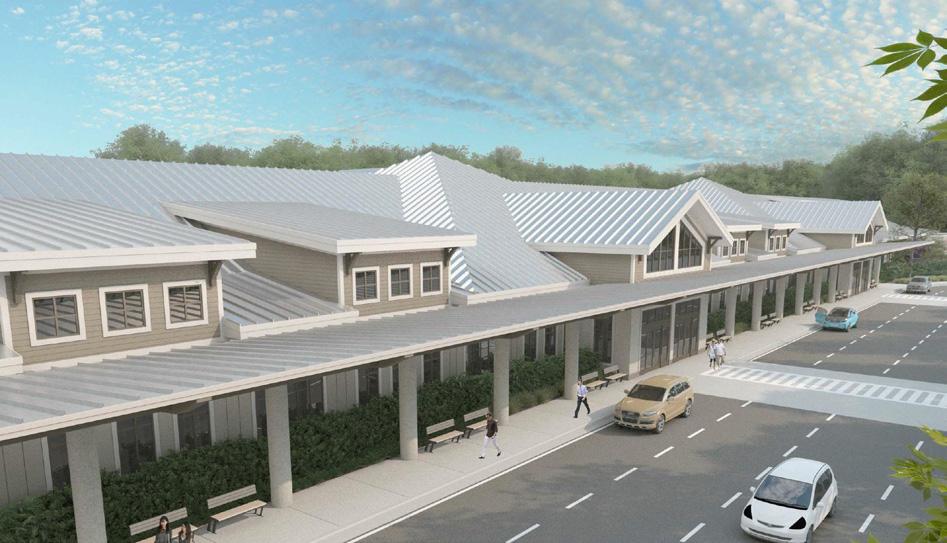
• HHH is planning a $53 million terminal improvement project that will add 43,000 square feet to the existing four-gate terminal that was built in 1956. The upgraded airport facilities will provide a more enjoyable experience for residents and visitors and will greatly increase daily flight traffic.
The local economy has recovered since the shock from the COVID-19 pandemic and historic trends are expected to continue.
• The number of jobs on the Island has held relatively steady, with the exception of 2020 when the economy was interrupted by business closures due to the COVID-19 pandemic.
• The local economy has since recovered and job growth over the next ten years is expected to be a continuation of recent trends. In the five years leading up to the pandemic, approximately 550 jobs were added.
PASSENGER INCREASE, 2020 TO 2021
%
Total passengers in 2021 reached a record high for Hilton Head Island
FUTURE ISLAND JOB GROWTH
5%
Jobs are forecast to grow through 2030, adding 1,000 new jobs
Flying in: The growing impact of Hilton Head Airport
Expanded airline capacity at HHH was the driving force behind a 145% increase in passengers coming to and from the airport in 2021. Passenger totals reached almost 400,000, surpassing even pre-pandemic numbers. With the proposed new terminal to come—bringing three gates, an expanded waiting area, and additional parking—Hilton Head Island’s tourism industry will continue to boom in the coming years.
Credit: Proposed Terminal Expansion, Beaufort County
Tourism has recovered and surpassed pre-pandemic levels, driving local revenues.
• According to a 2021 tourism impact report from the Hilton Head IslandBluffton Chamber of Commerce, visitor expenditures generated a total of $69.17 million in tax revenue in Hilton Head Island through the accommodations tax, the hospitality tax, and beach preservation fees.
• In 2021 the Visitor & Convention Bureau spent $1.82 million on destination marketing. For every dollar spent by the Bureau, an estimated return of $38.01 in local tax revenue was generated by visitor spending. From 2019 to 2021 the return grew by $22.11 per dollar spent, even as the Bureau’s annual spending decreased by $25,000.
TOTAL AND PROJECTED JOBS ON ISLAND
Source: Lowcountry Area Transportation Study; US Census; Kimley-Horn
HILTON HEAD ISLAND TOURISM TRENDS
Source: Hilton Head Island-Bluffton Chamber of Commerce and Visitor & Convention Bureau
ACCOMMODATIONS TAX REVENUE, 2021
$69m
Generated by spending on the Island and across the County
22,400 21,408
19,063
6
7
Non-tourism related jobs grew the most over the last two decades.
• While tourism has historically dominated the Island’s employment base, the overall total number of jobs in the industries most closely tied to tourism has declined in recent decades.
• The management of companies and enterprises, finance and insurance, and healthcare sectors have had the most growth.
• Construction is the industry that experienced the largest decline in jobs, driven by the slowdown in new development.
Several capital projects planned in and around Hilton Head Island are expected to impact economic output.
• Major capital projects on Hilton Head Island and around the region have the potential to impact economic output as they work to improve access and movement around the region.
SECTOR
SIZE & CHANGE, 2002-2019
and…
and…
and Insurance
Admin and Education
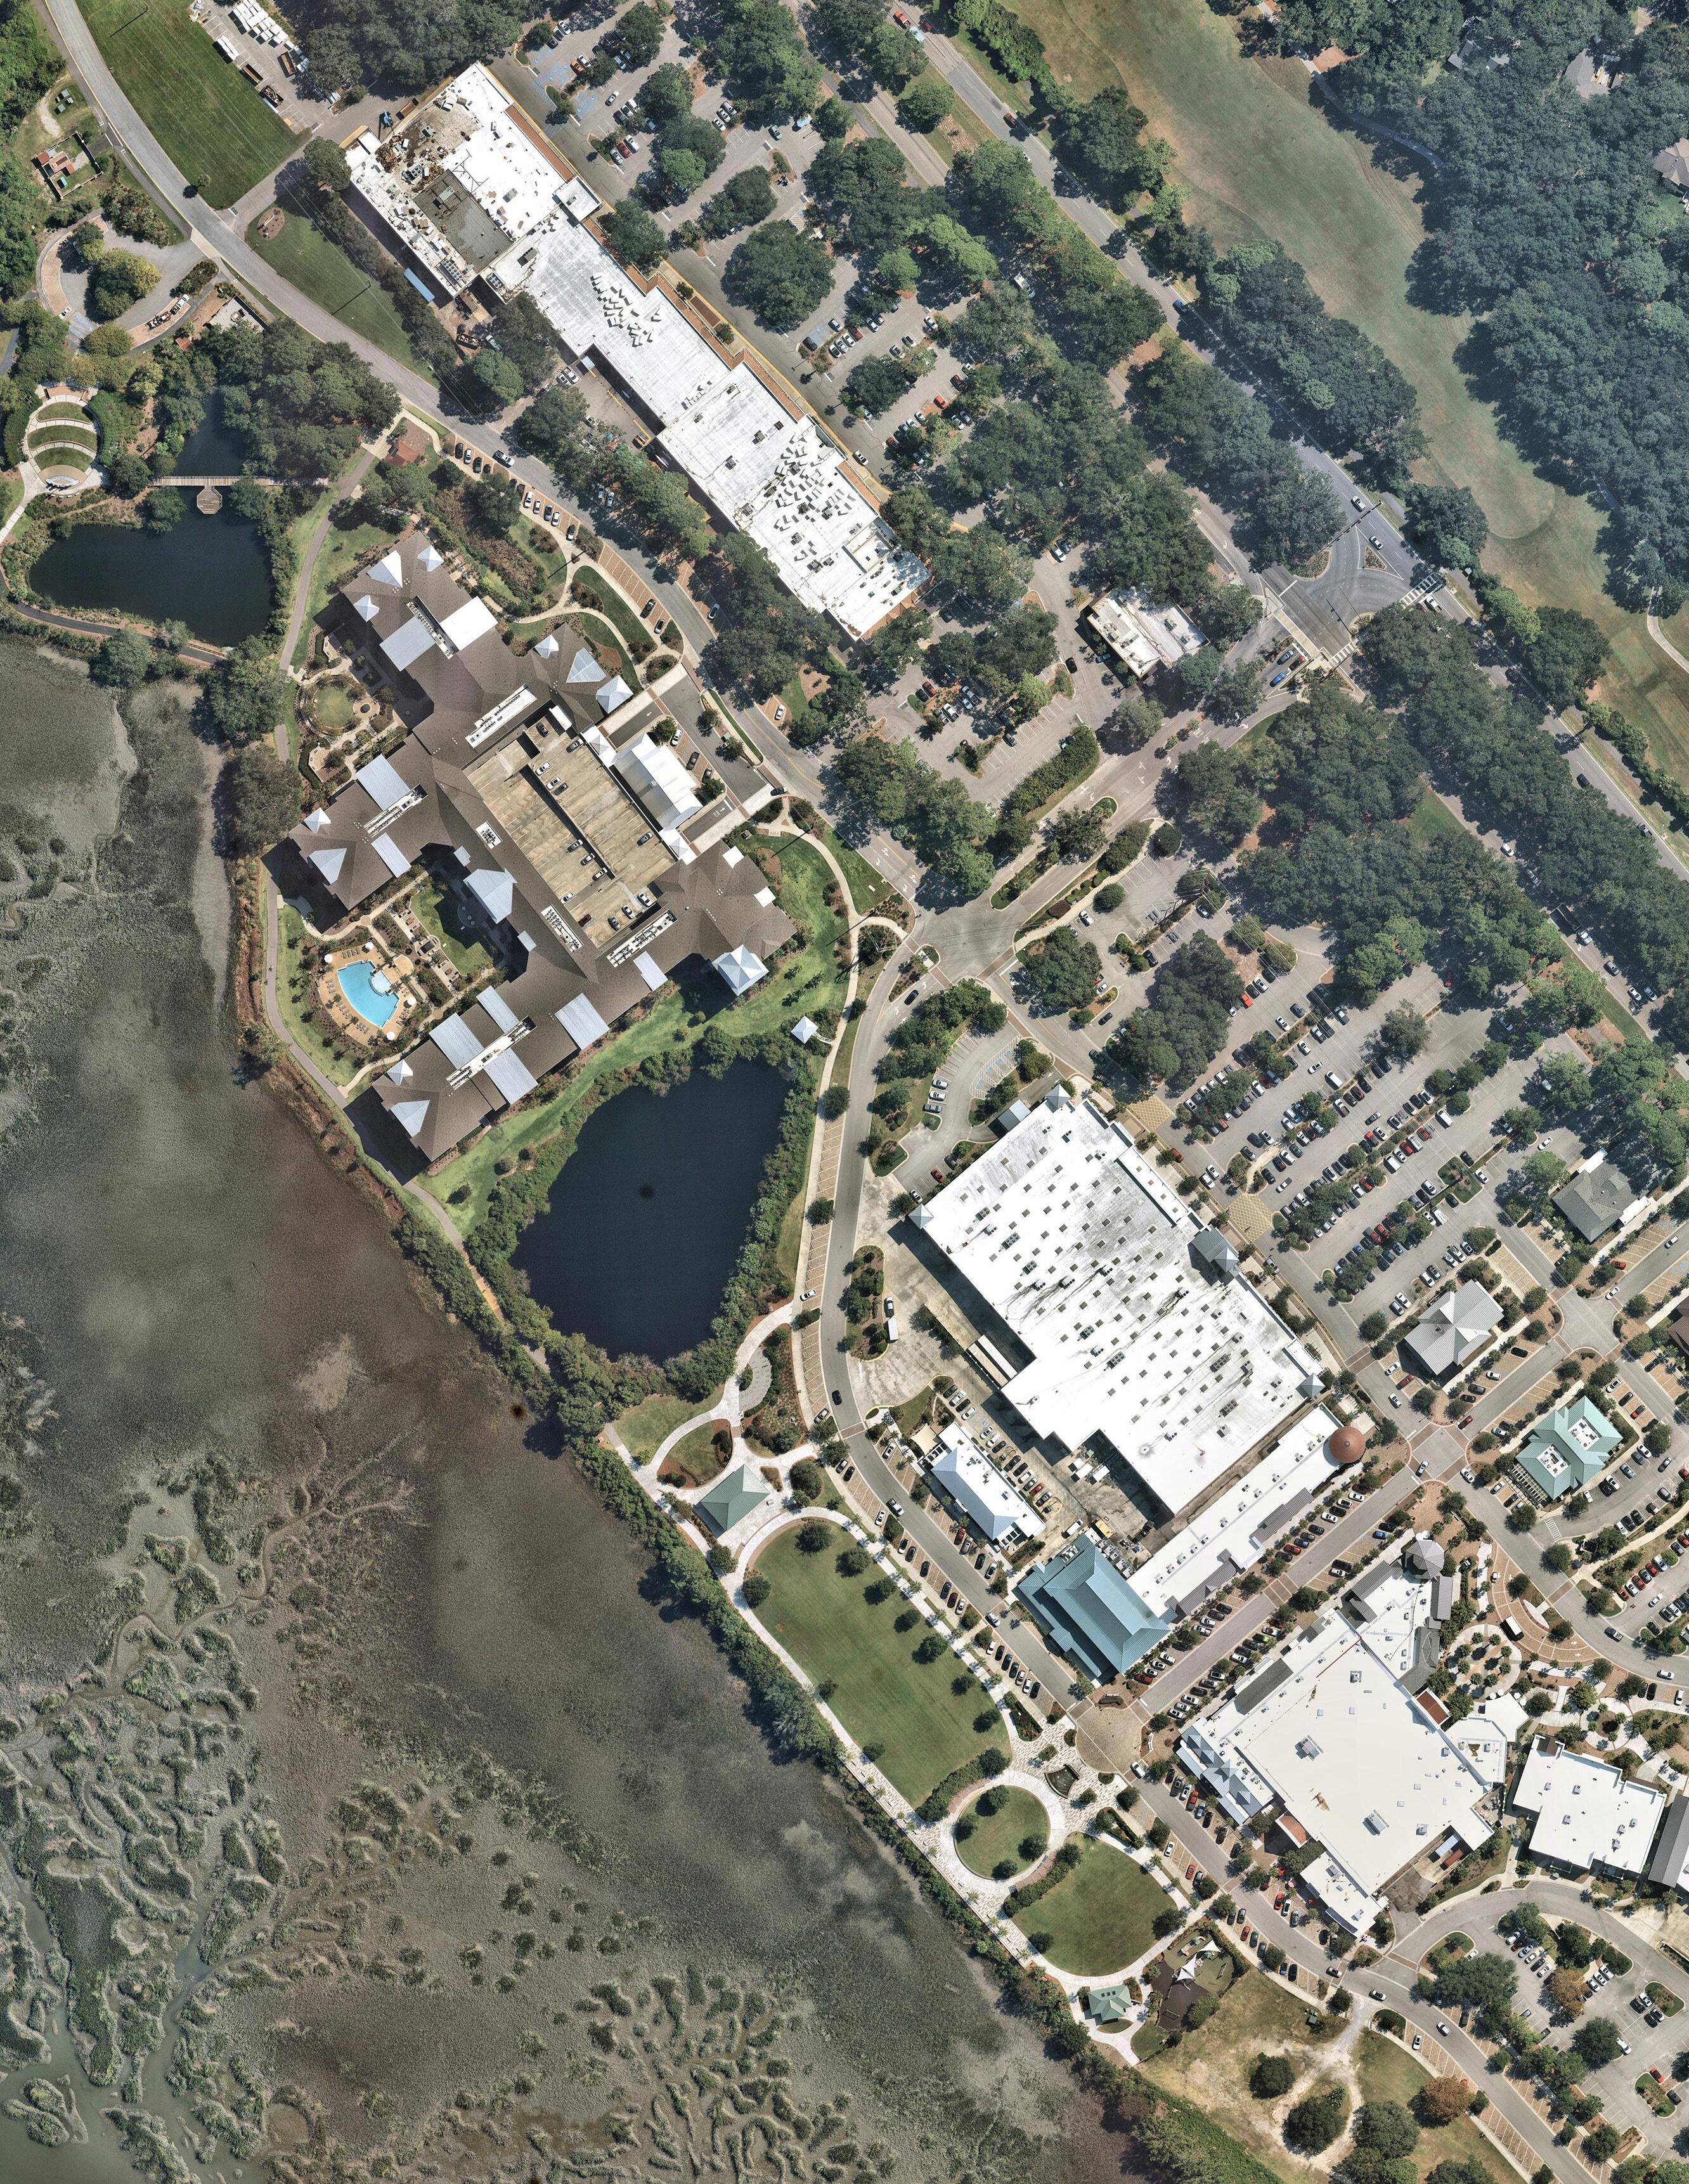
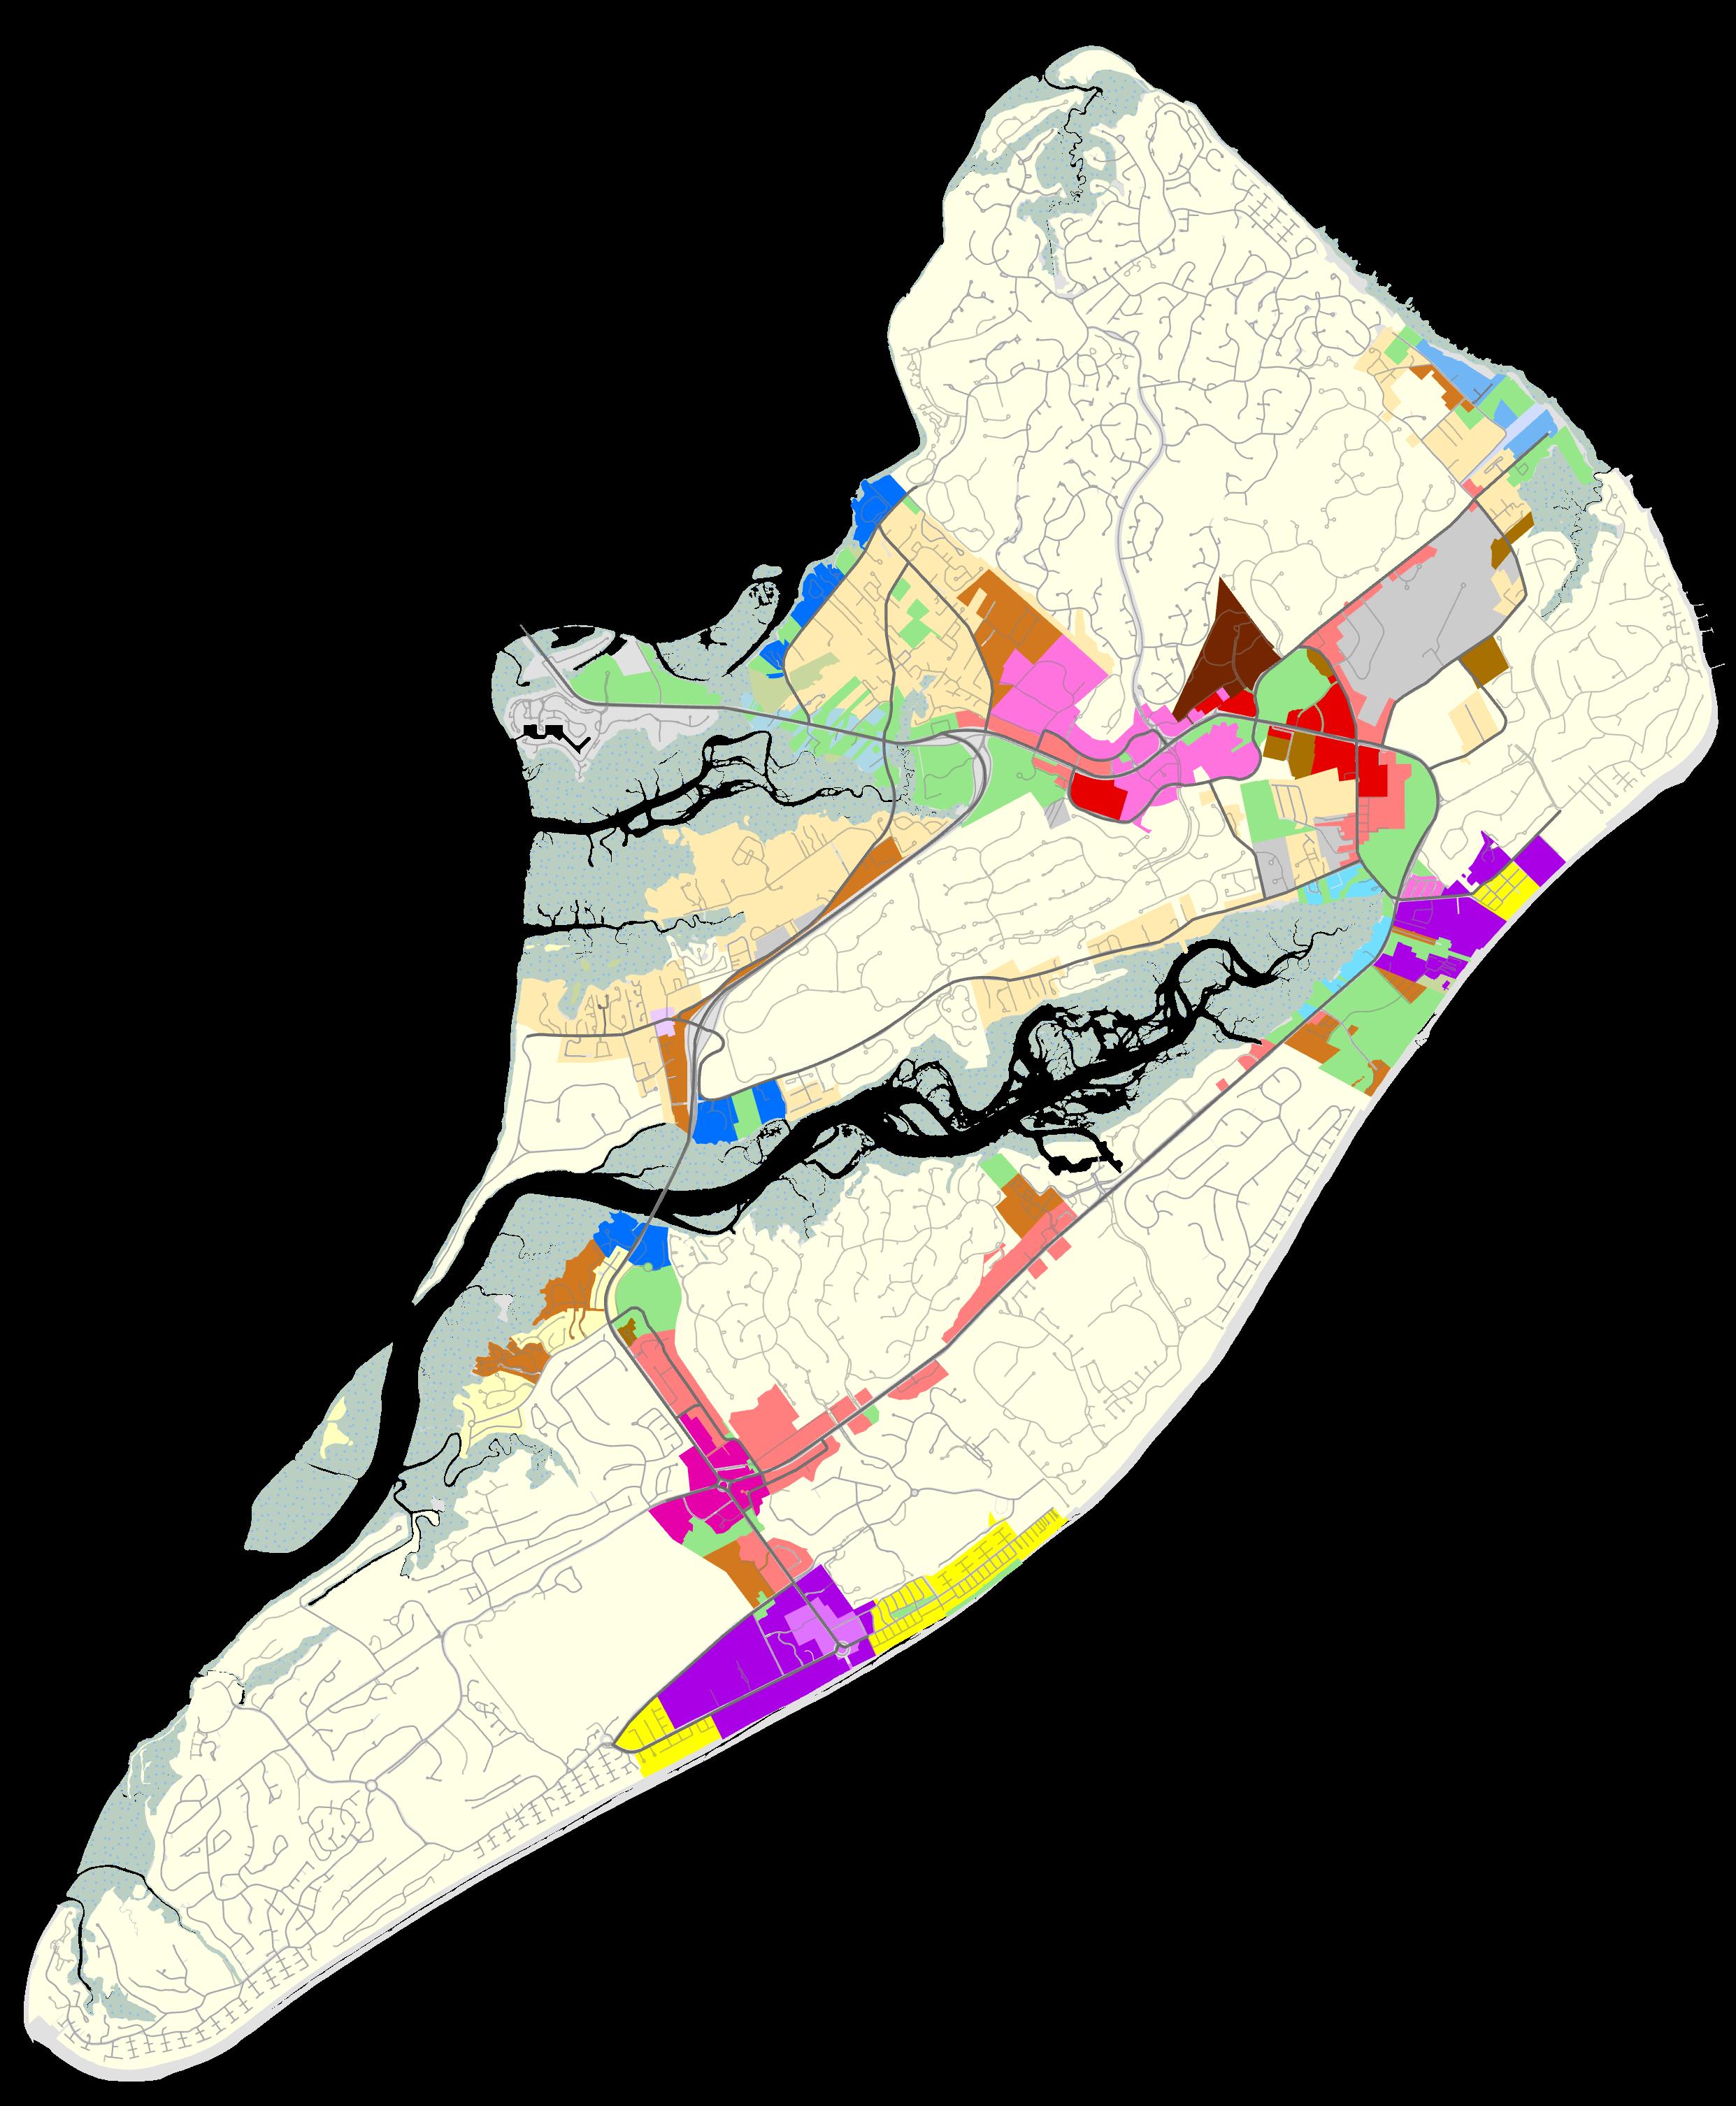
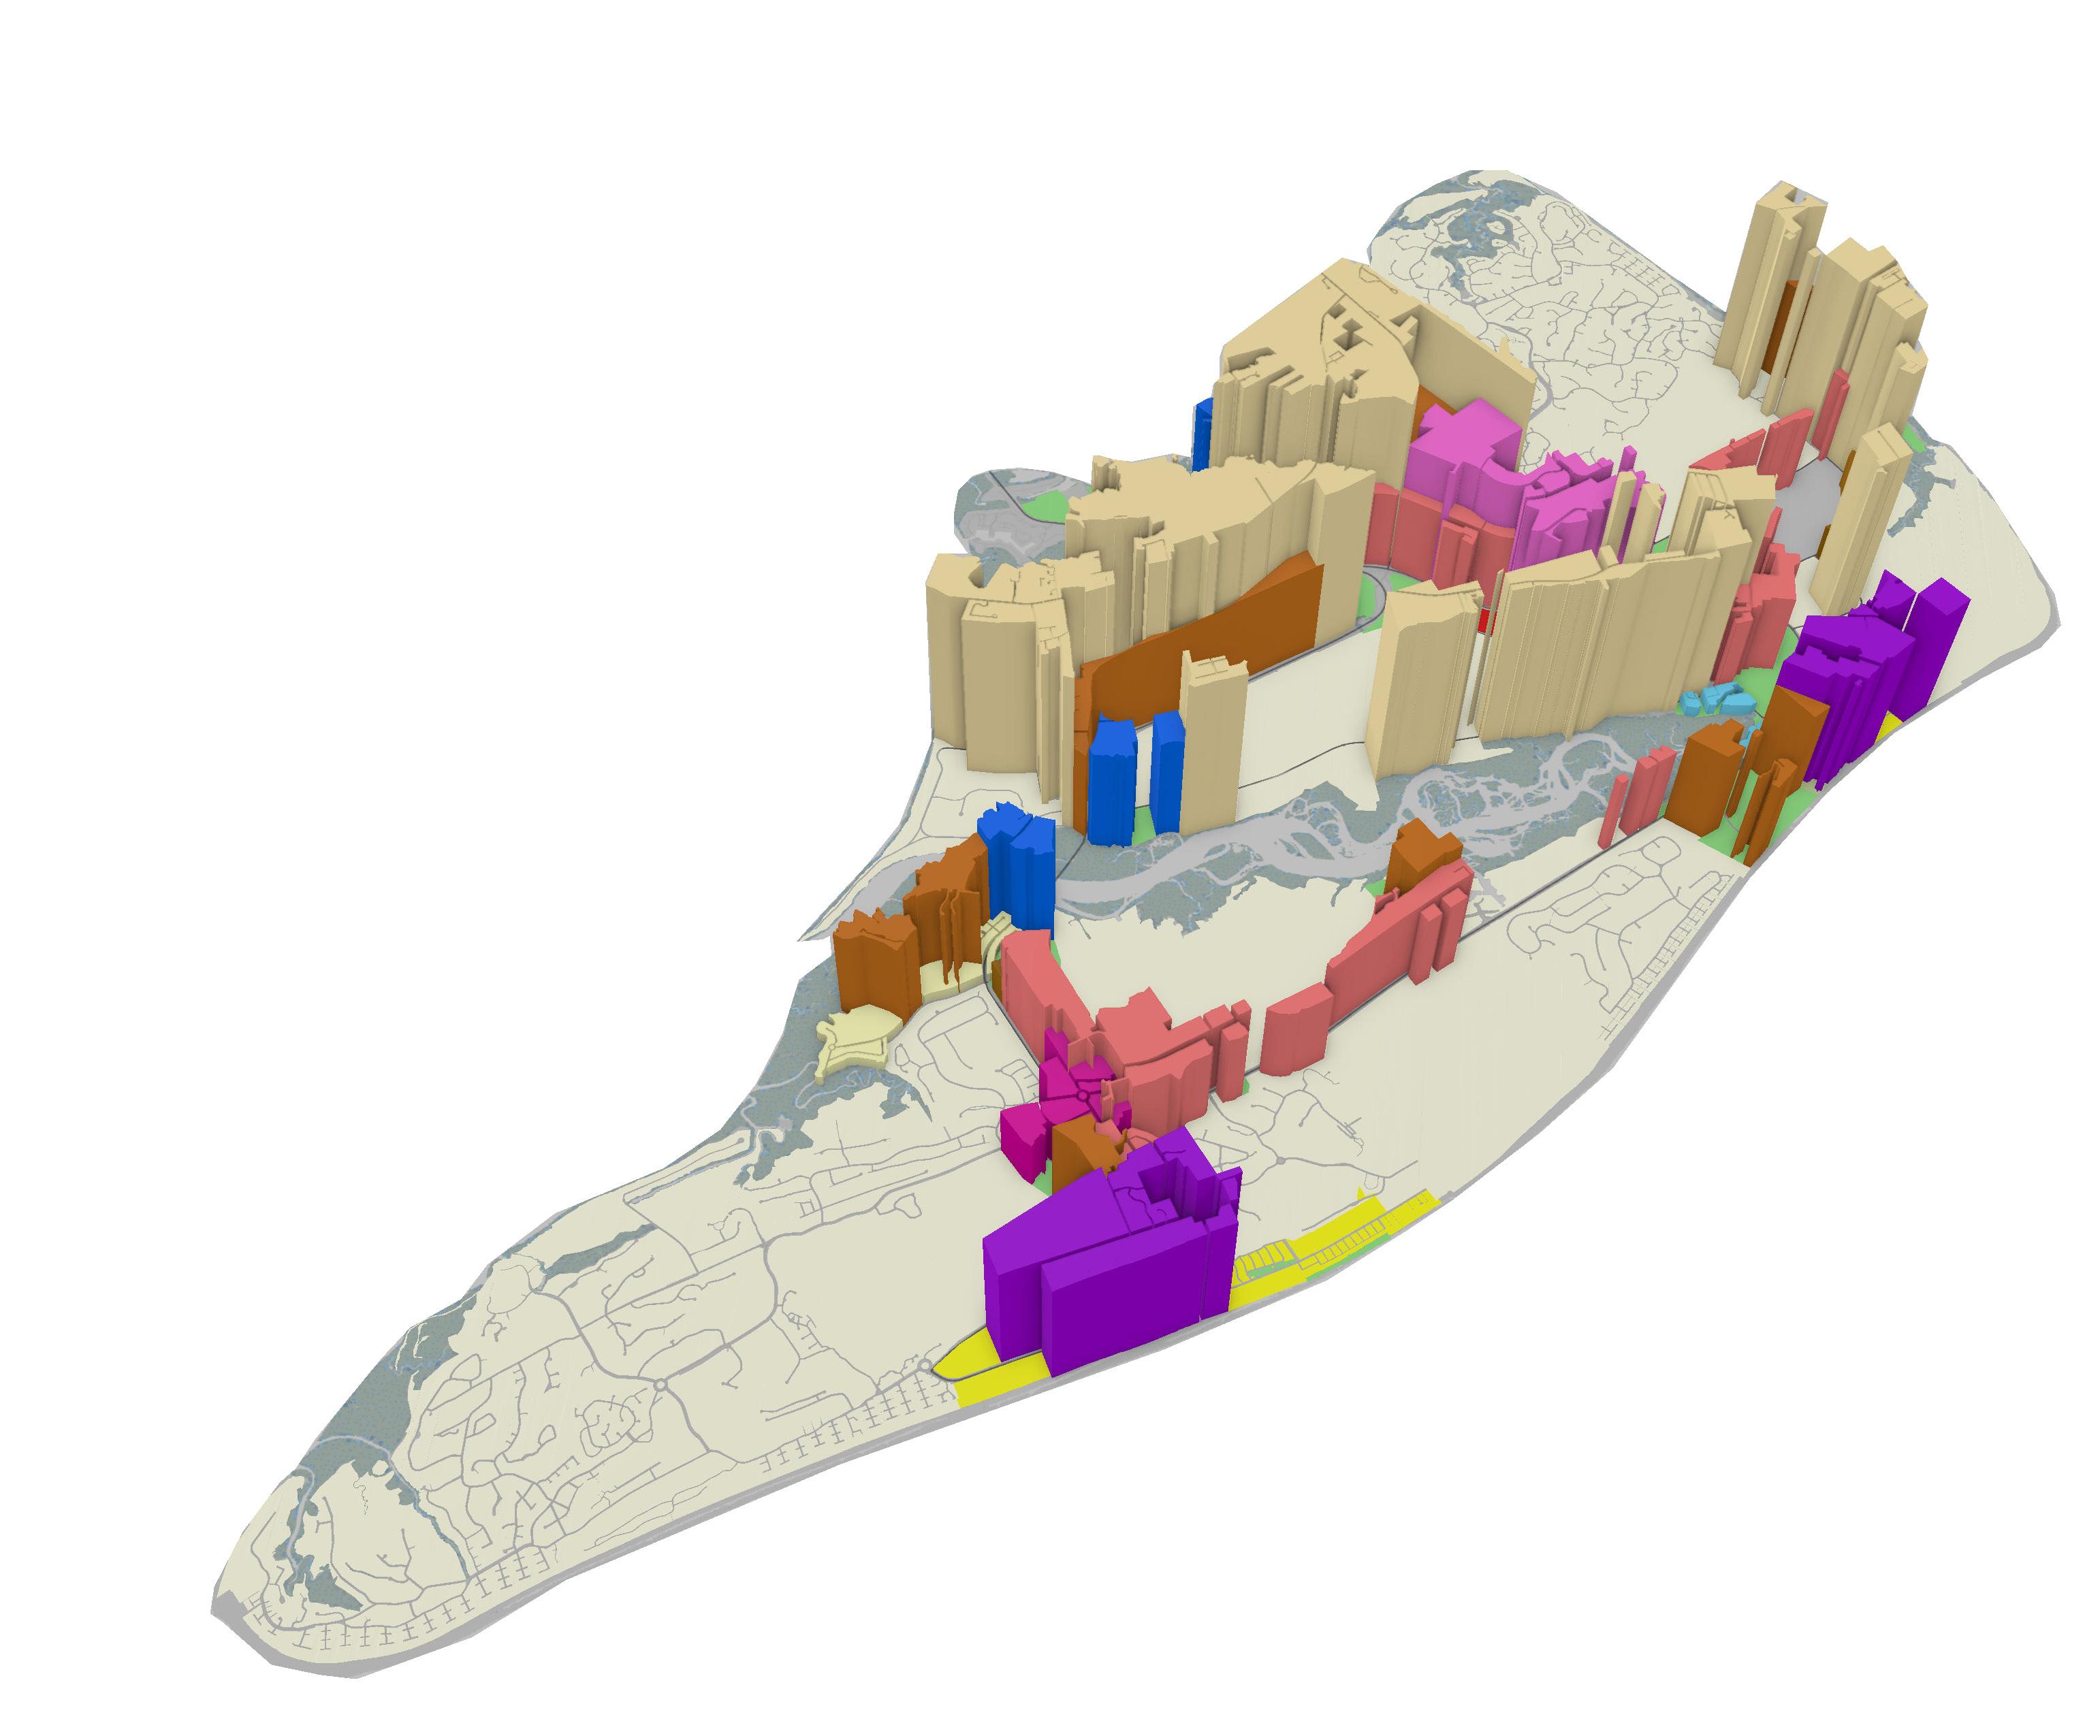
• The Mid-Island District Redevelopment Plan is a 103-acre parcel at the center of the Mid-Island District. It is slated for cultural, commercial development, and industrial uses.
Source: US Census Bureau, 2000 to 2021 Censuses, Primary jobs only
• The 278 Corridor Project, proposed by Beaufort County and SCDOT, could reduce congestion and improve access to Hilton Head Island by replacing the mainland bridge to the Island. While funding has been identified for the project, the proposed single bridge is still being studied and negotiated between the Town and County.
• While not directly impacting the Island, the proposed Jasper Ocean Terminal (JOT) is a marine container terminal that would be built on a 1,500-acre site along the north bank of the Savannah River and is anticipated to accommodate the forecasted cargo throughput into the region over the next 35 years. As a result, there is an industrial development boom happening in Jasper County.
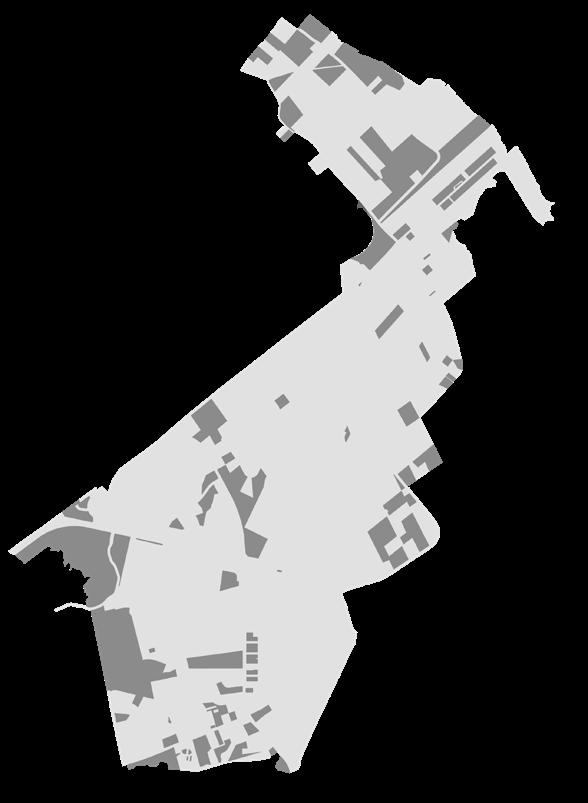
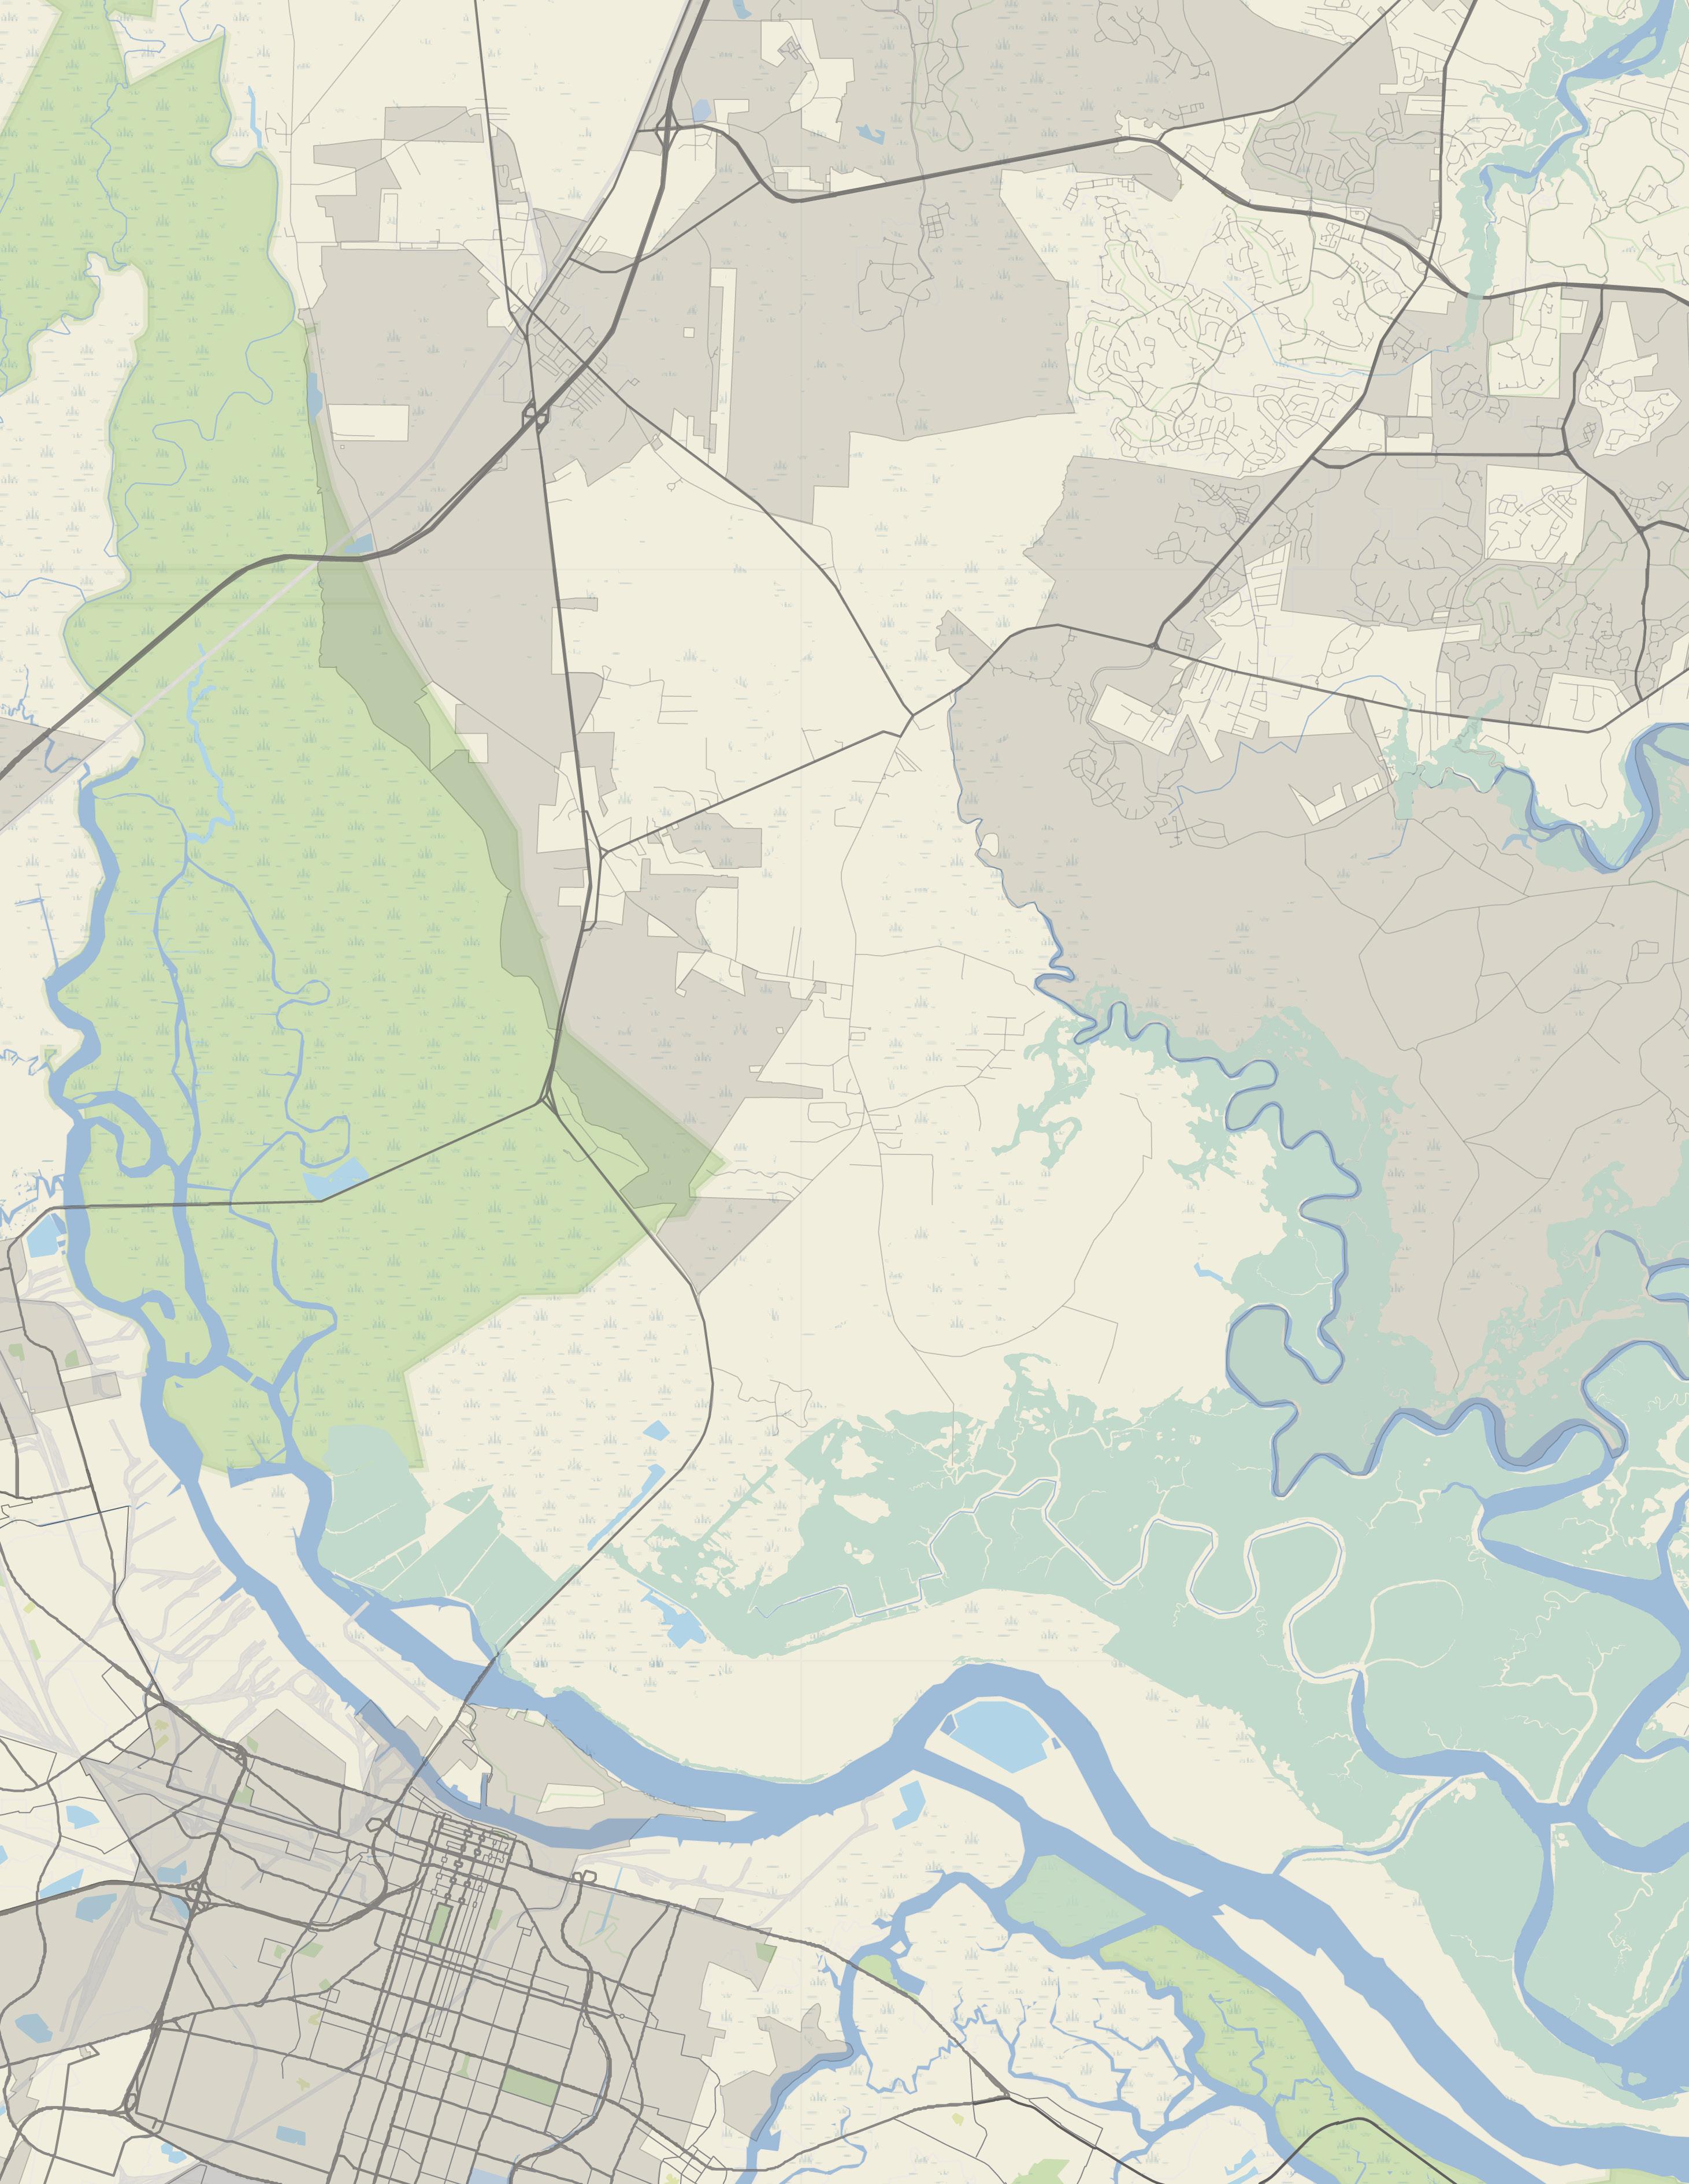
JOB CENTERS AND MAJOR PROJECTS
The Jasper Ocean Terminal When completed in the 2030s, the Jasper Ocean Terminal would add a deepwater, 15-berth port system to the north side of the Savannah River and effectively double the capacity of the region’s overall port system. This project will have huge economic implications for the entire Lowcountry region.
WHP Gateway Corridor Project
The proposed increase in capacity and improvements will have an impact on commuting and mobility for residents and workers.
TOTAL ESTABLISHMENTS / BUSINESSES (2023)
2,514
The retail trade as well as accommodation & food services have the largest numbers of establishments on the Island
This includes a new 3-gate terminal that will allow increased travel to the area as well as amenities to make traveling more comfortable.
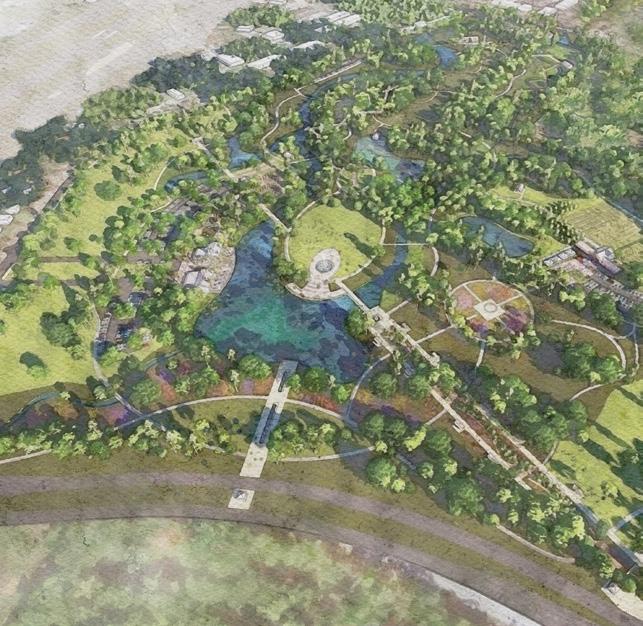
Mid-Island District Plan
The plan establishes a clear vision for commercial redevelopment in the area that will leverage a major public park investment at the Mid-Island Tract.
TOP ISLAND EMPLOYERS (2021)
Source: Esri, Business Analyst
Source:
REAL ESTATE
Understanding the dynamics, the real estate market helps to expose the present and emerging pressures playing out within, and working to change, a community. The Island’s market is unique in many ways and this section deals with the trends within this system.
KEY TRENDS
Large-scale development on Hilton Head Island has taken place over a series of waves starting in the 1960s. Each of these eras conveyed its own unique profile and mix of architecture and land uses. When picturing the Hilton Head Island market, one may think first about resorts and short-term rentals, restaurants, and boutiques catering to visitors. There is, however, a sizable and dynamic inventory of commercial properties that are not directly connected to the to the hospitality economy. The vitality of these segments will come under increasing scrutiny as the amount of undeveloped land decreases.
This topic explores several of the key trends related to the real estate market on Hilton Head Island and how these dynamics shape the experience of residents, workers, and visitors on the Island.
1
2
3
4
5
6
7
8
9
Hilton Head Island’s real estate is mostly comprised of residential properties, and its stock has grown slowly in recent years.
A majority of the residential real estate inventory on the Island is locally owned.
Nearly all the development in the last year has been single-family homes.
Multifamily rental options on the Island are very limited.
Healthcare is the leading office tenant, occupying close to one-third of available square footage.
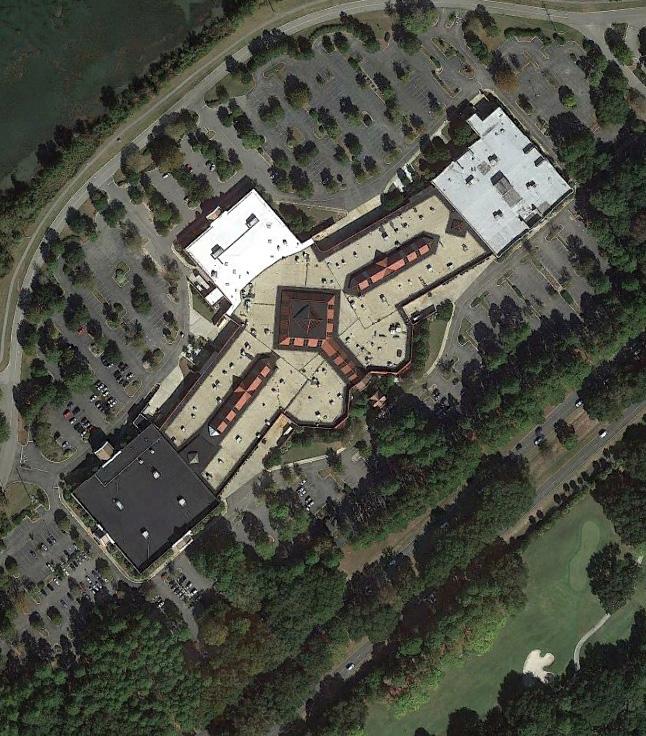
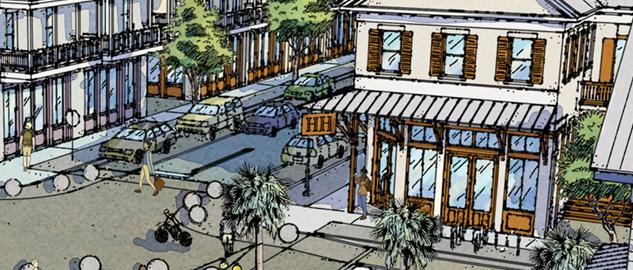
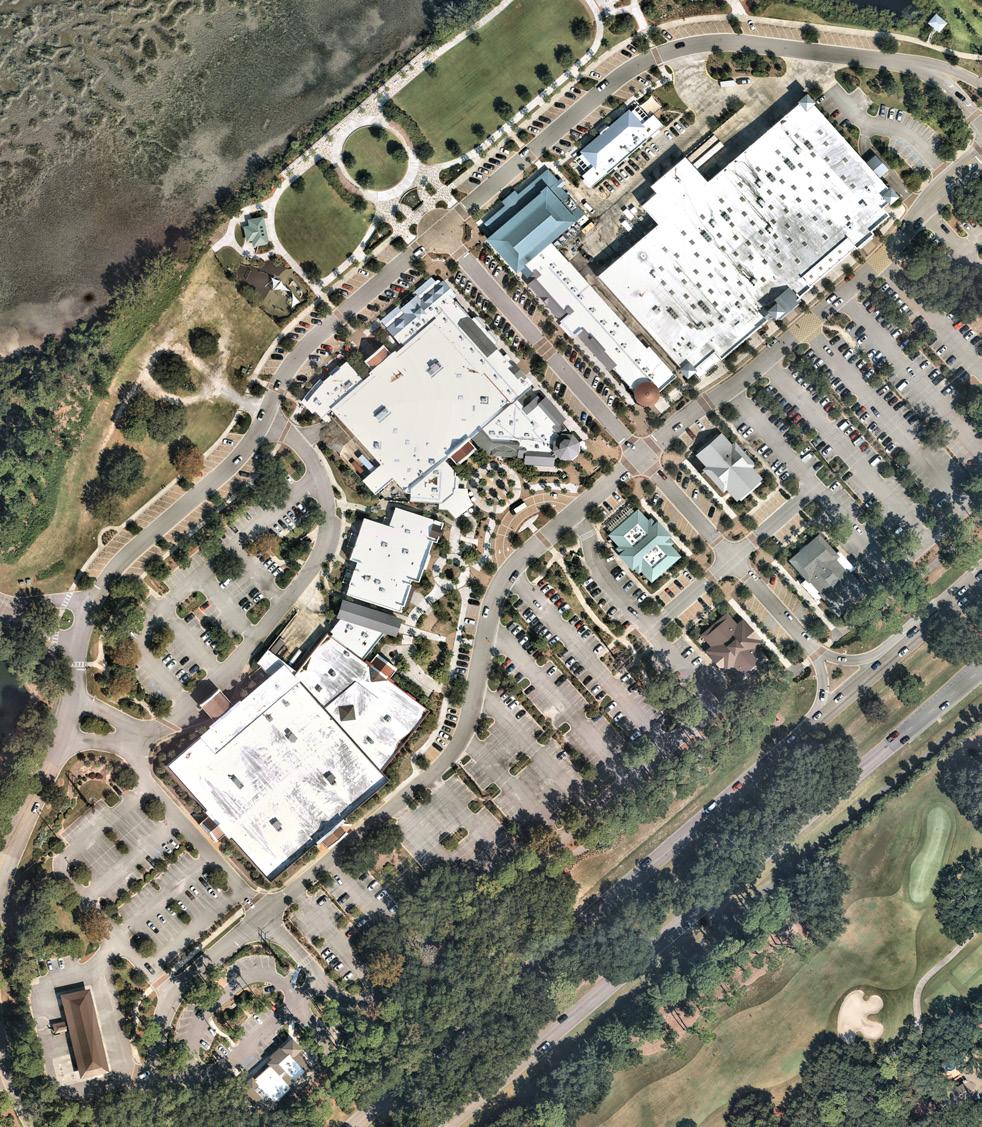
Nearly all new retail space over the last decade is hosted at Shelter Cove Towne Centre and Sea Turtle Marketplace.
Vacancy across retail and office properties is increasingly volatile and trending upward.
Peak and shoulder seasons for visitors are lengthening.
The market is growing for year-round residents and a longer visitor season.
90.6 MILLION SQUARE FEET
Total Island market real estate
Residential properties account for 76% of the total Island real estate, or close to 69 million square feet. This segment grew by 7% from 2016 to today, adding an additional 2.8 million square feet of property across large- and small-scale projects. Commercial properties make up the balance of the market, accounting for 10.5 million square feet in 2023, a small decrease from 2016 in terms of both share and total. Commercial real estate is concentrated along William Hilton Parkway and Palmetto Bay Road.
The opening of the existing four-lane bridge in 1982 kicked off the most booming decade of development on the Island. Approximately 40% of current retail, office, and hospitality space was built during this decade alone. More recently, infill residential development has been distributed across the Island, while non-residential development is heavily concentrated along William Hilton Parkway and Palmetto Bay Road. Almost 25% of office space and 20% of retail space is located within a half-mile of the area between Sea Pines traffic circle and Coligny Plaza.
TOTAL
REAL ESTATE INVENTORY, 2013 TO 2022
Source: CoStar, Beaufort County Auditor
While retail and office spaces boomed following the opening of the bridge, commercial construction has since slowed down. Credit: Hilton Head Properties
Most residential property is owned locally; commercial ownership is more commonly off-Island.
• As of March 2023, approximately 57% of all square footage on the Island is locally owned, up from 55% in 2016. When broken down by property type, 60% of residential square footage versus 48% of commercial square footage is locally owned.
• Both residential and commercial shares of locally owned properties are up from 2016, indicating the Island’s growing attractiveness for year-round residence.
• Properties with international owners, nearly all of which are residential, make up less than 0.5% of the total square footage. The amount under international ownership declined by more than 50% between 2016 and 2023, likely influenced by the travel restrictions imposed at the onset of the COVID-19 pandemic.
REAL ESTATE TOTALS BY LOCATION OF OWNER, 2023
Source: Beaufort County Auditor
ESTATE TOTALS BY LOCATION OF OWNER, 2023
Source: Beaufort County Auditor
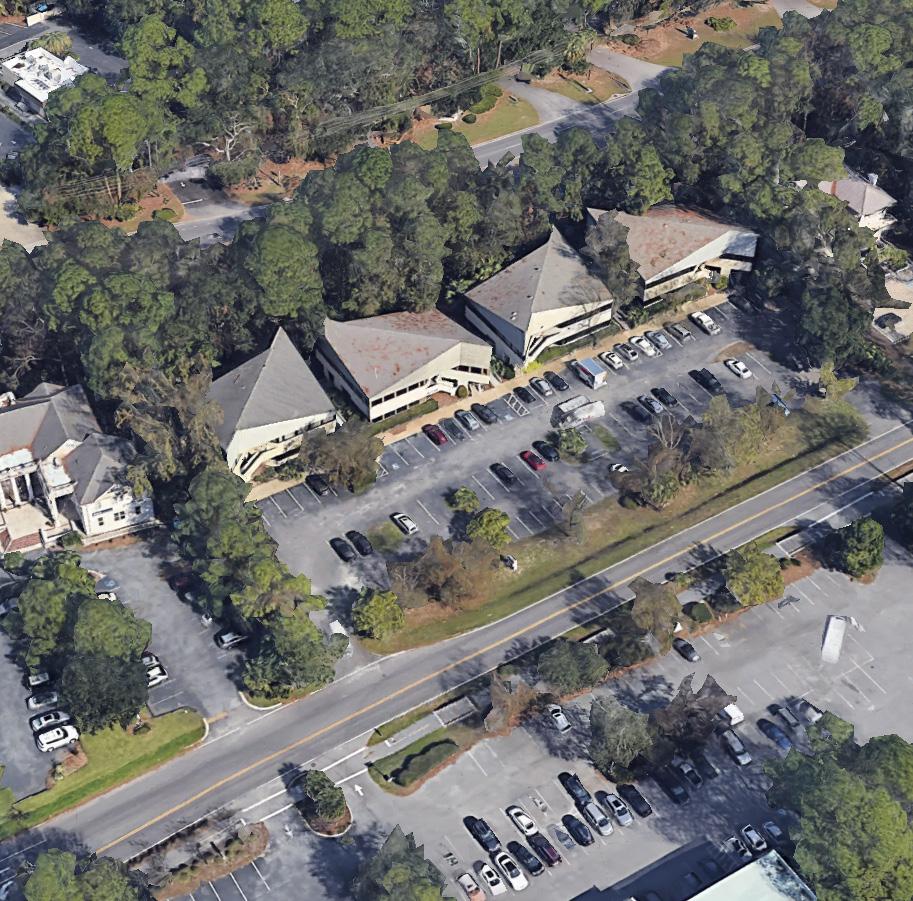
OFFICE REAL ESTATE SQUARE FOOTAGE BUILT SINCE 2010
<1%
Much of the office space on the Island is aging and new product is not being delivered
3
Nearly all the development in the last year has been single-family homes.
• Between April 2022 and March 2023 there were 153 building permits issued for new structures. Nine were for accessory structures, ten were for commercial structures and the remaining 134 were single family homes.
• There is a 166-unit timeshare resort awaiting permit approval that is proposed for the property formerly known as the Port Royal Racquet Club Tract at 15 Wimbledon Court.
• There is approximately 4.5 million square feet of non-residential space in the regional pipeline. Nearly 85% of the square footage under development is industrial space in Jasper County in anticipation of the proposed Jasper Ocean Terminal port project.
Square footage in new residential units on the Island significantly outpaced commercial development
4
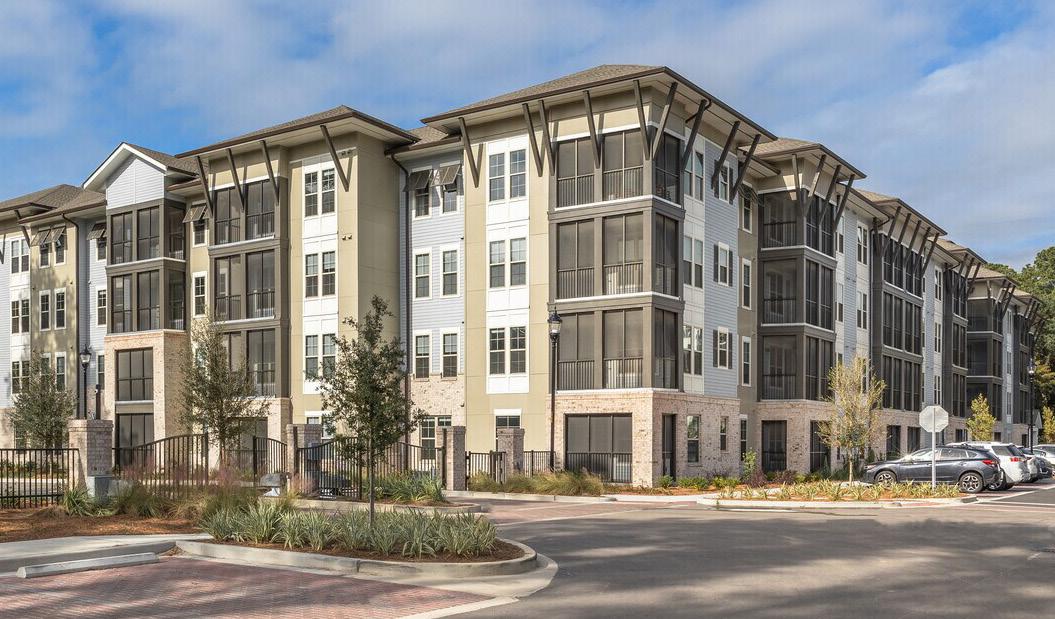
Island multifamily rental options are very limited.
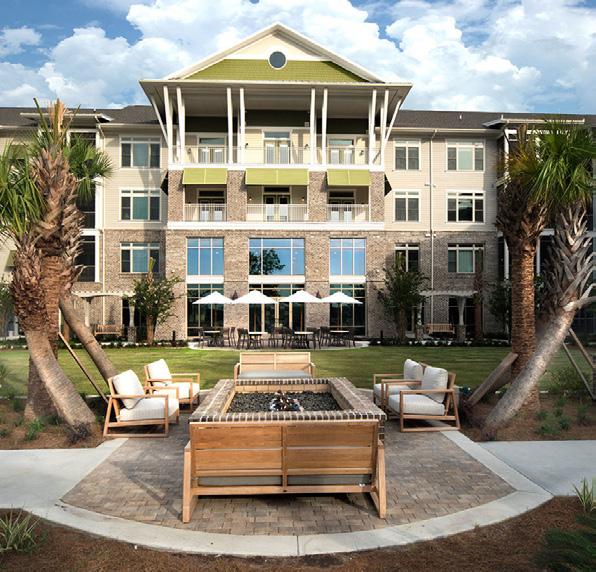
• On the Island, there are five market-rate apartment rental communities—55 Gardner, 7 Lagoon, 90 Dillon, Sandalwood Terrace, Sylby Tub, and The Glen. Two are dedicated to senior housing, Hilton Head Gardens and Cedar Well Apartments.
• Aquatera, where rent averages $3,174 for a 2 bedroom, and Water Walk at Shelter Cove, where rent averages $3,633 for a 2 bedroom, are the sole market-rate multifamily rental communities built in the last twenty years, completed within the past five years.
• In the past decade, monthly rent has increased by nearly 40%, and in 2022, the average rent exceeded $2 per square foot for the first time, influenced by the introduction of Aquatera.
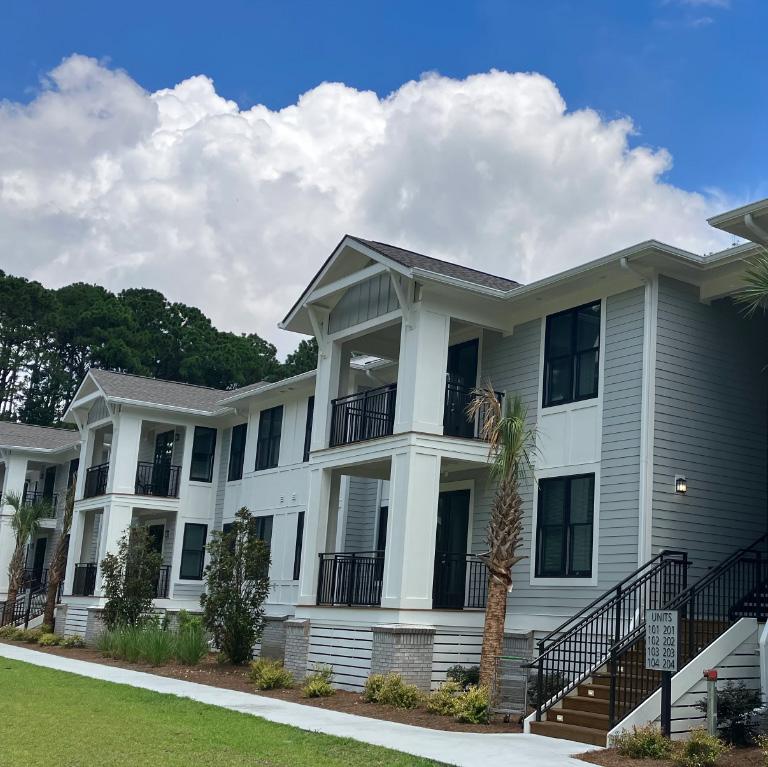
Aquatera: The Future of Multifamily?
With so little residential construction the past decade, the Aquatera multifamily development stands out for a number of reasons. The development has larger and more variable floor plans compared to existing multifamily products, and is fully amenitized with modern, luxury finishes. The associated escalation in rent is more in line with a similar process taking place in market-rate rental properties on the mainland in new developments like Buckwalter.
CO.
HILTON HEAD ISLAND
Credit: Aquatera Hilton Head
5
6
Healthcare is the leading office tenant, occupying close to one-third of total office square footage.
• The Town hosts approximately 1.8 million square feet of office space. Healthcare users account for 30% of the total office square footage. The next three most prevalent types of office tenants are in finance and insurance, professional services, and real estate.
• Less than 10,000 square feet of on-Island office space has been completed over the last decade, making it the least active commercial real estate sector when compared with retail and hospitality. The limited addition of new space has resulted in a tightening of the market with an average vacancy of 4.3% over the last decade.
Nearly all new retail space is hosted at Shelter Cove Towne Centre and Sea Turtle Marketplace.
• There is approximately 3.4 million square feet of retail space on the Island.
• The amount of retail space per permanent resident increased over the last ten years, primarily due to plateauing population growth and the opening of Shelter Cove Towne Centre and Sea Turtle Marketplace, which represent nearly all the new retail space completed during this period.
• Almost 85% of the retail inventory was built prior to 2000, with limited renovations.
• Vacancy has remained relatively low over the last decade, ranging from 2.4% in 2015 to 7.1% in 2021, when more space was vacated than leased following the onset of the COVID-19 pandemic. Generally, the Island’s older retail properties have higher vacancy rates and lower rents than the newest spaces.
SHARE OF REGIONAL OFFICE SPACE ON-ISLAND
40%
Nearly half of the Hilton Head Island MSA office product is located on Hilton Head Island
TOTAL RETAIL SQUARE FOOTAGE
3.4m
Located on Hilton Head Island
Growing competition? While a significant share of the Hilton Head Island MSA’s office product is on-Island, rent demand growth is slowing. Off-Island product is newer and more proximate to the larger region. Less than 10k square feet of office properties have been completed in the last ten years, compared to 280k total in the MSA.
Hilton Head Island MSA
Vacancy across retail and office products is increasingly volatile and trending upward.
• Following national trends, the vacancy rate among retail-oriented buildings on the Island has increased over the previous five years from 4.7% in 2017 to 7.1% in 2021. The COVID-19 pandemic had similar effects across the country.
• 2022 numbers showed initial signs of a recovery, but rent demand for retail uses is also in decline, especially among older buildings on the Island.
• The lack of newer office product (less than 10k square feet delivered from 2013) has flattened rent demand among the Island’s properties, but vacancy remains relatively low at 2% in 2021. This is consistent with the broader MSA; however, regional development of office properties picked up significantly over this period, adding 280k square feet from 2013.
RETAIL
VACANCY RATES & RENT DEMAND COMPARISONS
PERCENT DECREASE IN RETAIL RENT, 2013 TO 2022
7.6%
Rent for retail product has decreased by 7.6% on Hilton Head Island from 2013 to 2022.
Source: Costar
8
9
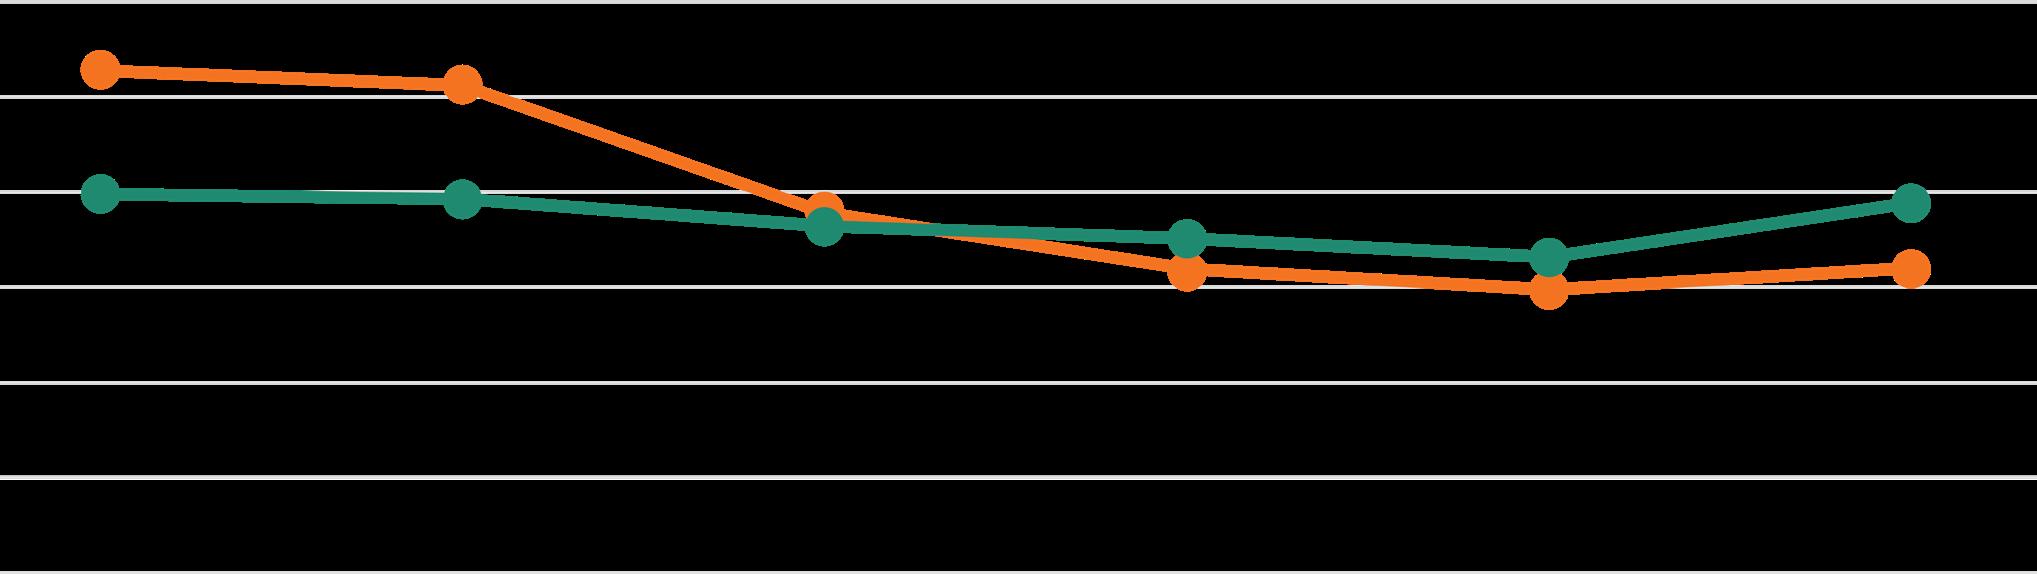
Peak and shoulder seasons for visitors are lengthening into a year-round market.
• The off-season average daily rate nearly doubled over the past decade, while the peak season average grew by 75%. During the offseason between September 2021 and April 2022, the average daily rate was $208, compared with $291 during the 2022 peak season.
• Approximately one-third of visitors rent villas or homes and another quarter own second homes on the Island, while hotels and resorts hosted approximately 18% of visitors in 2021.
• The difference between average peak season and off-season occupancy rates have also narrowed over the past ten years, shrinking from a variation of more than 25% to one of 18% by 2022.
The market is growing for year-round residents and a longer visitor season.
• While population growth has plateaued in recent years, the shift to a more permanent resident population will influence the real estate market.
• Businesses supporting the flourishing tourism economy will continue to be in demand, but there is also a growing need for businesses offering services and goods that support residents’ everyday lives.
• As aging properties become obsolete, especially those in key locations along William Hilton Parkway, they become more attractive for redevelopment.
Managing short-term rentals
LODGING TOTALS
~5,400 hotel rooms across 30 properties
~7,000 short-term rental units
40% hotel rooms owned by Marriott (e.g., Marriott Hilton Head Resort and Spa, Springhill Suites)
24% rooms owned by other hotels and resorts
36% rooms independently owned
Average Daily Rates, 2022 Off-season: $208 Peak-season: $291
Source: Kimley-Horn
Starting in 2023, all short-term rental properties are required to obtain a yearly permit from the Town. This includes any privately owned residential property used as a vacation home and rented to transient occupants for periods of less than 30 days. The purpose of the permit is to “minimize the adverse effects of rental uses on surrounding residential properties and neighborhoods, and to preserve the character, integrity, and stability of residential neighborhoods” (HHI Code of Ordinances, Sec. 10-2-10).
Credit: Conde Nast Traveler
NATURAL & CULTURAL
ENVIRONMENT
The natural and cultural environment are at the center of the Island’s identity. This section presents trends within each critical system.
KEY TRENDS
This section focuses on the Island’s environment and large-scale phenomena like climate change. It also considers important information related to the cultural legacy of the Island’s early residents.
Over centuries of settling and modern development, residents have learned to work with the Island’s unique systems and ecology. It can be a difficult task: a barrier island like Hilton Head Island moves with the wind, the tides, and time. Its systems, like its people, evolve. Leaders have found success when working with, rather than against, the Island dynamic. These ebbs and flows—like the tidal rhythm—are what make the Island so unique and so cherished.
1
2
3
4
5
6
7
8
Sea level rise will increase the pressure on Island systems and will require ongoing, proactive monitoring and management.
Secondary impacts of climate change affect multiple environmental and ecological systems.
Water quality is responding positively to pollution mitigation efforts.
The Island’s canopy cover percentage far outperforms similar communities and is growing.
Protection and conservation practices and programs have a direct, positive impact on wildlife.
The Island’s beach management and renourishment practices are critical long-term investments.
The Town has committed to providing best-inclass parks and recreation resources.
Cultural sites continue to be an important asset and underscore the urgent need for neighborhood preservation.
2 feet
Potential sea level rise by 2050
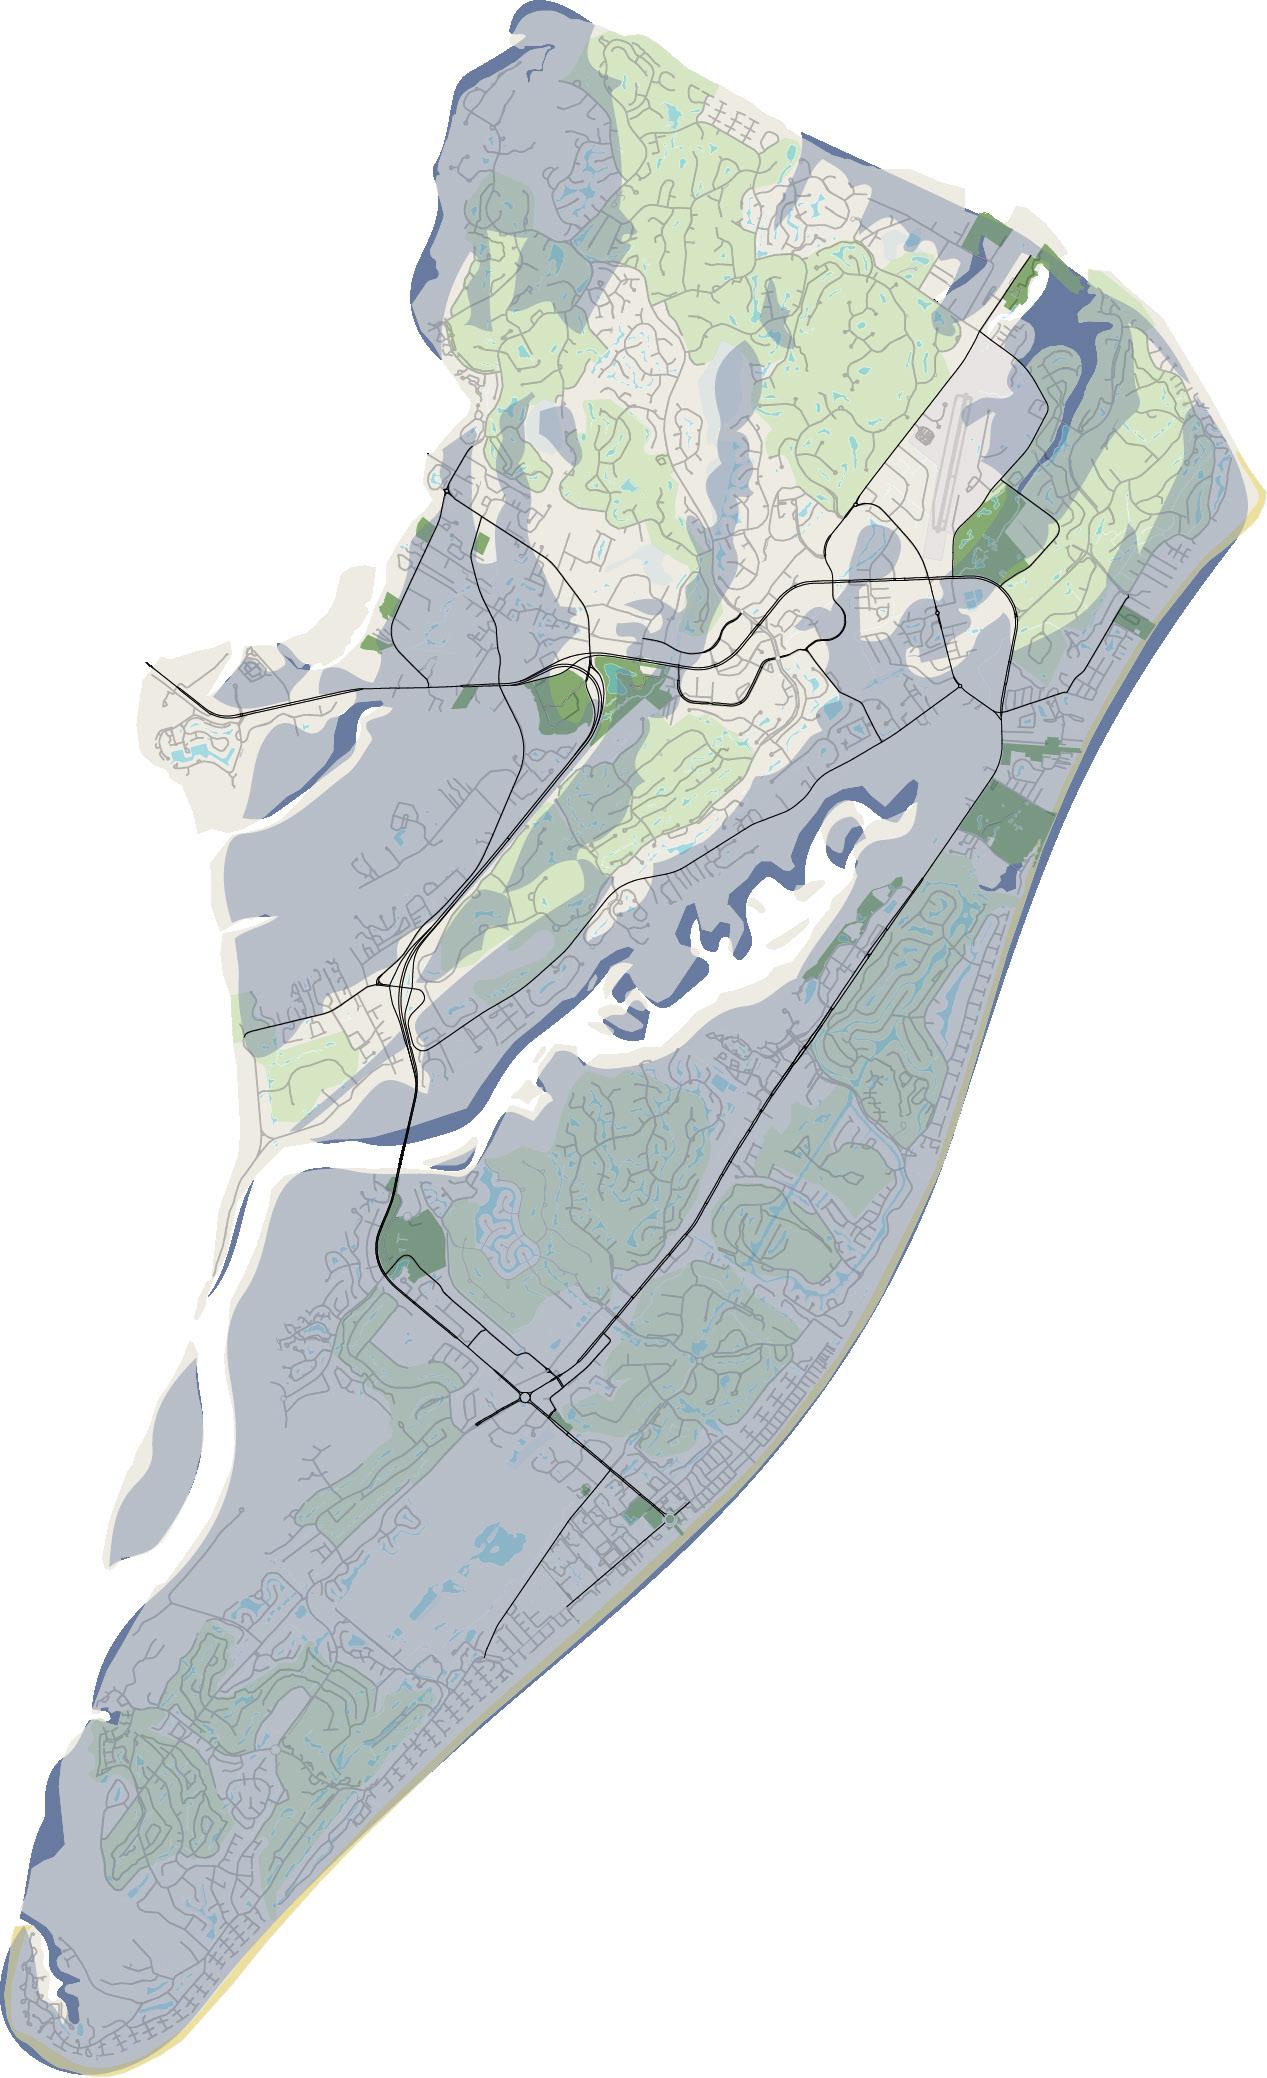
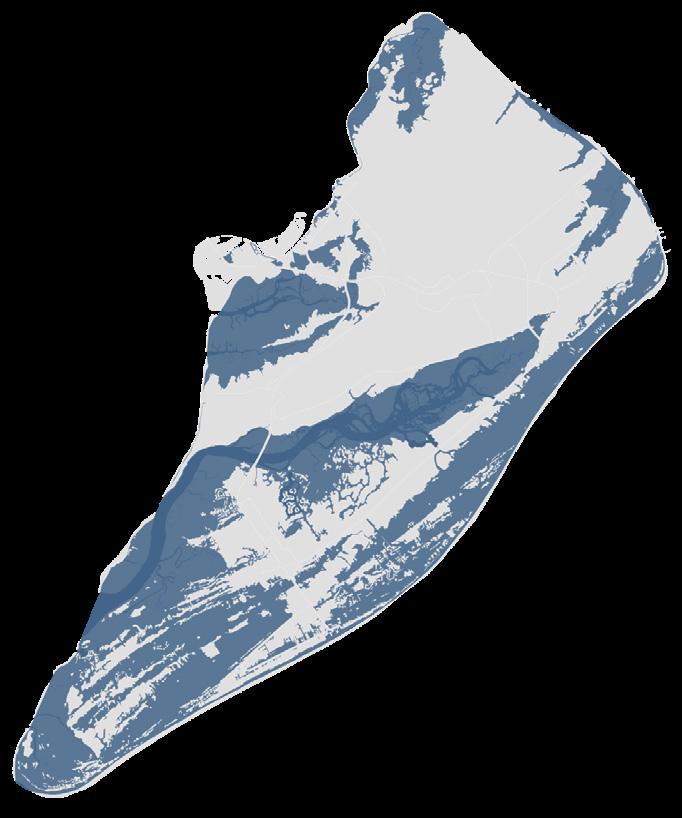
CATEGORY 2 HURRICANE STORM SURGE UNDER 2050 CONDITIONS
In the next several decades, climate change could bring about a global sea level rise as temperature averages increase and polar and glacial ice recedes. As a coastal community, it will be critical for Hilton Head Island to actively monitor and manage this process as it impacts the Island’s systems both directly through storms and tides, and indirectly through insurance increases, saltwater intrusion, and other processes.
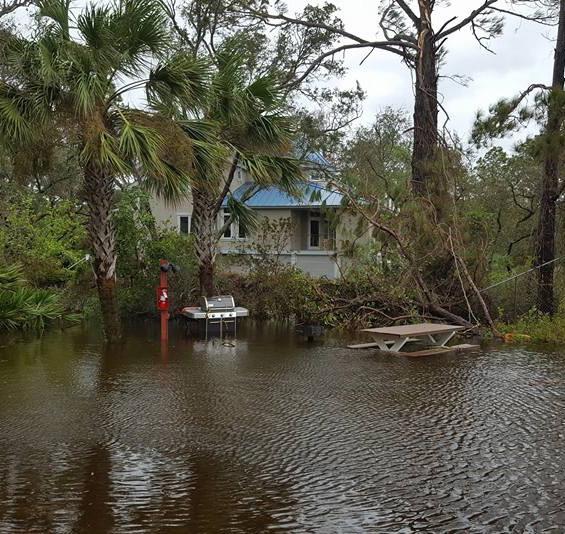
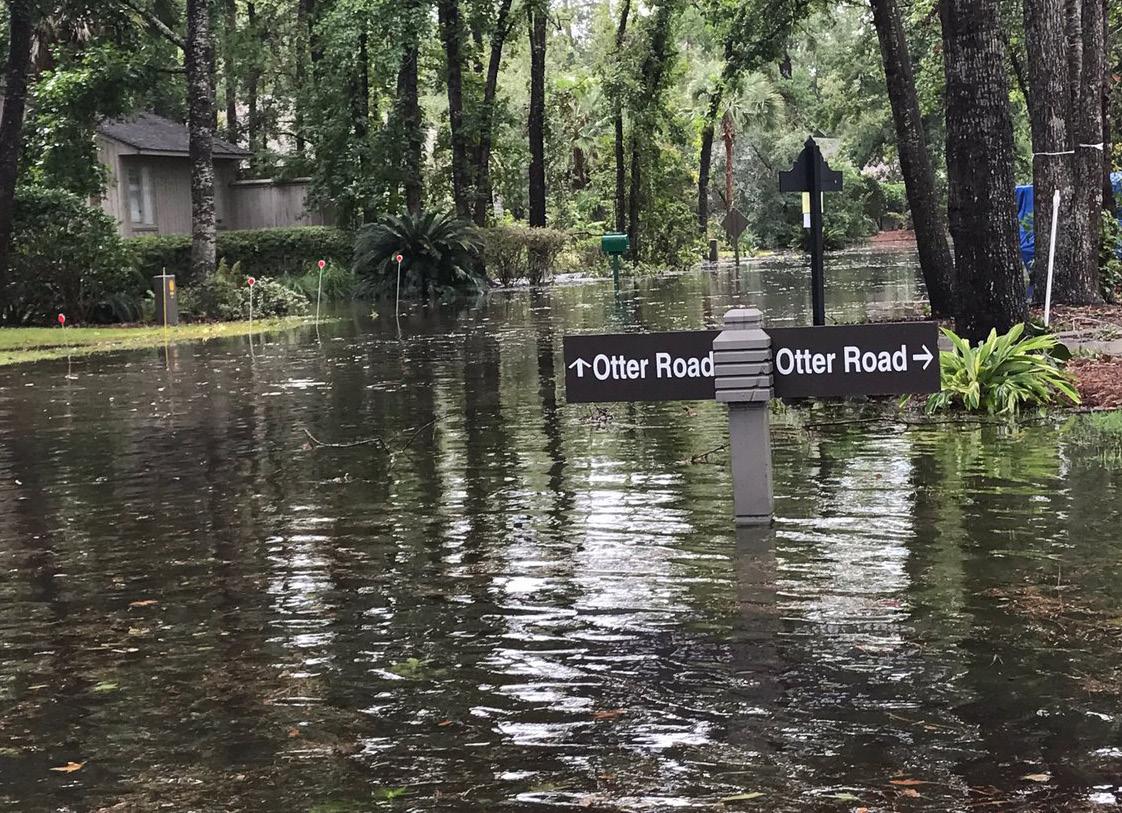
Water, driven by storms or tides, can wreak havoc on the built environment and utility networks. Small increases in sea level can radically increase the impact of storm surge events. Just two feet of sea level rise (models vary between one and four feet) would greatly increase the levels of inundation (shown as grey on the map on the right) for a category 2 hurricane. While these events are relatively rare, Hurricane Matthew hit the Island in 2016 with category 2 wind gusts, causing widespread damage from wind and water.
In preparing for future storms, the Town must be prepared for more inundation and related damage.
Source: National Hurricane Center
Areas of potential inundation by a category 2 storm surge under potential 2050 sea level conditions
Port Royal Sound
Damage from the 2016 storm Hurricane Matthew. Credit: Island Club of Hilton Head
Secondary impacts of climate change affect multiple environmental and ecological systems.
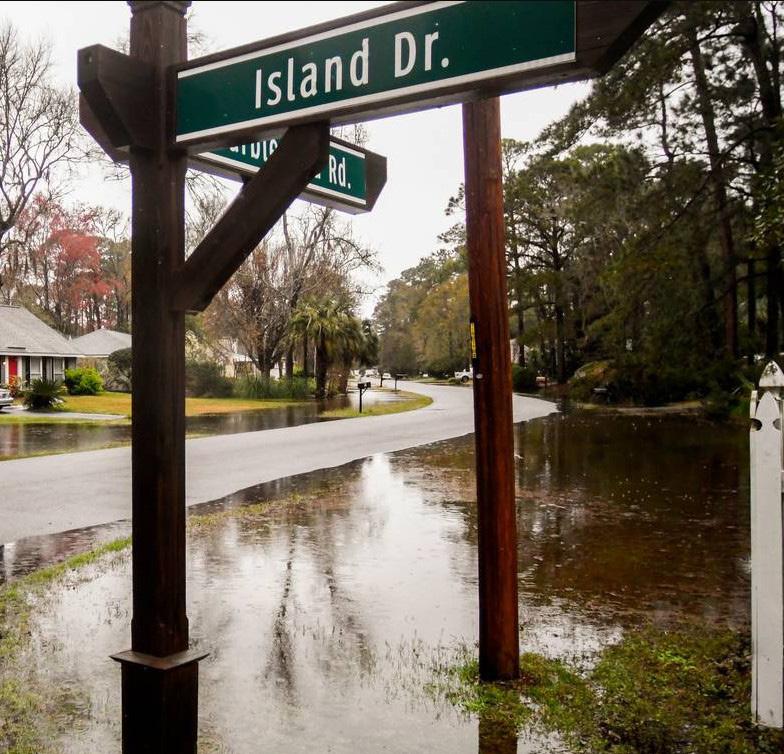
• “King Tide” is a non-scientific term describing the highest seasonal tides that occur each year. While predicted high tides in South Carolina for 2023 average approximately 5 feet, a King Tide event may bring tides of 7 feet or higher to shore. Rising sea levels may cause an increase in the frequency and severity of King Tide events.
• Climate models predict lower levels of overall precipitation in the Carolinas through the next 50 years with the potential for punctuating drought events, especially in late summer.
• With a changing environment comes questions surrounding utility resilience. In 2022, Beaufort County received a $300,000 grant from the National Oceanic and Atmospheric Administration’s Climate Program Office to fund a study of sea level rise impacts on groundwater and buried utilities such as water and electric.
• Because flooding will increase in coastal areas as sea levels rise, it is likely that insurance rates will increase. More frequent storms could lead to an increase in the deductible for wind damage in homeowner’s insurance policies, or much higher premiums for communities like Hilton Head Island where storm damage is not just possible but likely.
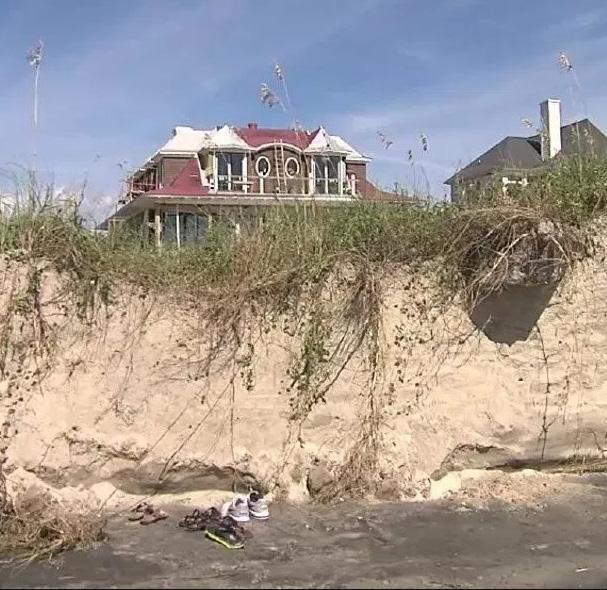
• Large storms and tides accelerate natural erosion processes, especially for coastal communities. Rapid erosion of coastlines poses a threat to beach front properties and tourism industries alike.
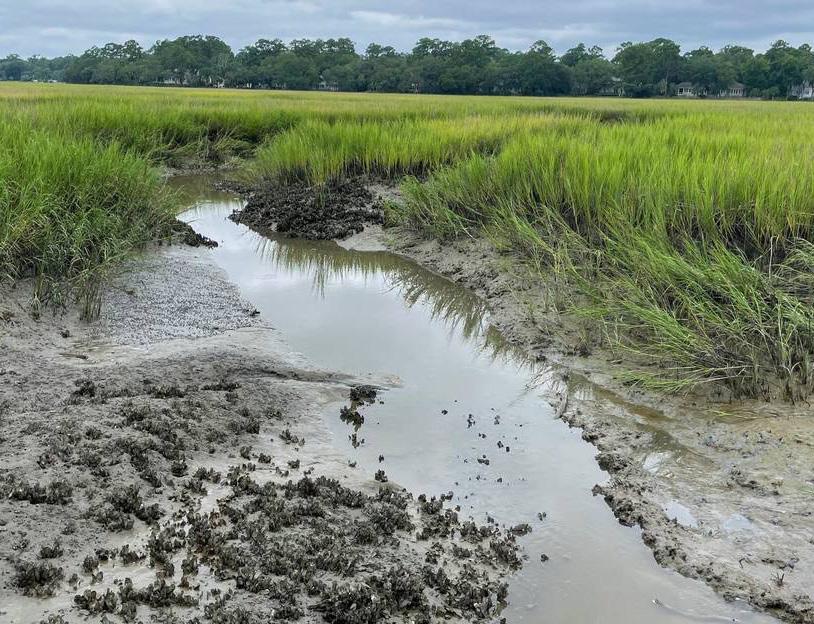
• As sea levels rise, many of the coastal wetlands and salt marshes may turn to open water and alter the ecosystems where many shellfish, birds, and fish reside.
According to the National Oceanic and Atmospheric Administration (NOAA), high tide frequency in Charleston, SC, has gone from 0-2 days in 2000 to 5-10 days in 2020. Photo Credit: Collins Group Realty
South Carolina’s sea level is rising about 1 to 1.5 inches every decade, and is predicted to rise between one and four feet over the next century. (NOAA) Photo Credit: WCIV
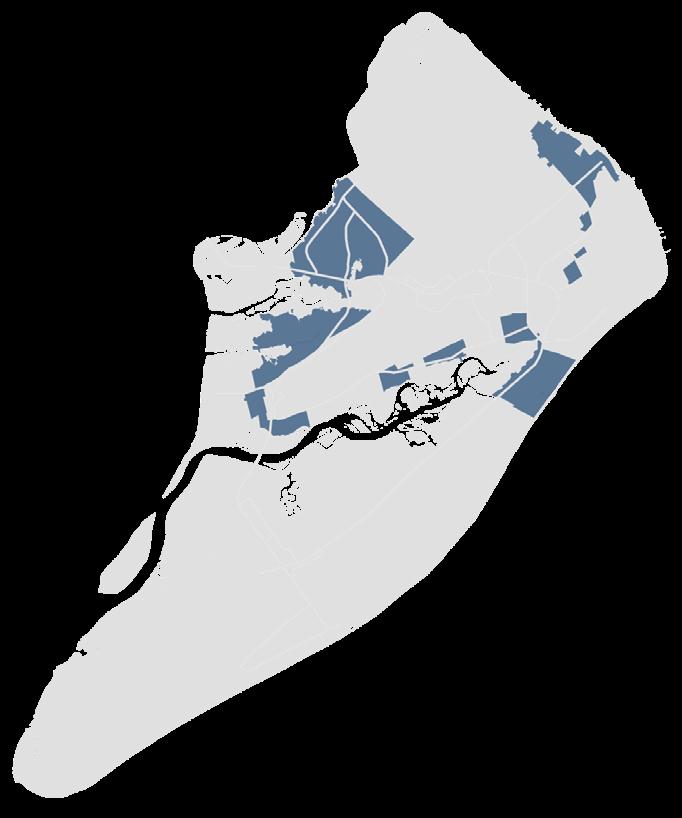
Water quality is responding positively to pollution mitigation efforts.
• The Island is covered by 13 watersheds, each draining to the ocean through a central creek system or artificial outfall.
• By the time the Town was incorporated in 1983, large-scale development and the expansion of impervious surfaces had greatly reduced water quality, especially within Broad Creek and the Calibogue Sound.
• The 2002 Broad Creek Management Plan sought to reverse pollution trends in one of the Island’s central natural resources. This plan identified two primary pollutant sources: bacteria leaching from failing septic systems and nutrient runoff from excessive fertilizer application.
• The 2004 Master Sewer Plan kicked off a major capital works campaign to connect unserved parcels to the sewer network and to educate residents and golf course management on the costs of over-fertilization.
• Water quality for the creek and sound has responded and improved based on ongoing monitoring.
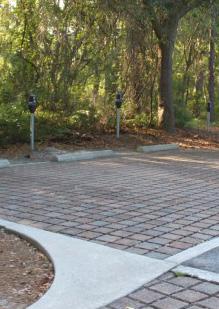
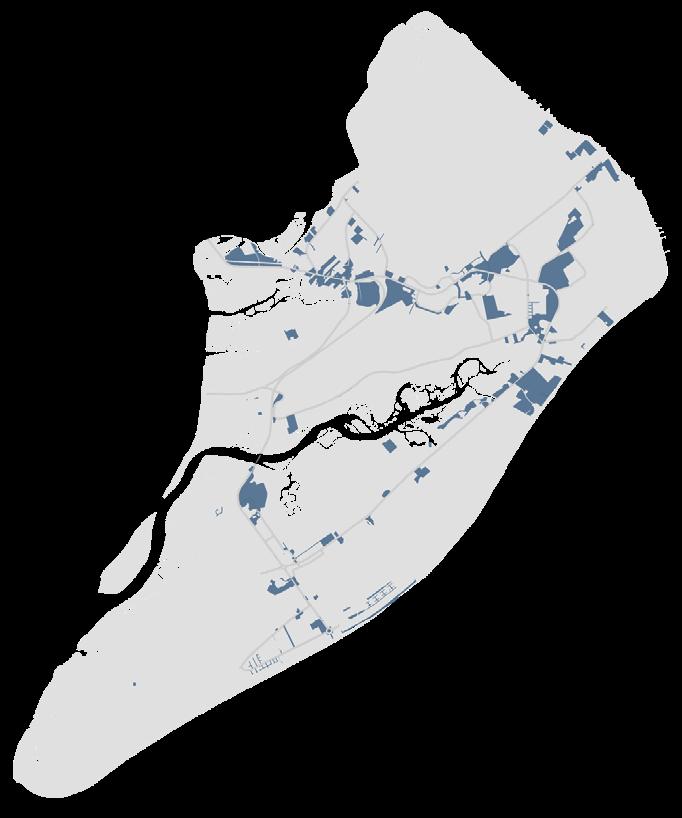
IMPERVIOUS SURFACE COVERAGE
Land area covered in roads or buildings
Impact of impervious surfaces
Impervious surfaces—paved or built areas where water is prevented from percolating into the ground—cover nearly one-fifth of the Island. While this percentage is low compared to similarly developed communities, the EPA reports that when impervious surfaces reach 10% to 20% of a local watershed, surface runoff doubles. This is the level where both stream and wetland degradation begins, with freshwater wetland habitat suffering impairments once the imperviousness of its local drainage basin is impacted. The Town has begun to address this issue through the use of permeable paver technology, rainwater capture, special plantings, and other technologies.
Wetlands and marshes like the one pictured here are increasingly threatened by excess storm runoff.
Credit: The Island Packet
Since 1958, the amount of precipitation during heavy rainstorms has increased by 27% in the Southeast. (NOAA)
Photo Credit: The Island Packet
The Island’s tree canopy cover percentage far outperforms similar communities and is growing.
• The Lowcountry Maritime Forest is abundant and rich with species diversity. Common trees include the live oak, loblolly pine, slash pine, cabbage palmetto, southern red cedar, and magnolia.
• The Island’s canopy coverage (the share of land covered by leafedout canopy of a tree) is around 50% of the overall land area—nearly double the national average of 27%.
• The Canopy Mapping and Potential Planting Area Study (completed by Green Infrastructure Center, Inc.) of 2022 identified an additional 300+ acres that could accommodate new plantings. This is an exceedingly low acreage given the size of the Island and reflects the existing canopy coverage on the Island.
• Through its Tree Ordinance, the Town regulates individual tree removal in lands within its purview and promotes plantings.
• Storms are an ongoing threat. The Island lost more than 120,000 trees during Hurricane Matthew in 2016.
• Finally, diseases, infestations, and saltwater intrusion also impact the coverage total.
ISLAND TREE CANOPY COVER
Half of the Island's land area is covered by trees
Source: Green Infrastructure Center, Inc.
5
6
Protection and conservation practices and programs have a direct, positive impact on wildlife.
• One of the most important wildlife protection initiatives in the Town is the Sea Turtle Protection Ordinance. From May to October the Town requires those with beach-facing properties to turn off exterior lights and close blinds or curtains to limit light leak onto the beach, which can disorient turtles as they make their return to the water.
• According to nest monitoring data from SCDNR, Hilton Head Island’s sea turtle nests had a 93.5% success rate in 2022, up from 85% in 2009. Several groups of volunteers help to ensure the safety of the sea turtles on the Island’s beaches. Sea turtles are often considered keystone species in marine ecosystems, and protecting them can have positive effects on other species and the overall ecosystem.
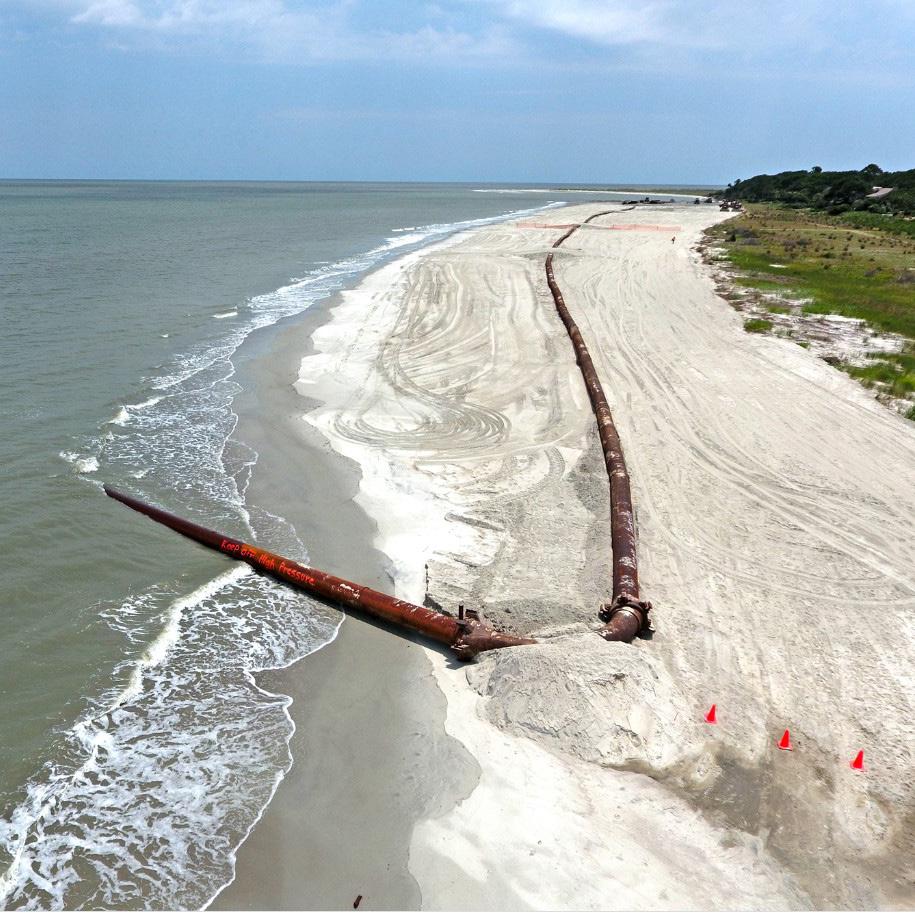
The Island’s beach management and renourishment practices are critical long-term investments.
• Hilton Head Island is transgressive much like moving desert dunes just at a far larger scale. The Island has moved slowly toward the mainland over the previous millenia. This means the Island’s beaches require some infrequent but proactive maintenance to ensure their longevity and health.
• The Hilton Head Island Beach Renourishment Program is a recurring effort to maintain the quality and size of the beaches on the Island. The program involves dredging sand from offshore locations and placing it on the beach to combat erosion and storm damage. Funding is procured through a combination of federal, state, and local sources.
• The most recent project took place in 2016 and added approximately 2.6 million cubic yards of sand to the beaches. These efforts are essential for preserving property values in the area and protecting the Island’s main tourist attraction.
SEA TURTLE NESTS, 2022
According to preliminary data from South Carolina Department of Natural Resources (SCDNR)
Beach Renourishment Program
Starting in 1990, the Town has performed three major beach renourishment projects.
Program totals:
• 10.7 million cubic yards of sand placed
• Shorefront is 200 yards wider than before 1990
• Construction costs to date: $60 million
• Value of First Tier shorefront: $3 billion
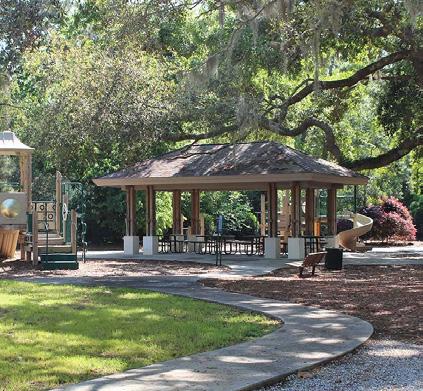
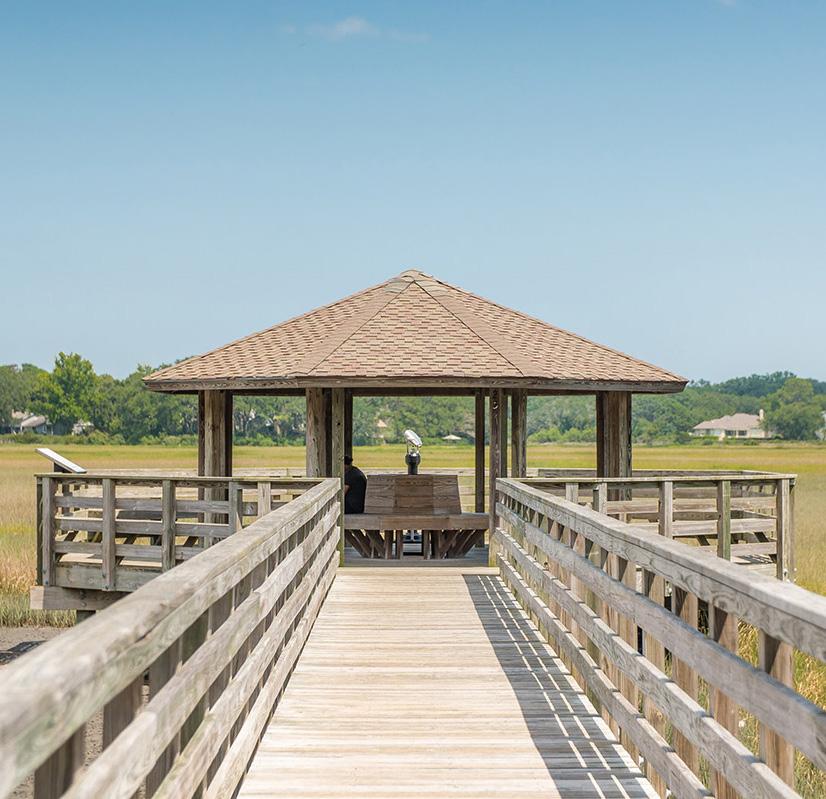
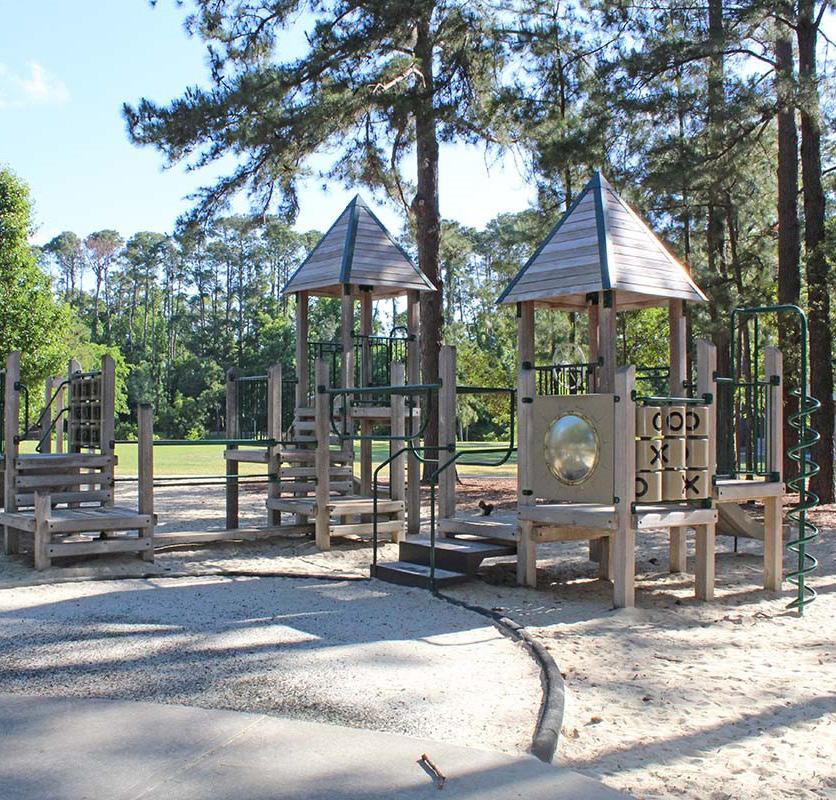
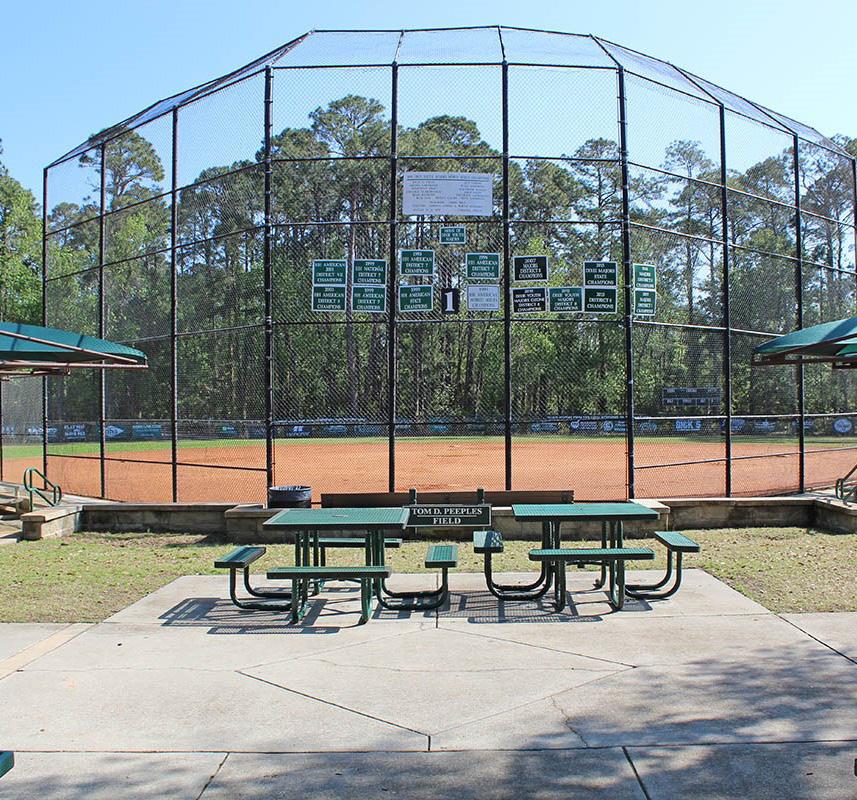
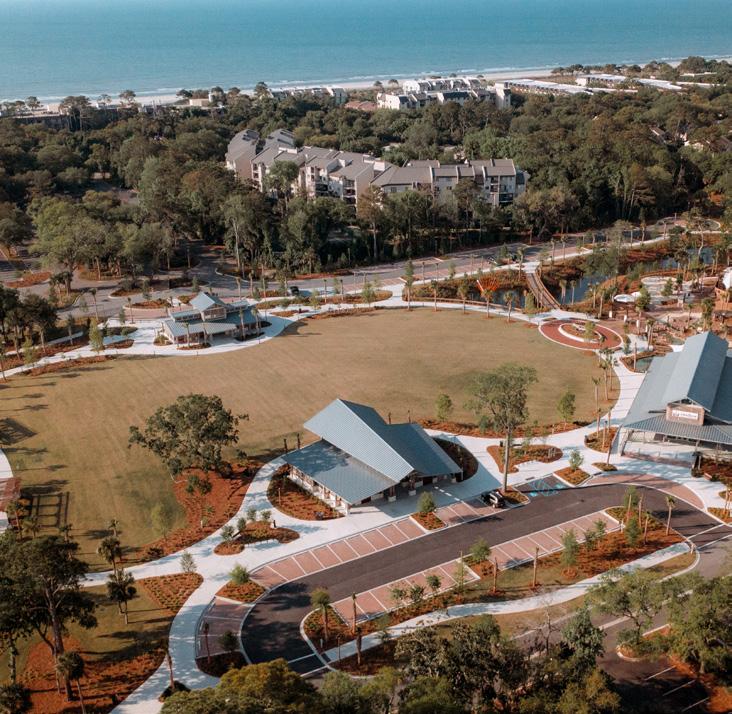
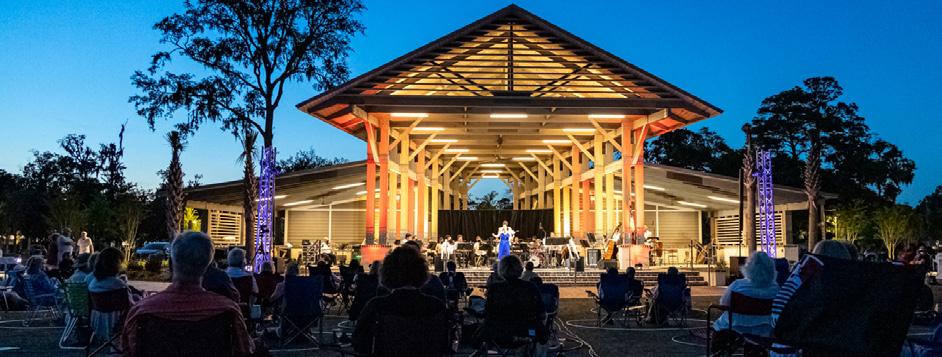
The Town has committed to providing best-inclass parks.
• As of 2020, the Town owns 548 acres of public park space, which equates to roughly 14.5 acres per 1,000 residents.
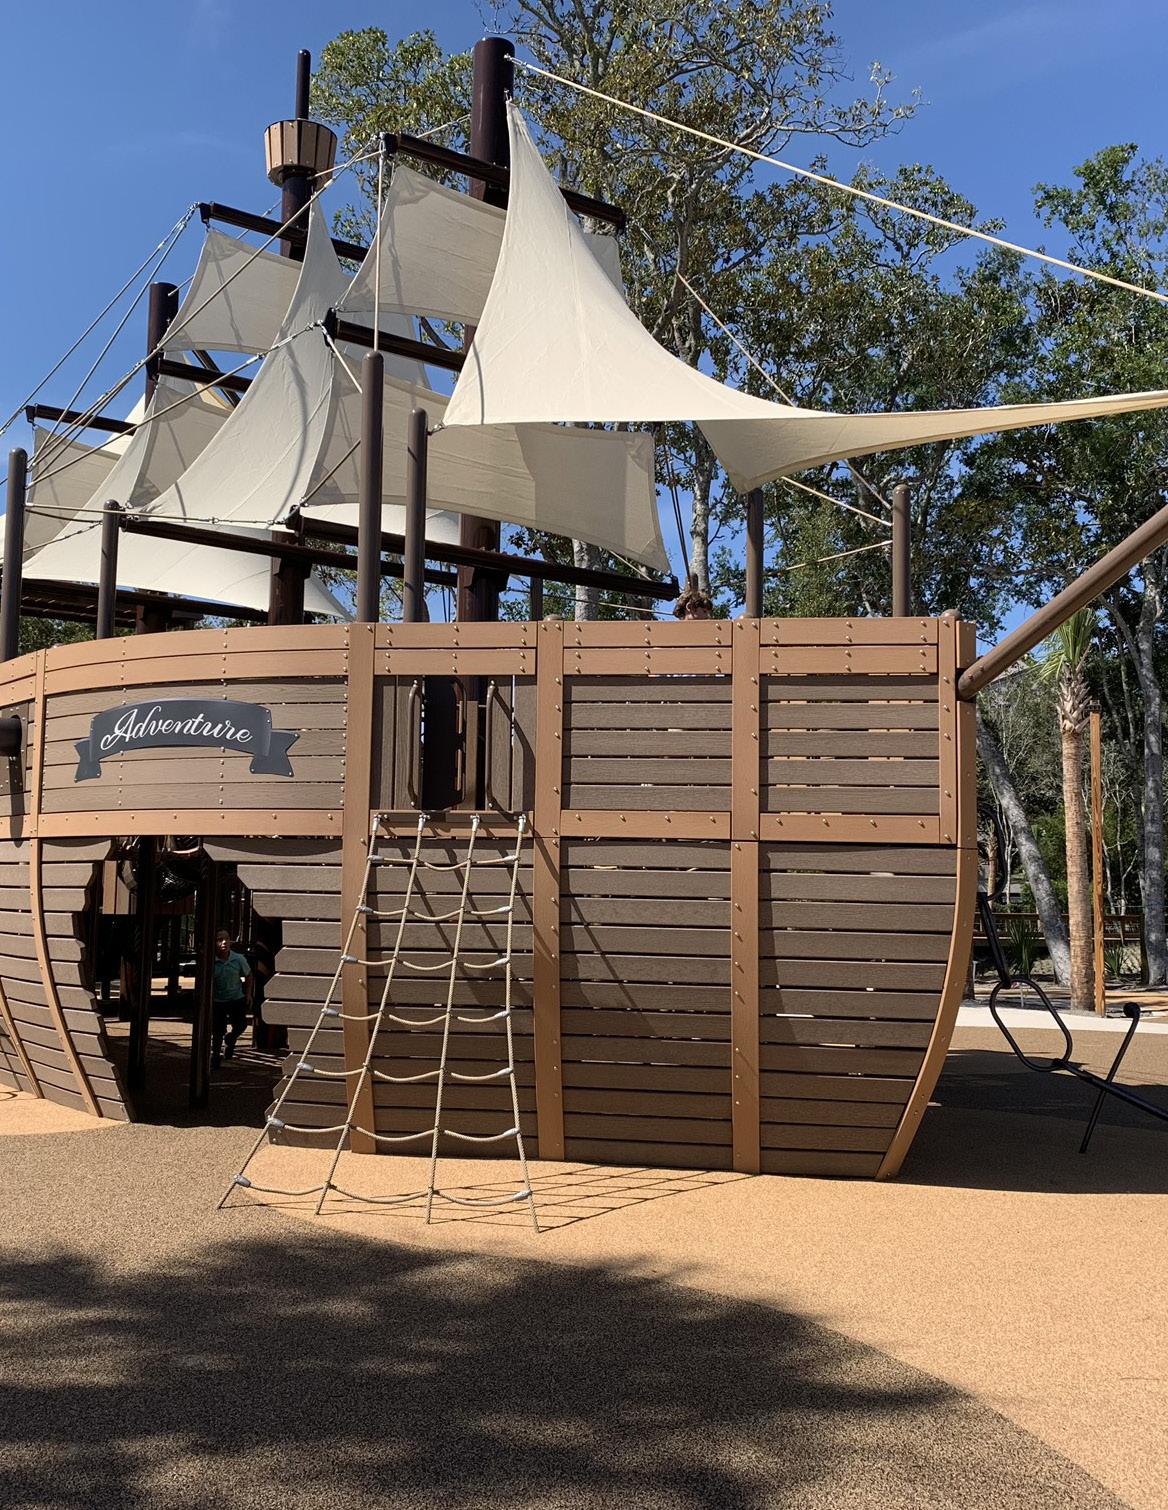
• The Town completed its newest park, Lowcountry Celebration Park, in December of 2020. The 10-acre site features an open pavilion and lawn, playground, perimeter walk, fitness stations, and more.
• Park improvements have been guided by the 2020 Parks and Recreation Master Plan, which was completed in tandem with the recent Comprehensive Plan.
• The Parks and Recreation Master Plan identified three major focus areas for park improvements on the Island: improvements at Chaplin Park and Crossings Park, a new racquets facility, and a proposed new park located on the Town-owned Mid-Island Tract. Proposed programming for these three projects can be found on the Town website, as well as in conceptual plans for the MidIsland Tract.
Source:
Cultural sites continue to be an important asset and underscore the urgent need for neighborhood preservation.
• Before Captain William Hilton’s arrival in 1663, Native Americans lived on the Island, and evidence points to the presence of people on the Island as early as 4,000 years ago. While little is known of these early civilizations, remnants of mysterious shell rings can still be found on the Island.
• By 1860, there were 24 plantations on the Island.
• When federal forces took control of the Island, General Ormsby Mitchel helped lay the foundations for Mitchelville, the first of 14 historic Gullah neighborhoods on the Island and the first selfgoverning town of formerly enslaved African Americans.
• The Island has many opportunities to engage with history and culture. The Gullah Museum of Hilton Head is dedicated to maintaining the Gullah customs, traditions, language, stories, songs, and structures on the Island. The museum offers guided tours and hosts events and educational activities. Annual festivals, such as the Hilton Head Island Gullah Celebration, showcase the cultural traditions of the Gullah people. Other ways to engage include National Historic Sites and public art.
• The Town has several initiatives to preserve Gullah culture, including the Gullah-Geechee Land and Cultural Preservation Task Force, the Gullah Geechee Historic Neighborhoods Community Development Corporation, and other initiatives. The Town’s Office of Cultural Affairs features Gullah Heritage sites on their Cultural Trail Map, which can be found on the office’s website.
HISTORIC
NEIGHBORHOODS ACREAGE
2,500
The 14 historic Gullah Geechee neighborhoods on Island make up a little over 2,500 acres, over 1,000 of which are still Gullah owned.
Land and Cultural Preservation Task Force
In 2017 the Town established the Gullah-Geechee Land and Cultural Preservation Task force in response to the significant loss of Gullah population. The task force works toward preserving Gullah culture and improving their quality of life. Specific areas of interest include solving issues related to the heir property, taxes and land use, and providing on-going educational opportunities. The task force is under the jurisdiction of the Planning Commission and consists of three Commission members, three Native Islanders, and three members from organizations that deal with Gullah Geechee or Native Island culture.
The Task Force, pictured here, was celebrated for Black History Month. Credit: Town of Hilton Head Island.
Historic Mitchelville Freedom Park celebrates the location of the first freedmen community in the country, established on the northern part of the Island during the Civil War.
PARKS & HISTORIC NEIGHBORHOODS
Historic Sites
Historic structures and sites help tell the rich cultural story on the Island and fuel the history and culture that continues today.
HISTORIC NEIGHBORHOODS
14
Clustered together on the north end of Hilton Head Island, they make up what have traditionally been called the Native Islander communities
KEY
HISTORIC NEIGHBORHOODS
Town Parks (major parks labeled)
Golf Courses
Lowcountry Celebration Park
Opened in December 2020 and situated on a 10-acre site off Pope Avenue near the Coligny Beach parking lot, this is the Town's newest park.
Source: Planning Team Research and Analysis
Mitchelville Beach & Barker Field
FUTURE: The Mid-Island Tract
This 100+ acre site will be home to the Island's newest park. The site will combine active and passive elements for residents and visitors that will integrate and celebrate the Historic Neighborhood’s vibrant culture.
TOPIC F
HOUSING
Housing and neighborhoods are the essential building blocks of strong communities. A home is more than real estate; it is the foundation on which families, livelihoods, and a strong citizenry are built.
KEY TRENDS
By analyzing the products, sales activity, and development pressures, there’s an opportunity to better understand the critical trends that will impact the real estate market over the coming years. The housing market does not remain static. Within the market, movement can impact community issues like workforce development, affordability, transportation, and other areas.
The Hilton Head Island housing market is quite unique. While the Island swells in its high tourism season, hosting more than 3 million visitors over the year, only about 40,000 people live on the Island full-time. At any given moment, there are more than 7,000 non-residents spending the night on the Island in hotels, villas, or more commonly, short-term rental properties.
Trends like short-term rental expansion are impacting the housing market significantly. Coupled with a general increase in sales value and a fast-growing region, the Island’s housing market is under intense pressure.
1
2
3
4
5
6
7
The Island has a unique mix of housing types fueled by the hospitality and home rental markets.
A building boom through the ‘80s and ‘90s has given way to slower growth, especially after 2010.
Permits for all types of building are trending upward; residential projects are leading the way.
A hot—if temperamental—housing market soared upward through the COVID-19 pandemic.
The Island’s housing market is atypical as it includes a significant number of units that are occupied on a seasonal basis.
As the market pulls prices upward, housing costs are increasingly a burden
Naturally occurring affordable housing is under threat from redevelopment.
34,665
Total housing units
From 2000, the Town added just over 10,000 new dwelling units spread across multiple product types (single-family detached, duplex, apartment, etc.). The majority of these units were added in single-family detached homes and apartments / condo complexes with 20+ units.
The Town has a relatively diverse set of housing products when compared to communities around the region. This is due in large part to the significant tourism demand and the popularity of villa rental properties, as well as larger scale condominium construction. Less than half of the dwelling units on the Island are single-family detached, compared to 80% in the town of Bluffton, or 62% in Beaufort County overall.
HOUSING BY PRODUCT TYPE
Source: US Census Bureau
2
A building boom through the ‘80s and ‘90s has given way to slower growth, especially after 2010.
• Eight out of ten homes on Hilton Head Island were built between 1970 and 2000.
• Hilton Head Island experienced a building boom in housing through the 1980s. Just under 40% of the Island’s housing stock was built during this decade alone.
• New home builds began to fall through the 2000s, corresponding with slowing population growth overall.
• Construction has taken off in the larger region during this same period. Close to 40% of Beaufort County homes were built after 2000.
3 Permits for all types of building are trending upward; residential products are leading the way.
• Permits and building activity for residential, commercial, and multifamily projects have trended upward from low points after the 2008 National Recession.
• The majority of permits were issued for major and minor remodels, especially for residential properties.
• The COVID-19 pandemic did very little to dampen building activity. The average total permits between 2020 and 2022 was higher than the same period eight years previous (2012 to 2014).
HOUSING UNITS BUILT IN THE 1980s
13k
This accounts for over one third of the Island’s total housing stock
• The Island’s yearly average has increased by about 50 permits each year from 2012, with a total average over this period of 5,200 permits per year. AVERAGE YEARLY INCREASE IN BUILDING PERMITS, 2012 TO 2022
+50
The Town issued just under 60,000 building permits over this entire period, averaging 5,200 per year
4
5
A hot—if temperamental—housing market soared upward through the COVID-19 pandemic.
• Home value and home sale averages across all housing types saw their largest year-over-year increase ever in the years following the COVID-19 pandemic.
• In 2022, the average value of housing units on the Island jumped 33% compared to the year before, considerably higher than the previous record year-to-year increase of 20%—set the year before.
• The average home value tipped over $700,000 in 2022, outperforming the county average by more than $200,000 as well as every other community in the region. This intense growth in value followed national trends, but the acceleration in the Lowcountry was much greater.
• The Island’s housing market demonstrates a highly elastic relationship with national economic trends. Through the 2008 National Recession, home values dipped by as much as $200,000 and did not fully recover to pre-recession values until 2021.
• Limited building of new construction is another contributing factor to rising values. While permit activity has been steady through the past decade, the majority of projects are renovations compared with new builds. This is capping supply and driving demand.
• Short-term rental conversion is another factor, with out-of-town or corporate purchases increasing significantly over the last five years, pushing up value across all segments.
The Island’s housing market is atypical as it includes a significant number of units that are occupied on a seasonal basis.
• About half of the Island’s nearly 34,000 housing units are defined as “vacant,” or without a year-round occupant. This includes short term rentals, seasonal homes, and units for rent or sale without an occupant.
• Based on a 2023 estimate, one in every five units on the Island is actively listed on at least one rental platform.
• Short-term rental properties have quickly surpassed hotels and resorts in number of units. These properties, however, have also strained existing neighborhoods with increased parking demand, nuisance management, and other issues.
YEAR-TO-YEAR INCREASE IN HOME VALUE, 2021 TO 2022 +33%
Fastest year-to-year increase in history, 20% increase in 2020
SHORT-TERM RENTAL PROPERTIES COMPARED TO ALL PROPERTIES
1 in 5
Around 7,000 properties are actively permitted as shortterm rentals
ACTIVE SHORT-TERM RENTAL LISTINGS
Source: Town of Hilton Head Island
The 2022 Workforce Housing Framework
The latest effort to develop the Town of Hilton Head Island’s Workforce Housing Framework began fall of 2022 as a result of troubling trends around workforce housing and general affordability. Town leadership committed to a process to develop the Framework through a collaborative process with the community and key stakeholders. The “Framework” is a structure around which policies and more specific actions can be affixed and expanded. As a result of the Framework, the Town Council agreed to devote $1 million in annual funding to address the housing issue programmatically and through tangible projects.
AVERAGE HOME VALUE, 2022
$700k
$200k higher than the County average and a 33% increase from the previous year
Home Value Change - 2000 to 2022
OKATIE BEAUFORT CO.
BLUFFTON
HARDEEVILLE
HILTON HEAD ISLAND
6
As the market pulls prices upward, housing costs are increasingly a burden.
• Housing affordability is determined by the percentage of an individual’s gross pay that is absorbed by housing costs. An “affordable” unit should cost no more than 30% of that individual’s or family’s total income. Households are considered “cost burdened” when their housing costs exceed this figure.
• On Hilton Head Island, 40% of households are cost burdened by their housing costs. This segment increased 30% from 2000. Half of all households with service economy incomes between $35,000 and $50,000 are housing cost burdened.
• Despite its location and strong real estate market, the Island has managed to preserve an affordable workforce housing segment. This is a very small portion of the Town’s overall housing stock, but this housing segment is important to working families.
7 Naturally occurring affordable housing is under threat from redevelopment and short-term rental conversion.
• Naturally occurring affordable housing (NOAH) units are housing units at affordable price points that are not protected by income restrictions or state and federal subsidies. These units are “unrestricted,” meaning there is little to no protection for them to stay affordable in perpetuity.
• The Island has between 1,700 and 2,475 NOAH units and just under 400 protected, income-restricted units based on planning team analysis of existing unit pricing and rental patterns.
• NOAH units are increasingly under threat of redevelopment. Large-scale replacements of affordable housing units may become more common with fewer undeveloped sites remaining on the Island.
HOUSING COST-BURDENED HOUSEHOLDS 40%
The share of families paying more than 30% of their income on housing has increased 30% from 2000
NATURALLY OCCURRING AFFORDABLE UNITS
~2k
Estimate is based on existing properties with "affordable" rent and US Census cost-ofliving estimates
"WHAT'S AFFORDABLE?" BY WORKER SEGMENTS
Source: US Census Bureau, 2018 Workforce
“I worry about what we’ll lose when we lose this first rung of the housing ladder.”
-Former Mayor John McCann From the 2022 Workforce Housing Framework
LOCATIONS OF NOAH AND INCOME-RESTRICTED HOUSING Mobile Homes
1,193
While not depicted in the graphic because of their relative dispersal, mobile homes make up the majority of naturally occuring affordable units on the Island. This type is most common within the Island’s 13 historic Gullah neighborhoods.
In 2022, eviction notices were issued to roughly 300 residents of the Chimney Cove Village apartment complex on Hilton Head Island. Residents were given 30 days notice before their leases would end early. Recently, the Town worked with developers and the start date of the new project was pushed back significantly to provide over a year’s notice time to current residents.
Source: Planning Team Research and Analysis
HOUSING UNIT TOTALS BY TYPE
Restricted ~400 units, 1% of total
Source: Planning Team Research and Analysis
TOPIC G
GOVERNANCE
Governance refers to the exercise of authority, decision making, and the distribution of power within a society or community. It includes the institutions, policies, and practices that guide the actions of government officials and ensure that they are acting in the best interests of the people they serve.
KEY TRENDS
One of the youngest incorporated communities in the state of South Carolina, the Town of Hilton Head Island is celebrating its 40th birthday in 2023. Over these four decades, change has been constant. Serving this dynamic place within its even more dynamic region has required community leaders to regularly evaluate the community priorities and evolve services as necessary.
Overall, proficient governance is critical for the smooth and effective functioning of any organization, whether it be a government, a corporation, or a non-profit organization. Well-governed communities are realized over time and evolve along with their citizenry.
This topic explores several of the key trends related to management of the Town, including its structure, pressures, fiscal health, and department planning.
1
2
The Town was formally incorporated in 1983 with a mandate from voters to “regulate the pace and character” of future development.
The Town of Hilton Head Island serves residents, businesses and visitors through direct service delivery as well as through partnerships with regional entities.
3
4
Emerging community challenges and needs are driving more proactive planning processes and policies from the Town.
The Town’s annual strategic planning cycle uses best practices to link department-level operational plans and capital investments back to the Comprehensive Plan.
5
6
Following two disasters—Hurricane Matthew and the COVID-19 pandemic—revenues and community investments are now growing and focusing on “normal” expenditures.
Fire Rescue maintains a strong and effective staff and fleet but is strained by the increasing cost of living.
Hilton Head Island becomes a town
Hilton Head Island was a place and community well before its formal incorporation in 1983. In fact, it was the wave of development on the Island that first initiated the campaign that led to incorporation.
Much of the early, large-scale development occurred through the 1950s and ‘60s within master-planned communities, like Sea Pines, Spanish Wells, and Port Royal. Growth between these communities— specifically projects out of scale and character with past development—provided the impetus for incorporation in the early 1980s. Since its inception, the Town has taken a proactive approach to land regulation, environmental and cultural preservation, and strong town management practices.
“We needed greater impact in our own destiny....”
-Ben Racusin
Hilton Head's First Mayor
1956
Completion of the James F. Byrnes Bridge transforms access to the Island.
1961
Spanish Wells and Port Royal Development
1957
Sea Pines Plantation opens, becoming the first of HHI's family resorts
1969
Beaufort County's Council push for industrial development attracts a chemical plant to be built on Victoria Bluff; Hilton Head Island Community Association is formed in opposition
1982
Controversial development of prefabricated condominiums kicks off a campaign for incorporation
1983
Town Fire and Rescue established
The Town of Hilton Head is incorporated after referendum passes 60–40; Council-Manager form of government is established
Ben Racusin elected first Mayor of Hilton Head Island
1990
1985 & '87
Town adopts its first Comprehensive Plan, followed by Land Management Ordinance and Zoning Map
Sea Turtle Protection Ordinance, First Beach Renourishment Project, and Town Water Management Plan are adopted
The Town of Hilton Head Island serves residents, businesses and visitors through direct service delivery as well as through partnerships with regional entities.
• The Town provides critical services, like fire and safety, which includes fire rescue, emergency medical services, and emergency management.
• The 15 boards and commissions on the Island provide guidance over areas such as zoning appeals, Gullah Geechee land and cultural preservation, and housing.
• The Town outsources services like law enforcement, which is currently served by the Beaufort County Sheriff’s Office. Other services are privatized, like recycling and waste management.
IN TOWN STAFF & COMPARISONS TO SIMILAR COMMUNITIES
Town staffing has increased at a slower pace than the increase in population and visitors since 2012.
*Does not include Fire Rescue staff, which is the largest staff in most communities. Moment-in-time snapshot of totals from referenced governments, 2023.
Source: US Census Bureau, 2000 to 2020 Censuses, Town of Hilton Head, Think HHI and the Lowcountry.
2018 & '20
Emerging community challenges are driving more proactive planning and policy from the Town.
• The Town’s initial motivation for incorporation focused on the regulation and pace of development in areas outside of the current master-planned communities.
• As the community has evolved, the Town has expanded its relatively tight purview to respond to new issues and trends.
• The Town’s preliminary policy extensions focused heavily on environmental and wildlife protections for wetlands, sea turtles, and water quality.
• In the 2000s, the community sharpened its focus on cultural preservation and its historic Gullah Geechee communities in multiple plans and policies.
• Most recently, the issue of housing affordability and its relationship to other community issues, like the workforce, have manifested in several studies and policies, such as the Workforce Housing Framework.
ADOPTED REPORTS, STUDIES & PLANS
The Town has advanced more than a dozen critical plans dealing with a wide range of community issues since 1999
Finding Home: A Workforce Housing Framework Short-Term Rental Permits Mid-Island District Plan Town of Hilton Head Corridors Plan Status of Gullah Geechee Top Priority Project Recommendations
Our Plan: Setting the community’s direction
The Town completed its third Comprehensive Plan in 2020, entitled Our Plan. The plan builds off the Our Future visioning work completed in 2018 and sets the broad policy direction for the community for the next two decades. It recognizes that comprehensive planning is required in the state of South Carolina for incorporated communities. The plan covers a wide range of topics, including housing, economics, transportation, land use, and sustainability, while establishing goals for more specific action planning. Each year, the Town develops a Strategic Action Plan to operationalize the Comprehensive Plan.
The Town is mission-oriented and committed to regular strategic planning and capital investment.
• Strategic planning is a best practice for proactive and responsive communities.
• Each year, the Town revises its Strategic Action Plan to serve as a guide for staff in executing the designated Strategic Initiatives identified by the current comprehensive plan. The Strategic Action Plan encompasses all the initiatives that demand a substantial investment of administrative resources and helps to identify and prioritize capital improvement projects.
• The Town’s Strategic Action Plan FY 2023-2025 identified 15 strategies and various initiatives. The plan broke these initiatives into policies, projects, and operational items.
• The Capital Improvements Program for the Town is an ongoing process to identify, fund, and implement capital projects, like new parks and pathways, roadway improvements, and improvements to Town facilities and equipment.
• In fiscal year 2022-23, there were 46 total projects, totaling $46.5 million, spent across seven different project categories: parks, roadways, pathways, fleet, facilities and equipment, beach, and land acquisition.
STRATEGIC PLANNING PURPOSE AND PROCESS
Strategic Management
Close oversight over implementation process of physical projects (CIP), and/or policy development
Evaluation
Achievements and progress reporting for external communication (the public) and internal action review
Scheduling & Contracts
Operationalizing the action agenda through specific scheduling (may span multiple years) and bidding
$46.5 million in projects averaging $1M per initiative
The Role of Our Plan
The Comprehensive Plan is the foundational policy guide for community development. The plan is a recurring reference and justification for specific action implementation
Strategic Plan Development
Reviewing progress, reflecting on ideals and priorities (Our Plan + Addl. Policy), setting annual priorities
Budget Priorities
Evaluating the action agenda based on Town budget planning (capital improvements, operating costs, etc.)
The Town Mission
Strategy
Identification
Focusing action agenda to critical projects, policies, and programs pertinent to values
The Town of Hilton Head Island’s mission is to promote the health and vitality of the community we serve through ethical and inclusive programs, policies, and actions.
Source: Town of Hilton Head Island
Revenues and community investments have increased and returned to pre-pandemic “normals”.
• With its 2023 budget totaling $119 million, the Town expenditure per capita for Hilton Head Island is just over $3,100 per resident.
• If compared to the country’s 100 largest cities, the Town would rank 21st in spending per citizen. This level of investment has been enabled by strong growth in revenues and the Town’s ability to focus on non-emergency spending.
• Hurricane Matthew in 2016 and the COVID-19 pandemic in 2020 redirected significant portions of the Town’s expenditures to disaster recovery and crisis management.
• The 2022-23 fiscal year expenditure plan represents a return to “normal” investments in critical community programs and a robust capital improvements campaign.
GOVERNMENTAL TAX REVENUES BY SOURCE
RESIDENTIAL
PROPERTIES BY TAX MILLAGE
As per the Beaufort County Treasurer’s Office, properties in Beaufort County, both residential and commercial, are subject to a standard assessment rate of 6% for taxation. However, owner-occupied legal residences may be eligible for a reduced 4% Special Assessment Ratio. The chart right shows how Island property is divided by the 4 and 6% tax millage brackets.
Source: Town of Hilton Head Island
Source: Town of Hilton Head Island
The Fire Rescue Department prioritizes staffing needs in its strategic plan, underscoring housing affordability needs.
• The Hilton Head Island Fire District and the Sea Pines–Forest Beach Fire Department were both established in 1969; the Hilton Head Island Rescue Squad was established in 1970. In 1993, these three departments were merged to form what is now Hilton Head Island Fire Rescue. The department’s core programs include emergency medical services, fire suppression and investigation, fire rescue 911 communications, domestic preparedness, hazardous materials mitigation, and public education.
• One of the goals identified by Hilton Head Island Fire Rescue 2024 to 2026 Strategic Plan is to “create the appropriate staffing model to fulfill the needs of the department and best serve the community.” A major hurdle to achieving this goal is the rising cost of living on the Island. Based on the current entry-level firefighter and EMT salaries and the median rent on the Island, employees are spending over 30% of their monthly income on housing.
FACILITY BUILT NOTES
Headquarters 2001 The Fire Rescue Headquarters accommodates all administrative staff and houses the department’s maintenance facility.
Station 1 2011
Station 2 2021
Station 3 2000
Station 4 2005
Station 5 2011
Station One operates with a minimum staffing of four firefighters. The station employs a split crew model, with two personnel addressing EMS calls on the medic unit while keeping the fire apparatus in service with the remaining two. All four staff members respond to fire-related calls on the fire apparatus, temporarily placing the medic unit out of service. Equipment at the station includes Engine-1, Medic-1, and Rescue-1.
Built to withstand seismic activity, high winds, and storm surges, Station 2 maximizes elevation for additional staff during emergencies. The station houses a fire engine and EMS vehicle, operating on a split crew model for efficient responses to both EMS and fire-related calls.
Using a cross-staffed model, all three personnel respond to either the engine for firerelated calls or the medic unit for EMS calls. Equipment at the station includes Engine-3 and Medic-3.
With a minimum daily staffing of three firefighters, the station employs a cross-staffed model. The equipment includes Engine-4 and Medic-4.
Station Five maintains a minimum daily staffing of four firefighters. Operating with a split crew model, two personnel respond to the medic unit for EMS calls, while the remaining two keep the fire apparatus in service. All four staff members respond to fire-related calls, temporarily placing the medic unit out of service. The equipment at the station includes Engine-5 and Medic-5.
Station 6 2014
Station 7 2003
Station has a minimum daily staffing of seven firefighters. Four personnel respond to either the engine for fire-related calls or the medic unit for EMS calls. The equipment includes Engine-6, Medic-6, Truck-6, and Hazmat-2.
Station Seven maintains a minimum daily staffing of three firefighters. The equipment includes Engine-7, Medic-7, and Battalion-1, which oversees daily shift personnel for all stations.
Source: Town of Hilton Head Island
With average Island occupancy, including visitors, the Town maintains an above-standard ratio or staffing per resident
TOPIC H
COMMUNITY ENGAGEMENT
The Town has involved its residents and stakeholders in creating a shared vision for the future of the Island, addressing major issues like utility provision, environmental and wildlife protection, transportation and Island access, and more recently, housing affordability and workforce support.
KEY TRENDS
Conversations within the communities of Hilton Head Island are what first initiated the Island’s steps toward incorporation. These discussions over what the place ought to look or feel like in the future set off a series of conversations that eventually culminated in the 1983 incorporation referendum.
The actions of the early 1980s were the result of a community movement built around grassroots engagement and iterative conversation. As the community continues to grow—albeit more slowly— and evolve, the need for this ongoing dialogue remains. The community is quite active compared to its peers around the region and eager to contribute ideas to the wide range of Town-initiated and regional processes.
This section provides an assessment of past community engagement efforts, a review of the communication practices and channels, an overview of the major audiences or segments within the community, and a highlight of the harder-to-reach communities on the Island.
1
2
3
4
The Hilton Head Island community is intensely engaged in planning efforts, far beyond its Lowcountry peers.
The Town is committed to facilitating community conversations through its engagement processes.
The Town uses multiple platforms to proactively communicate important messages.
The Island’s community tapestry make-up (an analytical model designed to categorizing communities) reveals a diverse and unique segmentation.
5
6
Some groups living on the Island are harder to reach than others when it comes to gathering community input.
The Island Recreation Association produces, provides, and coordinates public recreation programs through a unique, non-profit model.
5,400+ Hours of conversation
The Town’s community engagement effort leading to the adoption of Our Plan, the Town’s 2020 comprehensive plan, was deep and exhaustive. Outreach began in March 2017. In the span of nine months, there were over 4,500 hours of community engagement activities, which ultimately led to the adoption of Hilton Head Island’s Our Future, the vision and strategic action plan. This thorough assessment of the community’s values set the groundwork to pursue a second round of engagement in order to create the new comprehensive plan.
In 2019, the Town developed eight work groups that met twice monthly for eight months. These groups were composed of eight to twelve diverse community members who worked to develop goals and strategies for the plan based on the values previously established. In concert with this effort, staff held seven public open houses, attended festivals and pop-up activities, and facilitated several online modes of engagement to keep the public informed and involved. These efforts culminated in the adoption of Our Plan in October 2020.
Hilton Head Island’s recent engagement efforts fare well when compared to the rest of the Lowcountry. For example, Beaufort County’s comprehensive planning community engagement process reached 3,900 people, less than 1% of its total population.
COMMUNITY
ENGAGEMENT
11%
Total Island population reached during Our Plan community engagement
The Town’s community engagement activities go beyond public hearings; specialized work groups focused on representation and inclusivity convene to participate in collaborative, interactive activities related to the planning process.
A community engagement session with young professionals for the Our Future initiative
Photo Credit: Our Plan
The Town is committed to facilitating community conversations through its engagement processes.
• The values for Our Future, the 2018 vision and strategic action plan, were derived from community discussions that started broad but gradually narrowed in on the emerging key themes and shared aspirations for the Island’s future.
• The Our Future and Our Plan community engagement process was two years long and involved the Town Council, a community vision process consultant, a vision project management team of diverse community leaders, and the broader Hilton Head Island community.
• The Town Council required transparency in the Our Future community engagement process. Our Plan identified transparency as a key idea for shaping excellence, one of the plan’s core values.
• In October of 2022 the Town Staff convened 35 housing stakeholders to participate in a two-day workforce housing charrette. This community participation of public, private, and philanthropic groups led to the development of major components of the final Workforce Housing Framework strategy.
STRATEGIC INITIATIVES
Each initiative identified for the 2023–25 fiscal year was informed by the community's input
The Strategic Action Plan lays out in detail the activities the Town staff and associated agencies need to carry out in order to implement the Town Council’s policy directions. It is focused on all initiatives that are not capital improvement projects and require a significant investment of staff support, and helps ensure that staff have sufficient time and resources necessary to successfully meet expectations.
Source: Town of Hilton Head Island Strategic Action Plan, FY 2021-22.
HILTON HEAD ISLAND IDEALS OF EXCELLENCE
The Ideals of Excellence are the foundational tools which uphold one of Hilton Head Island’s seven Core Values: the relentless pursuit of excellence. These ideals, set forth by the community, are statements of intention for the future growth and development of the Town. The Town’s intention is to be a community that...
For Our Place
Is welcoming, inclusive, values diversity, safe, and people focused. Is recognized as an excellent place to live, work, and visit. Preserves, values, and recognizes its history.
Attracts businesses and residents who identify with and appreciate the Hilton Head Island community Ideals of Excellence and Core Values. Is recognized as a best-in-class destination where visitors are welcomed and the economic impact of tourism is valued.
Protects the natural environment as a unique quality of our identity.
For Our People
Prioritizes the greater good.
Attracts and maintains a diverse and multi-dimensional residential population, providing a competitive live-work option. Recognizes the benefit and value of arts, culture, recreation, healthy living, and education for the community.
For Our Planning and Process
Fosters a collaborative, transparent, and inclusive environment when resolving concerns or planning for the future.
Considers sustainability as foundational to the Island’s development and redevelopment of environmental and economic projects and policies. Fosters a spirit of inspiration and leads by example.
Uses innovation and learning to continually develop and apply best practices and standards for processes and projects.
Continually adapts to the Core Values and Comprehensive Plan to meet the needs of the present and future.
Source: Town of Hilton Head Island Strategic Action Plan, FY 2021-22.
The Town utilizes multiple platforms to communicate important messages.
• In February 2022, the Town released the MyHHI Mobile App, which lets community members report nonemergency issues to the Town. Not only does this let citizens directly connect with the Town administration, it is also used to spread emergency announcements.
• Beyond the app, the Town has seven social media accounts with a combined total of over 46,600 subscribers / followers. The Town’s Visitor & Convention Bureau Facebook page, Visit Hilton Head, has 235,000 likes and 236,000 followers.
• Direct communication from the government allows emergency communication to reach residents quickly, which is crucial during hurricane season when conditions are dangerous.
• The 2020 comprehensive plan also identified transparency as a key idea for shaping excellence, one of its core values.
SOCIAL MEDIA PRESENCE AND REACH AS OF JANUARY 2023
Facebook
34,000 followers Active since 2015
NextDoor
1,453 neighbors
Twitter 8,296 followers Active since 2009
Source: Planning Team Research & Analysis
MyHHI
Mobile App
Instagram
1,248 followers 105 posts
TOWN FACEBOOK FOLLOWERS
Total followers of the Town of Hilton Head Island’s Government facebook page have grown steadiliy since its launch
LinkedIn
2,272 followers
YouTube
841 subscribers 50,000+ total views
The MyHHI Mobile App lets citizens report nonemergency issues to the Town via their smartphone, tablet, or computer. This immediate line of communication also allows the Town to alert the community in the event of natural disasters and emergency situations.
The Island’s community tapestry make-up reveals a diverse and unique segmentation.
• The Community Tapestry model is designed to categorize neighborhoods and communities in the United States based on a combination of demographic and socioeconomic characteristics. This tool (developed by the Environmental Systems Research Institute) helps businesses tailor their marketing strategies and locate consumer markets based on spending patterns.
• Hilton Head Island is relatively unique in that a majority of the population, 61.4%, fall into one segment. This segment, “Silver & Gold,” is made up of seniors with money to spend. They have retired to sunnier climates and have free time and resources. Implications of a large segment of this population are more on-Island healthcare needs and higher spending on luxury items and convenience services.
• The next largest portion of the population, 7.8%, falls into the Emerald City segment. These young professionals are often renters and enjoy the cultural offerings of the community. This could mean there is an opportunity for more engagement in arts on the Island, as well as shared workspace offices for remote employees.
• Following behind is the Bright Young Professionals segment at 5.4% of the population. These working families have median household incomes, home values, and rent averages close to US figures. They are potential homebuyers if affordable housing options are available, and their children make up large portions of the school system. TAPESTRY SEGMENTATION
Esri’s Tapestry Segmentation tool provides a detailed description of US neighborhoods based on their socioeconomic and demographic composition. The model uses a unique classification system that divides the U.S. population into distinct segments, each characterized by specific traits, behaviors, and preferences. The segmentation is based on a wide range of variables, including income, education, age, housing, and lifestyle preferences. The goal is to provide a more nuanced and detailed understanding of the diversity within communities.
ISLAND'S SILVER & GOLD POPULATION
61.4%
This segment is significantly larger on the Island than anywhere else in the country
Tapestry Groups
Source: Esri
Some community groups on the Island are not being reached as often as others.
• Some groups on the Island are harder to reach than others when it comes to gathering community input. Hard-to-reach groups include the native Gullah Geechee and Hispanic / Latino populations, as well as workers from the greater Beaufort County area who commute to the Island.
• In a race and ethnicity breakdown of the 2018 Our Future vision & strategic action plan, only 3.3% of the community survey respondents were Hispanic / Latino, and 2.2% were Native Islanders. No data was collected regarding the number of respondents who work but do not live on Hilton Head Island.
• The Hispanic population on the Island has grown more than 28% from 2000 to 2020 and does not show signs of slowing. Like any group, they have their own specific needs and hopes for the future of the Island that were not captured in proportion to their share of the population.
• Conversely, the African American population has decreased by over 15% from 2000 to 2020. The Town must continue to engage this population in planning conversations in order to know what they need to reverse the trend of migration.
HISPANIC & LATINO SURVEY RESPONDENTS
3.3%
The percentage of survey participants for the Our Future plan who were Hispanic and Latino was significantly lower than the group's population on the Island (13.8%)
Boys & Girls Club
The Boys & Girls Club of Hilton Head Island has served children ages 6-18 with a host of educational and recreational programs on the Island since 1990. They currently serve 260 enrolled members in their facility, built in 1999 and funded completely through donations. The organization has a diverse membership of 42% Latino, 29% Caucasian, 28% African-American, and 1% Other. Additionally, 63% of Club members fall below the national federal poverty guidelines. The organization services the vital function of providing childcare after school and during the summer through their programming.
Louise Cohen, director of the Gullah Museum of Hilton Head Island. Credit: Bailey Davidson
Credit: Boys & Girls Club of Hilton Head Island
The Island Recreation Association produces, provides, and coordinates public recreation programs through a unique, non-profit model.
• In 1977, the Hilton Head Rotary Club recognized that the existing recreational programs provided by the county government were insufficient for the youth in the community. To address this issue, the Rotary Club decided to fund and build the Island Youth Center, to provide recreation programs for the youth. The Rotary Club also supported the center’s operation in its early years as it evolved into the Island Recreation Center.
• By 1984, the demand for recreation had expanded to include residents of all ages, prompting the transformation of the Island Youth Center into the Hilton Head Island Recreation Association.
• The Association’s Board of Directors played a crucial role in acquiring land and securing funding for the construction of the Island Recreation Center, which has been managed by the Association ever since.
• In 1990, recognizing the growing recreation needs of the community, the Association partnered with the SHARE Senior Center to provide programs for the senior population. In 2013, SHARE was re-branded as Hilton Head Island Senior Center under the direction of the Island Recreation Association.
• The renovations and expansion of the current Island Rec Center completed in January 2019, including a new gymnasium, classrooms, playground, fitness equipment, indoor walking track, renovated restrooms, pool restroom facilities, and other facilities.
• The Association’s non-profit status is a unique model among municipal recreation programs which are typically managed directly by the Town. The non-profit is funded through a 35% grant from the Town of Hilton Head The balance is the responsibility of the Association’s Board to recover in order to deliver the best recreational services to residents and visitors alike.
• The quasi-government status of the association allows for proactive and nimble program planning and the opportunity to fund-raise. This model has allowed the Association to invest in novel programs like its Carmines Family Recreation Scholarship Program. This scholarship program annually awards an average of over $280,000, supporting hundreds of families and children.
POOL AND FITNESS
TOTAL MEMBERSHIPS
4,639
In 2022, there were more than 350,000 unique visits to the Hilton Head Recreation Center
2022 ASSOCIATION OPERATING BUDGET
$2.9m Programs are co-funded through ongoing support from the Town of Hilton Head and through program fees and memberships
The Association offer’s numerous adaptive recreation programs with more than 6,000 total participant visits in 2022.
Shifting Demographics and Recreation Programming
The median age for Island residents is increasing quickly, moving from 46 in 2000 to 58 in 2020. During this period, people over 55 drove a population increase, adding just over 9,000 new residents. Every other segment decreased in size. The under-18, or school-age, population is decreasing. This segment lost 13% of its share from 2000, and the decline is reflected in public school enrollment. The school system lost 400 students from 2012 to 2022, and is experiencing its largest loss among younger students below second grade. As these changes occur, there will be rolling impacts to the types of recreation programs demanded and the volume of enrollees. The growth in popularity for sports like pickleball - a lower-impact a paddle sport combining elements of tennis and table tennis - have demonstrated the latent impact older recreation users can have on the Island’s facilities and recreational programming. The Association can expect these impacts in demand and preferences to increase through the coming decade with older users continuing to grow into the most common age segment.
ISLAND RECREATION CENTER PROGRAMMING
YOUTH PROGRAMS (SELECTION)
After School Rec Club Kid’s Night Out
Vacation Club E Sports
Discovery Club Pre-School Swim Lessons
All-Day Summer Camp
ADULT PROGRAMS (SELECTION)
Fitness Classes Swim Lessons
Open Gym Pickleball Club
Community Yoga
SENIOR PROGRAMS / SENIOR CENTER PROGRAMS (SELECTION)
Exercise Classes Book Club
Dining Socials Craft Club
Card and Board Games Painting for Fun
ADAPTIVE RECREATION PROGRAMS
Challenge Camp PEP
Pockets Full of Sunshine
Source: Island Recreation Association Annual Report, 2022
ISLAND RECREATION FITNESS & POOL
(50+)
Credit: Rozel
TOPIC I
SYSTEMS
Without its network of visible and invisible infrastructure, modern life on Hilton Head Island would be impossible.
KEY TRENDS
The Island’s initial growth was predicated on reliable access to the mainland; the Town’s first bridge was completed in 1956. This spurred a wave of real estate development through the following decades.
With many attracted by an oceanfront lifestyle and the Island’s natural beauty, it is ironic how central maintaining access to fresh water is to the life and sustainability of the Island today. Without access to deep wells into the Floridan aquifer, development on Hilton Head Island could never have achieved the scale it has today. However, the water cycle is both a limiting and enabling factor for growth on the Island, and the system is increasingly under threat from explosive growth on the mainland.
A web of services and utilities are present on the Island, and each has its unique challenge of servicing a formerly disconnected community.
This topic explores the various infrastructure systems on the Island and the challenges that come with maintaining them.
1
2
3
4
5
6
7
8
9
Water use on the Island fluctuates significantly—reaching as high as 26 million gallons per day (MGD)—based on the season.
Saltwater infiltration poses a serious risk to long-term water extraction practices.
Wastewater recycling processes put treated water to use.
The Town’s efforts to manage stormwater have mitigated the potential increase of runoff by regulating development.
Town partners and other agencies deliver services to residents, businesses and visitors.
The Island outperforms major indicators of health outcomes, despite an aging population.
Only 3% of the roads on the Island are owned and maintained by the Town, with the county and state planning for major regional projects.
The Island’s renowned public multi-use pathway network is well-positioned for expansion.
Seasonal transit services broaden access with room to grow.
26 million Peak daily gallons of water usage
The Island’s source for potable water is groundwater drawn from the relatively shallow Floridan (<200 feet) and the very deep Cretaceous (>3,000 feet deep) aquifers. When islands like Hilton Head Island receive rainfall, this water infiltrates and charges a groundwater aquifer, but these unconfined sources are highly susceptible to saltwater intrusion and are not reliable long-term sources. The three Public Service Districts (PSDs) on the Island—Hilton Head, Broad Creek, and South Island—each maintain a series of deep wells that tap into confined aquifers far below the surface. On average, the three districts extract or serve a demand for 15 million gallons per day (MGD). However, peak demand can swell to 26 MGD and aligns with the high tourist season, from May to September, when the Island’s nighttime population pushes to its maximum.
PUBLIC SERVICE DISTRICTS
Hilton Head’s Public Service Districts divide the Island into three sections, but all three tap into the aquifers below the Earth’s surface.
Source: Town of Hilton Head Island
Mitigation Measures
The Island’s PSD’s have taken several measures to diversify their water sources as the longevity of the Island’s main water source, the Upper Floridan Aquifer, is now compromised by saltwater intrusion.
Mitigation Initatives:
• Reverse Osmosis Drinking Water Treatment Facility
• Aquifer Storage & Recovery Facility
• Groundwater hyrdogeologic modeling • Cretaceous well supply
Source: Hilton Head, Broad Creek, and South Island PSDs
Credit: Town of Hilton Head Island
2
3
Saltwater intrusion poses a serious risk to the long-term water extraction practices.
• The Hilton Head PSD has lost 10 drinking water wells to saltwater intrusion into the Upper Floridan freshwater aquifer from 2000 to 2023.
• Saltwater intrusion occurs when the pressure in the groundwater system is reduced, either by excessive pumping or by natural causes, such as drought. When this happens, saltwater from the ocean or nearby coastal areas can flow into the freshwater aquifer, displacing the freshwater and increasing the salinity of the groundwater.
• Only two of the utility’s four remaining Upper Floridan freshwater wells are currently unaffected by saltwater intrusion.
• Saltwater intrusion can have serious consequences for communities that rely on the aquifer for their water supply, as the increased salinity can make the water unusable for drinking, irrigation, and other purposes.
Wastewater recycling processes put treated water to use.
• Each of the Island’s three PSDs reclaims billions of gallons of treated wastewater each year.
• Through a process of capture, treatment, and release, the districts are able to irrigate landscaping and golf courses across the Island and help nourish wetlands.
FRESHWATER WELLS LOST TO SALTWATER INTRUSION
The Town has lost close to a dozen wells across its three PSDs, most recently in January 2023
RECYCLED WASTEWATER CAPTURED ANNUALLY (GALLONS)
2.2b
gallons of water are recycled across the Island's three Public Service Districts for irrigation and wetland nourishment
The Floridan Aquifer
The Upper Floridan aquifer is a limestone, freshwater aquifer located 50 to 150 feet underground. It is one of the largest aquifers in the world, and stretches from the Beaufort area southward through the Florida Everglades. Groundwater from this aquifer requires little treatment. The PSD treats this water with chloramines directly at their well sites. Unfortunately, this aquifer has been impacted by saltwater intrusion.
Credit: Hilton Head PSD
The Town’s efforts to manage stormwater have mitigated the potential increase of runoff by regulating development flood risk and improving water quality by capturing pollutants at or near the surface.
• Stormwater management refers to the proactive processes applied to control the discharge of rainwater back into the natural environment.
• On Hilton Head Island, rain events and development projects that produce large areas of impervious surfaces can lead to large and sudden surface water runoff that is not able to naturally percolate into the soil.
• Runoff can cause localized flooding, erosion, non-point pollutant discharge, and other issues.
• Through its Stormwater Management Division, the Town regulates new development with respect to its impact on runoff and site retention.
OVERALL ISLAND IMPERVIOUS SURFACE
Includes all areas acting as infiltration funnels (parking lots, roofs, etc.)
The water cycle
So much of the life and activity on Hilton Head Island revolves around water and the water cycle. Without access to freshwater aquifers, the current scale of development on the Island may never have been possible. Above ground, managing water events is another crucial concern. In major storms or—much more rarely—hurricanes, stormwater management best practices can mitigate the risks to safety, property, and the overall health of waterways. The Town and its partner Public Service Districts have invested millions of dollars to ensure the health and resilience of these systems in the long term.
Pervious parking areas, like the system picture above at Islanders Beach Park, allow rain water to percolate into the ground. This helps to re-charge ground water aquifers and minimize run-off.
Credit: Town of Hilton Head Island
HIltonHead.com
Town partners and other agencies deliver services to residents, businesses and visitors.
• Public safety is maintained by the Beaufort County Sheriff’s Office. While headquartered in Beaufort, a fully-staffed substation is located on the Island and includes an enforcement and investigative department.
• In 2020, the County passed an ordinance to assess a special tax on property owners in the Town in order to raise the $4.4 million in revenue necessary to serve the Island. This controversial “special” assessment was the result of a study that showed rising costs to serve the Island and a need to address growing budgetary limitations.
• The Town’s ten planned unit developments (PUDs) contract with South Carolina Law Enforcement Division (SLED) certified private security to provide law enforcement authority within their communities.
• Some of the area’s electricity providers are Palmetto Electric Cooperative and Dominion Energy. Hargray Communications and Spectrum are among the local options for internet / phone / cable.
• Over 17 years, Palmetto Electric has been working toward “underground” power distribution and to harden against storm events. It has converted just over 1,200 transformers and 115 miles from above-ground to underground systems.
• Trash and recycling are managed by several private companies including: Republic Services, Capital Waste Services, and Waste Management. Businesses are required to use a private waste and recycling company.
• The Hilton Head Island Convenience Center, run by Beaufort County, allows residents to drop off their trash and recycling up to three times a week per household. The Convenience Center is open 6 days a week, and closed on Wednesdays and holidays.
• The Town provides other direct services not listed above, but can be found on the Town website.
In early 2015, fiber Internet infrastructure was installed on Hilton Head Island, providing residents with high-speed Internet access. Data shows that the average download speeds in the Town (157 MBPS) are currently higher than the statewide and national average, while average upload speeds (30 MBPS) are lower than the statewide and national average. Credit: New York Times
Credit: Shelter Cove, Hilton Head Island
The Beufort County Sheriff’s Office maintains a substation at 70 Shelter Cove Lane on Hilton Head Island.
7
The Island outperforms major indicators of health outcomes, despite an aging population.
• The Hilton Head Regional Healthcare system maintains the Island’s 109 hospital beds. Hilton Head Hospital provides short-term acute care and provides services in orthopedics, cardiovascular health, stroke treatment, and more.
• The top number of Medicare inpatients in 2022 were seen for ‘medicine,’ which encompasses less specific reasons including traumatic injury, allergic reactions, and other injuries, with an average length of stay of four days. The second largest number were seen for cardiology, with an average stay of three days.
• In 2023 there are 150 physicians on the Island. Compared to the 2023 population, that is one physician for every 251 residents, and one for every 170 residents over age 44. These ratios out perform the state and national averages.
Only 3% of the roads on the Island are owned and maintained by the Town, with the county and state planning for major regional projects.
• Of the 400 miles of roadways on the Island, the Town maintains only 14 miles. The longest, a segment of Arrow Road, runs for threequarters of a mile from Helmsman Way to Archer Road.
• Because of this division of ownership, the Town must collaborate with other entities, such as SCDOT and Beaufort County, to facilitate upgrades. For example, the Town has agreements with the state and county to remove disaster-generated debris.
• Measuring from the entrance to William Hilton Parkway, the average daily traffic is 57,400 vehicles (or over 400,000 cars per week). Volumes have grown along with tourism and events, leading to some concerns about future levels of service.
• SCDOT is proposing to make improvements to the US-278 corridor between Bluffton and Hilton Head Island, including the replacement of the Island’s existing gateway bridges. However, the multi-billion-dollar project has sparked a community conversation about the potential impact of the transportation project on community character.
• The Town has initiated studies to develop its own standards for corridor development and to provide an alternative to the alignment of the roadway and the landing area of the state’s new proposed bridge.
PHYSICIANS PER RESIDENTS,
Source: Association of
TOP 10 LONGEST TOWN-OWNED ROADS
Source: Town of Hilton Head Island
WHP Gateway Corridor Project
The SC Department of Transportation (SCDOT) and Beaufort County are undertaking the US 278 Gateway Corridor project to address roadway issues along US 278 from the intersection of Moss Creek Drive to the intersection of Spanish Wells Road. Working with SCDOT, the Town of Hilton Head Island and local design and transportation consultants are using local knowledge to create community-based solutions to enhance SCDOT’s preferred approach. This should aid the approximately 60,000-70,000 vehicles that use the corridor daily.
Cross Island Parkway
Tolls were removed from the CIP in 2021 with the expiration of the levy period. Per SCDOT, daily traffic counts across the CIP had reached an all-time high in 2023, with over 35,000 vehices a day for the month of July.
Sea Pines Circle Traffic & Safety Hotspot
Vehicular crashes cluster around the Sea Pines Circle area. The redesign of this intersection was an area of focus through the Corridors Planning Project.
In 2022, peak midday and PM traffic caused consistent roundabout failure, where approaches from all four directions had queues in excess of 350 feet.
Hilton Head Airport Improvements
The planned expansion of the airport's terminal will triple the internal capacity of the facility, providing three total gates and greatly expanding daily flight potential.
Transporation Impact Analysis
Found in Section 16 of the Town’s Land Managment Ordinance (LMO), a Transportation Impact Analysis (TIA) is a requirement for new development proposals. The intent of a TIA is to ensure that proposed developments, if approved, would not cause a street facility to fall below the Town’s adopted traffic service levels standards.
Source: Planning Team Research and Analysis
Credit: The Island Packet
The Island’s renowned public multi-use pathway network is well-positioned for expansion.
• Pathways are a signature feature of Hilton Head Island and are highly valued by residents and visitors. Trip Advisor ranks Hilton Head Island Bike Trails as the third most popular attraction on the Island.
• The Island currently has over 70 miles of existing Town-owned pathways (some neighborhoods may benefit with improved direct access to these facilities).
• The existing multi-use pathway network is extensive and interconnected, but there are opportunities to better connect to existing neighborhoods and improve safety.
• Rental bikes are affordable and widely accessible. Over 30 rental shops within the Town provide nearly 15,000 bikes for rent.
• The Island’s pathways provide critical multi-modal connections to neighborhoods and destinations while contributing to the creation of Complete Streets throughout the Island.
• Current pathway routes are not intuitive or apparent due to missing connections and inconvenient access, and there is little adherence to best practices for pathway widths, horizontal curves, and queuing areas.
• Minimal separation is provided in some areas between pathways and vehicles, including safety hazards from turning vehicles at driveways.
Island Schools
MILES OF PUBLIC PATHWAY
The Island's pathway network is extensive and one of the country's most comprehensive
There are five public and three private schools on the Island: Hilton Head Island Early Childhood Center, Hilton Head Island Elementary School, Hilton Head Island School for the Creative Arts, Hilton Head Island Middle School, and Hilton Head Island High School are all public schools. They are operated under the Beaufort County School District. There is a decreasing trend in enrolled capacity from the High School to the Elementary, with the High School at 98% usage, the Middle School at 85%, and the Elementary School at 63%.
Source: Town of Hilton Head Island Corridors Plan
The design of pathways must go beyond establishing the bare minimum space requirements for various user groups. Pathways should be designed for safe usage, especially along highlytrafficked roadways.
Credit: Hilton Head Island Elementary School
9
Seasonal transit services broaden access, with room to grow.
• Palmetto Breeze Transit services the Lowcountry, including public transportation on Hilton Head Island.
• In addition to regional routes and central to mobility within the Town, the Palmetto Breeze Trolley service provides a highly efficient and sustainable alternative to car travel for employees, residents, and visitors on the island. According to the LRTA’s Annual Comprehensive Financial Report, in FY 2022 more than 48,000 passengers rode The Breeze Trolley, compared to nearly 27,000 in 2021.
• Access to public transportation is proven to be a leading driver of increasing economic mobility for underserved communities. Palmetto Breeze’s “Ride Free - New Job Pass” provides a free, 7-day transit pass for any rider starting a new job. Initiatives such as these are centered around utilizing public transportation as a catalyst for lowering poverty rates, driving down housing costs, and increasing workforce mobility.
• In 2023, the Palmetto Breeze Transit Service collected two industry awards for achievements in Transit Maintenance and Transportation Marketing.
• A transit development plan prepared for the Lowcountry Council of Governments in 2018 identified higher areas of need along and northwest of Beach City Road (including Hilton Head Hospital) and the south end of the Island extending southwest of Pope Avenue.
The Breeze Trolley serves 21 stops around the Island, but its service is not evenly distributed. Aside from being a seasonal service that only operates from April to September, the trolley does not serve some key locations such as Hilton Head Island Airport.
PALMETTO BREEZE TRANSIT SERVICE
8
The Island is currently serviced by eight regional routes that provide access to and from mainland locations
REGIONAL EMPLOYMENT
1,730
The share of Hilton Head Island workers that live in Bluffton jumped from 7.6% in 2002 to 23.5%, or 1,730 people, in 2020
THE BREEZE TROLLEY STOPS
21
The Breeze Trolley currently serves 21 stops around the Island, with opportunities for expansion toward the airport
LAND USE
Land is a community’s most important resource. Regulating the form, location, and aesthetics of development is one of a municipality’s primary responsibilities and the area where the community has the most control. This section examines the Town’s approach to this management, the opportunities presented by development and – now more commonly – redevelopment, and the current mix of land uses.
KEY TRENDS
The visionary work of a few planned developments in the early days of the James F. Byrne Bridge has shaped Hilton Head Island into the iconic destination that it is today. With raw development slowing down in recent decades and land availability becoming sparse, Hilton Head Island may face less of the explosive growth it witnessed in past decades, instead relying on incremental changes to meet the needs of its residents and visitors alike.
This chapter explores the existing land use patterns and recent development trends on the Island. Land use and development on Hilton Head Island is regulated by a number of authorities, including the Land Management Ordinance discussed within this chapter. Zoning determines what types of development should occur on the Island and where it may be located; it is a critical component in shaping the character and productivity of the Town. While much of the land on the Island is already developed or under tight constraints that hinder development, there are many areas where the Town of Hilton Head Island can continue to grow and evolve.
1
2
About 7%, or 1,500 acres, of the Island’s total land area (above mean high tide) is undeveloped. Of that 1,500 acres, 28% (425 acres) is Town-Owned Property.
The Land Management Ordinance, in conjunction with several boards and commissions, regulates the character and desired development forms on the Island.
3
4
5
6
7
Redevelopment of aging retail centers and the addition of single-family homes are the biggest development trends on the Island.
Areas with the least amount of constraints to development are the biggest targets for growth and re-investment.
While the Island as a whole is dominated by Planned Development zoning districts, overall land use is more evenly distributed.
Older commercial properties are more susceptible to change or redevelopment in the near-term.
Housing density is slowly increasing but varies significantly across the Island’s neighborhoods.
1,500
Acres of Undeveloped
Land*
Hilton Head Island covers 21,862 acres of land above mean high tide, but in 2023 the community is approaching “build out”. In this condition, the majority of large, unconstrained parcels have been developed or are entitled to be developed. Just over 1,500 acres, or less than 7% of the Island’s total land area is vacant or undeveloped land. This only considers properties that have never been developed and are considered ‘greenfield’ sites.
The transition of land use across the Island has been shaped by several different key eras of settlement and development. Before the arrival of European settlers, Native Americans lived on Hilton Head Island seasonally. The first Europeans arrived in 1717 when the Island was sparsely populated. Following the Civil War, formerly enslaved people created a settlement on the Island with their own culture and economy, known as the Gullah-Geechee community, driven by new opportunity to own land.
From the 1930s to the ‘50s, Charlie Simmons operated a ferry from Savannah to Hilton Head Island until the state ferry began operation in 1953. Development during this time was limited because the only way to reach the Island was via ferry or private boat. The James F. Byrne Bridge opened in 1956, making the Island accessible by car. Soon after, Charles E. Fraser began developing the Island’s first Planned Unit Development (PUD), Sea Pines, on the southern portion of the Island.
The Bridge led to an increase of development on the Island, allowing for the addition of several PUDs, the Island’s first golf course, and the introduction of telephone service. The 1970s and ‘80s saw continued development and a dramatic increase in people: the Island added 10,000 residents between 1969 and 1982, and visitors increased by over 250,000 from 1975 to 1982. Four more PUDs were built as well as a hospital, and the bridge was expanded to accommodate more traffic.
The Town of Hilton Head Island was finally incorporated in 1983 as a response to the rapid development of the Island. The Town’s chief goal was to create standards for development and implement strategies to manage growth. The population growth has been slowing down since 2000; as a result, development on the Island has taken on a new direction.
*Includes
portions of undeveloped lots inside master planned communities such as Sea Pines or Wexford.
Before 1960
1960–1980
1980–2000
After 2000
ALL BUILDING STRUCTURES BY YEAR BUILT
The maps depict the time at which all current structures on the Island (both residential and commercial) were built.
DEVELOPMENT WITHIN THE LAST 5 YEARS: 2017–2022
The hotspots in red show greater concentrations of new construction within the last five years. These higher concentrations represent new residential subdivisions occurring within primarily historic neighborhoods.
Source: Planning Team Research & Analysis
The Land Management Ordinance, in conjunction with several boards and commissions, regulates the character and desired development forms on the Island.
• The Town’s Land Management Ordinance (LMO) is its instrument for guiding the development and use of land within the Town’s jurisdiction. It is the regulating power that enforces the Town’s Comprehensive Plan.
• The LMO aims to promote public health, safety, and general welfare, while recognizing the rights of real property owners by adopting a comprehensive zoning ordinance for the Town and guiding administrative procedures and development standards.
• Town Council votes on any amendments to the LMO, including text changes, rezoning of districts, and/or new PUD districts. In addition, a host of individuals and governing bodies influence land use decisions across the Island. There are several different boards and commissions, including the Planning Commission and Board of Zoning Appeals, whose duties have direct land use implications.
BOARDS, COMMISSIONS AND COMMITTEES
YEAR-ROUND POPULATION IN 1987
Slightly less than half of the Island’s population in 2023
7 members
Prepares and updates Comprehensive Plan and reviews proposed zoning changes, public projects, conditional uses, street and development name changes, and traffic impact applications.
Reviews the aesthetics of new development and renovations of existing developments in order to uphold Island character.
Reviews land use issues, including proposed variances from the Town’s LMO, special exception applications, and appeals of decisions made by an administrative official.
Identifies and assists in the preservation of the Gullah-Geechee culture, which includes taxes, land use, heir property, and the general sustainability of the Gullah-Geechee community. Construction Board of Adjustments & Appeals 9 members
Decides on appeals made against Building Official determinations as they pertain to interpretation of building and fire codes; also oversees variances from base flood elevations. William Hilton Parkway
Formed in 2023, this group plays a critical role in comprehensively reviewing the William Hilton Parkway Gateway Corridor Project.
Source: Planning Team Research & Analysis
Redevelopment of aging retail centers and the addition of single-family homes are the biggest development trends on the Island.
• Much of the significant recent residential development has entailed new single-family neighborhoods built within the Low to Medium Density Residential (RM-4) zoning district.
• The minimal space left for new commercial development opportunities and an aging stock of existing buildings is leading to a critical redevelopment moment for the Island. The Towne Center at Shelter Cove highlights this trend, which is likely to continue into the next decade where traditional retail centers with are repositioned into more engaging and vibrant commercial districts. The Towne Center redevelopment transformed a traditional mall of over 350,000 square feet into an open air, pedestrian-friendly mixed-use center. In addition to completely reconfiguring the mall’s original footprint, existing roadways and parking areas adjacent to the marshland were converted into roughly 200,000 square feet of public space.
• The Towne Center at Shelter Cove is an example of how the Mid-Island District Center Concept can be utilized in practice. These redevelopments aim to build upon the Island’s Lowcountry aesthetic, while also increasing access to public amenities and open space.
The Mid-Island District Center Concept
The Town is taking proactive steps to prepare for and guide future redevelopment projects in areas - like Mid Island - where there is more susceptibility to change. The District Center concept includes a vertical mix of uses and a greater emphasis on the public realm.
2013: Shelter Cove Mall
2023: Towne Center at Shelter Cove
Areas with the least amount of constraints to development are the biggest targets for growth and re-investment.
• When considering constraints to development, or the edges within which development should be confined, several different criteria are taken into account, including cultural considerations, locations of public property, transportation access, and environmental factors.
A. PLANNED UNIT DEVELOPMENTS
The Town’s land area and zoning are primarily characterized by Planned Unit Developments. These areas operate under an approved master plan that governs their growth, aesthetics, circulation, and other community development considerations. While negotiations can occur between the communities and the Town, development opportunities (outside the district’s master plan) are not likely.
B. HISTORIC NEIGHBORHOODS
The Island’s historic neighborhoods are centers of cultural and historical significance. While development is by no means precluded, the opportunities must be pursued with special care and respect for existing sites and neighbors.
C. TOWN OWNED PROPERTY
Parcels owned by the Town may present an opportunity for certain, specific types of development, but in most cases these properties were purchased for the purpose of preservation. Funding source and restrictive covenants often limit devlopability of Town-Owned property. Only about 100 acres of the Town’s nearly 1,500 acres is undeveloped and permissive of future development.
D. ACCESS TO ARTERIAL ROADS
Access to major roadways is key for visibility and economic viability. Land farther than 750 feet from a major arterial roadway is considered constrained.
E. HIGH RISK FLOOD ZONES
High risk flood zones are established by FEMA and have associated insurance premiums. Areas at greatest risk of flooding have more obstacles to financing and construction.
F. TREE CANOPY & SALT MARSHES
Both salt marshes and mature tree canopy are environmental assets many on the Island hope to protect, and also factors that make development difficult or much more expensive.
A Future Informed by Resiliency Planning
A Resiliency Plan is a comprehensive strategy that outlines actions to help a community adapt to and mitigate the impacts of climate change. This type of plan equips the Town with a robust, scientifically-backed understanding of the dynamic elements that pose the highest risk to the Island. Resiliency is also tied to the growth of environmental liability, particularly as it pertains to real estate and the growing risk and price tag involved in financing and insuring both new and existing built assets on the Island. A Resiliency Plan would help the Town navigate the complicated and evolving environmental landscape.
Credit: The Island Packet
POTENTIAL CONSTRAINTS TO DEVELOPMENT
A. PLANNED UNIT DEVELOPMENTS (PUDS)
B. HISTORIC NEIGHBORHOODS
D. ACCESS TO ARTERIAL ROADS
E. HIGH RISK FLOOD ZONES
F. TREE CANOPY & SALT MARSHES
C. TOWN OWNED PROPERTY
The Island is made up of several different “place types” that have distinctive land use and character patterns.
• Hilton Head contains a mixture of “place types” that ultimately define the character of the Island; these place types are districts that follow a particular development pattern that is relatively unique and contributes to the overall aesthetic and experience on Hilton Head Island.
• The Suburban Living category includes low-density single-family neighborhoods. Much of this category is made up by Planned Unit Developments; amenities such as trails, parks, and centralized swimming pools and golf courses are typically found within these communities.
• The Resort Destination place type includes facilities with regional tourism draw and a plethora of on-site amenities that allow for an all-inclusive experience. Dining and services are found in close proximity to lodging. These areas are promoted through strong marketing and usually have a specific, recognizable brand.
• High Density Seaside areas are made up of primarily condos, apartments, and hotels with direct ocean access and views. The main selling point is walkable access to the beach. These areas see a high level of influx between daytime and nighttime population, as well as seasonal changes via tourism.
• The Marshes place type is defined largely by the marshland environment created by Broad Creek and the Calibogue Sound, this area is primarily made up of smaller, historic single-family neighborhoods with occasional commercial establishments.
• Commercial Activity Corridors include a mix of high- and medium-intensity commercial uses along a major roadway. This includes regional shopping attractions like grocery stores, big-box retail, local retail, restaurants, medical offices, and hotels. This category is generally automobileoriented.
• Each of these place types exists in relative isolation from one another; in other words, separated uses across the various districts of the Island have resulted in a car-dependent environment for residents and tourists alike.
Which operate under the purview of private Master Plan agreements with limited involvement from the Town.
ISLAND-WIDE LAND USE
Source: Town of Hilton Head Island
ISLAND-WIDE ZONING (TOP 7 BY LAND AREA)
Source: Town of Hilton Head Island PORTION OF THE ISLAND’S TOTAL LAND AREA DESIGNATED TO PLANNED DEVELOPMENT ZONING
KEY
CC - Community Commercial
CON - Conservation
CR - Coligny Resort
IL - Light Industrial
LC - Light Commercial
MED - Medical
MF - Marshfront Mixed Use
MS - Main Street
MV - Mitchelville
NC - Neighborhood Commercial
PD-1 - Planned Development
PR - Parks and Recreation
RD - Resort Development
RM-4 - Low to Moderate Density
RM-8 - Moderate Density
RM-12 - Moderate to High Density
RS-3 - Single Family
RS-5 - Single Family
RS-6 - Single Family
S - Stoney Mixed Use
SPC - Sea Pines Commercial
WMU - Water-Oriented Mixed Use
Creek
CrossIslandPkwy
WilliamHiltonPkwy
Unbuilt capacity by zoning district
One way to measure potential buildable housing capacity is to look at the zoning district allowances per code, subtracted by the amount of current housing units within those districts. The remainder is the number of entitled capacity that remains within each zoning district (based upon their total acreages). This is a broad, analytical exercise that doesn’t account for site specific development
considerations and constraints, but is meant to give an overview of which zoning districts hold the most potential for residential growth as an order of magnitude, based on current entitlements. With much of the Island “built-out”, this is particularly relevant to long-term redevelopment scenarios under the existing zoning conditions.
ZONING DISTRICTS WITH MOST REMAINING ENTITLED HOUSING
ZONING DISTRICTS ENTITLED BUT UNBUILT UNITS
RM-4 - LOW TO MODERATE DENSITY RESIDENTIAL >3,000
RD - RESORT DEVELOPMENT 2,000-3,000
MS - MAIN STREET 2,000-3,000
WMU - WATER ORIENTED MIXED-USE 2,000-3,000
RM-8 - MODERATED DENSITY RESIDENTIAL 1,000-2,000
Source: Town of Hilton Head Island, ESRI Business Analyst
Extruded heights represent the unbuilt entitled additional housing capacity (via zoning entitlement) for non-PUD residential zoning districts
1/4 of Public/Civic land (7% of the total Island) is Town-Owned.
Undeveloped represents about 7% of total Island land use, with the “other” category including land uses that do not fall within existing classifications.
Source: Town of Hilton Head Island
6
Older commercial properties are more susceptible to change or redevelopment in the near-term.
While there are many factors that can influence the likelihood of real estate changing from its current form or function, two main criteria can be broadly applied to highlight properties with a relatively high susceptibility to change in coming years.
These criteria are undeveloped property and commercial property built pre-1983. Because of the complexities that permit change within the Planned Unit Developments (PUDs), this susceptibility analysis has been focused to the areas outside of the Island’s major PUDs.
SHARE OF UNDEVELOPED PROPERTY COMPARED TO ISLAND TOTAL
UNBUILT CAPACITY IN PLANNED COMMUNITIEs
300 acres
UNDEVELOPED LAND IN THE AREAs OUTsIDE OF MAJOR PLANNED DEVELOPMENTs
1,114 acres
Undeveloped Property
Undeveloped property is land that has not been built on or altered by public or private capital investments. This type of property is often the most desirable for development investment (compared to redevelopment) because it is a “blank slate”, with more straightforward understanding of cost and risk. This category includes both residential and commercially zoned undeveloped land. Properties in the category may have specific site characteristics the present challenges for development like environmental or political constraints.
Source: Town of Hilton Head Island, ESRI Business Analyst
TOTAL IsLAND LAND AREA
22,000 acres
COMMERCIAL PROPERTY BUILT PRE-1983 IN AREAs OUTsIDE OF PLANNED DEVELOPMENTs
196 acres
Commercial Property Pre-1983
Commercial properties built before 1983, and thus older than 40 years old, are properties that are reaching latter phases in the life cycle of typical commercial buildings. Major reinvestment in the form of renovation, or even repositioning and reuse, become much more likely as owners and landlords seeks to keep buildings viable and attractive to the desires of the broader market. Buildings constructed before 1983 were also built before the Town was incorporated, therefore not subject to its building and site design standards.
CHANGE SUSCEPTIBILITY
District Planning
To best understand the Island’s land use dynamics, both currently and into the future, its important to note the eight planning subdistricts of the Island. Each of the areas share common characteristics with respect to land uses, neighborhood character, access and geography. The eight planning districts do not include the following master planned communities: Hilton Head Plantation, Palmetto Hall, Port Royal, Indigo Run, Spanish Wells, Wexford, Long Cove Club, Palmetto Dunes, Leamington, Shipyard, and Sea Pines.
Source: Town of Hilton Head Island GIS
TOP 3 EXISTING LAND USES
Marshes
Current Commercial SF: 122,446 SF
Current Housing Units: 1,120
195 acres susceptible to change
Developable Capacity (per Zoning of Parcels Susceptible to Change)
Commercial SF: Approx 25,000 SF
Housing Units: Approx 450 Units
Main Street
Current Commercial SF: 1,312,612 SF
Current Housing Units: 549
54 acres susceptible to change
Developable Capacity (per Zoning of Parcels Susceptible to Change)
Commercial SF: Approx 310,000 SF
Housing Units: Approx 175 Units
Skull Creek
Current Commercial SF: 120,057 SF
Current Housing Units: 1,366
337 acres susceptible to change
Developable Capacity (per Zoning of Parcels Susceptible to Change)
Commercial SF: Approx 150,000 SF
Housing Units: Approx 1,000 Units
Mid-Island
Current Commercial SF: 2,349,514 SF
Current Housing Units: 1,781
355 acres susceptible to change
Developable Capacity (per Zoning of Parcels Susceptible to Change)
Commercial SF: Approx 725,000 SF
Housing Units: Approx 1,000 Units
Chaplin
Current Commercial SF: 27,532 SF
Current Housing Units: 2,134
44 acres susceptible to change
Developable Capacity (per Zoning of Parcels Susceptible to Change)
Commercial SF: Approx 85,000 SF
Housing Units: Approx 150 Units
Forest Beach
Current Commercial SF: 293,589 SF
Current Housing Units: 2,735
36 acres susceptible to change
Developable Capacity (per Zoning of Parcels Susceptible to Change)
Commercial SF: Undefined*
Housing Units: Undefined*
*11 acres of Coligny Resort Zoning is susceptible to change and has no maximum commercial or housing unit restriction.
Parkway
Current Commercial SF: 1,446,360 SF
Current Housing Units: 375
61 acres susceptible to change
Developable Capacity (per Zoning of Parcels Susceptible to Change)
Commercial SF: Approx 250,000 SF
Housing Units: Approx 75 Units
Bridge-to-Beach
Current Commercial SF: 1,581,646 SF
Current Housing Units: 542
224 acres susceptible to change
Developable Capacity (per Zoning of Parcels Susceptible to Change)
Commercial SF: Undefined*
Housing Units: Approx 850 Units
*60 acres of Sea Pines Commercial Zoning is susceptible to change and has no maximum commercial square footage restriction
Planning District Property Susceptible to Change
Unbuilt Capacity
A majority of the Island’s land area is made up of Planned Developments, each of which are entitled to certain development rights. Those rights are legally binding agreements, specifying the maximum allowances for housing units within each respective community. Across all of the Island’s planned developments there are 690 single family housing units that have been entitled but not yet constructed. The breakdown of how many remain within each planned development can be seen in the accompanying map.
Source: Town of Hilton Head Island GIS
Source: Planning Team Research and Analysis
Housing Density
Housing Density is based upon total housing units per acre. A housing unit includes single family homes, condominiums, villas, townhomes, and apartments. For the Planning Districts and Planned Developments that include multifamily
Source: Town of Hilton Head Island GIS HOUSING DENSITY BY NEIGHBORHOOD / PLANNING
DENSITY THROUGH
Housing density is slowly increasing but varies significantly across the Island’s neighborhoods.
• Housing density refers to the number of housing units (such as houses, apartments, or condominiums) within a specific area, often measured in terms of dwellings per unit of land area. It is a key indicator of how closely packed or dispersed residential structures are within a given region.
• The built density on the Island increased dramatically through the 1980’s as most the Town’s planned communities began to develop. The planned communities such as Sea Pines or Spanish Wells are, generally speaking, less dense that development that has occured with the planning districts (or outside of a planned community).
• Housing density is driven upwards by multi-unit projects and districts that are close to the beach tend to include more of these properties. The Island’s highest density 4.5 dwelling units per acre is inside the Forest Beach Planning District.
HOUSING DENSITY VISUAL COMPARISON
ISLANDWIDE RESIDENTIAL DENSITY, 2023
1.5
Densities have increased slowly from 2000, from 1.2 to 1.5. This is mostly driven by projects in the Island’s Planning Districts or outside of the Planned Communities
Source: Nearmap, 2023 imagery
7. FOREST BEACH
2. SKULL CREEK
K. SEA PINES
6. PARKWAY
1. MARSHES
5. CHAPLIN
SOURCES & RESOURCES
The conditions and trends summaries presented through the previous chapters were distilled from numerous data sources, plans, publications, and additional resources. This section presents an index of those resources along with additional links and connected information. All sources presented through the section are hyperlinked.
TOPIC SOURCE
U.S. Decennial Census 2000–2020
American Community Survey 2010–2020
Census Flows Mapper
South Carolina Department of Education
Demographics
American Hospital Directory
Hilton Head Regional Physicians Network
HealthGrades.com
CauseIQ
County Health Rankings
Esri
2017 Gullah Geechee Cultural Preservation
Project Report
TOPIC SOURCE
American Community Survey 2000–2020
U.S. Decennial Census 2000–2020
Beaufort Regional Chamber of Commerce
The Conditions & Trends Database
Workforce
The Town of Hilton Head Island
Comprehensive Annual Financial Report
The Island Packet
Technical College of the Lowcountry
Federal Reserve Economic Data
The source data and tables for the summarized conditions and trends topical series is organized into a single database. This can be accessed through the QR Code above. Data will be updated periodically based on new releases from their sources.
Click for link to database
TOPIC SOURCE
U.S. Bureau of Economic Analysis
Federal Reserve Economic Data
The Town of Hilton Head Island
Economics
Beaufort County, SC – HHH Airport
Terminal Expansion
Hilton Head Island Airport
Lowcountry Area Transportation Study
Hilton Head Island–Bluffton Chamber of Commerce & Visitor Convention Bureau
American Community Survey 2000–2020
U.S. Decennial Census 2000–2020
TOPIC SOURCE
Air DNA
American Community Survey 2000–2020
CoStar
Beaufort County Auditor
Real Estate
Zillow
The Town of Hilton Head Island - Short
Term Rental Permits
TOPIC SOURCE
National Hurricane Center
Green Infrastructure Center
Our Plan Hilton Head Island South Carolina 2020-2040
Natural & Cultural Environment
SeaTurtle.org
DeepRoot.com
HiltonHeadIsland.com
The Town of Hilton Head Island - Beach
Renourishment Program
The Island Packet
South Carolina Department of Health
Environmental Control
National Oceanic and Atmospheric
Administration
Environmental Protection Agency
IOP Science
National Weather Service
Beaufort County, SC
S.C. Sea Grant Consortium
TOPIC SOURCE
American Community Survey 2000–2020
Zillow
RedFin
Housing
Department of Housing and Urban Development
Caring.com
Seniorly
Senior Housing Net
Affordable Housing Online
PublicHousing.com
Eviction Lab
Our Plan Hilton Head Island South Carolina 2020-2040
TOPIC SOURCE
American Community Survey 2012–2021
The Town of Hilton Head Island
Think HHI and the Lowcountry
Governance
TOPIC SOURCE
Our Plan Hilton Head Island South Carolina
2020-2040
Community Engagement
Hilton Head Island–Bluffton Chamber of Commerce
TOPIC SOURCE
Town of Hilton Head Island
Hilton Head Public Service District
Broad Creek Public Service District
South Island Public Service District
Systems
Beaufort County Sheriff’s Office
Palmetto Electric Cooperative Inc.
United States Geological Survey
South Carolina DOT
BreezeTrolley.com
University of Wisconsin Population Health Institute
American Hospital Directory
HiltonHeadIsland.com
ExploreHiltonHead.com
Palmetto
Land Use
The Providence Group
The Town of Hilton Head Island
RELEVANT PLANS AND STUDIES
• Strategic Action Plan, 2021
Details activities of staff and associated entities necessary to implement the policy directions, furthering the Town’s mission from the Our Plan (Comprehensive Plan)
• Beach Management Plan, 2017
Analyzes Hilton Head beaches,their environmental constraints, and strategies for disaster planning and preserving public access
• Our Plan (Comprehensive Plan), 2020
Serves as the policy planning framework, and guide for a resilient and successful future of Hilton Head Island
• Fire Rescue Strategic Plan, 2019
Establishes the priorities and expectations of Hilton Head’s Fire Rescue Organization
• Hazard Mitigation Plan, 2021
Required by the Federal Emergency Management Agency (FEMA), it serves as the representation of the jurisdiction’s commitment to reduce risks from natural hazards
• Mid-Island District Plan, 2022
Envisions a future for the Mid-Island District that combines park design with community planning
• Mid Island Tract Master Plan, 2022
Aims to ensure that a park on the Mid-Island Tract serves the entire community, residents, and visitors
• Office of Cultural Affairs Strategic Plan 2021
Aims to promote and support Hilton Head Island as a vibrant and diverse place that is celebrated for the ways arts and culture enrich the community
• Parks & Recreation Master Plan Pt. 1, 2020
Evaluates Hilton Head Island’s access to public parks and makes recommendations to increase the level of service across the community over the next ten years
• Workforce Housing Strategic Plan, 2019
Aims to expand housing options for workers who serve the Hilton Head Island economy and community
• Workforce Housing Framework, 2022
Recommendations for perserving and expanding workforce housing options on the Island
• 2045 LATS Long Range Transportation Plan, 2022
Outlines the strategies for creating a resilient transportation system, accommodating both existing and future needs
• Broad Creek Management Plan, 2023
Fulfills a recommendation from the 1999 Comprehensive Plan to manage and protect the most significant and vulnerable natural resource on the Island
• Stoney Initiative Area Plan, 2023
Fills the gap in the Ward One Master Land Use plan regarding the Stoney Neighborhood
• Chaplin Initiative Area Plan, 2002
Provides land use provisions with associated density and determines infrastructure services needed to accomplish the goals of the Chaplin area
• Ward One Master Plan, 1999
Addresses the needs in equity in addressing the aspirations of the community for groups historically left out of the economic progress enjoyed by relative newcomers
• Hilton Head Island Airport Master Plan
Examines land use and facility requirements in line with sustainability and future airport development priorities
REGIONAL CONTEXT
The Town of Hilton Head Island is part of a dynamic and fastgrowing region. Investments in roads, ports, and airports are expanding the jobs market. Homebuilding − to support these jobs and a burgeoning retirement community − is occurring at similar rates. This map depicts the Island’s regional context and includes portions of Beaufort County, Jasper County, and the Savannah Metropolitan Area of Georgia.