Metropolitan Futures Initiative (MFI) Report Irvine at 50: The changing landscape of housing, commuting, and amenities June 2022
Presented by the Metropolitan Futures Initiative (MFI) School of Social Ecology University of California, Irvine © June 2022
Irvine at 50: The changing landscape of housing, commuting, and amenities June, 2022
Irvine at 50: The changing landscape of housing, commuting, and amenities June 2022
MFI Research Team
John R. Hipp
Visiting Scholar Sugie Lee
Jae Hong Kim
Graduate Student Researchers: Benjamin Forthun Donghwan Ki
Postdoctoral Researcher: Nene Osutei
Undergraduate Student Researchers: Mikaela Cortes Yvonne Phan Kathy Tran
Cite this Report: Cite this report: John R. Hipp, Nene Osutei, Benjamin Forthun, Jae Hong Kim, Sugie Lee, Donghwan Ki. (2022) “Irvine at 50: The changing landscape of housing, commuting, and amenities” MFI Report: 2022_1. Irvine, CA: Metropolitan Futures Initiative (MFI), University of California Irvine. June, 2022.
2
Irvine at 50: The changing landscape of housing, commuting, and amenities June, 2022
University of California, Irvine The Metropolitan Futures Initiative (MFI) http://socialecology.uci.edu/mfi in the School of Social Ecology at the University of California, Irvine aims to develop an improved understanding of communities and their potential for integrative and collaborative planning and action to ensure a bright future for the region. It approaches these goals by bringing together an interdisciplinary research team along with the insights and techniques of "big data" research. By combining various large longitudinal and spatial data sources, and then employing cutting edge statistical analyses, the goal is to come to a better understanding of how the various dimensions of the social ecology of a region move together to produce the outcomes observed within our neighborhoods. With initial focus on Orange County and its location within the larger Southern California area, The Metropolitan Futures Initiative is a commitment to build communities that are economically vibrant, environmentally sustainable, and socially just by partnering the School of Social Ecology’s world class, boundary-crossing scholarship with expertise throughout Southern California. The MFI Report series presents cutting edge research focusing on different dimensions of the Southern California region, and the consequences for neighborhoods in the region. Reports released throughout the year focus on issues of interest to the public as well as policymakers in the region. In addition, the MFI webpage (mfi.soceco.uci.edu) provides interactive mapping applications that allow policymakers and the public to explore more deeply the data from each Report.
3
Irvine at 50: The changing landscape of housing, commuting, and amenities June, 2022
The MFI Research Team: John R. Hipp is the Director of the Metropolitan Futures Initiative (MFI). He is a professor in the Department of Criminology, Law and Society, the Department of Urban Planning, and Public Policy, and the Department of Sociology, at the University of California Irvine. He is also co-director of the Irvine Lab for the Study of Space and Crime (ILSSC). His research interests focus on how neighborhoods change over time, how that change both affects and is affected by neighborhood crime, and the role networks and institutions play in that change. He approaches these questions using quantitative methods as well as social network analysis.
Jae Hong Kim is the Associate Director of the Metropolitan Futures Initiative (MFI) and a faculty member in the Department of Urban Planning and Public Policy at the University of California, Irvine. His research focuses on urban economic development, land use change, and the nexus between these two critical processes. His academic interests also lie in institutional environments — how institutional environments shape urban development processes — and urban system modeling. His scholarship attempts to advance our knowledge about the complex mechanisms of contemporary urban development and to develop innovative urban planning strategies/tools for both academics and practitioners.
Sugie Lee is a visiting scholar with the MFI. He is
Nene Osutei is a postdoctoral researcher at the MFI.
a Professor in the Department of Urban Planning &
His academic interests lie in economic development and
Engineering and a director of Urban Design & Spatial
social equity. His research explores the changing roles
Analysis Lab (UDSAL) at Hanyang University in Seoul,
of higher education institutions with an emphasis on
Korea. He is interested in urban mobility, walkability, and
their contributions to economic development at different
urban safety as well as the application of urban big data
geographical scales.
and machine learning to address urban problems. Donghwan Ki is a Ph.D. student in the Department of Benjamin Forthun is a Ph.D. student in the department
City and Regional Planning at the Ohio State University.
of Criminology, Law and Society, at the University of
His research interests focus on measuring the built
California, Irvine. His research interests are focused on
environment using urban big data and computer vision.
GIS analysis, aggregate spatial research, and neighborhood definitions and boundaries.
4
Irvine at 50: The changing landscape of housing, commuting, and amenities June, 2022
Results in Brief • The presumption that suburban Irvine is dominated by detached single family units is not accurate. Currently just 40% of the housing in the average Irvine neighborhood were detached single family units compared to 56% in the remainder of the county. • Irvine has about twice as many very large-sized multifamily complexes (those with more than 50 units) compared to the remainder of the county. • Irvine residents have shorter commutes than residents in the remainder of the county or region (based on time and distance). • Residents in the remainder of Orange County have commute times about 20% longer than Irvine residents, and those of Southern California residents are 30% longer. • Residents in the remainder of Orange County have commute distances about 30% longer than Irvine residents, and those of Southern California residents are 50% to 60% longer. • Currently, 44% of Irvine residents work at jobs in the city. • Currently, Irvine workers are more than twice as likely to walk to work compared to the remainder of the county. • Irvine workers are 40-70% more likely to commute by bicycles than workers in the rest of the county. • Irvine residents have 75% more parkland within ¼ mile than do residents in the rest of the county. They have 24% more within 1-mile. • Even Irvine renters do quite well on the amount of parkland nearby compared to residents in the remainder of the county • However, Irvine residents have about half as many retail establishments within ¼ mile compared to residents in the remainder of the county, and 2/3 as many retail jobs. They also have half as many retail establishments within one mile. • The presence of neighborhoods with a high concentration of white residents (more than 85%) has greatly decreased over the history of the city. • The presence of majority Asian neighborhoods has greatly increased over the history of the city. • The presence of immigrants has grown over time, and in recent years several neighborhoods are more than 45% immigrants. • These immigrants are primarily from China, Korea, and India, and these groups tend to reside in different neighborhoods. • Nonetheless, a large number of Irvine neighborhoods exhibit high racial/ethnic mixing over time, especially since 2000.
5
Irvine at 50: The changing landscape of housing, commuting, and amenities June, 2022
Table of Contents
Page
Results in Brief..................................................................................................................................................................................................................5 Chapter 1. The History of Irvine................................................................................................................................................................................. 7 Irvine: A planned community......................................................................................................................................................................... 7 Chapter 2. Growth of City of Irvine........................................................................................................................................................................... 9 Irvine city boundary changes over time..................................................................................................................................................... 10 Development over time....................................................................................................................................................................................12 Summary.............................................................................................................................................................................................................. 14 Chapter 3. What types of housing does Irvine have?..........................................................................................................................................15 How has Irvine’s housing composition changed over time?................................................................................................................15 Where are housing types located in Irvine?...............................................................................................................................................18 Summary...............................................................................................................................................................................................................19 Chapter 4. Commuting patterns of Irvine residents..........................................................................................................................................20 Where do Irvine residents work?.................................................................................................................................................................20 What do Irvine commuting patterns look like?.......................................................................................................................................20 Difference in commute distances over neighborhoods......................................................................................................................... 22 Commute mode of Irvine residents..............................................................................................................................................................23 What do commute times look like across Irvine neighborhoods?......................................................................................................25 What do commute modes look like across Irvine neighborhoods?................................................................................................... 26 Summary...............................................................................................................................................................................................................31 Chapter 5. Does Irvine really provide more access to amenities?....................................................................................................................32 How many amenities are nearby?.................................................................................................................................................................35 Nearby amenities by neighborhoods.......................................................................................................................................................... 38 Summary.............................................................................................................................................................................................................. 43 Chapter 6. Where do different types of workers and residents live in Irvine?...........................................................................................44 Where do Irvine workers by occupation live?..........................................................................................................................................44 Sociodemographic change in the city.........................................................................................................................................................48 Racial/ethnic change in the city.....................................................................................................................................................................53 Summary..............................................................................................................................................................................................................60 Chapter 7. Conclusion: What does the future look like for Irvine?.................................................................................................................61 What Does the Future Hold for Irvine?...................................................................................................................................................... 62 Chapter 7. Conclusion: What does the future look like for Irvine?.....................................................................................................61 Technical Appendix......................................................................................................................................................................................................64 Data sources........................................................................................................................................................................................................64 Description of methods...................................................................................................................................................................................64 References........................................................................................................................................................................................................... 65
6
Irvine at 50: The changing landscape of housing, commuting, and amenities June, 2022
Chapter 1. The History of Irvine Irvine: A planned community The history of the Irvine Ranch goes back to the 1860s when James Irvine and three partners assembled the land between the Pacific Ocean and what is now near the northeast corner of Orange County (Brower 1994). By the time he bought out his partners in 1876 the Ranch was just over 101,000 acres. Our interest in this Report is the more recent history of the ranch as it was developed into the City of Irvine. By the 1950s the Irvine Company developed several residential communities in Newport Beach, just south of current Irvine. In the late 1950s, the development interests of the Irvine Company along with the expansion interests of the University of California (UC) came together when William Pereira, who was scouting for a site of a new UC campus in Orange County or east Los Angeles County, decided on the favorability of an Irvine site. In 1960 the Irvine Company deeded 1,000 acres to the University for the development of UC Irvine, and later sold at a discounted price three 220-acre parcels for housing and other University support services (Brower 1994). The University of California, Irvine began campus operations in the fall of 1965 and grew into a major research university on this land at the southern end of the eventual city, and would become a key part of the city’s development. The initial plan for the city was drawn up by Pereira, building on the “new town” philosophy then fashionable. One major feature of the new towns is that developers undertake a number of roles that are usually undertaken by government (Forsyth 2016). A key idea in Irvine was a set of smaller scale villages, each made up of several neighborhoods. The Irvine Company carefully planned all aspects of the city including the locations of all elements such as housing, commercial facilities, parks, schools, and transportation (or, “circulation”, which is the placement of roads, etc.). The plan of the city was a reaction to the perception of unplanned and discordant sprawling suburban development that characterized the post-World War II period. Pereira viewed areas such as the developing San Fernando Valley as examples of how not to develop an area. In Pereira’s view, despite the planning that had actually occurred in the Valley, it had no unifying strategy (Hess 2014). The combination of cookie-cutter tract housing and commercial strips with unrelated buildings stretching for miles gave a disorganized impression. In Pereira’s view, “the new suburbia should take advantage of the synergies of related uses, the orienting logic of planning, and the power of well-arranged, well-designed buildings” (Hess 2014). On December 28th, 1971, residents of the emerging communities of Turtle Rock, University Park, Culverdale, the Ranch, and Walnut voted to incorporate into the City of Irvine, ushering in one of the largest experiments in modern urban development.1 In 1965 ground was broken on University Park, the first of Irvine’s five original planned residential communities or “villages”.2 University Park drew from the Garden City movement with homes built to face internally located public park areas and pedestrian thoroughfares separated from roads. A pedestrian greenway system was designed to connect schools, recreation areas, and shopping facilities to the residential zones. At the time of its opening in 1965, such planning concepts were considered experimental. Indeed, the first set of homes sold poorly, and the builder went bankrupt. Nonetheless, the design gained popularity. As former Irvine Co. planner Albert Trevino Jr. noted “The theory behind the residential communities was quite simple. We wanted to provide a variety of housing types. We wanted to break the static social structure that existed in suburbia.”3 1 https://legacy.cityofirvine.org/about/history.asp 2 This paragraph takes ideas from this website: https://150.irvinecompany.com/a-place-called-home/ 3 Ibid.
7
Irvine at 50: The changing landscape of housing, commuting, and amenities June, 2022 The second village constructed was Turtle Rock. The Turtle Rock community was built in the San Joaquin Hills adjacent to UC Irvine, and the terraced homes in the hills were the most prestigious in the city at that time with attractive views.4 The homes were built around a central village green, with recreational greenbelts providing exercise opportunities and fostering a sense of community. For example, in September of 1971 the community organized a large potluck dinner for over 500 residents at Sierra Bonita Park, creating a neighborhood tradition.5 Similarly, the design of many of Irvine’s villages in the 1970s and 1980s envisioned self-contained residential communities which provided for a full range of needs in housing, education, employment, recreation, and open space. A particularly popular community was Woodbridge, in which the first housing was completed in 1976 to a wildly positive response: on the opening day of the sale in June of 1976, “10,000 eager homebuyers showed up for six lotteries held for the 350 first-phase homes available” (Brower 1994: 55). National news media swarmed the event. Not only did the initial set of houses attract a large crowd of potential purchasers, sales remained brisk afterwards. These Irvine neighborhoods have attempted to retain the social capital they had in the early days after development. Whereas parks and recreation locations, as well as small commercial districts, provide the opportunities for informal gatherings among residents that can increase social interactions and therefore foster social capital, many neighborhoods have neighborhood associations that can also enhance social capital. For example, several neighborhoods have community associations that post the minutes from their community meetings online. These websites also post various informational sources for fellow residents.6 This report presents how Irvine (with this historical background) has matured and transformed over the last several decades. While a companion MFI report, titled “Irvine at 50: From a Planned Community to a Growing Job Center,” focuses on Irvine’s emergence as a job center, the present report pays close attention to the city’s residents and their living environment (or the quality-of-life metrics). Specifically, in Chapter 2, we will explore the growth of Irvine’s boundaries and its villages. In Chapter 3 we will describe the types of housing in Irvine, whether detached single family units, condominiums and townhomes, or various sized apartment complexes. Given these housing patterns, and the presence of so many jobs in Irvine, in Chapter 4 we explore the commuting patterns of residents in the city—both based on distance and time, as well as mode of commute—and compare them to the rest of the region. A feature of Irvine is the presence of many parks along with the small commercial districts in the Village model that the city has followed, and therefore in Chapter 5 we ask whether Irvine residents indeed live closer to parks and commercial areas compared to residents in the rest of the region. Chapter 6 will describe the demographic changes that have occurred within the neighborhoods of Irvine over its history. Finally, Chapter 7 will conclude by summarizing what we have learned in this Report, and consider what the future of Irvine might look like.
4 https://150.irvinecompany.com/turtle-rock/ 5 Ibid. 6 As a few examples, the Turtle Rock Glen Community Association can be found here: https://turtlerockglenhoa.org/community/newsletters/archived-newsletters/. The Turtle Rock Hills Community Association is password protected here: https://turtlerockhills.com/whats-new. The Village Park Community Association is here: https://vpca.net/villager-newsletter/. The Woodbury Community Association is here: https://woodburyhoa.org/community/newsletters/. Woodbury East is here: https:// woodburyeasthoa.org/community/. Northwood is here: https://northwood2irvine.com/category/newsletters-hoa/.
8
Irvine at 50: The changing landscape of housing, commuting, and amenities June, 2022
Chapter 2. Growth of City of Irvine Irvine city boundary changes over time The history of Irvine is one of constant growth. It has grown from a population of about 10,000 at its incorporation in 1971 to just over 300,000 in 2020. As one way to demonstrate this growth, we map out in Figure 2.1 the changes in Irvine’s boundaries over time as the city has grown.7 In this map, the outline shows the current extent of Irvine’s city boundaries. The green area shows the original boundary at incorporation. The yellow area to the southwest shows the annexation that occurred during the remainder of the 1970s. Note that nearly all of these annexations occurred when the Irvine Company began development on a new village in the city. Smaller areas were annexed during the 1980s and are shown in light orange. These mostly occurred towards the central section of the city. During the 1990s there was considerable growth in the northern section of the city in the dark orange areas. Also, a portion along the southern border was detached in the late 1990s to Newport Beach. Finally, the annexations during the early 2000s are shown in red, and most important is the addition of the land that previously was part of the military base at the El Toro Marine Station. This latter area is part of the Great Park, and the retail and housing that is being built surrounding the park.8
7 Data were provided by the city of Irvine Geographic Information Science (GIS) office. 8 We do not have information on more recent annexations.
9
Irvine at 50: The changing landscape of housing, commuting, and amenities June, 2022
Figure 2.1 Development over time These changes in the city’s boundaries have coincided with housing and commercial development in the city. We use satellite images to show the growth of the city in Figure 2.2.9 In the earlier decades, the area was primarily agricultural land. As the city’s villages were developed, this agricultural land was slowly decommissioned and turned into housing and commercial areas.
9 Satellite images were downloaded from https://earthexplorer.usgs.gov/.
10
Irvine at 50: The changing landscape of housing, commuting, and amenities June, 2022
Figure 2.2 The villages of Irvine When it came to developing residential housing, the city created what are termed “villages”. These villages tend to have a central gathering area that includes parks and recreation areas, as well as small-scale commercial districts for the village. The intention is that these would serve as gathering locations for residents, allowing them to get to know one another and resulting in greater cohesion among residents and greater attachment to the neighborhood and village. We show the boundaries of these villages in Figure 2.3, and in all subsequent maps we will include these boundaries to orient the reader.
11
Irvine at 50: The changing landscape of housing, commuting, and amenities June, 2022
Figure 2.3 Housing Development over time The development of housing in the city of Irvine has followed the various annexations of portions of the city. Thus, the archaeology of the city can be seen in the age of housing. We demonstrate this in Figure 2.4, which shows the median age of housing across the blocks in the city (the median shows the age of the housing unit in which half of the units are newer and half are older). In nearly all of these blocks the units were built at the same time given the planned nature of the city. In Figure 2.4 the blue areas capturing the University Park neighborhood just north of UC Irvine were largely built in the 1960s before city incorporation. We can also see that Rancho San Joaquin, Northwood, El Camino Real, Oak Creek and the northern part of Woodbridge were built in the 1970s. Westpark and southern Woodbridge were built in the 1980s, along with portions of Turtle Rock. The areas around the edges of the city were developed in more recent years.
12
Irvine at 50: The changing landscape of housing, commuting, and amenities June, 2022
Figure 2.4 Given Irvine’s suburban nature, there has naturally been a large development of detached single family housing units. A map of the median age of this type of housing across the blocks in the city is virtually identical to the previous map of housing development overall. We therefore do not display that map. Instead, in Figure 2.5 we show the timing of development of multifamily housing units in census blocks based on median age of this housing. The Irvine Company has built a relatively large number of multifamily housing units (apartments, as well as condominiums and town homes) in the city. The relatively red nature of the map highlights that a large proportion of these multifamily units have been built in Irvine in more recent years. We also see that many areas of the city lack multifamily housing, which is why these blocks are blank. We do see the relative presence of multifamily housing being built in the 1970s in central Woodbridge, Oakcreek, and Rancho San Joaquin. More multifamily housing was built in the 1980s in University Town Center, Turtle Rock, southern Woodbridge, and Westpark.
13
Irvine at 50: The changing landscape of housing, commuting, and amenities June, 2022
Figure 2.5 Summary This chapter has shown that Irvine has experienced considerable growth over time in the land area of the city. The development of the various villages was accompanied by housing development, as we showed. There was also simultaneous development of parks and commercial districts, a point to which we will return in a later chapter. The city experienced growth in both single family housing, as well as multi-family housing. In the next Chapter we will look more specifically at the types of housing in Irvine over time.
14
Irvine at 50: The changing landscape of housing, commuting, and amenities June, 2022
Chapter 3. What types of housing does Irvine have? In this Chapter we look at the types of housing in Irvine.10 We will look at both the composition of housing over time, as well as where it is located within the city. Recall that a goal of the village model of the Irvine Company was to mix different forms of housing together within neighborhoods.11 We will assess the extent to which this has occurred in the city. How has Irvine’s housing composition changed over time? Given that Irvine is a suburban community, a presumption might be that it is dominated by detached single family housing units. However, that is not the case, as Figure 3.1 (panel A) shows that Irvine has consistently had less detached single family housing units compared to the remainder of Orange County over essentially its entire history. During the 1970s a relatively high proportion of detached single family housing units were built and by 1980 Irvine had nearly as high a proportion as the rest of the County, but since then Irvine has far less of this housing type compared to the rest of the County. In 2017, just 40% of the housing in the average Irvine neighborhood were detached single family units, compared to 56% in the remainder of the county. On the other hand, Irvine has a relatively high proportion of attached single family housing units. These are condominiums and town homes. We see in panel B of Figure 3.1 that Irvine has consistently had about double the presence of this type of housing compared to the rest of the county. Irvine currently ranks #4 in Orange County with 20.5% of the housing in the average neighborhood being attached single family housing units compared to just 11% in the rest of the county.12 Irvine tends to have a considerably smaller proportion of mobile homes compared to the rest of the County, as seen in panel C of Figure 3.1. In recent decades, neighborhoods in the rest of the county have almost 3 times as many mobile homes as do Irvine neighborhoods.
10 The data in this section come from the U.S. Census (1970, 1980, 1990, and 2000) and the ACS 5-year estimates (2008-12, 2015-19), aggregated to census tracts. 11 This was also explicitly mentioned in the early General Plan of Irvine, in which it was noted that “As mentioned earlier in this report, diversity within the villages themselves as well as the City as a whole is a very important ingredient within the make-up of Irvine” (Wiley & Ham 1974: page 4-3). 12 The top 3 cities for attached single family housing are Laguna Woods, Aliso Viejo, and Ladera Ranch.
15
Irvine at 50: The changing landscape of housing, commuting, and amenities June, 2022
igure 3.1 Comparing Irvine neighborhoods to the rest of Orange County for detached and attached single family units, F and mobile homes Consistent with the goals of the Irvine village model, there is a large composition of multifamily units—that is, apartment complexes of various sizes. There is a somewhat smaller proportion of very small multifamily complexes (those with 2-4 units) in Irvine since 1980.13 Figure 3.2 (panel A) shows that Irvine has consistently had somewhat fewer of these small complexes compared to the rest of the county, with about 7% in Irvine compared to 8% in the rest of the county in recent decades. On the other hand, Irvine has consistently been over-represented with mid-sized multifamily complexes (those with 5-19 units) (panel B in Figure 3.2). Since 1990, between 12% and 15% of Irvine’s housing are these types of units compared to 9-11% in the rest of the county. Irvine also has somewhat fewer large-sized multifamily complexes (those with 20-49 units) than the rest of the County (panel C in Figure 3.2). However, there has been a recent increase in these complexes in Irvine, and in the two most recent decades Irvine has a relatively similar percentage compared to the rest of the county. 13 Note that the aggregations in the Census in 1980 did not allow us to disaggregate multifamily units as we do in the other decades.
16
Irvine at 50: The changing landscape of housing, commuting, and amenities June, 2022
Figure 3.2 Comparing Irvine neighborhoods to the rest of Orange County for various sized multi-family unit complexes It is very large-sized multifamily complexes (those with more than 50 units) that are particularly prevalent in Irvine, especially since 2000 (panel D in Figure 3.2). Apartment development was intensified during the late 1980s by the Irvine Company, and their portfolio of about 3,000 units was increased to over 10,000 (Brower 1994: 90). In more recent years, Irvine has proportionally more of these very large complexes than the rest of the County. This is a consequence of the development of several very large complexes by the Irvine Company beginning in the 1990s. Although Irvine had far fewer of these very large complexes in 1990 than the rest of the county (at just 2.4% versus 6%), since 2000 Irvine has shot up and now about 15% of units are contained in these very large complexes, which is a rate about double that of the rest of the county. Irvine currently ranks #6 in Orange County for the proportion of very large apartment complexes.14
14 The top 5 cities for very large apartment complexes are Stanton, Tustin, Anaheim, Newport Beach, and Aliso Viejo.
17
Irvine at 50: The changing landscape of housing, commuting, and amenities June, 2022
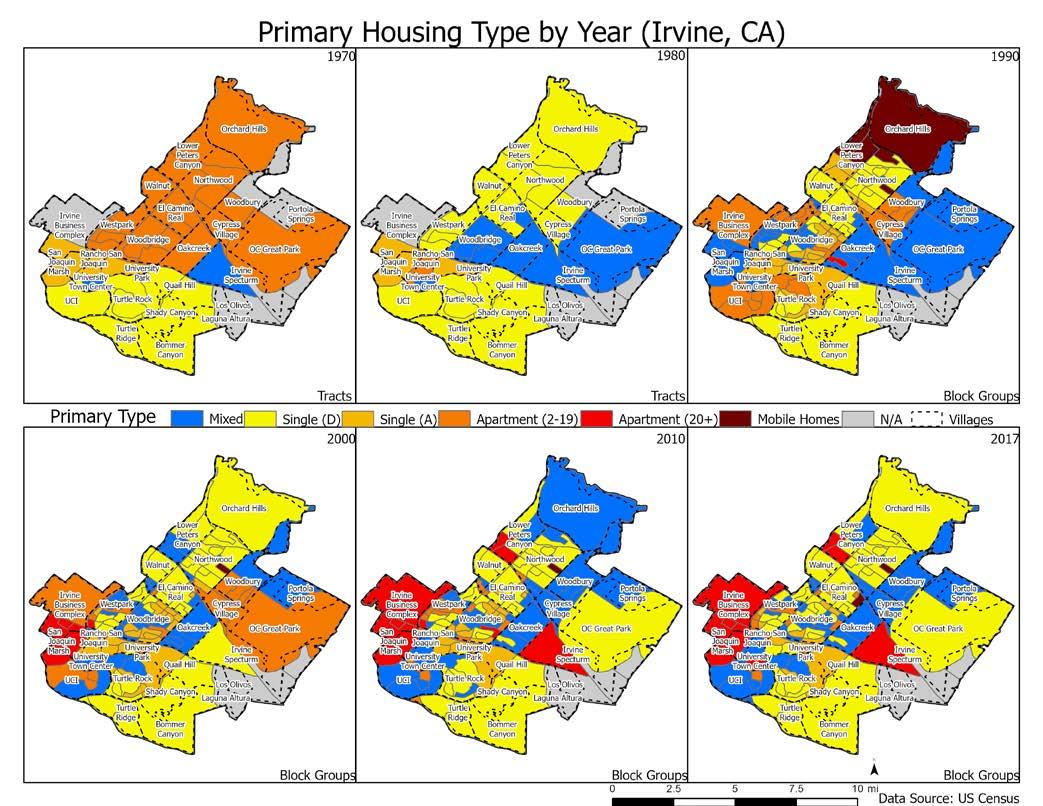
igure 3.3 Mixed= mixed housing; Single (D)= detached single family housing units; Single (A)= attached single family F housing units; Apartment (2-19): apartment complexes with 2-19 units; Apartment (20+): apartment complexes with 20 or more units; Mobile homes= mobile homes; NA= too little housing development. Where are housing types located in Irvine? Although a goal of the village model was to mix different housing types together, to what extent was this successful? And which neighborhoods tend to have larger concentrations of certain types of housing? We define neighborhoods as block groups since 1990, and as census tracts (which are about three times larger than block groups) in the earlier years given data availability. To see where housing is located, we determined for each neighborhood what the predominant housing type was in the neighborhood (e.g., detached single family housing, townhomes, small apartment complexes, large apartment complexes, etc.). For neighborhoods that did not have one primary type of housing (at least 50% of housing), we classified them as having mixed housing. Figure 3.3 displays maps of the neighborhoods over this time period based on this classification scheme. 18
Irvine at 50: The changing landscape of housing, commuting, and amenities June, 2022 For example, which neighborhoods tend to have more detached single family housing over time (these are colored yellow on the maps)? Note that a neighborhood can have a high percentage of this type of housing in one decade if only single family housing units are built there, but this can decline in a subsequent decade if some other type of housing is subsequently built in the neighborhood—such as a large apartment complex. Thus, the southern area of the city is dominated by detached single family housing since 1970. We unsurprisingly see that there is very low presence of detached housing in the areas near the Irvine Business Complex (IBC) and the Spectrum Center recently. There is also less detached housing near UC Irvine since 1990. Attached single family units are condominiums and town homes (gold colored areas on the maps), and we see that the neighborhoods in the area near UC Irvine have consistently had either a very high presence of detached housing over this time period, or else mixed housing (the blue colored areas show mixed housing). In the most recent decades, it appears that some neighborhoods in the central portion of the city also have a high concentration of attached single family units. Small apartment complexes were a larger presence in the central and southern portions of the city in the early years (orange colored areas on the maps), but are a much smaller presence in those areas since the development of other housing in the intervening years. Now, the only neighborhoods with a concentration of small apartment complexes are near UC Irvine and a few scattered neighborhoods in the central part of the city. In more recent years there is a high concentration of large apartment complexes (those with 20 or more units) near the IBC and the Irvine Spectrum (red colored areas on the maps). There is also a large concentration in Lower Peters Canyon in the northwest. The central portion of the city tends to have few of these large apartment complexes, as many of them have been built in more recent years during the development of the edge areas of the city. Summary Irvine does not have housing dominated by detached single family housing units, in contrast to the typical suburban pattern. Instead, Irvine has a relatively high composition of multifamily housing in the city. What are the consequences of this, along with the large presence of jobs, for the commuting patterns of the residents in the city? We turn to this question in the next chapter.
19
Irvine at 50: The changing landscape of housing, commuting, and amenities June, 2022
Chapter 4. Commuting patterns of Irvine residents Where do Irvine residents work? In a separate Report we described how Irvine has developed over its history into a major job center in the region.15 An advantage of serving as a job center is that Irvine also provides many jobs for its residents, which can impact commuting patterns in favorable ways. Despite the presence of many jobs nearby for Irvine residents, a natural question is how far Irvine residents commute, and whether they actually work within the city or nearby. We explore these questions in this chapter. One metric we can use is to ask what percentage of Irvine residents work within the city. We measured this from 1980 to 2016, and found that Irvine ranked #29 among Southern California cities in 1980 for having the highest percentage of residents working within the city (26% of residents worked at jobs in Irvine). Although that is good, the city has improved considerably since then: Irvine ranked #13 in 1990 as 35% worked at jobs in the city, and since 2000 it has ranked #9.16 In 2000, 39% of residents worked at jobs in the city, and this has risen to 44% in the most recent decade.17 What do Irvine commuting patterns look like? With the presence of so many nearby jobs, and the tendency for Irvine residents to work within Irvine, one possible implication is that Irvine residents have shorter commutes based on distance and time. Is this true? In Figure 4.1 (panel A), we compare the average commute time for the average Irvine neighborhood (defined as a census tract) to the average commute time of the average neighborhood in the remainder of Orange County.18 In general, commute times are indeed shorter in Irvine compared to the rest of the county. We see that in 1980, the average commute time in the county across neighborhoods was 24.4 minutes, whereas the average across Irvine neighborhoods was 21.8 minutes. In 1990 and 2000 the average commute times in the county rose to 25.4 and then 26.4 minutes, whereas for Irvine they fell slightly to 21.5 minutes. Average commute times in Irvine have risen in the two most recent decades to 24.5 minutes, but they have also risen in the rest of the county to 28.6 minutes. We also compared Irvine to the remainder of Southern California, and the gap is even wider. Whereas in 1980 the average commute time in the remainder of Southern California was slightly better than the rest of Orange County (23.7 minutes) this was still worse than Irvine. And since 2000 the remainder of Southern California has had longer commute times than even the remainder of Orange County. Thus, whereas the remainder of Orange County has commute times about 20% longer than Irvine residents since 2000, the remainder of Southern California has commute times about 30% longer than Irvine residents in that time period. 15 See the MFI Report: Irvine at 50: From a Planned Community to a Growing Job Center. 16 The top 8 cities for percentage of residents working in the city in 2016 are San Diego, Los Angeles, Ventura, Lancaster, Thousand Oaks, Oxnard, Riverside, and Temecula. 17 These data come from the Census Transportation Planning Packages (CTPP) for various years. 18 These data come from the U.S. Census, aggregated to census tracts.
20
Irvine at 50: The changing landscape of housing, commuting, and amenities June, 2022
igure 4.1 Comparing Irvine neighborhoods to the rest of Orange County for average commute time and median F commute distance We also compared Irvine commutes to the rest of the county and the remainder of Southern California based on distance. For this, we computed the median distance traveled by workers living in a tract.19 We then compared Irvine neighborhoods to neighborhoods in the rest of the county or the region. Again, Irvine has done better than the rest of the county and the region since 1990 (the first year of our data). In 1990, the median commute distance across Orange County neighborhoods was 7 miles, whereas it was just 5.4 miles in Irvine (panel B in Figure 4.1).20 19 These data come from the CTPP. Distance is computed based on the centroids of the tract the worker lives in and the one they work in, measured “as the crow flies”. We used median distance because extremely long distance commutes could otherwise skew the results. We were unable to compute median time of commutes in the prior analyses given that the data were binned (although the binning of the longest commute times eliminated the impact of extreme cases, making the mean satisfactory in that case). These distance data provide us more precise information allowing us to compute the median. 20 For each neighborhood we computed the median commute distance. Then, the numbers reported here are the average of these median distances across the neighborhoods within Irvine, the County, or the region.
21
Irvine at 50: The changing landscape of housing, commuting, and amenities June, 2022 The distance of commutes in Irvine has remained constant over this time period, whereas those in the remainder of the county have increased slightly. Thus, Irvine does extremely well based on this metric, and among Orange County cities Irvine ranked #4 in 1990, #3 in 2000 and 2010, and #5 in 2016.21 Again, the remainder of Southern California fares even worse than the remainder of Orange County. Whereas the average commuting distance of neighborhoods in the remainder of Orange County is over 30% longer than that of Irvine residents across these years, average commuting distance of neighborhoods in the remainder of Southern California is 50%-60% longer than that of Irvine residents. Difference in commute distances over neighborhoods While computing the median distance or the average time of commutes is informative, the median or average obscures what is going on in specific neighborhoods. Therefore, in the next analyses we did the following: 1) we divided all tracts in Orange County into 10 bins with an equal number of tracts in each bin, sorted from the shortest median distance to the longest median distance; 2) we assessed which bin each Irvine tract fell into. In Figure 4.2 we see that in 1990 most Irvine neighborhoods tended to have shorter commutes. This is seen in that the four bars on the left side of this graph show that 22% of Irvine neighborhoods are in the bin for the shortest commutes (the blue bar on the left), just over 15% of neighborhoods are in the next two bars (red and green) showing bins with the second and third shortest distances, and 22% are in the fourth bin (purple). We also see that in 1990 very few Irvine neighborhoods are in the rightmost bins---those with the longest commutes. Nonetheless, there are some, and we see that about 6% of Irvine neighborhoods have commute distances that are among the top two bins of long distance commutes (those among the top 10% and top 20% of commute distances). Nonetheless, if Irvine was a “typical” city, each of the 10 bins would contain 10% of the neighborhoods, so clearly commutes tended to be clustered towards the shorter end of the distribution in Irvine. In 2000, there is an even stronger concentration of Irvine neighborhoods in the four left-most bins, indicating relatively short commute distances. Also, in 2000, no Irvine neighborhoods are in the three longest-distance bins for commute distance. In 2010, 35% of Irvine neighborhoods are in the bin for the shortest commutes. And in 2016, more than half of Irvine neighborhoods are in the two bins for the shortest commutes.
21 In 2016 the top 4 cities for shortest commute based on distance were Costa Mesa, Laguna Woods, Newport Beach, and Santa Ana.
22
Irvine at 50: The changing landscape of housing, commuting, and amenities June, 2022
Figure 4.2 Commute mode of Irvine residents When it comes to commuting, there are various ways residents can get from their home to their workplace. We assessed the mode Irvine residents tend to use when getting to work, and compare this to other residents in Orange County.22 The most prevalent way commuters in Southern California get to work is by driving alone in their own automobile. Figure 4.3 (panel A) shows the percent of workers who commuted by driving alone. Over these years, about 78% of Irvine workers have commuted by driving alone, although this dropped slightly to 76% in 2017. Nonetheless, Irvine does relatively poorly along this metric, as it currently ranks as the #7 highest in Orange County (indicating that a high percentage of Irvine residents commute by driving alone). Rather than simply driving alone, an alternative possible mode of commuting is to carpool with others. Nonetheless, Irvine residents are also less likely to commute in this way compared to the rest of Orange County (panel B in Figure 4.3). Irvine has consistently had fewer workers commuting in this manner compared to the remainder of the county. Whereas 11% of Irvine residents were in carpools in 1980, this has steadily drifted downward since then and is about 7% now. 22 The data used in this section come from the U.S. Census and the ACS 5-year estimates. 23
Irvine at 50: The changing landscape of housing, commuting, and amenities June, 2022
Another commute mode is using public transportation, and in recent years Irvine residents also are less likely to use this mode. Panel C in Figure 4.3 shows that although Irvine residents were more likely to use this mode of transport just before incorporation in 1971 (3%), since then the percent using public transportation has hovered around 1%, compared to 2-3% in the rest of the county. Irvine currently ranks just #20 in Orange County for using public transportation.
Figure 4.3
24
Irvine at 50: The changing landscape of housing, commuting, and amenities June, 2022
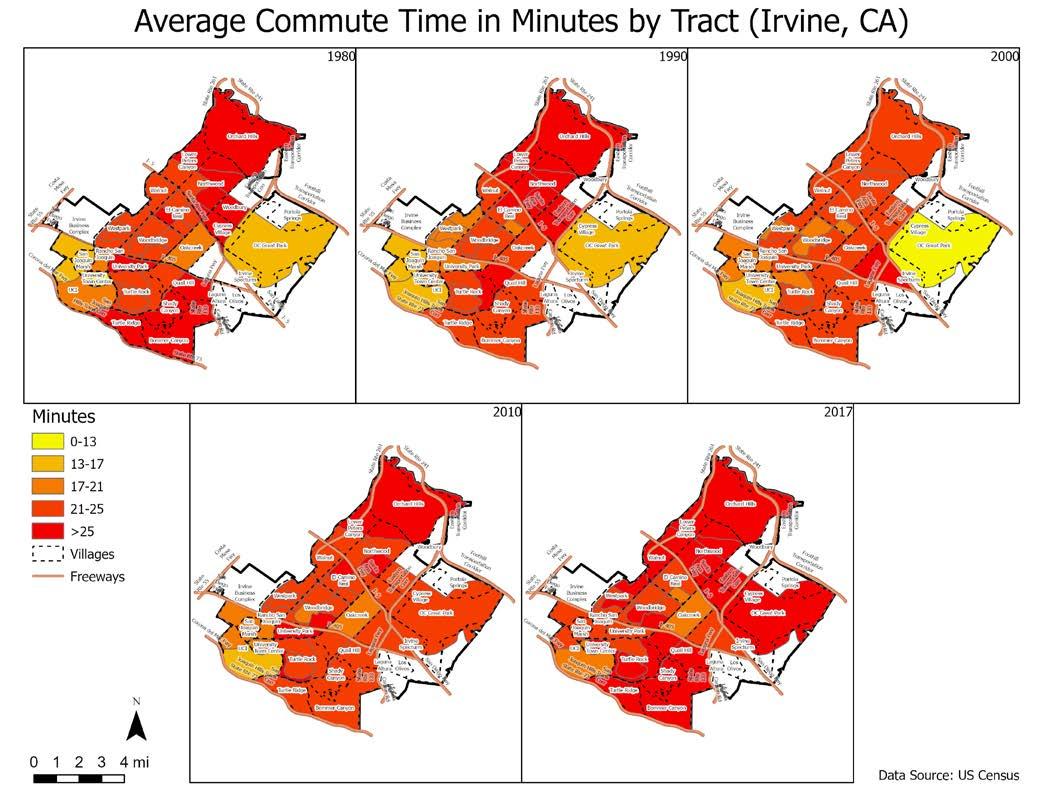
Figure 4.4 An alternative commute mode is walking, which typically requires that the workplace be relatively close to one’s residence. Given the earlier analyses showing that Irvine neighborhoods have some of the closer commute distances, it should come as little surprise that Irvine does relatively well on this metric. Panel A in Figure 4.4 shows that Irvine has always outperformed the rest of the county on this metric over time. In 2017, workers in Irvine walked to work at more than double the rate of the rest of the county. At the most recent time point, Irvine currently ranks #3 in Orange County for prevalence of walking to work.23 Another popular mode of commuting to work for Irvine residents is through other means, such as bicycle riding. In earlier decades, Irvine workers were no more likely to commute by bicycle than workers in the rest of the county (panel B in Figure 4.4). However, by 2010 and 2017 Irvine workers were 40-70% more likely to commute by bicycles than workers in the rest of the county. Irvine is currently #4 in Orange County for prevalence of using bicycles or other such modes of commuting to work.24 Finally, some workers do not need to commute as they work at home. Likely due to the high number of professional occupations of its residents, Irvine has a relatively high number of at home workers.25 Panel D in Figure 4.3 shows that the percent working at home in Irvine neighborhoods has consistently exceeded that of neighborhoods in the rest of County. In 2017, 8% of residents in the average Irvine neighborhood worked at home, compared to 6.6% in the average neighborhood in the remainder of the county. What do commute times look like across Irvine neighborhoods? We described earlier that Irvine residents tend to have shorter average commute times compared to the region, and in Figure 4.5 we show how this varies across Irvine neighborhoods. Residents in the Irvine Business Center (IBC) have consistently had some of the shortest commute times in the city since 1980. Whereas the eastern portion of the city had short commute times in the earlier years, this has worsened in the last two decades and they now have much worse commute times. The central portion of the city has fluctuated over time—having relatively shorter commute times in 1980, but much worse commutes in 1990, but since then there has been a consistent improvement in commute times for this area. The Oak Creek area has notably shorter commute times in recent years. The more extreme northern and southern portions of the city consistently have some of the longest commute times in the city. 23 The top two cities for walking to work are Anaheim and Laguna Beach. 24 The top 3 cities for using bicycles or other such modes to work are Laguna Woods, Midway City, and Costa Mesa. 25 For information on the number of professional jobs in the city, see our MFI Report detailing Irvine jobs over time: Irvine at 50: From a Planned Community to a Growing Job Center. 25
Irvine at 50: The changing landscape of housing, commuting, and amenities June, 2022
Figure 4.5
What do commute modes look like across Irvine neighborhoods? We’ve described different possible commute modes that workers might use, and here we focus on what this looks like in specific neighborhoods across Irvine. Residents in the area near UC Irvine have consistently had some of the lowest percentage of commuters who drive alone (Figure 4.6). In recent years, the Irvine Spectrum area also has a lower percentage of commuters who drive alone. In contrast, residents in Woodbridge are particularly likely to commute by driving alone. We also see that during the 2010s the number of neighborhoods with a very high proportion of residents commuting alone (>80%) has declined.
26
Irvine at 50: The changing landscape of housing, commuting, and amenities June, 2022
Figure 4.6
There are few consistent patterns regarding where car poolers tend to live (Figure 4.7). We do see that the proportion of car poolers has risen considerably in the Irvine Spectrum area in recent years. On the other hand, the neighborhood near the OC Great Park no longer has a high concentration of car poolers, which is likely a function of the residents in the new housing being placed there. In general, we see that at the most recent time point there are no longer any neighborhoods with a high concentration of car poolers (greater than 20%).
27
Irvine at 50: The changing landscape of housing, commuting, and amenities June, 2022
Figure 4.7
Irvine has a relatively high proportion of workers who commute by walking. In Figure 4.8 we see that the UC Irvine area has consistently had a high percentage of workers who walk to work. In recent years, the Irvine Spectrum has a high concentration of walking commuters, consistent with the goal to build a live/work/play environment in that area. Similar to the prior map for carpooling, we see that the number of workers walking to work in the Great Park and Cypress Village neighborhoods has dropped considerably since 2000. This again is likely a function of the new housing developments in these neighborhoods.
28
Irvine at 50: The changing landscape of housing, commuting, and amenities June, 2022
Figure 4.8
Irvine’s many bike trails encourage commuting by bicycle, and Figure 4.9 shows that this mode is particularly prevalent near UC Irvine and up into the Rancho San Joaquin neighborhood and University Park to some extent (note that the Census does not report bicycle commuting as a separate category, but rather among “other” modes). In recent years, there is also a relatively high proportion of bicycle commuting in the Westpark neighborhood just to the east of the IBC.
29
Irvine at 50: The changing landscape of housing, commuting, and amenities June, 2022
Figure 4.9
Figure 4.10 demonstrates the growth in percentage of Irvine residents who work at home. There is evidence in these maps that the percentage who work at home has grown over time for the city overall. By 2010, it appeared that the greatest concentration of those working at home was in the southern portion of the city. By the most recent time point, we are also seeing a fair number of at-home workers towards the northern part of the city.
30
Irvine at 50: The changing landscape of housing, commuting, and amenities June, 2022
Figure 4.10
Summary In this chapter we have described the various commuting patterns of Irvine residents. We showed that Irvine residents have the benefit or shorter commutes—based on time and distance—compared to residents in the rest of the county and the region. Irvine residents are also more likely to commute to work by walking or riding a bicycle compared to residents in the rest of the county. This is a direct benefit of one of the goals of the Irvine Company plan for the city of providing a large number of jobs: a consequence is that there are likely to be available jobs near residents. Another goal of the Irvine Company plan for the city was the village model, in which an attempt was made to place parks and small commercial districts as central areas in these villages. The expected consequence is that Irvine residents would have parks and commercial areas in walking distance to where they live. Was this successful? We address this in the next chapter.
31
Irvine at 50: The changing landscape of housing, commuting, and amenities June, 2022
Chapter 5. Does Irvine really provide more access to amenities? A goal of Irvine’s village model was to make it easy to access such amenities as commercial districts and parks. The expectation was that residents could easily reach these locations, which would provide for central meeting locations for residents that might increase levels of cohesion among residents within the villages. But was this model really successful in locating amenities nearby to residents? We address this question in this chapter by assessing how close parks and retail locations are to Irvine residents, and compare this to residents in the remainder of the county. To begin, we show the current locations of parks and commercial districts in Irvine.26 We first show the locations of parks in 2010 in the map in Figure 5.1 (we do not have information for 2000).27 And we show the locations of retail and food-related jobs (e.g., restaurants, fast food locations, bars, etc.) in 2000 and 2010 in Figures 5.2a and 5.2b. The red areas in each of these maps show blocks with a relatively high concentration of parkland or retail or food jobs. These appear to be relatively spread throughout the city, which is a goal of the village model. But are there indeed more parks and retail near Irvine residents? We turn to this question next.
26 The data on parks comes from the ESRI dataset showing parks in 2010. The data on businesses comes from the Reference USA Historical Business Dataset, a proprietary source. 27 Note that the Great Park is not yet shown on this map in the eastern portion as it was still in development in 2010.
32
Irvine at 50: The changing landscape of housing, commuting, and amenities June, 2022
Figure 5.1
33
Irvine at 50: The changing landscape of housing, commuting, and amenities June, 2022
Figure 5.2a
34
Irvine at 50: The changing landscape of housing, commuting, and amenities June, 2022
Figure 5.2b
How many amenities are nearby? Table 5.1 shows how close parks and retail locations are to residential blocks in 2010 in Irvine in comparison to those in the rest of Orange County. Regarding nearby parks, we see that Irvine residents indeed have good access. Within ¼ mile, Irvine residents have 75% more parkland nearby than do residents in the rest of the county (4.8% vs. 2.7%). The gap narrows, however, if we consider longer distances. Irvine residents have 54% more parkland within ½ mile compared to residents in the rest of the county (see the ratio column), 37% more within ¾ mile, and 24% more within 1-mile.
35
Irvine at 50: The changing landscape of housing, commuting, and amenities June, 2022 On the other hand, Irvine residents have fewer retail establishments nearby. This is somewhat surprising given that one of the many goals of the city’s village model was to provide residents with easily accessible retail and commercial opportunities. We see that the average Irvine resident has 4.1 retail firms within ¼ mile, whereas the average resident in the rest of the county has 8.2. Thus, there are about half as many retail establishments within ¼ mile of Irvine residents compared to residents in the rest of the county. If we expand the buffer and consider ½ mile, Irvine residents still have fewer retail businesses nearby (18 vs. 35). Even in a 1-mile buffer, Irvine residents have half as many nearby retail businesses as do residents in the rest of the county. If we take into account the size of retail locations, Irvine residents do a little better but still lag the rest of the county. Irvine only has about 2/3 as many retail employees within ¼ mile compared to residents in the rest of the county, and only about 80% as many retail employees within 1-mile compared to residents in the rest of the county. The story is similar for food firms, as Irvine residents only have about 2/3 as many within 1-mile as do residents in the rest of the county, and 90% as many employees within 1-mile. At short distances, Irvine residents only have about 60% as many food locations and 75% as many employees within ¼ mile compared to residents in the rest of the county.
28 The top 6 cities in the county for a greater nearby retail presence within ¼ mile (with the number of retail establishments in parentheses) are: Laguna Beach (16.7), Costa Mesa (14.8), Stanton (13.1), Westminster (13), Los Alamitos (11.5), and Santa Ana (10.3). Again, Irvine residents have just 4.1 firms within ¼ mile.
36
Irvine at 50: The changing landscape of housing, commuting, and amenities June, 2022
Table 5.1. Comparing blocks in Irvine to rest of Orange County based on number of retail or food firms nearby, and park space nearby Irvine Mean
S.D.
Mean
S.D.
Ratio: Irvine to county
1/4 mile
4.8
7.9
2.7
7.4
1.75
1/2 mile
5.6
6.1
3.7
7.5
1.54
3/4 mile
5.6
4.4
4.1
7.2
1.37
1 mile
5.4
3.6
4.4
7.1
1.24
1/4 mile
4.1
5.2
8.2
10.7
0.50
1/2 mile
17.9
16.9
34.9
31.0
0.51
3/4 mile
39.9
29.1
79.3
57.0
0.50
1 mile
71.4
49.4
139.5
86.9
0.51
Parks
Rest of County
Retail firms
Retail employees 1/4 mile
39.9
76.4
62.1
114.0
0.64
1/2 mile
241.3
408.1
301.3
382.2
0.80
3/4 mile
536.6
628.1
725.8
728.4
0.74
1 mile
1059.9
1140.4
1303.4
1083.8
0.81
Food/lodging firms 1/4 mile
2.7
4.7
4.4
5.9
0.62
1/2 mile
12.3
11.0
18.4
15.3
0.67
3/4 mile
27.1
17.7
40.7
26.7
0.67
1 mile
46.5
28.9
70.7
40.1
0.66
Food/lodging employees 1/4 mile
41.6
90.7
55.0
115.4
0.76
1/2 mile
228.6
283.5
247.4
339.0
0.92
3/4 mile
516.9
539.8
564.0
626.9
0.92
1 mile
907.0
931.5
1003.0
991.1
0.90
Note: all values are weighted by the population in the focal block
37
Irvine at 50: The changing landscape of housing, commuting, and amenities June, 2022 Nearby amenities by neighborhoods While computing the average number of retail shops or the average amount of parkland nearby is informative, the average obscures what is going on in specific neighborhoods. Therefore, in the next analyses we did the following: 1) we divided all blocks in Orange County into 10 bins with an equal number of blocks in each bin, sorted from the largest to fewest number of the amenity of interest (retail or food establishments or employees, or parkland); 2) we assessed which bin each Irvine block fell into.29 In Figure 5.3 (panel A) we see that most Irvine blocks tend to have a relatively high amount of parkland within 1-mile. The two bars on the left side of this panel show the percentage of blocks that have the least amount of parkland within 1-mile (they are the first decile). The blue bar shows that about 10% of blocks in the rest of the county are in the first decile with the least amount of nearby parkland. Indeed, we would expect there to be 10% of blocks in each of these categories—so if Irvine has more than 10%, this is evidence of Irvine having many blocks with this amount of parkland. In fact, about 13% of Irvine blocks are in this category (the red bar), a little more than expected. So, perhaps surprisingly, about 13% of Irvine residents have quite little parkland within 1 mile. However, the story changes when looking at the remainder of the distribution. Moving to the next two bars, we see that only 1.2% of Irvine blocks (the red bar) are in this second decile (a category with the second least amount of parkland nearby). Irvine also has very few blocks in the 3rd through 6th deciles. Instead, Irvine has far more blocks than expected by random chance in the 8th and 9th deciles (24% and 35%). Irvine is only underrepresented in the highest decile, as there may be very large parks in the rest of the county that are near some locations. Nonetheless, nearly 80% of Irvine blocks are in the top 4 deciles for nearby parkland. Although we just showed that Irvine residents on average have more parkland within 1-mile of them than do residents in the rest of the county, we next ask whether this differs for renters and homeowners. In panel B of Figure 5.3, we see that although there are a set of Irvine blocks with renters that have very little parkland nearby (the bars on the left-hand side of this figure), most renters have a high amount of parkland nearby. On the left side of this figure we see that 20% of Irvine renters are in the first decile, and therefore have very little parkland nearby. However, a very high percentage (75%) of Irvine renters is in the top 4 deciles for parkland nearby. Thus, Irvine renters are not relatively deprived of nearby parkland, as is common in much of the rest of the county (given the small percentage of renters in the top two deciles for the rest of the county). In panel C of Figure 5.3 we show the same information for homeowners. We see that only a small percentage of Irvine homeowners have very little parkland nearby (the left side of the figure), whereas over 80% are in the top 4 deciles (the right side of the figure).
29 These analyses were also all weighted by the population in the focal block. For the analyses assessing owners and renters separately, the analyses are weighted by the number of owners, or the number of renters.
38
Irvine at 50: The changing landscape of housing, commuting, and amenities June, 2022
igure 5.3 Percent of neighborhoods in deciles of parkland: 1 is the lowest decile (least amount of parkland nearby); F 10: is the highest decile (most parkland nearby). Considering nearby retail firms, Irvine residents tend to have relatively few nearby (panel A in Figure 5.4).30 We see that 82% of Irvine resident blocks are in the bottom 4 deciles for having nearby retail establishments. The story is similar when accounting for the size of these businesses by measuring the number of retail employees, shown in panel B. Almost ½ of Irvine blocks are in the lowest three deciles for the number of retail employees nearby, and just 17% are in the top three deciles. Irvine blocks are also clustered in the lower half of the distribution for food firms, indicating that they tend to have fewer food firms nearby within 1-mile (panel C in Figure 5.4). The story is similar, though a little less extreme, for food employees, as shown in panel D. Irvine blocks are over-represented in the bottom two deciles, and somewhat underrepresented in the top two deciles.
30 We do not show the distributions for the rest of the county, since they all tend to be quite close to 10%, as expected.
39
Irvine at 50: The changing landscape of housing, commuting, and amenities June, 2022
igure 5.4 Percent of residents in deciles of retail or food firms or employees: 1 is the lowest decile (least amount of F firms/employees nearby); 10: is the highest decile (most firms/employees nearby). We next distinguished between renters and owners for the number of retail and food establishments nearby. We see in panel A in Figure 5.5 that Irvine renters have particularly few retail firms nearby, as almost ½ are in the lowest two deciles, and nearly ¾ are in the lowest four deciles. Only 5% are in the top three deciles. The pattern is even stronger for homeowners in panel B. Almost 90% are in the four lowest deciles, indicating that there are in fact relatively few retail firms within 1-mile of most Irvine homeowners. Overall, as expected, renters tend to have better accessibility to these retail and food destinations than owners throughout the county.
40
Irvine at 50: The changing landscape of housing, commuting, and amenities June, 2022
igure 5.5 Percent of neighborhoods in deciles of parkland: 1 is the lowest decile (least amount of parkland nearby); F 10: is the highest decile (most parkland nearby). Taking into account the size of nearby retail firms, Irvine renters are less disadvantaged. Panel C in Figure 5.5 shows that although Irvine renters are overrepresented in the second and third lowest deciles, they are also overrepresented in the highest decile which may reflect the promotion of mixed use development featuring retail spaces, such as the IBC and Irvine Spectrum areas.31 Owners, however, tend to have fewer retail employees nearby, as seen in panel D. About ½ of owners are in the lowest three deciles, and few have high numbers of retail employees nearby. Nonetheless, both Irvine owners and renters are “less disadvantaged”, relative to their counterparts throughout the county, when we consider the size of retail firms nearby (for example, when comparing panel D to panel B).
31 Renters in the rest of the county are also over-represented in this highest decile, which reflects the fact that particularly large commercial centers—such as malls—tend to have apartments in the immediate surrounding area.
41
Irvine at 50: The changing landscape of housing, commuting, and amenities June, 2022
igure 5.6 Percent of neighborhoods in deciles of food firms or employees: 1 is the lowest decile (least amount of F firms/employees nearby); 10: is the highest decile (most firms/employees nearby). Regarding food establishments nearby, there are notable differences depending on whether we focus on the number of establishments or the size of those establishments. Irvine renters are disproportionately located in the lower end of this distribution in panel A Figure 5.6, indicating that they have fewer food firms nearby. The story is similar for owners in panel B. However, Irvine renters do better when considering the number of food employees nearby. We see in panel C in Figure 5.6 that although Irvine renters are disproportionately in the second lowest decile, they are also disproportionately located in some of the higher deciles. Thus, 58% of Irvine renters are in the top half of the distribution for the number of food employees nearby. However, this is not the case for owners, as shown in panel D: 1/3 of owners are in the bottom two deciles, and just 10% are in the top two deciles.
42
Irvine at 50: The changing landscape of housing, commuting, and amenities June, 2022
Summary The Irvine Company plan for the city of Irvine was based on the village model, with the expectation that all residents would have a nearby village center that would be composed of park and recreation area, as well as small commercial developments. We found that it is indeed the case that Irvine residents have a relatively high amount of parkland near them, especially within ¼ mile. This is even the case for Irvine renters, which contrasts sharply with renters in the rest of the county who often have relatively little parkland near them. However, Irvine residents have fewer retail and food outlets nearby them compared to residents in the rest of the county. In other words, despite the development of Irvine villages with nearby commercial districts, this does not translate into more commercial (and social) opportunities close by Irvine residents compared to residents in the remainder of the county. So who lives in these Irvine villages? In the next chapter, we describe the sociodemographic characteristics of Irvine neighborhoods over the history of the city.
43
Irvine at 50: The changing landscape of housing, commuting, and amenities June, 2022
Chapter 6. Where do different types of workers and residents live in Irvine? We have been describing where Irvine’s housing is located, and the commuting patterns of the people who live in those neighborhoods. But what types of residents live in these different neighborhoods? We explore this question in this chapter by focusing on the location of various socioeconomic and demographic groups across the neighborhoods within the city, and how that has changed during the history of Irvine. Where do Irvine workers by occupation live? In this section, we ask where do workers live in the city, and make a distinction between different occupations.32 In the following maps, we have data in block groups from the last three decades: 1990, 2000, 2010, and 2017. For some measures, we also have data in tracts (but not block groups) in 1970 and 1980 (tracts are about 3 times the size of block groups). In the maps, redder areas indicate a larger concentration of this type of worker. The categories are held to the same values over the decades to also demonstrate the overall growth, or decline, in a job category over time. In Figure 6.1 we show where those working in professional occupations live, and these maps also highlight the overall growth in professional occupation workers since 1990. In 1990, very few neighborhoods (block groups) had more than 50% of workers in professional occupations (the dark red block groups on the map in 1990). However, by 2000 very few neighborhoods had a small presence of professional occupation workers (the yellow block groups), and a substantial portion were above 50%. This pattern continued during the 2000s and 2010s, and by 2017 many city neighborhoods had more than 50% workers in professional occupations.
32 The data used for this section are in tracts and come from the U.S. Census in 1970 and 1980, block groups and come from the U.S. Census in 1990 and 2000, and the American Community Survey (ACS) 5-year estimates for 2008-12 (2010) and 2015-19 (2017).
44
Irvine at 50: The changing landscape of housing, commuting, and amenities June, 2022
Figure 6.1
Another occupation of high-level workers are managers, and we show where they live in the city in Figure 6.2. There is a modest reduction in workers in manager positions over time, although there is still a high representation. Whereas there was a relatively high concentration of managers living in the central portion of the city in 1990, since that time this concentration has disappeared. By 2017, the largest concentrations of managers are generally in the most southern and most northern portions of the city.
45
Irvine at 50: The changing landscape of housing, commuting, and amenities June, 2022
Figure 6.2
A less skilled occupation of workers are clerical workers, and Figure 6.3 shows that there are fewer and fewer of these workers living in the city. Whereas very few neighborhoods had a very small concentration of these workers in 1990 (the yellow neighborhoods that contain less than 5% clerical workers), this has grown over time and by 2017 many neighborhoods have a very small concentration of clerical workers.
46
Irvine at 50: The changing landscape of housing, commuting, and amenities June, 2022
Figure 6.3
Figure 6.4 shows where those working in service occupations live in the city. There is also a large drop in the representation of workers in these occupations since 1990. Whereas there were many neighborhoods in the eastern portion of the city in 1990 with a relatively large concentration of workers in service occupations (greater than 35%; the dark red block groups), these neighborhoods have lost these relative concentrations as the relatively high cost of the new housing in these neighborhoods has attracted workers in different occupations (particularly professional occupations).
47
Irvine at 50: The changing landscape of housing, commuting, and amenities June, 2022
Figure 6.4
Sociodemographic change in the city Given the presence of so many high tech jobs in the city of Irvine, it comes as no surprise that there are a high percentage of residents who have at least a Bachelor’s Degree. So where do they live in the city? Figure 6.5 shows the pattern over time, and we see, unsurprisingly, that already by 1990 a very high concentration of residents near UC Irvine had at least a Bachelor’s Degree. By 2000 the area near the Irvine Spectrum also was a hub of highly educated residents, and since 2010 this has expanded to the entire southern portion of the city. This has now expanded further to parts of Woodbridge and up into the northern portion of the city.
48
Irvine at 50: The changing landscape of housing, commuting, and amenities June, 2022
Figure 6.5
We earlier showed the location of multifamily housing in the city. Unsurprisingly, the pattern of where homeowners live shows a similar pattern. This is shown in Figure 6.6: we again point out that additions of apartment complexes can reduce the percentage of homeowners in a neighborhood over a decade. Whereas many neighborhoods in the city had a high concentration of owners in 1980, this has since fallen in subsequent decades, which is related to the construction of many large apartments complexes in recent years. Nonetheless, there is evidence at the most recent timepoint of an influx of owners in the northern and western portions of the city.
49
Irvine at 50: The changing landscape of housing, commuting, and amenities June, 2022
Figure 6.6
Given the presence of so many owners, a natural question is how home values have fared over time. We use inflation-adjusted home values to show these patterns in Figure 6.7, and there is clear evidence of accelerating home values in the southeastern portion of the city nearest to UC Irvine. The neighborhoods of Turtle Ridge, Shady Canyon, and Quail Hill, which were each built in the early 2000s, have the highest home values currently. Nearby Turtle Rock, despite being an older community, also has relatively high home values.
50
Irvine at 50: The changing landscape of housing, commuting, and amenities June, 2022
Figure 6.7
With the development of Irvine neighborhoods, as well as the placement of large apartment complexes, the population density across Irvine neighborhoods has changed over time. We plot these values in Figure 6.8, which shows some change over time. The central part of the city achieved relatively high population density by 1990. However, the density in these neighborhoods fell by 2000, but then has recovered somewhat.
51
Irvine at 50: The changing landscape of housing, commuting, and amenities June, 2022
Figure 6.8
Households with children tend to live in lower density areas, and we explore this by plotting the percent of households with children in Figure 6.9. This map shows that whereas they were largely clustered in the northern part of the city in 1970, the presence of children has been declining over time. For example, around 1980 and 1990 the neighborhoods in the central part of the city—Woodbridge and El Camino Real—had a relatively high presence of children, but this declined by 2010, though with a slight uptick recently. Likewise, in 1990 several neighborhoods in the southern portion of the city had a high concentration of families with children, but this has diminshed somewhat in recent years.
52
Irvine at 50: The changing landscape of housing, commuting, and amenities June, 2022
Figure 6.9
Racial/ethnic change in the city Irvine is a relatively diverse city, and has experienced notable racial/ethnic change over its history. This is demonstrated quite vividly in Figure 6.10, which shows the percent white in Irvine neighborhoods over this time period. Whereas the city neighborhoods were primarily white (with greater than 85% white residents) up until 1980, this has consistently been changing since then. By 1990 there were several neighborhoods with less than 85% white residents, and a few scattered neighborhoods with less than 70% white residents. By 2000 this pattern became quite pronounced. This trajectory has continued in the more recent years, and the number of neighborhoods with less than 30% white residents (the yellow areas) have continued to increase. The presence of neighborhoods with at least 85% white residents has almost entirely disappeared.
53
Irvine at 50: The changing landscape of housing, commuting, and amenities June, 2022
Figure 6.10
The racial/ethnic group that has increased the most in Irvine are Asian Americans. In 1980, only the neighborhood of Walnut had more than 10% Asians.33 By 1990, several neighborhoods in the central part of the city exceeded 20% or even 30% Asians. By 2000 we begin to see majority Asian neighborhoods, particularly along the northwestern portion of the city. This growth has continued in recent years, and now there are many majority Asian neighborhoods scattered throughout the city, although particularly clustered in the northern part of the city, which is experiencing considerable new development.
33 The Census did not provide information on Asians in 1970, and therefore we are not able to present their distribution in that year.
54
Irvine at 50: The changing landscape of housing, commuting, and amenities June, 2022
Figure 6.11
There are fewer Latinos in Irvine. As shown in Figure 6.12, the Latino population was clustered in the northern part of the city at incorporation. During the 1980s and 1990s there was growth in the Latino population in the south and eastern portions of the city, as well as near the Irvine Business Complex. The largest concentration now is near UC Irvine, which has recently been classified as a Hispanic-serving institution given the large proportion of Latino students.
55
Irvine at 50: The changing landscape of housing, commuting, and amenities June, 2022
Figure 6.12
There has always been a much smaller proportion of African-Americans in Irvine. As shown in Figure 6.13, in the early years of the city this group was clustered in the northern portion. In the 1970s and 1980s they remained clustered towards the edges of the city. The yellow neighborhoods are those with no African American residents, and these tend to be clustered towards the center of the city, even into recent years.
56
Irvine at 50: The changing landscape of housing, commuting, and amenities June, 2022
Figure 6.13
Given the presence of Latinos and, particularly, Asians in Irvine, it is no surprise that there is a relatively strong presence of immigrants in the city. We plot which tracts immigrants live in from 1990 to now in Figure 6.14 (we do not have data for the earlier years). These maps show the substantial growth in immigrants over this time period. In 1990, there were just a couple neighborhoods in Westpark with a high immigrant concentration, and these concentrations have remained over time. The presence of UC Irvine, as well as changes to immigration policy during the 1990s to increasingly favor the highly skilled and educated, have also contributed to the city’s growing immigrant presence. By 2000, a number of neighborhoods towards the center of the city had relatively high immigrant concentrations. This growth in immigrants has continued in recent years, and we see the emergence of immigrant concentration neighborhoods in the northern portion of the city in recent years, which are largely Asian immigrants.
57
Irvine at 50: The changing landscape of housing, commuting, and amenities June, 2022
Figure 6.14
A notable feature of Irvine is that it not only has a relatively large immigrant population, but they have come from several different countries. In Figure 6.15 we show the concentrations of the six largest immigrant groups (based on country of origin) in the city in 2017. The largest concentration are immigrants from China, and there are a number of neighborhoods in which more than 12% of residents are immigrants from China (the red areas on the top left map). This group is largely concentrated in the northern portion of the city, as well as in the southwest section near the IBC. The second largest concentration is from Korea (bottom center map), and they are generally concentrated in different neighborhoods compared to immigrants from China. The immigrants from Iran are concentrated more in the southern portion of the city, as well as near the Irvine Spectrum (bottom left map). In general, these different groups do not cluster in the same neighborhoods, but rather tend to settle in different parts of the city.
58
Irvine at 50: The changing landscape of housing, commuting, and amenities June, 2022
Figure 6.15 This change in the racial/ethnic composition has implications for the amount of racial/ethnic mixing within neighborhoods. We constructed a measure of racial/ethnic heterogeneity in Irvine neighborhoods—this is a measure that has higher values when there is a larger mix of all racial/ethnic groups in a neighborhood—and plot these over time in Figure 6.16.34 This measure has an intuitive meaning: if a person was to randomly interact with the other residents in their neighborhood, then this would give the percentage of interactions that would be with members of a different group. For example, neighborhoods on these maps that are red have values greater than 60, indicating that a person in these neighborhoods going about their business, of the persons they randomly encounter 60% would be a different racial/ethnic group from themselves. Whereas there were few of these neighborhoods in 1980, by 1990 there were many such neighborhoods. This has only continued to increase over time, indicating that Irvine neighborhoods are not segregated into different racial/ethnic groups, but rather have considerable diversity within them. 34 This measure is sometimes referred to as a Herfindahl Index, and is constructed as a sum of squares of the proportion of residents in each of five racial/ethnic groups (White, Black, Asian, Latino, and other race), which is then subtracted from 1. Higher values indicate a higher amount of mixing. If a neighborhood is composed of all from one group, this index will have a value of 0. 59
Irvine at 50: The changing landscape of housing, commuting, and amenities June, 2022
Figure 6.16
Summary This chapter has shown where Irvine residents of different socioeconomic and demographic groups live. One goal of the Irvine Company plan attempted to mix different types of housing to create more mixing of households based on various characteristics, such as socioeconomic status and household type. We have seen here that there is considerable mixing in these neighborhoods based on race/ethnicity, which was not necessarily an explicit goal of the Irvine plan, but nonetheless is an outcome. In the next chapter, we summarize what we have learned in this Report, and consider what the future holds for Irvine.
60
Irvine at 50: The changing landscape of housing, commuting, and amenities June, 2022
Chapter 7. Conclusion: What does the future look like for Irvine? Irvine as a city was developed beginning in the 1960s based on the philosophy of the New Town movement, in which the goal was to create an environment that is largely walkable. In Irvine, that translated into the Village model in which housing was developed around a central location for the particular village that tended to have park and recreation areas, small commercial districts, and sometimes churches and other places of worship. The city also created greenbelts in an effort to promote the walkability of the city. By greenbelts, we mean narrow strips with greenery and a walking or biking path connecting to different parts of the neighborhood or other neighborhoods. We have explored the development of the city, particularly its spatial arrangement as a living place and the diversity it embraces, in this Report. Here we describe our key findings. One finding that may be surprising to those who think of Irvine as the stereotypical suburban community is that it actually has much less detached single family housing compared to the region overall. The stereotype of many detached single family housing units—the hallmark of suburban development—is simply not the case in Irvine. In 2017, whereas 56% of the housing in the average neighborhood in the rest of the county were detached single family housing units, this percentage was just 40% in Irvine. Instead, Irvine has a relatively high proportion of attached single family housing units—these are condominiums and town homes. Irvine has consistently had about double the presence of this type of housing compared to the rest of the county. Furthermore, it is very large-sized multifamily complexes (those with more than 50 units) that are particularly prevalent in Irvine, especially since the 1990s. Since then, the presence of these large complexes in Irvine has shot up and now about 15% of housing units are contained in these very large complexes—about double the rate of the rest of the county. In recent years there is a high concentration of these larger apartment complexes near the Irvine Business Complex, the Irvine Spectrum, and UC Irvine. Another feature of Irvine is that it is a job subcenter, as we highlighted in a separate Report.35 The presence of so many jobs in the city has benefits for the commuting patterns of Irvine residents. A high percentage of Irvine residents work within the city. Whereas in 1980 Irvine ranked #29 among Southern California cities as 26% of residents worked at jobs in Irvine, that has improved considerably since then and since 2000 Irvine has ranked #9, with 44% working in the city in the most recent decade. As a consequence of the high job concentration, commute times in general are consistently shorter in Irvine compared to the rest of the county. Commute times are about 20% longer for residents in the remainder of Orange County compared to Irvine residents, and about 30% longer for residents in the remainder of Southern California compared to Irvine residents. Commute distances are also shorter in Irvine compared to the rest of the county and the region. On average, commute distances of residents in the remainder of Orange County are over 30% longer than those of Irvine residents, and for residents in the remainder of Southern California they are 50%-60% longer than those of Irvine residents. When disaggregating by neighborhoods, we found that most neighborhoods in Irvine indeed experience these shorter commute distances.
35 See the MFI Report: Irvine at 50: From a Planned Community to a Growing Job Center.
61
Irvine at 50: The changing landscape of housing, commuting, and amenities June, 2022 The presence of so many jobs also impacts the mode of commute of Irvine residents. On the one hand, similar to other Southern California residents, Irvine residents are most likely to commute by driving alone. On the other hand, compared to residents in the remainder of the county, Irvine residents are more likely to commute by walking or bicycle, which is a testament to the relative nearness of jobs and desire for active transportation. Furthermore, Irvine residents are more likely to work at home compared to residents in the rest of the county. Notably, many of those who walk to work are those who work at UC Irvine, and therefore are living in University Hills, a housing development built and managed by the University of California. There has been a large growth in workers in professional occupations over the last few decades, and they live in most neighborhoods throughout the city. Relatedly, there has been a large growth in residents with at least a Bachelor’s Degree, which is not surprising given the presence of UC Irvine and the growth in high tech and professional jobs. At the same time, there has been a steady growth in the racial diversity of Irvine. While there has been a steady decline in the percent white in the city, there has also been a steady growth in the percent Asian residents. There is also a high concentration of immigrants in the city, many of them of Asian background. As a consequence, Irvine is a very racial diverse city, although the city could have been more inclusive for other (non-White and non-Asian) population groups. Nonetheless, we showed that rather than exhibiting segregation in which different groups live in their own separate neighborhoods, Irvine has relatively high racial/ethnic mixing across most of the neighborhoods in the city. Although the goal of the Irvine Company plan in designing villages was to provide parks and commercial areas in easy walking distance of all residents, we found mixed evidence for this. On the one hand, there is indeed more parkland within walking distance of Irvine residents compared to residents in the rest of the county. Irvine residents have 50% more parkland within ½ mile compared to residents in the rest of the county. Furthermore, most Irvine renters also have a relatively high amount of parkland near them. On the other hand, Irvine residents have fewer retail and food establishments within walking distance compared to residents in the rest of the county. Irvine residents tend to have about ½ as many retail establishments near them compared to residents in the rest of the county. What Does the Future Hold for Irvine? Despite the apparent positive features of the city of Irvine, the pace of population growth will also create demand for the city to build additional housing units. Over the past 15 years, Irvine’s median home values have consistently outpaced the rest of Orange County, which presents significant challenges in maintaining a healthy jobs/housing balance, particularly as the city’s employment centers continue to expand. Increased diversity of the city’s housing stock, particularly in rental units developed by the Irvine Company, led to the city’s share of renter-occupied units exceeding 50% for the first time in 2013.36 Since that time concerns of overcrowding and overpayment (i.e. spending more than 30% of income to cover housing costs) among the city’s renter population have become more apparent, particularly among lower-income households. Many of the city’s most vulnerable populations—including the unhoused and students—continue to grow, suggesting that debates over the provision of affordable housing will likely persist over the near term.
36 2013 American Community Survey, 5-Year Estimates
62
Irvine at 50: The changing landscape of housing, commuting, and amenities June, 2022 Furthermore, changes in Irvine’s demographics appear to reflect trends occurring at the national level. Whereas a handful of majority Asian neighborhoods began to emerge in the 2000s, the city’s Asian population appears poised to eclipse 50 percent over the coming decade and become the largest city in the continental United States with an Asian plurality.37 38 This trend echoes broader demographic changes, with Asians representing the country’s fastest growing ethnic group between 2000 and 2019.39 Additionally, immigration from Asia is likely to constitute a growing share of newcomers to the city in the future, due in large part to UC Irvine’s role as a destination for international students and faculty as well as the establishment of many community-based, cultural, and advocacy groups with links to Asia or the Asian-Pacific region located in Irvine, many of which assist immigrants when settling in Irvine.40 A key question is whether the city will be able to shoulder the challenges a rapidly expanding population brings, ranging from housing to health care to transportation. Although Irvine has fewer retirees than the average city, the number of households headed by individuals 65 years and older is expected to almost triple (to 18,963) by 2035, which may be of concern.41 At the same time, we saw evidence that the number of neighborhoods with children has diminished somewhat in recent years, which will raise the age of the average Irvinite over time. As a result, concerns over housing may evolve to account for the quantity as well as the quality of housing available to the city’s elderly residents, particularly for those who choose to age in place. For instance, is housing being built in close proximity to public transit facilities? Is housing situated near walkable and pedestrian-friendly amenities and infrastructure? The hopeful implication is that Irvine, unlike many other suburban cities, offers a diversity of housing choices that may serve as viable residential options for seniors in the future such as accessory dwelling units, multifamily housing, and mixed-use developments.
37 Orange County Register, September 21, 2016. “Why Asians have become the dominant group in Irvine – and what that means for the city” https://www. ocregister.com/2016/09/21/why-asians-have-become-the-dominant-group-in-irvine-and-what-that-means-for-the-city/ 38 Currently, the largest majority Asian city in the continental U.S. is Fremont, CA, at about 230,000 population. Overall, Honolulu is the largest such city in the U.S. with about 350,000 population. 39 US Census Bureau, April 19, 2021. “A More Diverse Nation”. https://www.census.gov/library/visualizations/2021/comm/a-more-diverse-nation.html 40 Examples of such organization or groups include WeIrvine; Korean American Center; Network of Iranian American Professionals of Orange County (NIPOC); Iranian American Community Group Orange County 41 City of Irvine, Housing Element: http://alfresco.cityofirvine.org/alfresco/guestDownload/direct?path=/Company%20Home/Shared/CD/Planning%20 and%20Development/General%20Plan/04.%20Housing%20Element%20-%20Aug%202015.pdf
63
Irvine at 50: The changing landscape of housing, commuting, and amenities June, 2022
Technical Appendix Data sources We used data in this Report from several sources, as noted in the footnotes throughout. Here we summarize these data sources. Several sections used data from the U.S. Census aggregated to neighborhoods. In more recent years, we obtained data in block groups, which have an average of about 1,400 residents. In earlier years the smallest unit of analysis available was tracts, which have an average of about 4,000 residents. We used the smallest geographic unit available to us for a particular year. We used data from the decennial U.S. Census in 1970, 1980, 1990, and 2000. Since then, the Census provides information from the American Community Survey (ACS) 5-year estimates. To provide estimates for block groups or tracts, the Census must combine 5 years together to obtain a large enough sample for reasonable estimates. Therefore, we used the 2008-2012 ACS 5-year estimates to refer to 2010 (as this is the midpoint year). And we used the most recent data available to us—the 2015-2019 ACS 5-year estimates—to refer to 2017. The commuting data come from the Census Transportation Planning Packages (CTPP). We used the packages for 1990 and 2000. For more recent years, we use the ACS CTPP 5-year estimates. The data available are the 2006-2010 5-year estimates, and the 2012-2016 5-year estimates. We use data on parks in 2010 that comes from the ESRI streetmap data. Based on this information, we computed the percent of land that is parkland in each block using a geographic information system (GIS). The data on businesses comes from the Reference USA Historical Business Dataset, a proprietary source. These data provide the locations of all businesses in the U.S., as well as the number of employees at each location. We geocoded each business, and we can then calculate the number of businesses of a particular type in each census block. We used the NAICS 2-digit codes to classify businesses: retail are codes 44-45, and food are codes 71-72. Description of methods In Chapter 5, to answer the question about how close parks and retail locations are to Irvine residents in 2010, we obtained information on all park land in the county, and all business establishments in the county. For each census block in the county, we drew different sized buffers around it: ¼ mile, ½ mile, ¾ mile, and 1 mile. For assessing parks, we measured the percentage of land area that was parkland within the buffer for the block. For assessing businesses, we assessed this in two ways. First, we measured the number of establishments within each buffer for retail establishments or food-related establishments (e.g., restaurants, fast food, grocery stores, etc.). A limitation of this strategy is that it does not tell us how large the businesses are—thus, a small mom & pop shop is counted the same as a large superstore. Therefore, our second strategy measured the number of employees of either retail firms or foodrelated firms within each buffer. For all of these computations we take into account the size of population in the block in 2010: our results therefore tell us how many amenities are nearby to the average person in Irvine in 2010 compared to the average person in the rest of the county.42
42 We accomplish this by using the block population as frequency weights in all analyses.
64
Irvine at 50: The changing landscape of housing, commuting, and amenities June, 2022
References Brower, Martin A. 1994. The Irvine Ranch: A Time for People. Newport Beach, CA: Orange County Report. Forsyth, Ann. 2016. "Who Built Irvine? Private Planning and the Federal Government." Urban Studies 39:2507-2530. Hess, Alan. 2014. "Discovering Irvine." Places Journal. Wiley & Ham. 1974. "General Plan for the City of Irvine." Irvine, CA
65
School of Social Ecology Science Driving Solutions
The School of Social Ecology is dedicated to interdisciplinary, problem-driven scholarship, teaching, and outreach in the public’s interest. Social Ecology’s unique focus and expertise has made it a national leader in applying basic theory and empirical research to address complex societal problems. Since 1970, Social Ecology has grown from a few dozen students to more than 2,500, with over 20,000 graduates working in fields as diverse as health care, human services, planning, education, law and public policy. The School is home to three highly ranked departments - Criminology, Law and Society; Urban Planning and Public Policy; and Psychological Science - that share a commitment to research that understands human behavior in larger social and institutional contexts, moves beyond traditional disciplinary boundaries, and reaches a diverse and broad audience.
UCI School of Social Ecology 5300 Social & Behavioral Sciences Gateway, Irvine, CA 92697 www.socialecology.uci.edu · secomm@uci.edu