1 minute read
SPILL/POLLUTION STATISTICS – 2018


I am often asked what do UK and Ireland Spill Association members do? I say well – a lot! However statistically just want do we do?
This data has been gathered from publicly available sources and complied here for ease of reference.
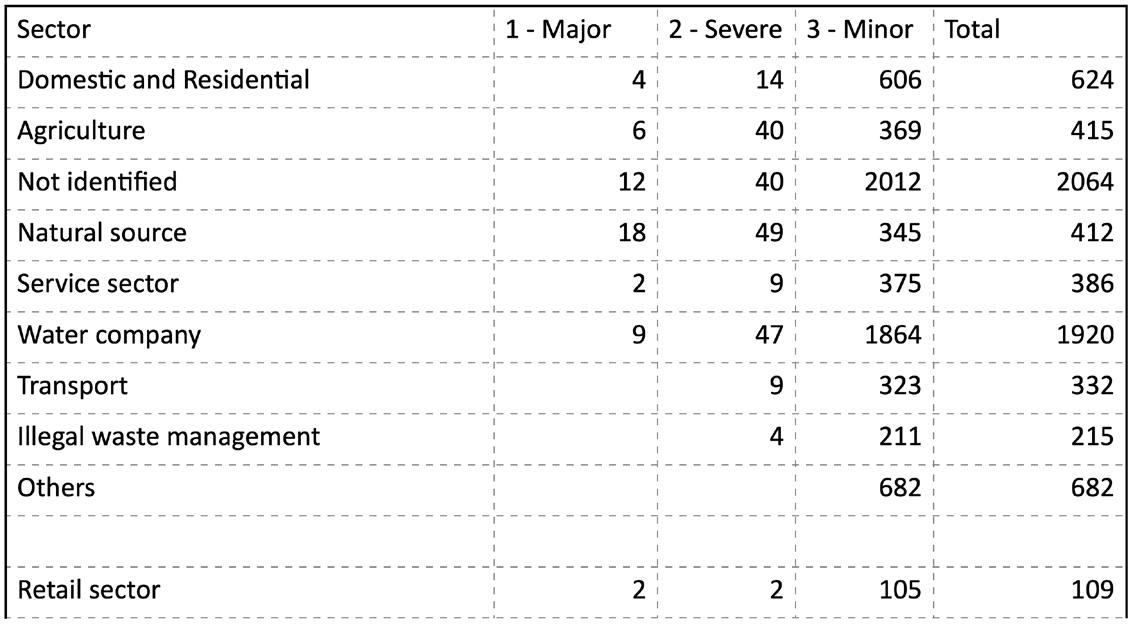
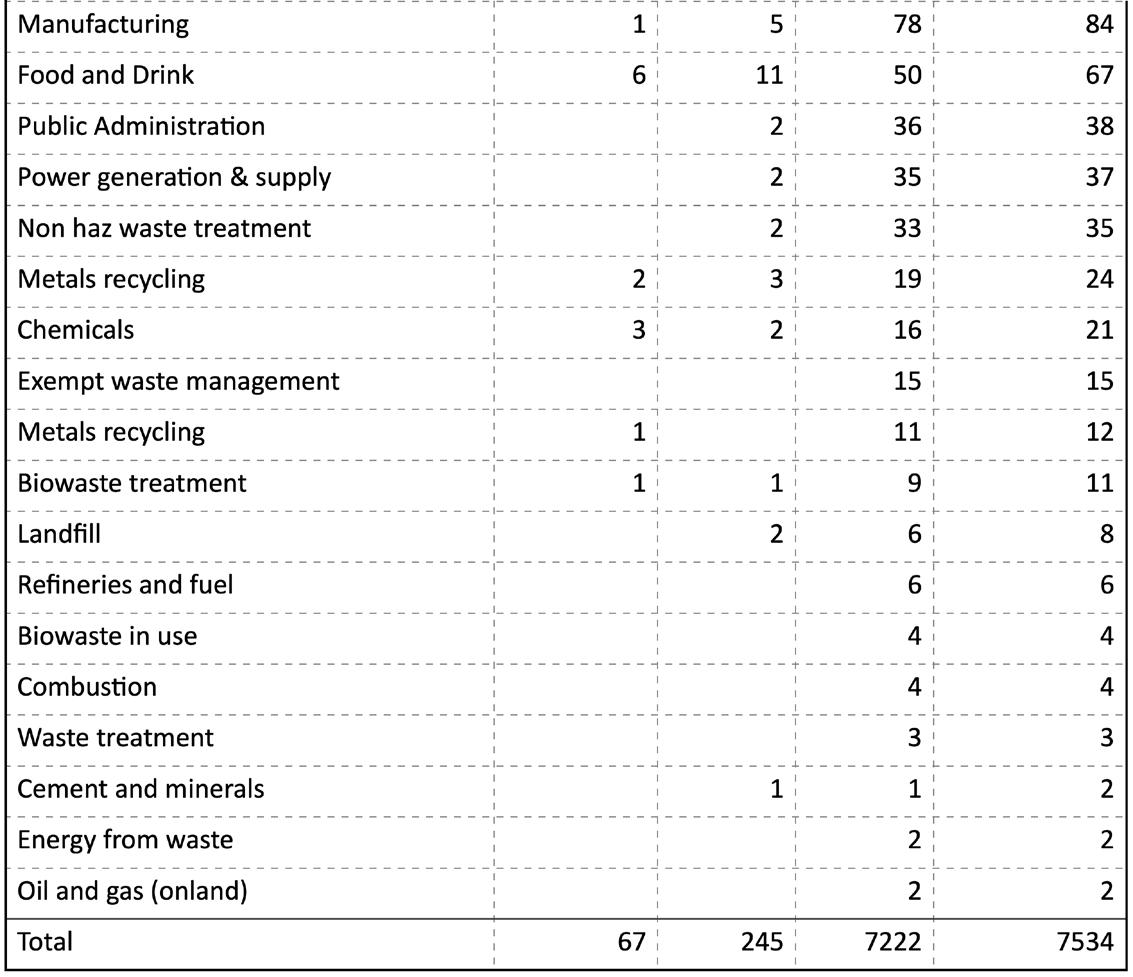
1.Inland Pollution Incidents by Type 2018
A. Where there was a possible or probable impact on water quality
B. Where there was no impact on water quality
Comment:
The statistics have been drawn from a variety of different sources.
The accuracy of statistic depends upon the accuracy of reporting, hence we have agreed the adjustment factor with the EA for under reporting to try to present a reasonably accurate picture.
From those I have discussed the statistics with they wouyld agree that there are more pollution incidents reports than represented in these statistics.
Is this fact or fiction?
I would urge accredited contractors to submit monthly or quarterly spill reports (which are anonymous) so that we get a true picture?
Our data, being compared to these statistics will enable a more accurate picture to be presented from which EA/MCA and our own member resources may be allocated.
We welcome feedback on this data!

C. Total incidents where anEnvironment Agency officer had been involved.

D. Likely number of incident with an adjustment factor for under reporting

E.Incidents categorised as beingOil, chemical and other pollutant incidents

F.Based on the above Likely number of incident with an adjustment factor for under reporting

G. Report to Environment Agencyhotline in 2018 – 74280
2.Offshore and shoreline pollutionincidents

A. Oil rigs and offshore installation reported hydrocarbon releases 2018

B. Coastal Marine PollutionIncidents 2018

C. Shoreline Pollution Incidents