6 minute read
APPENDIX C: DESIGN EXAMPLE ALTERNATE SCENARIO – HIGH-FLOW EVENT


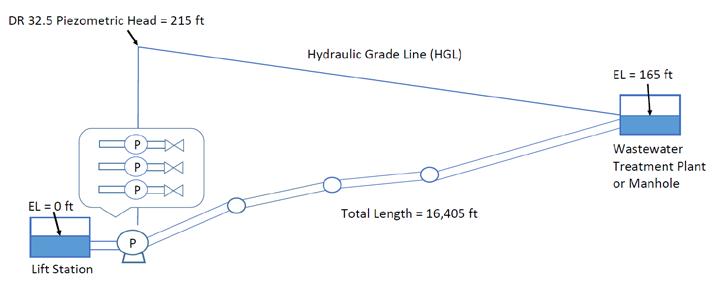
Since cyclic life is primarily dependent on daily pump operations, this operating state was used in the design example . However, a force main may see high-flow events (such as heavy rain) for a portion of its life, which can result in changes in the number of pump cycles . For this scenario, a high-flow event is defined as one that causes all three pumps (lead, lag, and standby) to run . Solution B of Design Example is used to show typical operating conditions, but with the addition of a high-flow event occurring for a portion of the year . For this example, high-flow events are assumed to occur for 80 days per year . Assumptions: The cyclic design assumes that all pumps are running for 80 days per year (maximum flow), and a single pump is running 285 days per year (normal flow) . Other assumptions are the same as those listed in Design Example, Solution B . To complete all four design checks for DR 32 .5 PVC pipe, the following hydraulic and transient models are used: The HGL in Figure C .1 provides the maximum working pressure (WPmax ) .
WPmax = 215 ft = 93 psi
Advertisement
FIGURE C .1: FORCE MAIN PROFILE
Figure C .3 represents recurring surge (Prs(max)) for the single-pump operation .
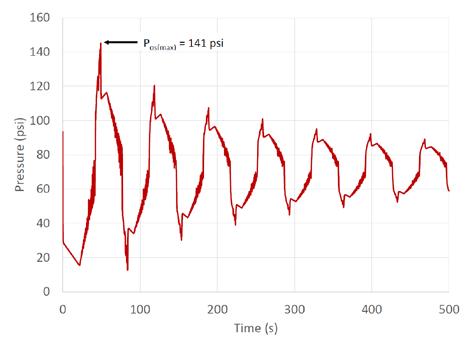
Pos(max) = 141 psi
FIGURE C .2: PRESSURE vs TIME FOR SIMULTANEOUS POWER FAILURE OF ALL PUMPS
FIGURE C .3: FLOW AND PRESSURE vs TIME
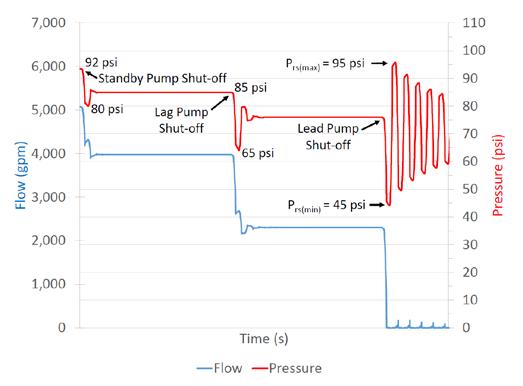
Prs(max) = 95 psi
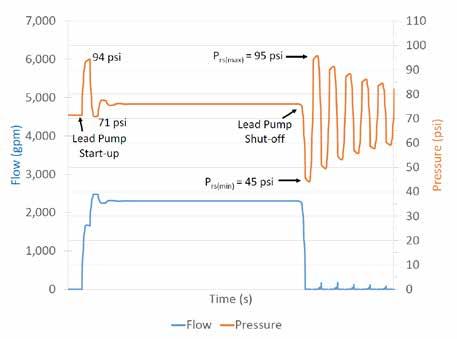
The step-downs in pressure correspond to each pump shutting off in sequence . When Figures C .3 and C .4 are compared, the values of Prs(max) = 95 psi and Prs(min) = 45 psi do not change . In other words, whether a single pump or multiple pumps turn(s) on/off, maximum and minimum recurring surge pressures do not change . The first three design checks are as follows (same as Design Example, Solution B):
FIGURE C .4: FLOW AND PRESSURE vs TIME FOR THREE-PUMP OPERATION
Note: For reflected waves following pump shut-off, see Reflected Pressure Waves .
WPmax ≤ PC × FT
141 psi ≤ 1.6 × 125 psi × 1.0 141 psi < 200 psi
(First Design Check)
(Second Design Check)
(Third Design Check)
TABLE C .1: MINER’S RULE TABLE FOR VARYING PUMP CYCLES PER YEAR
Surge Event
Lead Pump: shut-off from single-pump operation (typical flow) Lead Pump: shut-off from three-pump operation (high flow)
Prs(max) (psi)
Prs(min) (psi) Ni per Folkman Equation (cycles × 106) Cycles per Day
ni (cycles per year) Fraction of Life Consumed per Year (ni/Ni)
Sum = 0 .0042
Cyclic Life (reciprocal of Sum) = 238 years
In this example for high-flow events, cyclic life is 238 years . Inputs for this table are as follows: Surge Event Surges from pump start-ups are ignored, since resulting surge-pressure amplitudes produce almost no fatigue . For single-pump operation, only pump shut-off is considered . For three-pump operation, down-surges from the first two pump shut-offs (standby and lag) produce almost no fatigue . Only the third pump (lead) shut-off is included . Prs(max); Prs(min); Folkman Equation (Ni) Maximum and minimum recurring surge pressures are 95 psi and 45 psi, respectively, for both operations as shown in Figures C .3 and C .4 . Use Folkman Equation (Equation 2) . Cycles per Day For single-pump operation: a shut-off occurs every 15 minutes (96 times per day) . For three-pump operation: to determine number of times the last pump (lead) shut-off occurs, wet-well size and inflow rate are needed . The last pump will shut off when the inflow rate reduces to a value less than the single pump’s flow rate . For simplicity, this example assumes the last pump shuts off every 30 minutes due to fill and empty time for the wet well . This equates to 48 occurrences per day, which is considered a large number of cycles during high-flow events . Cycles per Year (ni) Assume single-pump operation occurs 285 days per year . Assume three-pump operation occurs 80 days per year .
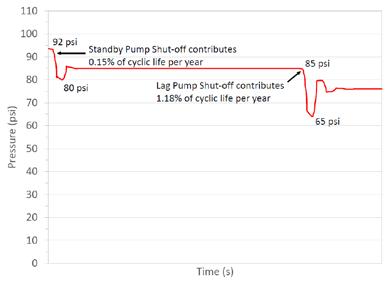
Cyclic life is higher when accounting for high-flow days . In this example, the resulting cyclic life is 238 years . In contrast, in the design example, which is based on a single-pump operation for 365 days a year, cyclic life is 211 years . This may seem counterintuitive at first but can be explained . High-flow events are often associated with greater surge pressures due to increased velocity changes . However, the transient model in Figure C .4 shows that there is a minor down-surge each time the standby pump or the lag pump turns off, but a major down-surge when the lead pump turns off . If lag pump and standby pump down-surges were included in Table C .1, calculations would show that the impacts on cyclic life are negligible (Figure C .5) .
Summary: Surges caused by lag pump and standby pump shut-offs produce almost no fatigue . Surges caused by all three pump start-ups also cause almost no fatigue . Therefore, only the one-pump (lead) shut-off surge must be taken into account . The surge from this last pump shut-off is the same as for the one-pump operation . For the lead pump, cycles occur fewer times per day with multiple pumps operating . In effect, the other two pumps reduce the demand on the lead pump because it takes more time for the wet well to fill and empty . Conclusion: In the Design Example, a surge pressure between 45 psi and 95 psi occurs 96 times per day for 365 days per year . In this high-flow scenario, the same surge pressure and frequency occur only 285 days per year . For the remaining 80 days, this surge from lead pump shut-off occurs at a lower frequency of 48 times per day (as compared to 96 times per day) . The result is a longer cyclic life of 238 years for the high-flow scenario compared to 211 years for singlepump operation . For multiple-pump operations, high-flow events do not require additional analysis because they are not designlimiting . Design of PVC force mains should be based on regular pump operation that causes maximum surge amplitude (which occurs during lead pump shut-offs), as shown in Design Example, Solution A or B .
Bottom line: high-flow events with multiple pumps do not govern cyclic life of PVC force mains.
FIGURE C .5: SMALL DOWN-SURGES FROM SHUT-OFFS OF FIRST TWO PUMPS