From the Skies: A Look at Vegetative Health of Meadows Over Time Using Landsat and NDVI
Marina Wesel, Dr. Hillary Jenkins marina_wesel@redlands.edu
University of Redlands, Department of Environmental Studies, 1200 E. Colton Ave, Redlands, CA 92374


III. Time Series Analysis
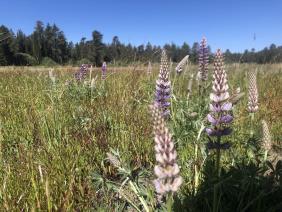
The montane meadows of the San Bernadino Mountains are important ecosystems, as they regulate and maintain forest water distribution and act as early indicators of overall forest ecosystem health These regions also house important rare plant communities that include the endangered California Dandelion (Taraxacum californicum) and Bird foot Checkerbloom (Sidalcea pedata These plants only exist in an alpine environment with a shallow (<2 meters) water table however, current measurements of groundwater indicate the water table may be deepening Here we investigate vegetation distribution over a 7-year time period (2015-2021 in 3 meadows in varying stages of hydrologic health In order to look at the vegetation distribution in the meadows, we used images from the Landsat 8 satellite to calculate the Normalized Difference Vegetation Index (NDVI), a measure of vegetative health and land cover based on spectral reflectance Images were obtained from GloVis through USGS and processed in ArcGIS to calculate the NDVI for each time period NDVI data was compared with fluctuations in groundwater using piezometers (passive wells) installed in each meadow and with historical precipitation over the region Groundwater data was also used to measure realtime (hourly) fluctuations in plant water need and used to estimate evapotranspiration during both wet and dry seasons Based on this data, we project the timing of peak evapotranspiration occurs during the day and is found to significantly contribute to water table fluctuations The close connection between the water table and plant transpiration is reflected in the relationship between NDVI and water availability, where precipitation during the preceding month was found to most strongly correlate with NDVI over all three meadows The driest meadow on this study, Broomflat, showed little change in NDVI over the 7-year period, whereas the modestly wet meadow (Bluff) showed a lot of variability from year to year The wettest meadow (Lodgepole) showed moderate fluctuation, however the vegetation remained relatively dense These results are consistent with how each meadow reacted to seasonal precipitation Broomflat is relatively unreactive to precipitation, and this is evident with the drier vegetation, Bluff is highly reactive to precipitation, and this is evident with the variability in vegetation distribution, and Lodgepole is moderately reactive to precipitation, and this is evident with the lack of variability in vegetation distribution Studying these changes in vegetation distribution and the meadow’s reactivity to precipitation is important to understanding how climate impacts these ecosystems, as well as identifying the signs of and unhealthy and dying meadow
II. Lab Methods
Obtaining

Does vegetation distribution and plant community composition change over interannual time scales?
• Meadow vegetation shows variability in greenness from year to year
• 2017 shows lowest NDVI values in all three meadows
• NDVI is lowest in Broomflat and highest in Lodgepole, suggesting variability in hydrologic stress and responsiveness to climate.

• Bluff shows a different response to climate annually compared with Lodgepole
V. Precipitation and Average NDVI
How does vegetationreact to water availability over longer time scales across the hydrologic gradient?


• There is little correlation with precipitation in hydrologically stressed meadows, such as Broomflat.
• Bluff meadow vegetation is highly reactive to the precipitation.
• Lodgepole meadow is not as reactive to the precipitation.


• NDVI is well correlated with precipitation with a 1-month time lag in wet meadows.


VI. Conclusions
Does vegetation distribution and plant community composition change over interannual time scales?
• Yes, NDVI analysis shows that changes in vegetation distribution do occur in meadows and vegetation density varies interannually.
What are the seasonal (wet and dry) hydrologic needs of meadow vegetation?
NDVI is a measure of vegetative health.
IV. Seasonal Water Use by Plants


Healthy vegetation has a higher NDVI value.


Stressed vegetation has lower NDVI value.
NDVI

What are the seasonal (wet and dry) hydrologic needs of meadow vegetation?

• The evapotranspiration is highest when the water table is at it’s lowest.
•
• Hourly data collected on water table depth during Bluff wet and dry season.
• Evapotranspiration (plant sweat) predicted based on water loss throughout the day.

• The dry season experiences greater evapotranspiration than the wet season.
• The hydrologic needs of meadow vegetation are higher during the dry season; projected evapotranspiration and water table recharge is also higher during the dry season.
How does vegetation react to water availability over longer time scales across the hydrologic gradient?

• The vegetation in hydrologically stressed meadows (Broomflat)is less reactive than to water availability over longer time scales than in hydrologically healthy meadows (Lodgepole).

Meadows are very important and sensitive ecosystems that serve as indicators to the health of the forest and understanding how they react to climate and other factors is crucial to protecting these ecosystems
VII. Acknowledgements
• Dr. Hillary Jenkins and the EVST Department
• Dr. Eric Hill, TJ, Isaac, and Gavin for helping us in the field
• The US Fish and Wildlife Service for research funding
• The US Forest and volunteers


• The Wildlands Conservancy

• Our generous donors, Mrs. Levings and Mr. Matthias
• The Summer Science Research Program

