Advanced Spatial Analysis
Spring 2024:
Akhil Akash
August Nastasi
William Fainaru

Advanced Spatial Analysis
Spring 2024:
Akhil Akash
August Nastasi
William Fainaru

Exploring where a Transition from Short-Term Rentals to LongTerm Tenureship in Brooklyn and Queens could be most Impactful
The Nexus of Two Housing Policies
Abstract
Background on Local Law 18
Background on City of Yes for Housing & ADU Pilot Plus
Missing Middle Housing
Research Question
The Overlap between Short Term and Long Term Housing
Scope
Limitations
Data Sources
Future Research
Research Site
Operationalizing ADUs and AirBnBs
Accessory Dwelling Units
AirBnBs
Analysis
Bivariate Mapping
Identify Density Levels by Census Tract
Multi-Criteria Decision Analysis (MCDA)
Geographic Weighted Regression
Findings
Bivariate Mapping
Identify Density Levels by Census Tract
Multi-Criteria Decision Analysis (MCDA)
Geographic Weighted Regression
Conclusion
References
Appendix
Our research revolves around the dynamics of Accessory Dwelling Units (ADUs), AirBnB properties, and their interplay with the concept of the “Missing Middle” in housing. ADUs and AirBnBs, while both epitomize low-density housing options, cater to distinct needs within the urban housing spectrum.
ADUs emerge as long-term rental solutions, seamlessly integrating into the fabric of residential neighborhoods and fostering a sense of community continuity. They offer a stabilizing force, potentially increasing the availability of affordable housing and diversifying the range of housing options beyond single-family homes, thus directly contributing to the “Missing Middle.” AirBnBs primarily serves the short-term rental market, providing flexible accommodations that cater to transient populations. While not traditionally aligned with the “Missing Middle” housing concept, the prevalence of AirBnB rentals can indirectly influence this segment by impacting rental prices and housing availability. In neighborhoods where short-term rentals are abundant, they may affect the character and density of the area, possibly leading to a scarcity of long-term housing options.
In essence, ADUs align more closely with the goals of expanding the “Missing Middle” by providing permanent homes to those seeking affordable options in well-established neighborhoods. Meanwhile, AirBnB properties represent an adaptive, albeit more transient, use of urban space, which must be carefully managed to maintain a balance with long-term residential needs.
Our study aims to dissect the spatial patterns that might emerge between potential ADUs locations and existing AirBnB properties in New York City’s Kings & Queens counties, and how these patterns can be harmonized to support and enhance the “Missing Middle” housing sector.
In response to the proliferation of short term rentals, the City of New York adopted Local Law 18, mandating the registration of AirBnBs with the Office of Special Enforcement. This policy was implemented to protect long term housing from being taken off the market, a decision made by many other tourist destinations where AirBnBs have saturated the long term housing markets.
Since the policy’s announcement in 2022, the number of AirBnBs registered with the city is less than half of the number of total listings on its platform. AirBnBs are now contingent on the city’s zoning codes, only permitted in neighborhoods that allow for Class B dwellings. This could skew the spatial distribution of AirBnBs, with certain neighborhoods bearing more of the burden to host the remaining listings. In addition, independent renters of short term rentals could be crowded out by commercial investors, who can afford to invest in those neighborhoods and are better acquainted with the city’s registration requirements.
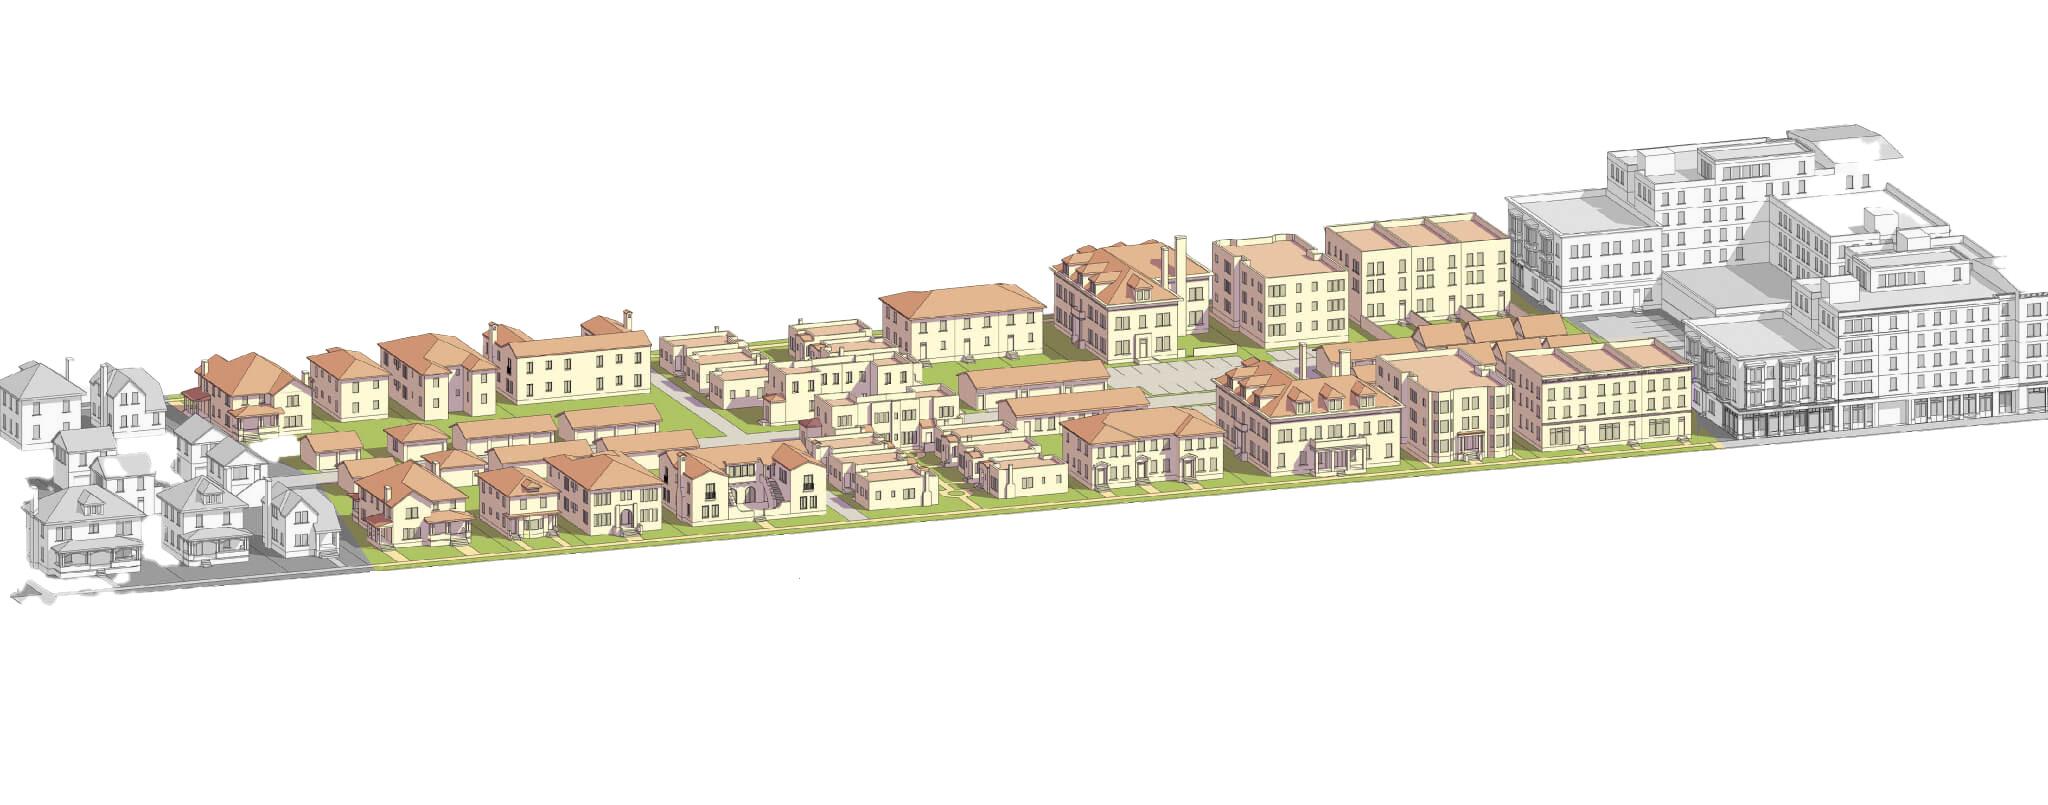
The implementation of Accessory Dwelling Units has been heralded as a strategy to integrate more middle density housing, an underprovided typology that has gained the moniker the “Missing Middle.” Examples of Missing Middle housing include – but are not limited to – cottage courts, duplexes, multiplexes, and rowhouses. In New York City, Queens and Brooklyn provide the most fertile ground for implementing Missing Middle housing, given the flexibility in property level constraints of their existing housing stock and the neighborhood characteristics of these boroughs.
As part of the City of Yes’s Housing Initiative, the City of New York announced its PLUS ONE Accessory Dwelling Unit (ADU) Program, providing construction loans to 15 eligible homeowners to build or convert secondary units on their properties. Eligibility was determined based on household income, owner occupancy, and zoning codes, which allow for two distinct typologies: basements or attic unit conversions and attached or detached garages.
Research Question
In anticipation of ADUs becoming legal in NYC, what spatial patterns might emerge between potential ADU locations and existing AirBnB properties, and how could these patterns address the gaps in the ‘Missing Middle’ in New York City’s housing spectrum?
Our project aims to identify the overlap between census tracts with licensed, non-commercial AirBnBs and the potential for Accessory Dwelling Units, based on tax lot flexibility. Once we’ve established the overlap, we determined where the conversion of short-term to long term housing would be most impactful, based on demographic variables like the non-white population, economic factors like the number of rent-burdened residents, and proximity to amenities like parks and subway stops.
Our project builds on the research of Infranca et. al, who viewed Accessory Dwelling Units through the lens of accessibility, and Cipkar et. al, who investigated Accessory Dwelling Units through the lens of feasibility. We also drew inspiration from the work of Yencha et. al. who explored Accessory Dwelling Units as a form of wealth generation
Our analysis is concerned where the transition from short term to long term housing would be most impactful, based on the present day housing conditions and the demographics across neighborhoods in Brooklyn and Queens. We are specifically interested in how different housing typologies – low, middle, high density – can influence this impact, either directly, by impacting the tax lot flexibility for ADU implementation, or indirectly, by skewing the demographics of the residents in that neighborhood.
Our method for quantifying the relative impact of ADU conversion is inherently biased because of the tradeoffs involved in weighting different variables for our MCDA. While low density neighborhoods tend to be more racially homogeneous, they also provide more flexibility for expansion on existing tax lots. Our methodology is limited by the bias in weighing these trade offs to determine the impact of ADU implementation. A methodology more concerned with ADU’s as a means of maximizing the accessibility for affordable housing would place more weight on variables like access to subway stops, parks and schools (all weighted at 6% in our analysis).
Our research on ADUs and AirBnBs leverages diverse data sources, including socioeconomic information from the U.S. Census Bureau’s 2022 records and local amenities details from the NYC Facilities database, which covers schools, healthcare facilities, and parks. We also used the MapPLUTO dataset to analyze residential density and identify potential ADU sites, and integrated data from Inside AirBnB. Given our broad geographic scope, we aggregate all data to the census tract level, a method that simplifies management of large datasets but may introduce bias by potentially oversimplifying variations within smaller geographic areas and could overgeneralize findings.
Future research might delve deeper into the wealth implications of ADU conversions for homeowners. Research questions could investigate how much wealth can the average homeowner generate annually in neighborhoods across Brooklyn and Queens? How does that compare to other wealth generating housing strategies? (i.e. short term rentals). From the policy end, how can cities tweak zoning ordinances or permit requirements to streamline and optimize ADU implementation? How can ADUs be utilized to meet New York City’s broader housing goals?
* ADUs are not Currently Legal in NYC
Our research is also highly speculative, a projection of which neighborhoods would see the most impact from the legalization of ADU’s in New York City. However, ADU implementation is up to the discretion of individual property owners, who might not find it in their best interest to convert their excess square footage into secondary units, either because of financial constraints, time constraints, or simply because they want to preserve their empty space. Therefore, the neighborhoods where ADU conversion would be most impactful aren’t necessary the neighborhoods where they will be implemented.

According to City of Yes for Housing, ADUs can be attics, basements, or garages. Given the prevailing number of garages in the outer parts of Brooklyn and Queens, we narrow our focus to this garage typology and define potential ADUs as tax lots in residential zones that contain 2 buildings and are not irregularly shaped. We further break down this definition by having three classifications of potential ADU lots
Recently, New York City has mandated that AirBnBs be registered as Class B Dwellings with the Office of Special Enforcement to control their proliferation. There are concerns that this policy may disproportionately affect independent listers, favoring commercial listers who can more easily navigate the city’s bureaucracy. Consequently, we break this down by having three classifications of AirBnBs
1. Lots that can accommodate 400 SqFt of additional residential FAR. (Floor Area Ratio)
2. Lots that can accommodate 600 SqFt of additional residential FAR.
3. Lots that accommodate 800 SqFt* of additional residential FAR.
* (the maximum footprint that New York City allows for ADUs)
1. All listed AirBnBs
2. AirBnBs that are registered with the Office of Special Enforcement
3. AirBnBs that are registered with the Office of Special Enforcement and are operated by a host with only (1) listing

Choropleth
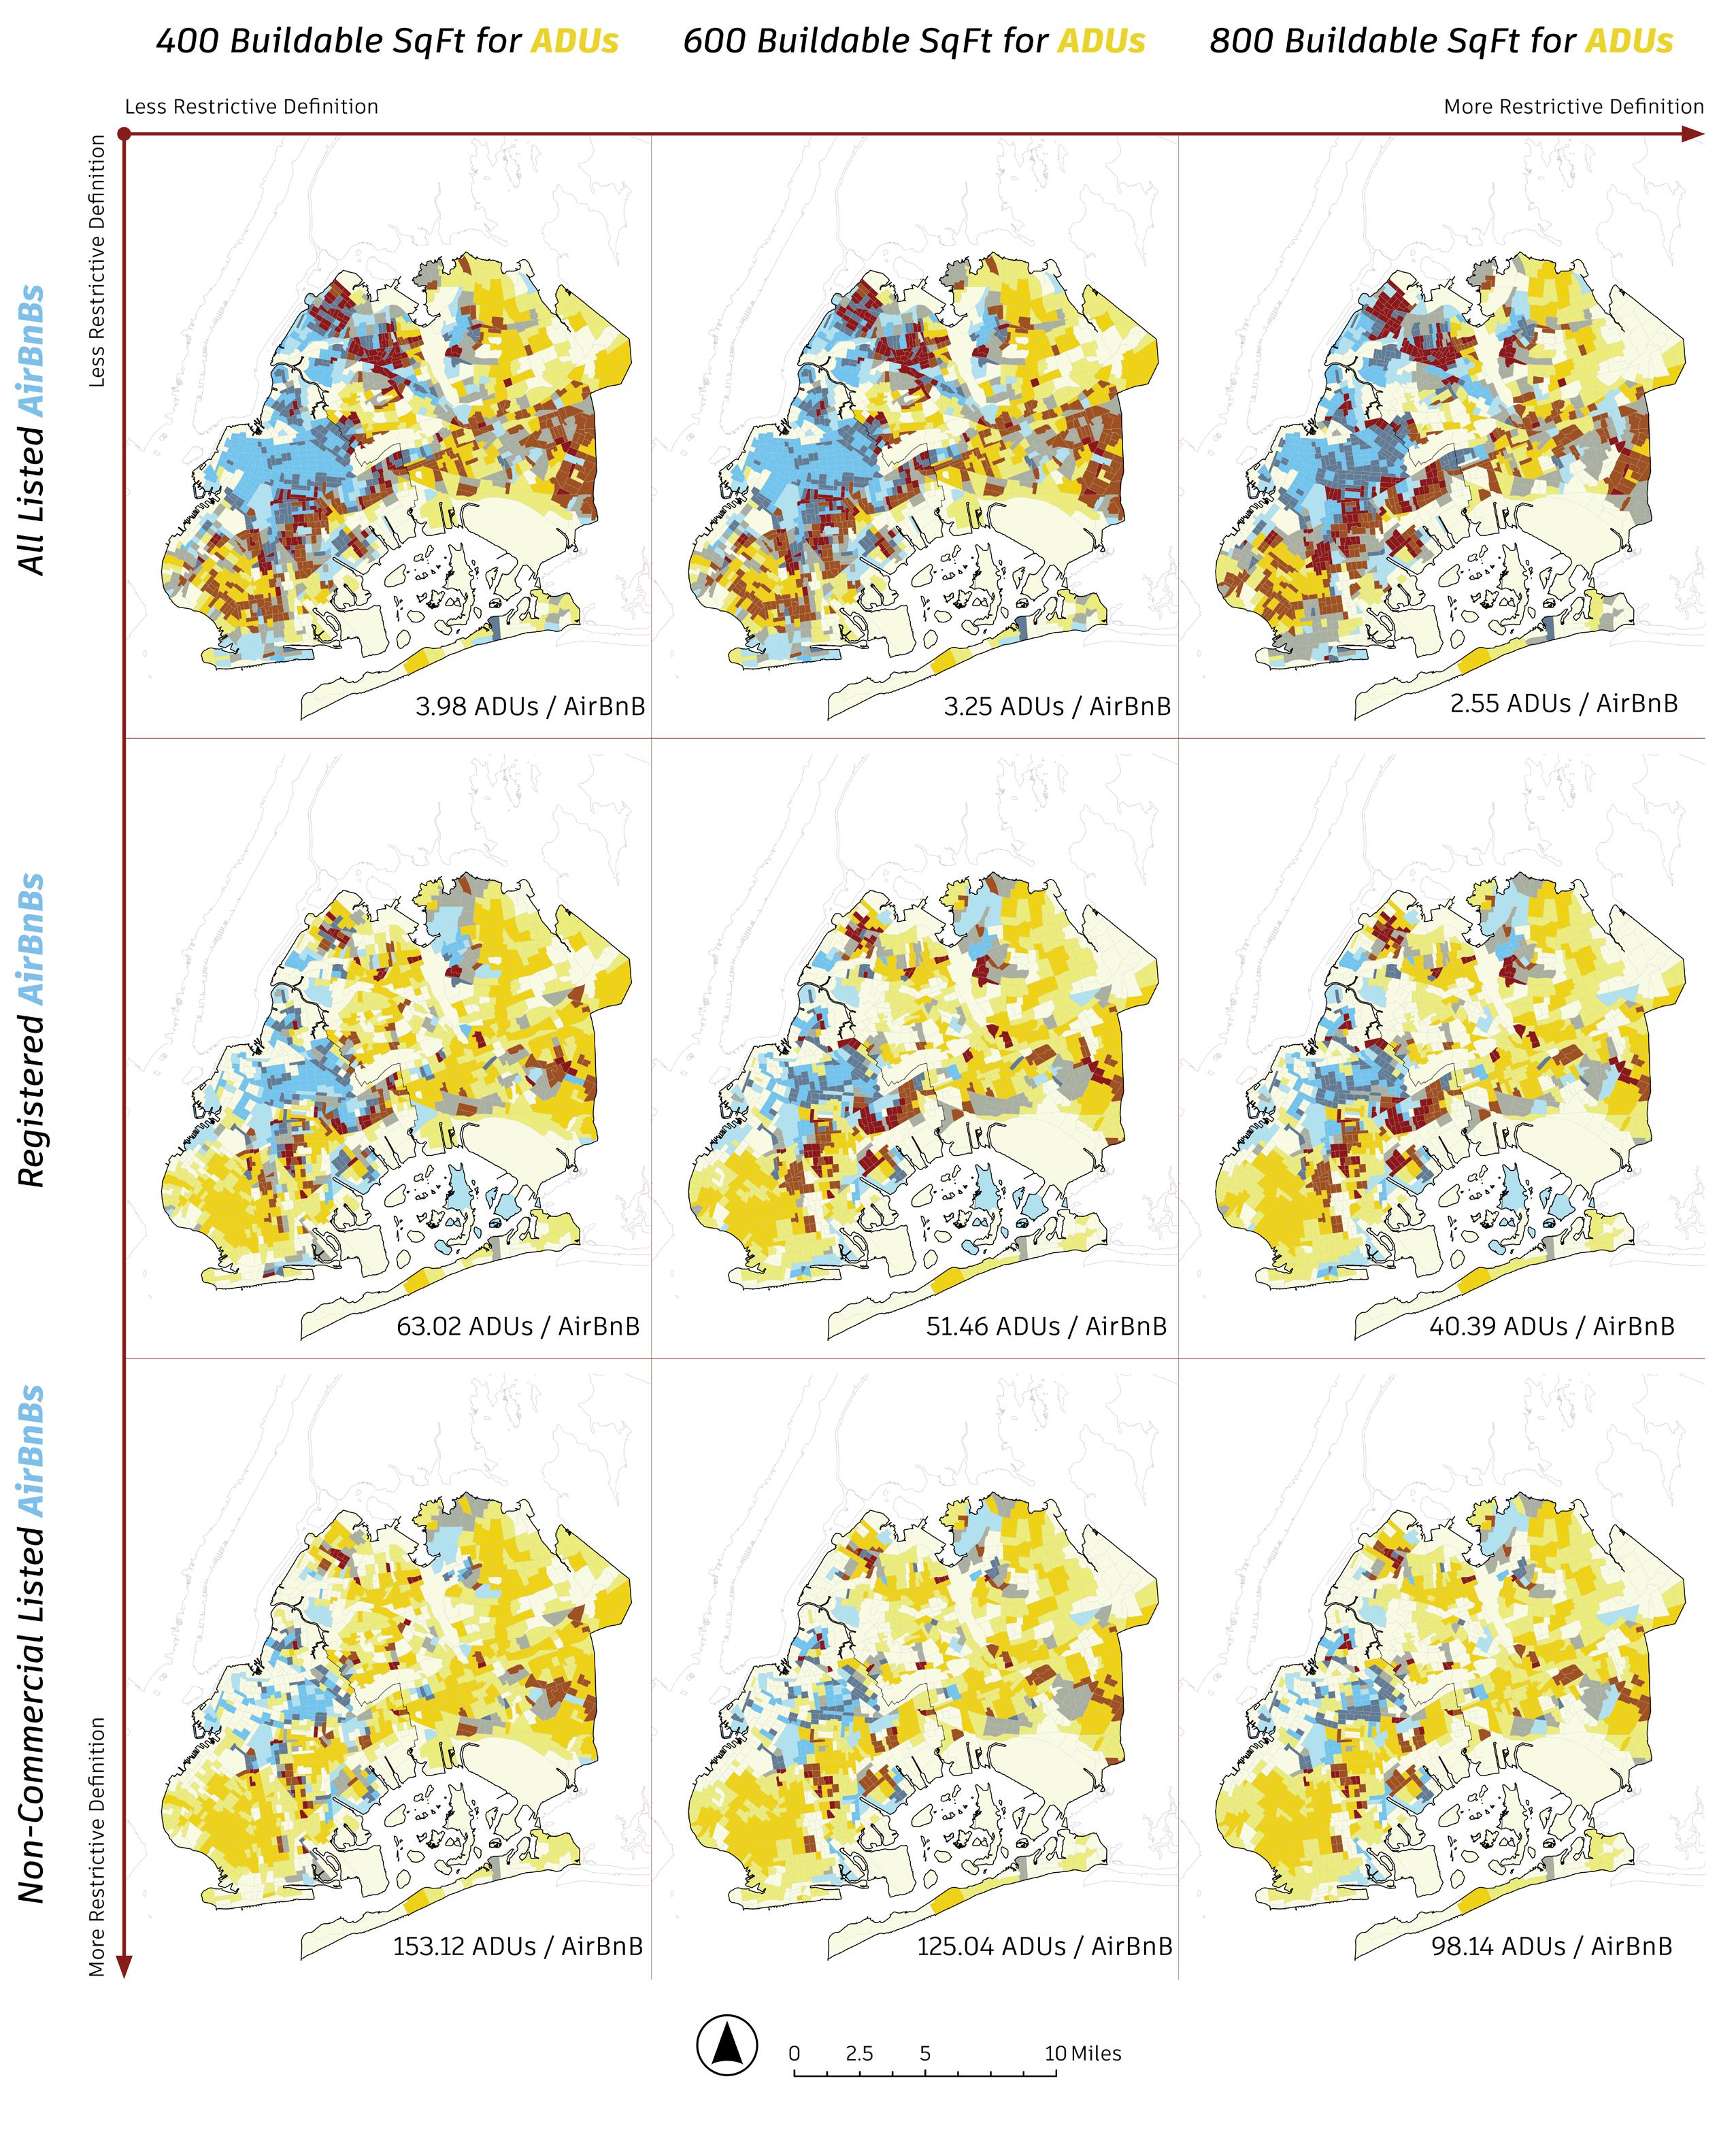
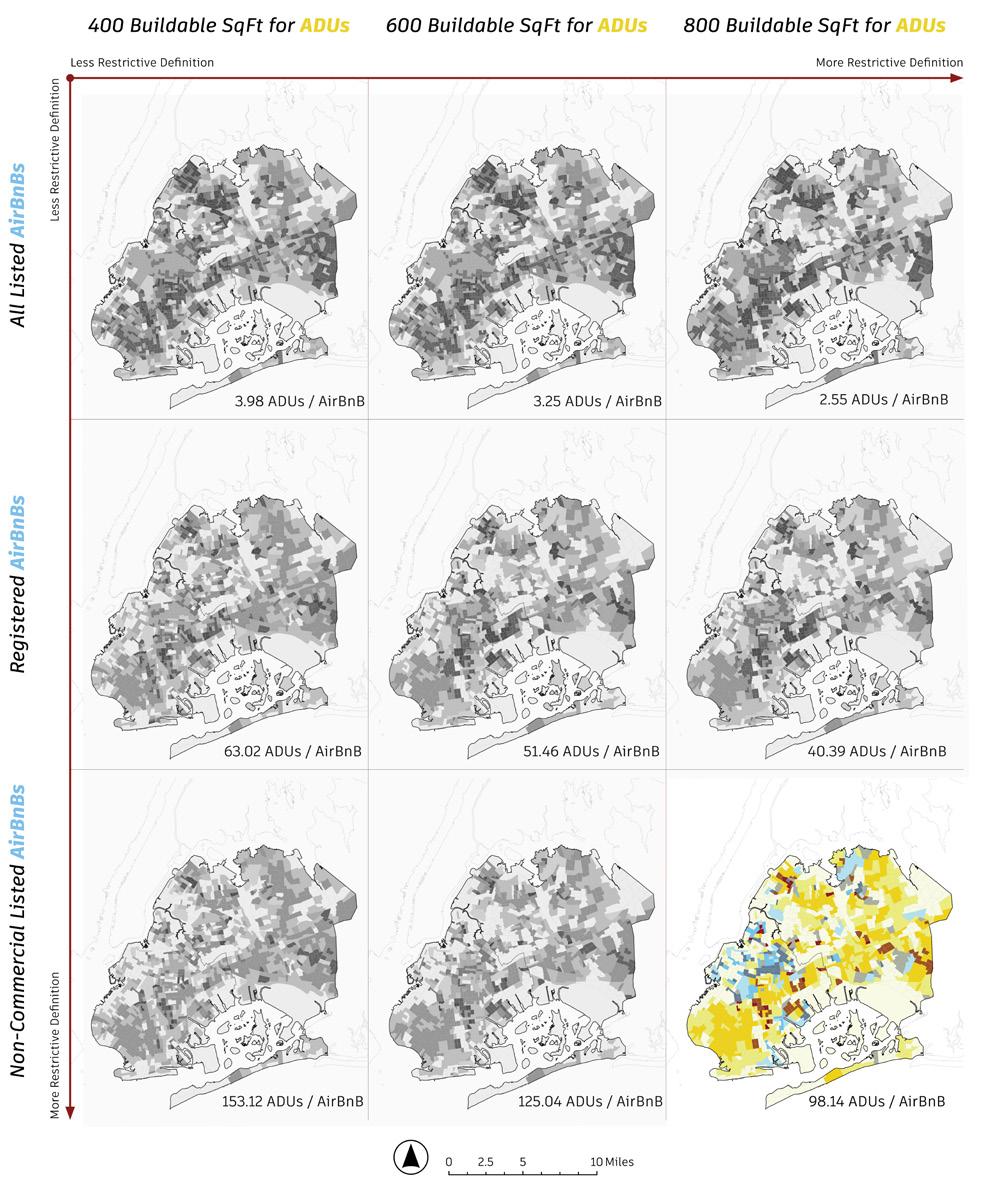
We started by analyzing the spatial relationships between short term rentals and potential lots suitable for Accessory Dwelling Units. Both were broken down into three separate categories, gradually increasing in exclusivity. With AirBnBs, for example, we began by analyzing the total number of listings provided by the Inside AirBnB platform. Given the regulations imposed by LL97, we isolated the number of licensed listings as a separate, more exclusive category. From there, we narrowed the scope even further, isolating licensed AirBnBs that were “non-commercial,” meaning they were listed by an independent household. With potential ADUs, exclusivity was contingent on remaining residential square footage (400,600, and 800 sqft.).
The next step in our analysis was assessing the existing housing typologies of neighborhoods in Brooklyn and Queens. In doing so, we needed to determine which MapPluto fields would be most relevant to our analysis. We decided on the number of residential units and the residential Floor Area Ratio (FAR). We used the city’s definition of low, middle, and high density housing as a reference, with middle density housing classified as R5 through R7, corresponding to an FAR Range of 1.25 through 3.44. Based on previous literature in operationalizing the Missing Middle (Frederick 2022), we determined that the number of residential units should fall between 4 and 12; those that fell short of this threshold would be considered low density lots, and those above this range would be labeled as high density.
Tracts where a transition may be possible!
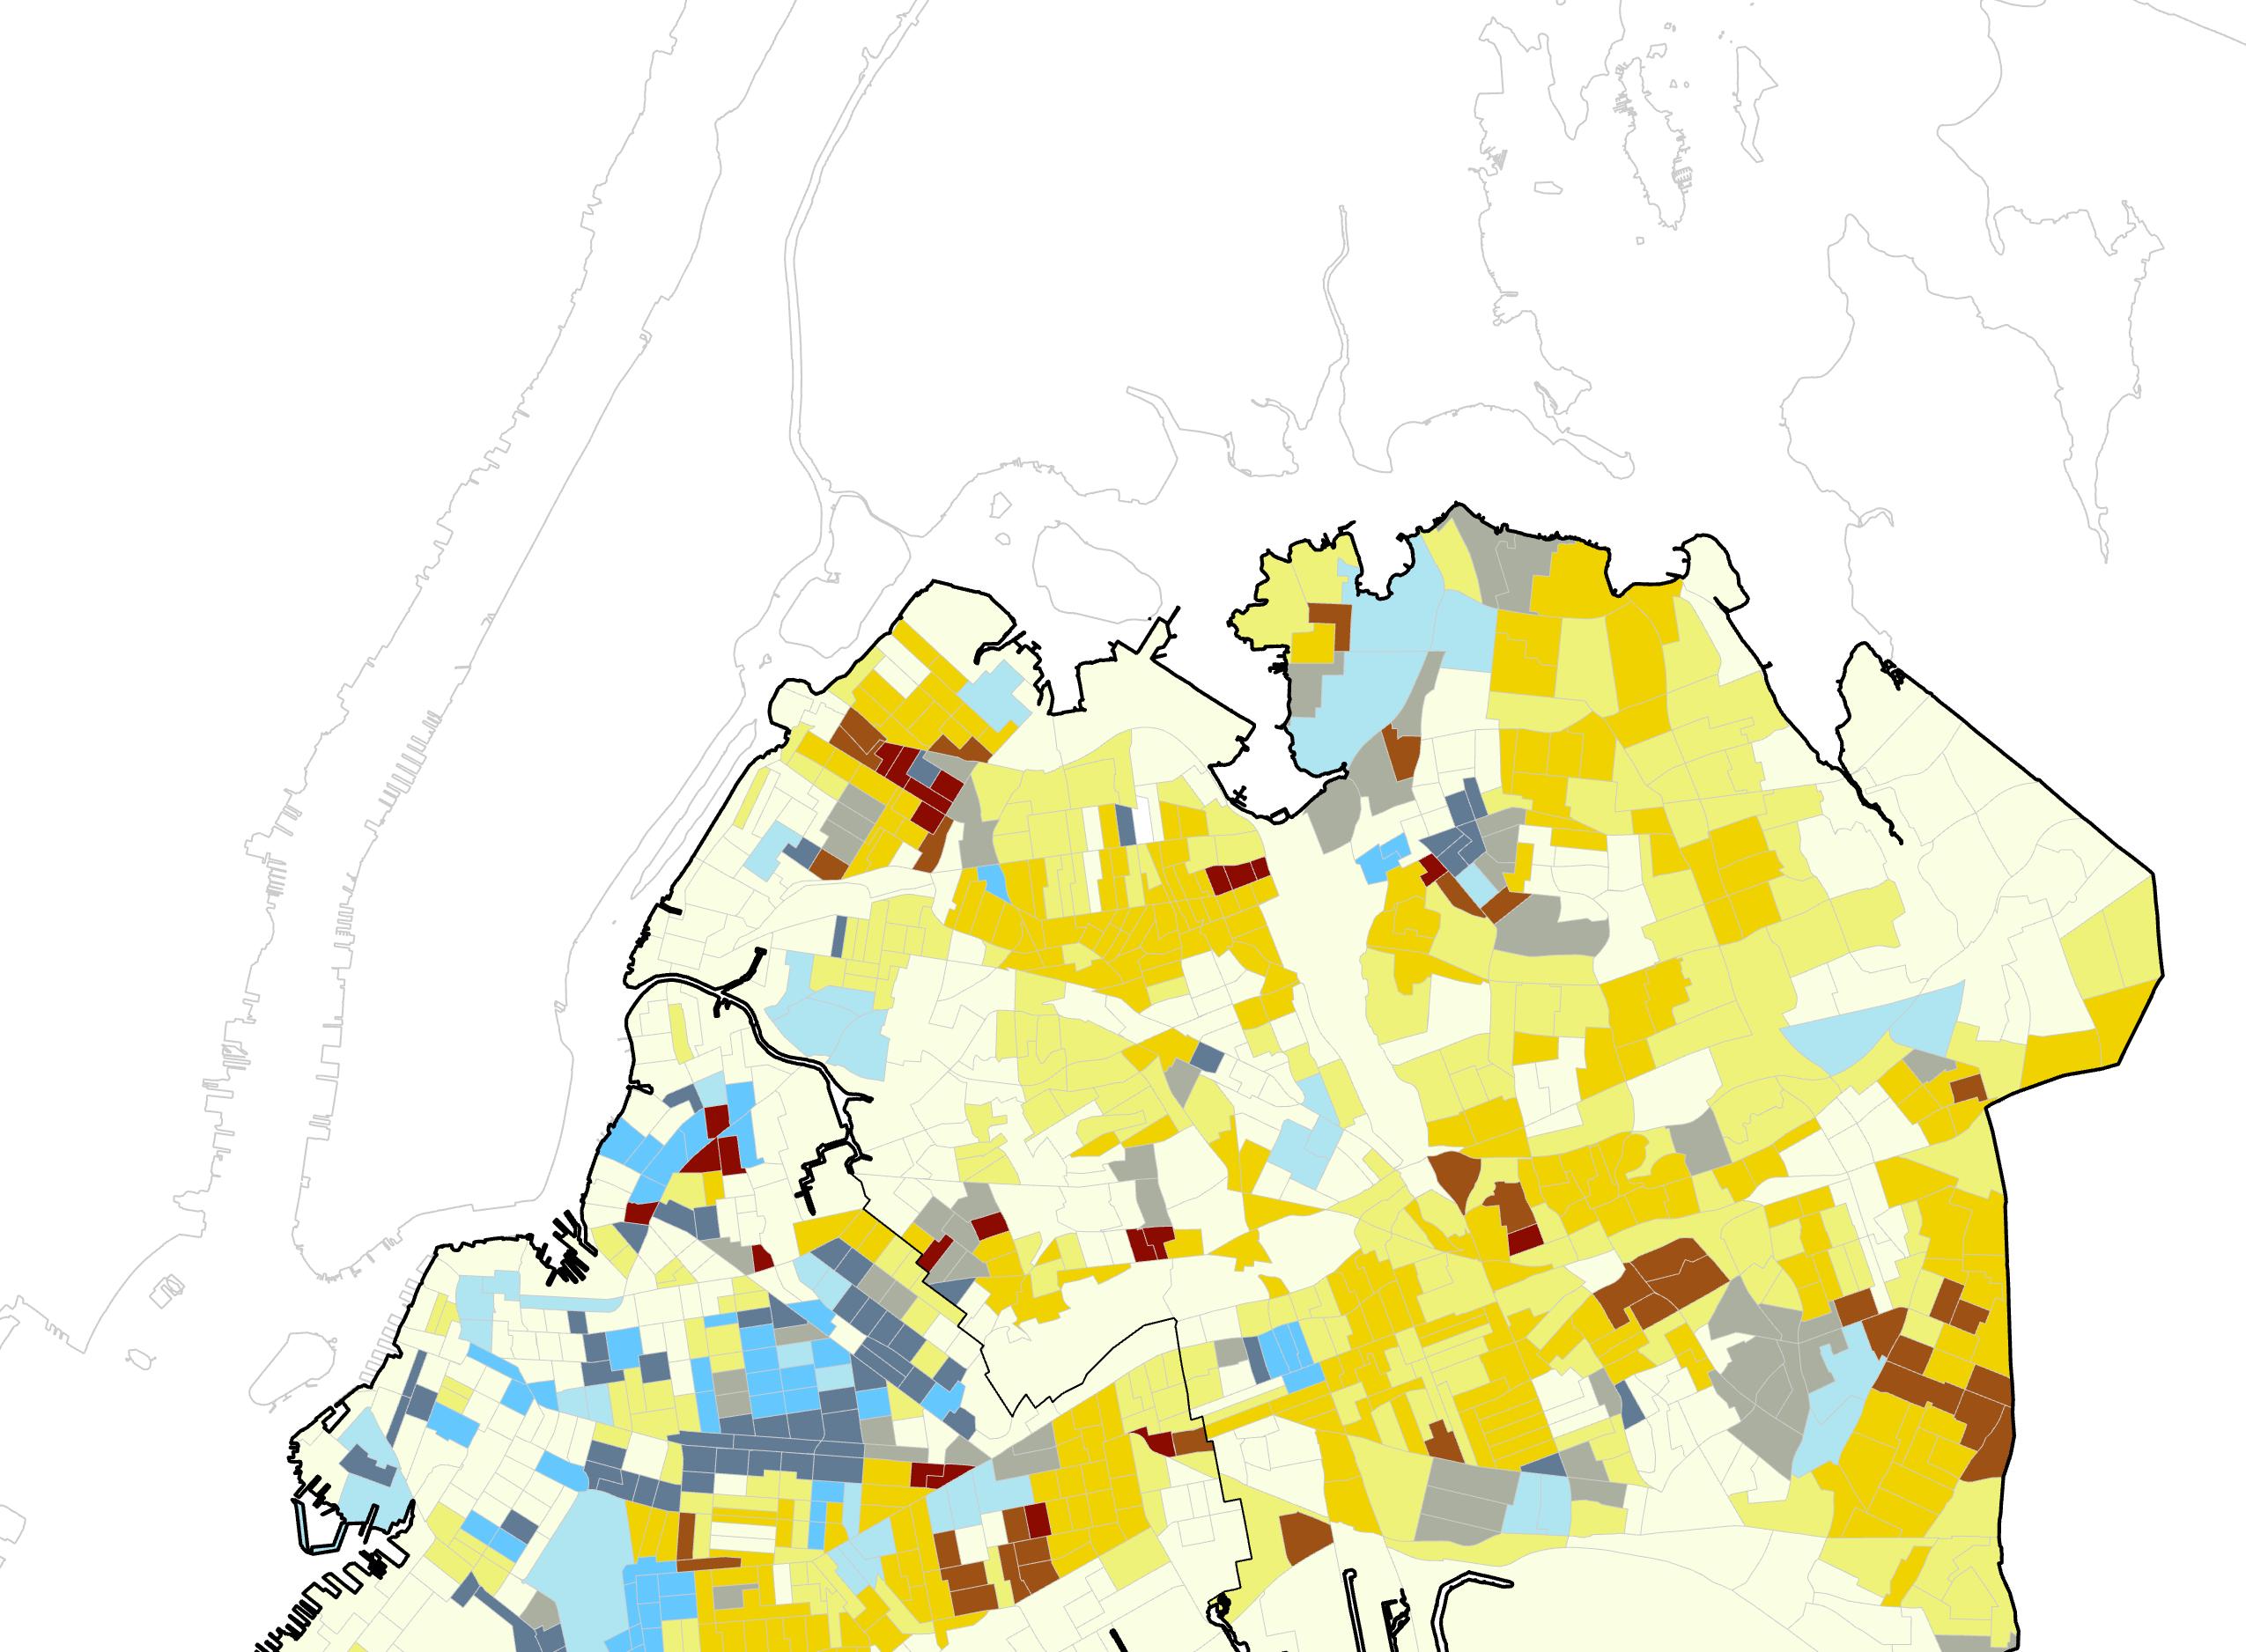
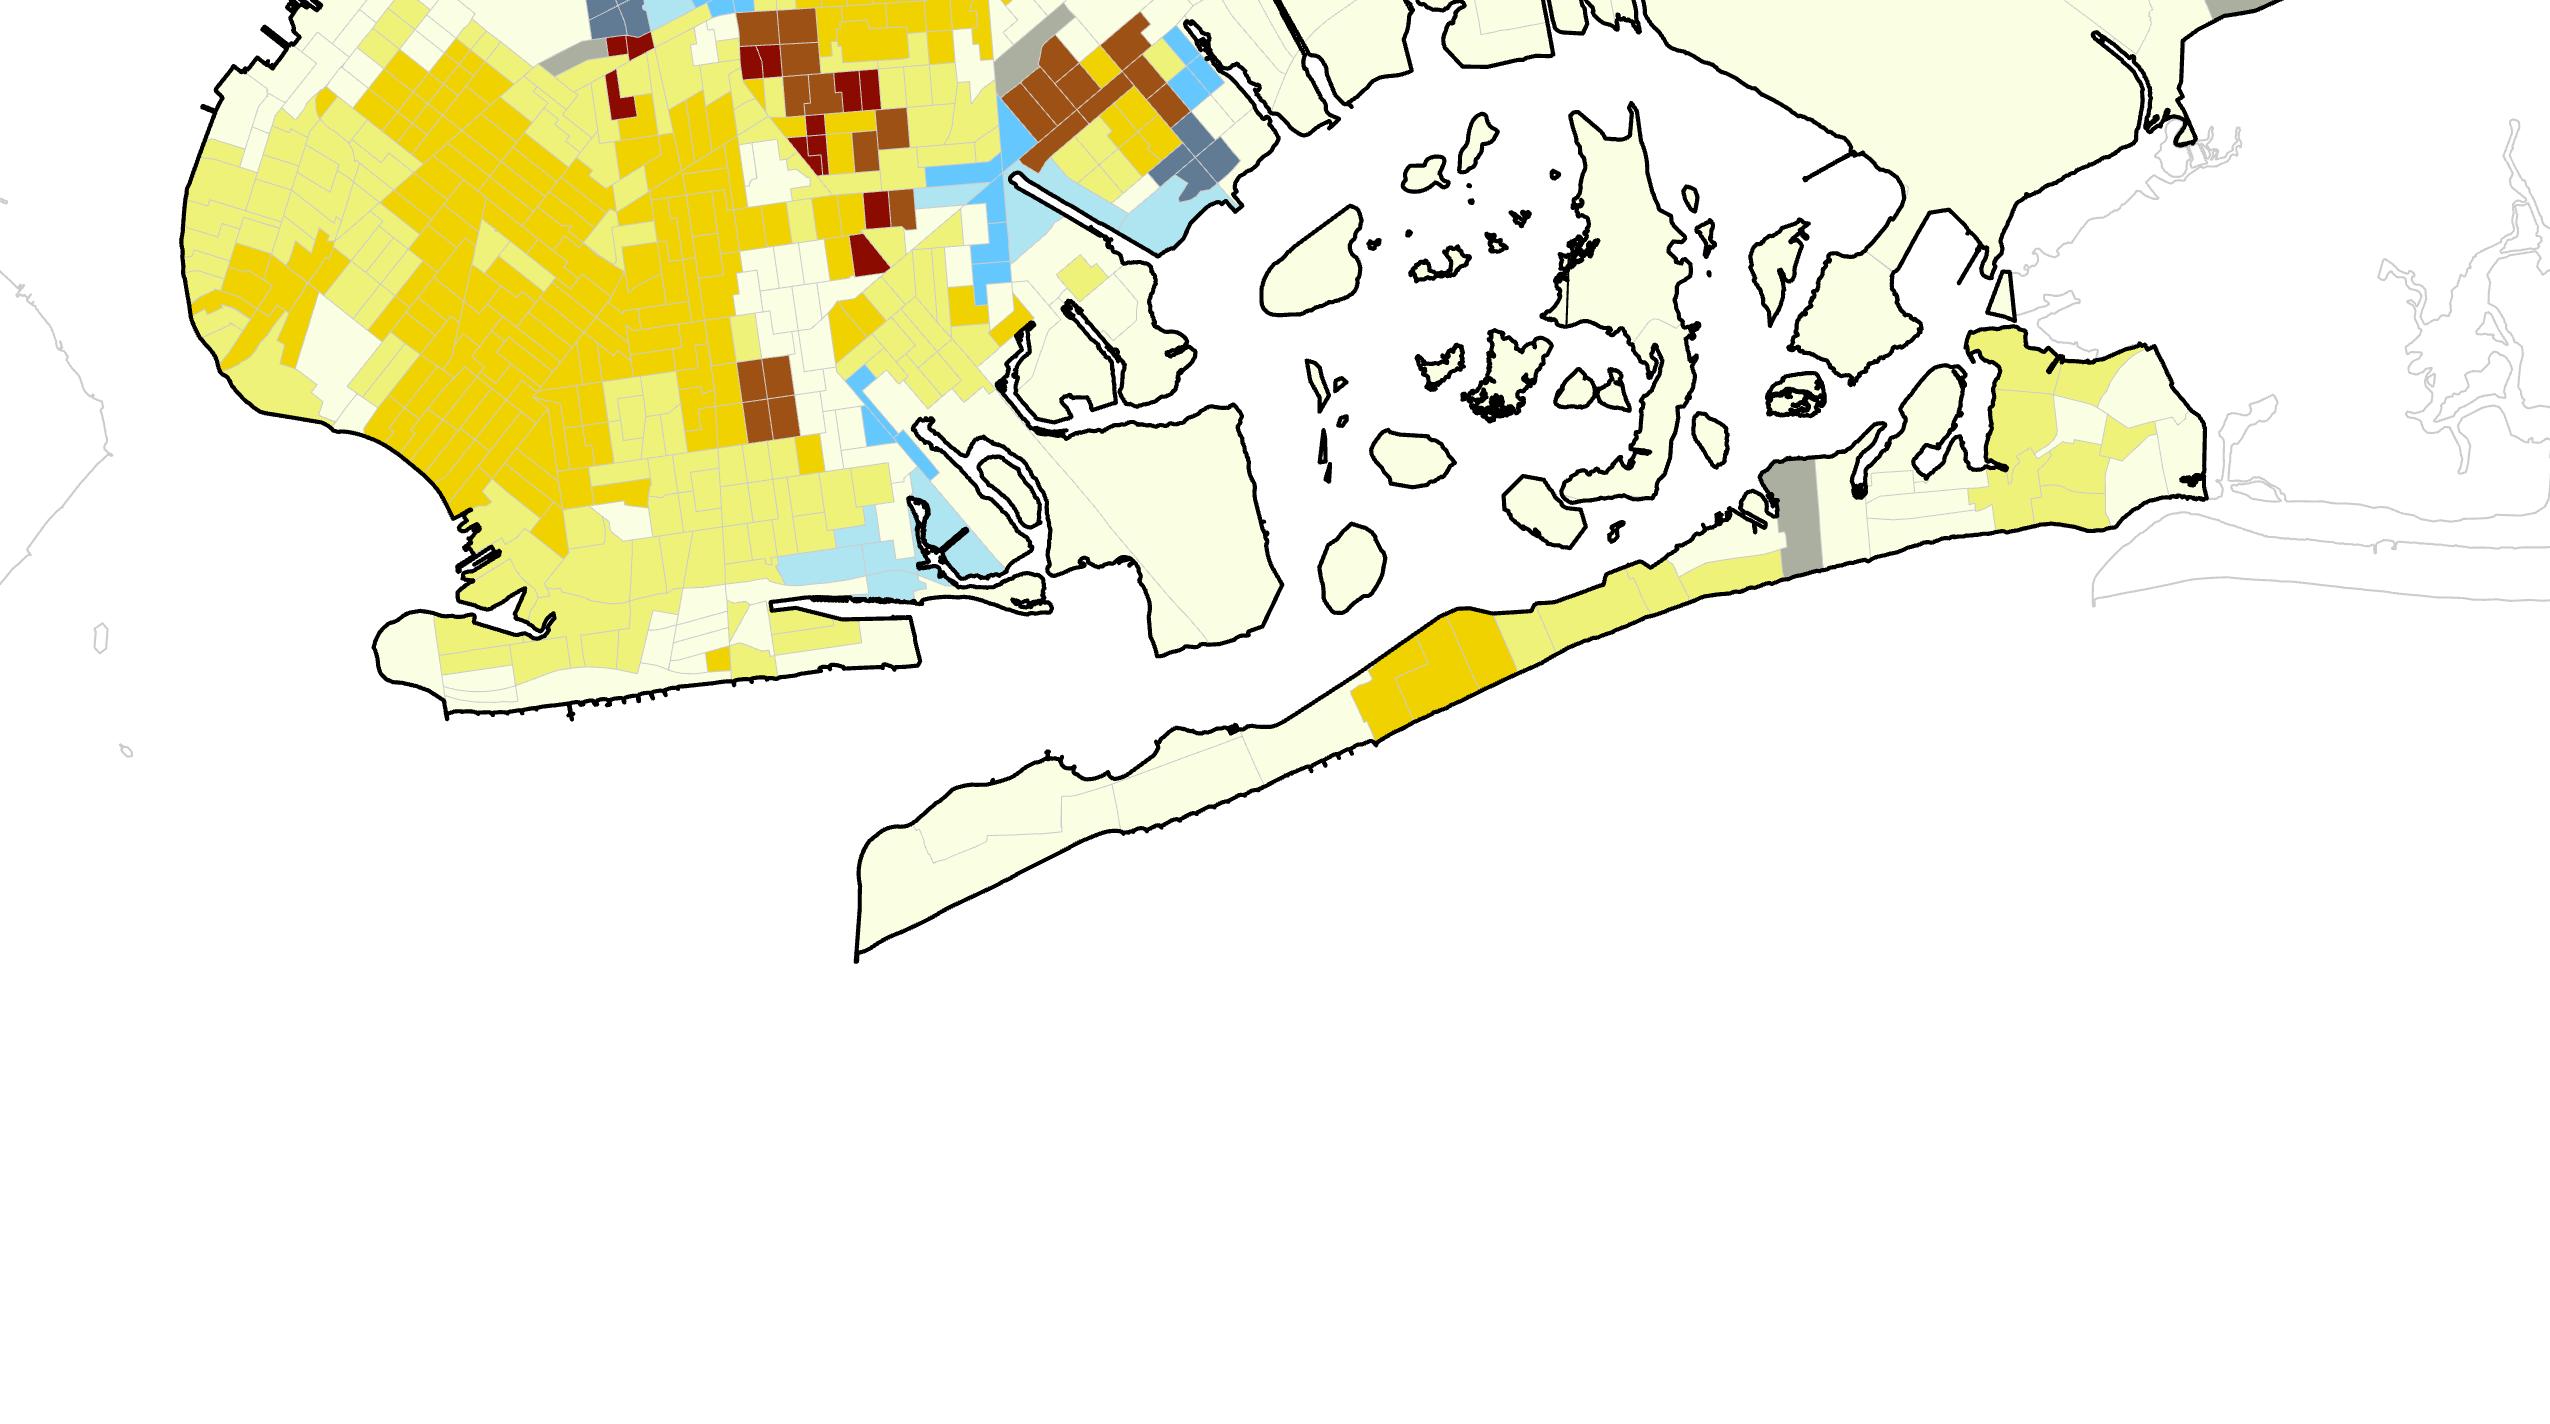
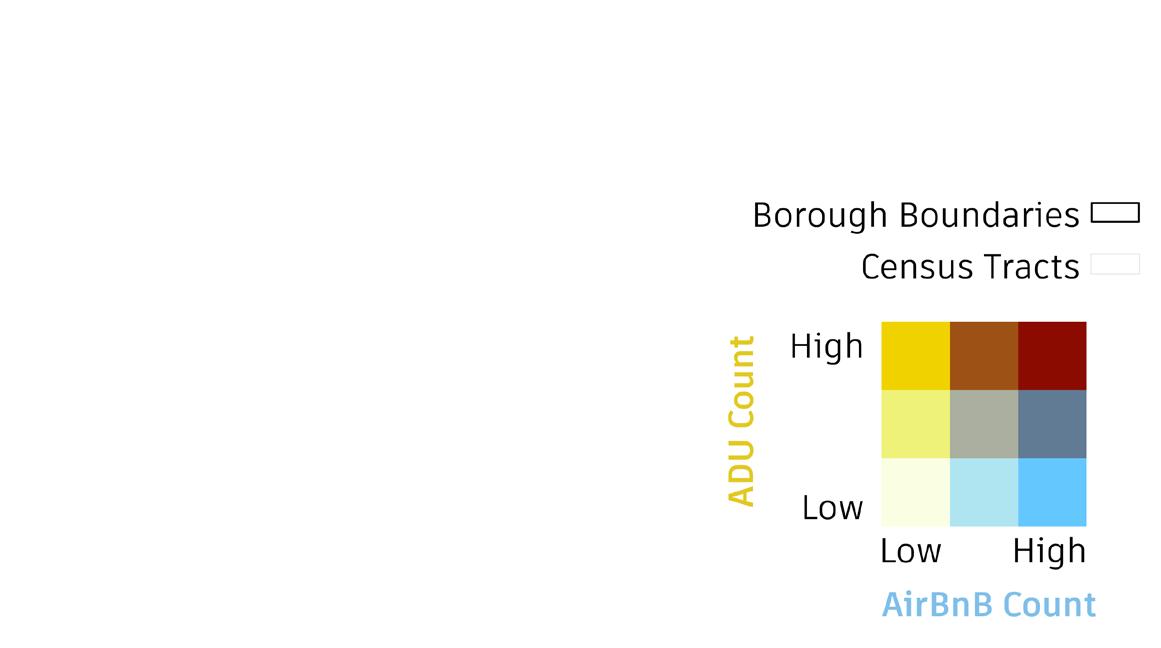
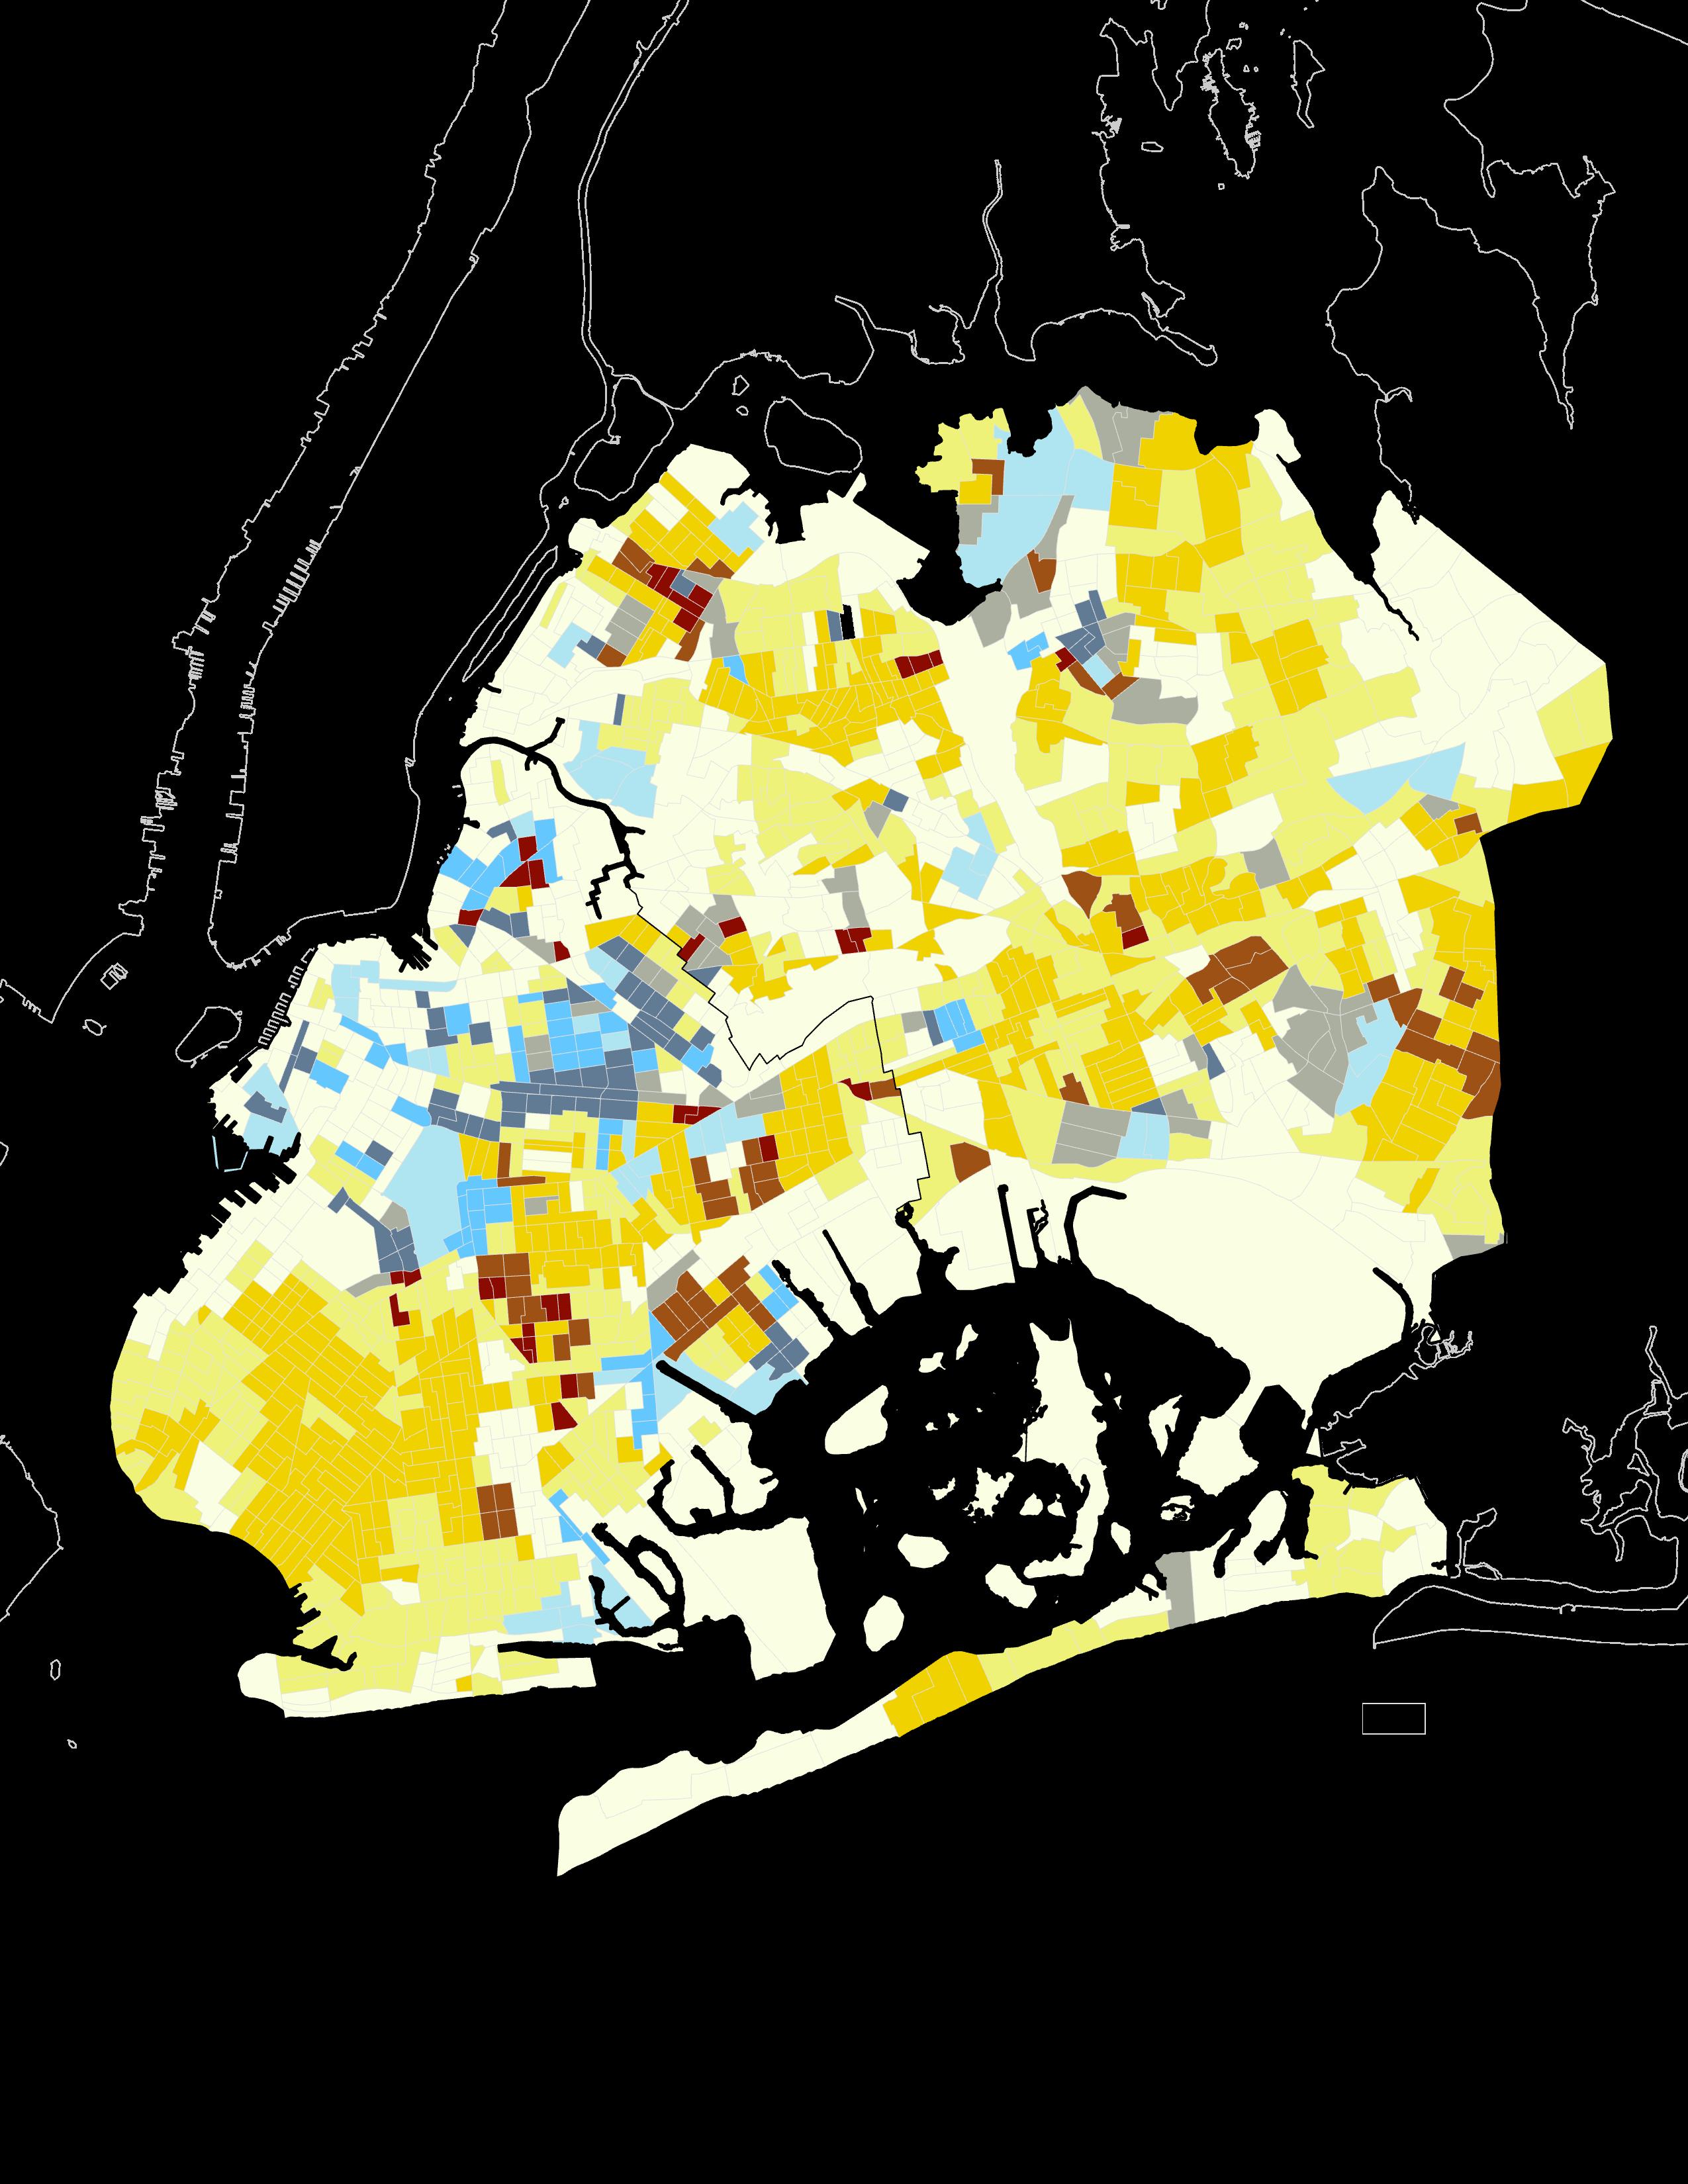
Once we established our three distinct classifications for AirBnBs and ADUs, we normalized the counts by the square mileage of the census tracts to which they were aggregated. Following this, we created a matrix (see page 9) to assess the spatial relationships between these classifications. For the purposes of our research, we are most interested in the census tracts classified in the brown quantile, meaning there is a high density of both ADUs and AirBnBs (with respect to their classifications).
Once each lot was assigned a classification, we aggregated the number of lots in each category by census tract. To determine the relative proportion of each density, we divided the number of lots within each category by the total number of residential lots in that census tract. This allowed us to make comparisons between the relative housing typologies across census tracts.
In defining the neighborhood impact of implementing ADUs, we conducted a Multi-Criteria Decision Analysis, a weighted overlay of distinct raster layers. While we incorporated the findings from the Bivariate Choropleth, the most significant variables in our analysis were socioeconomic factors, like the percentage of rent burdened households, the population density, and the nonwhite percentage. This allowed us to synthesize the many factors that affect the viability of long-term housing.
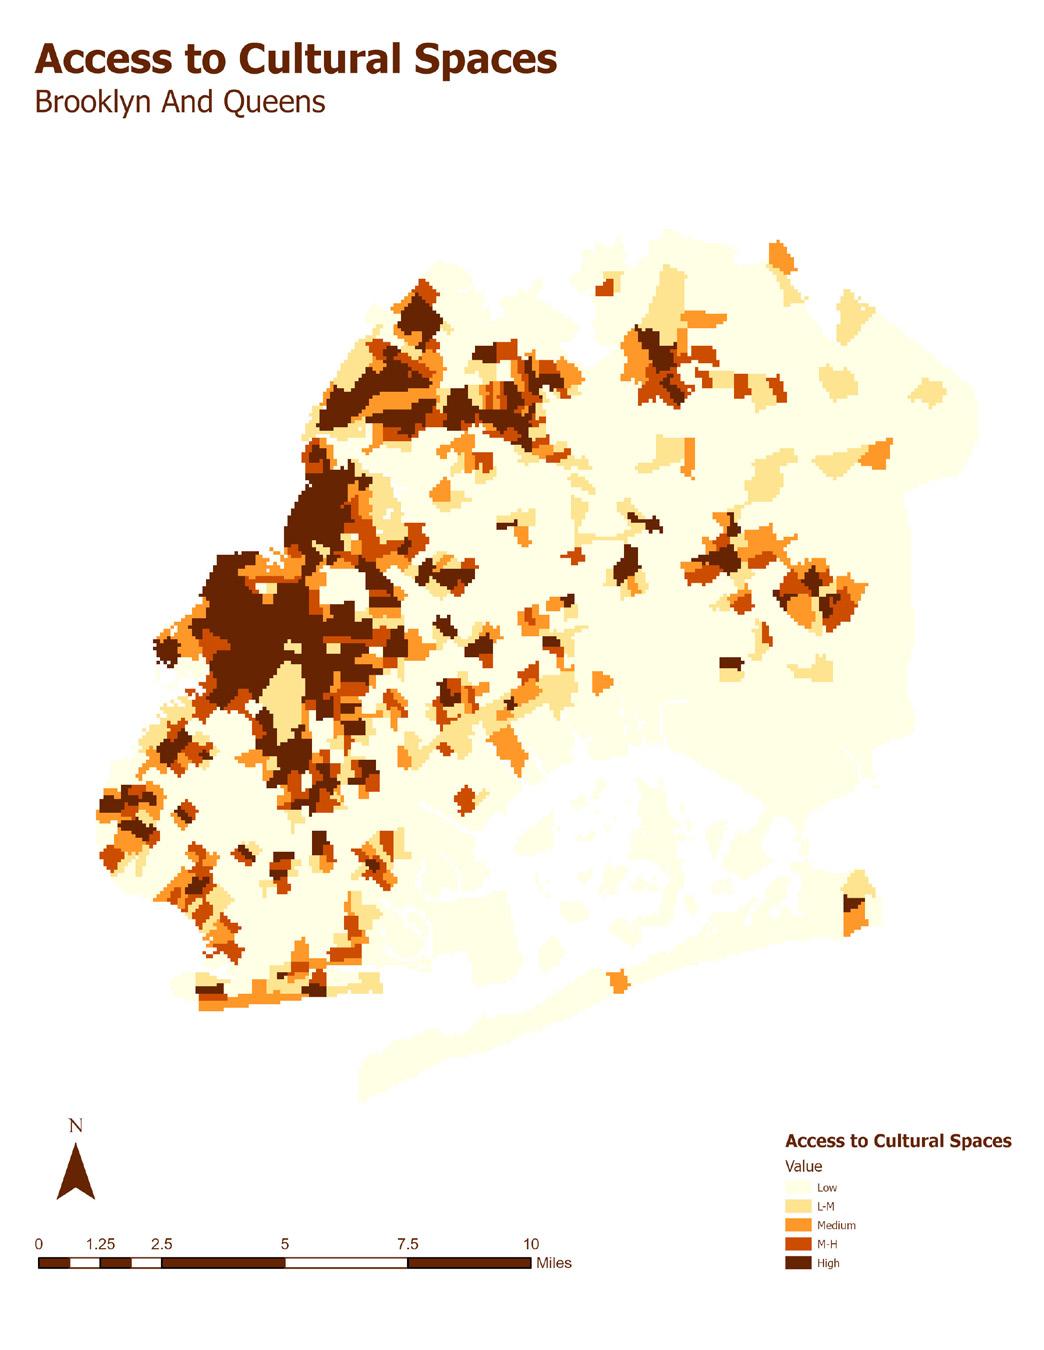
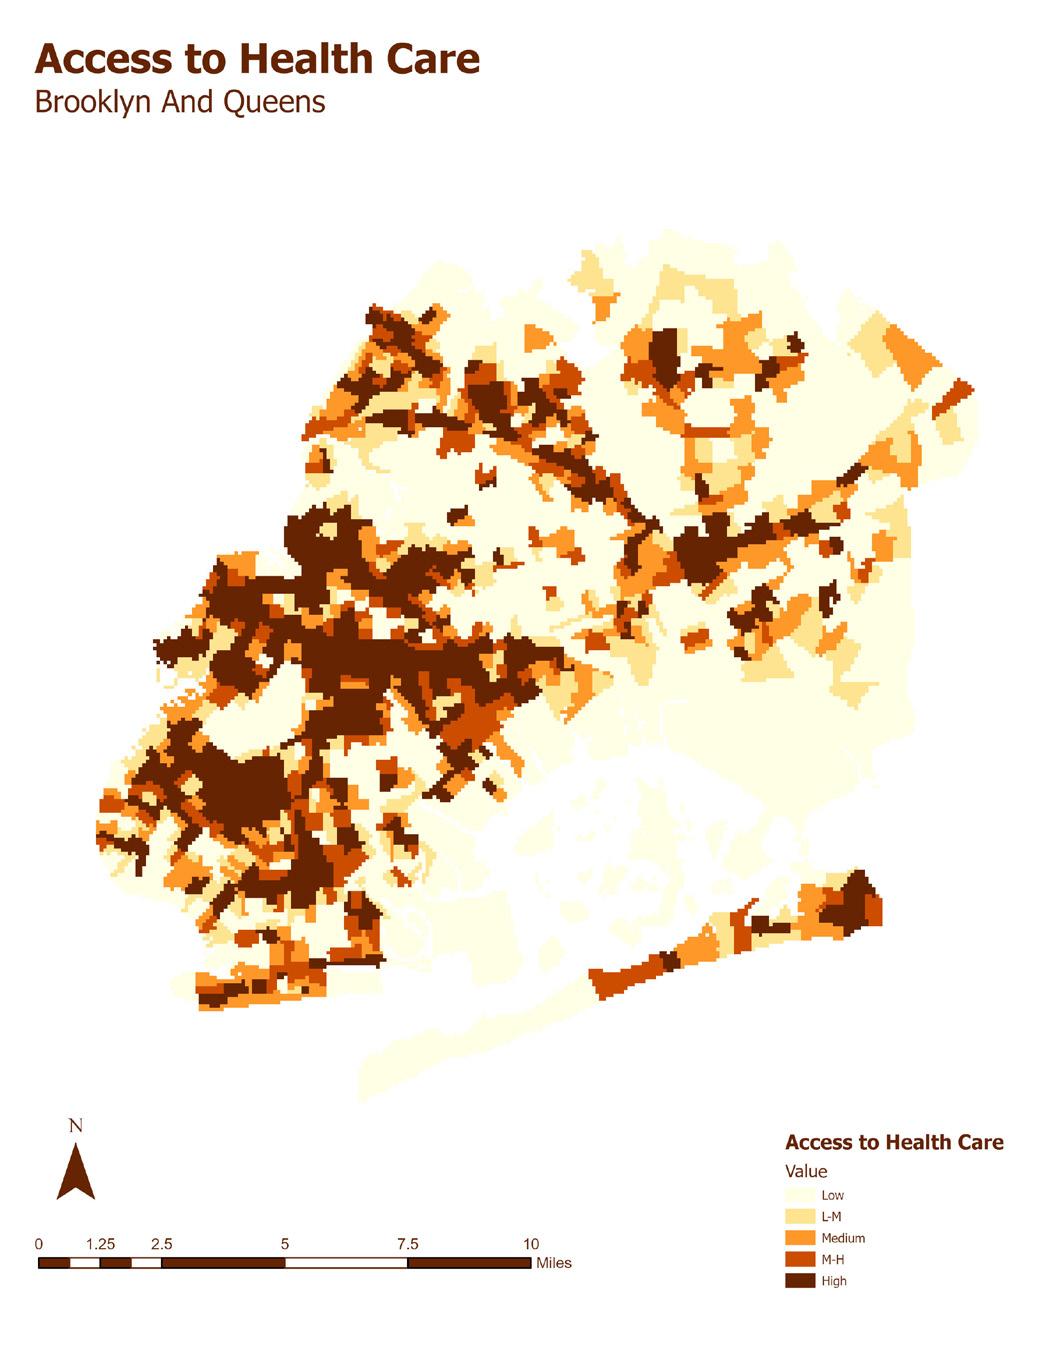
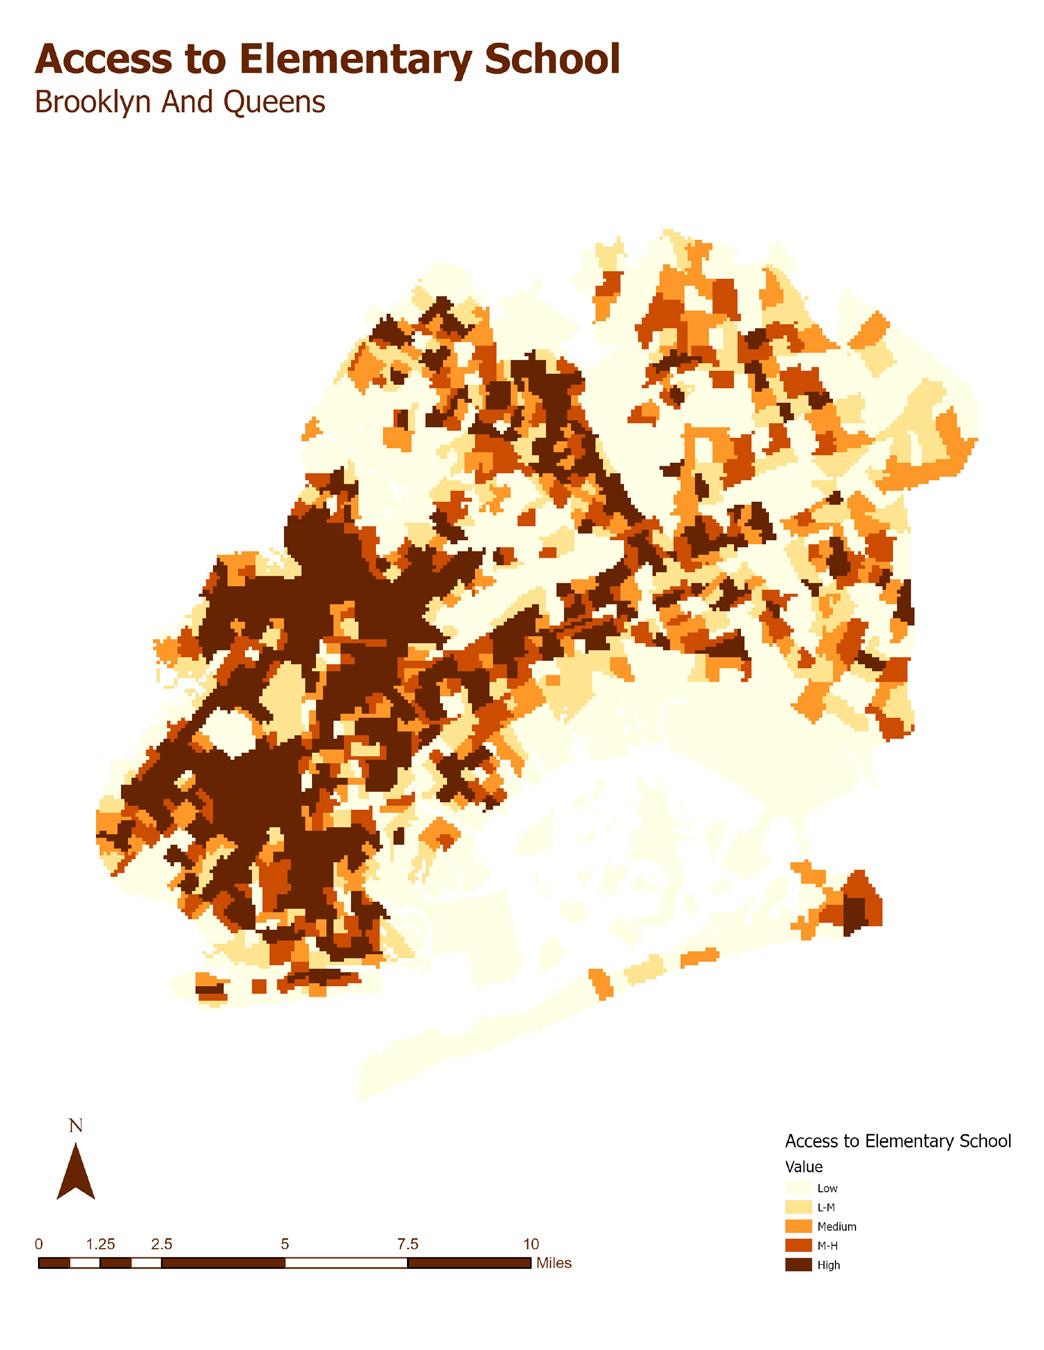
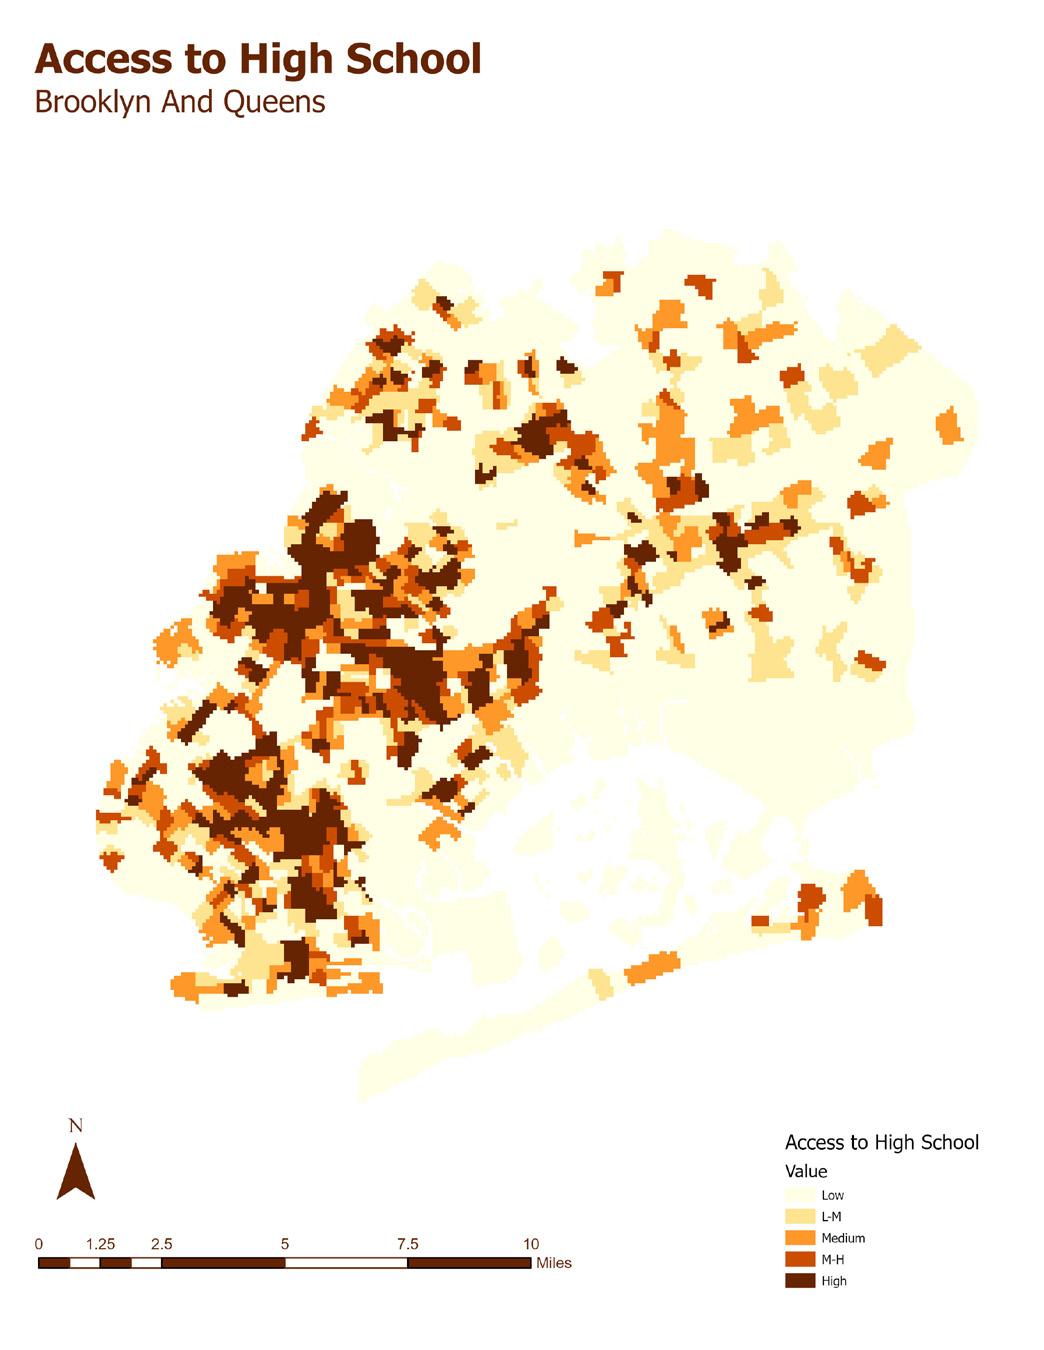
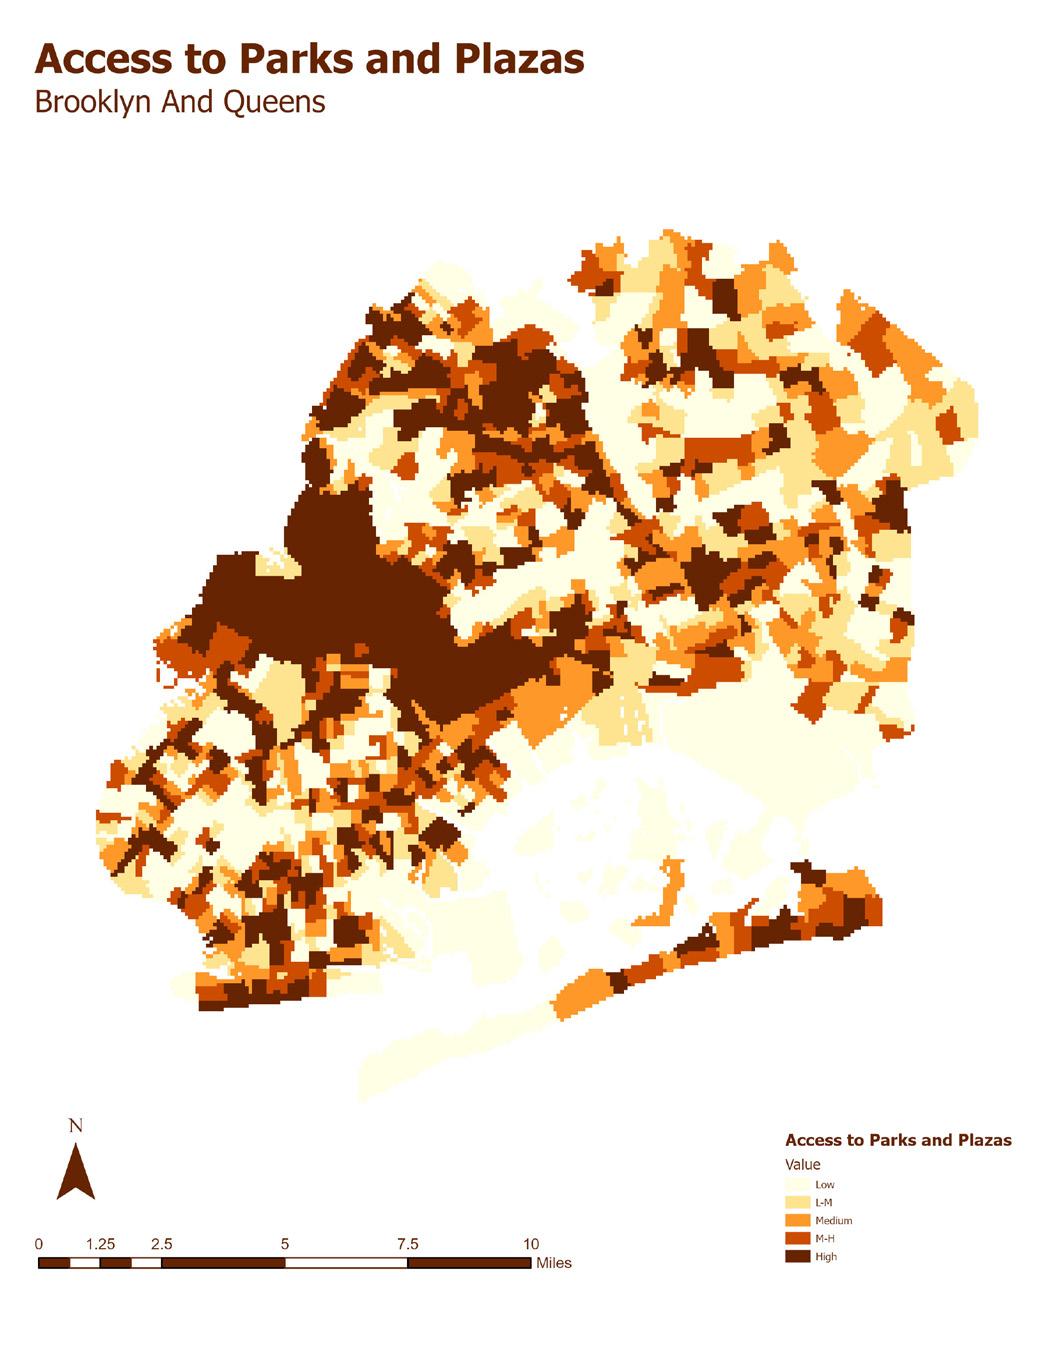
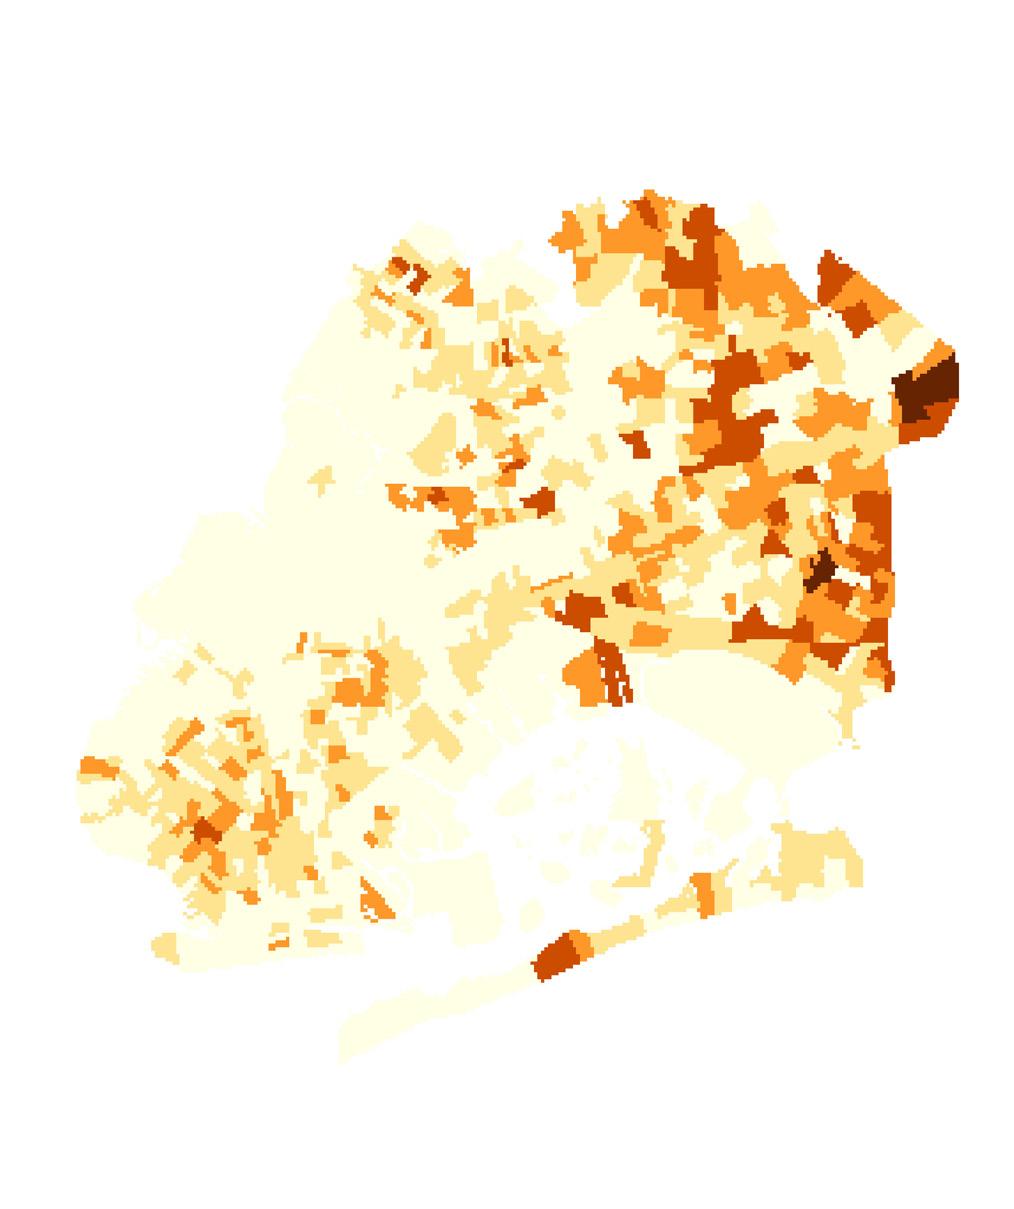
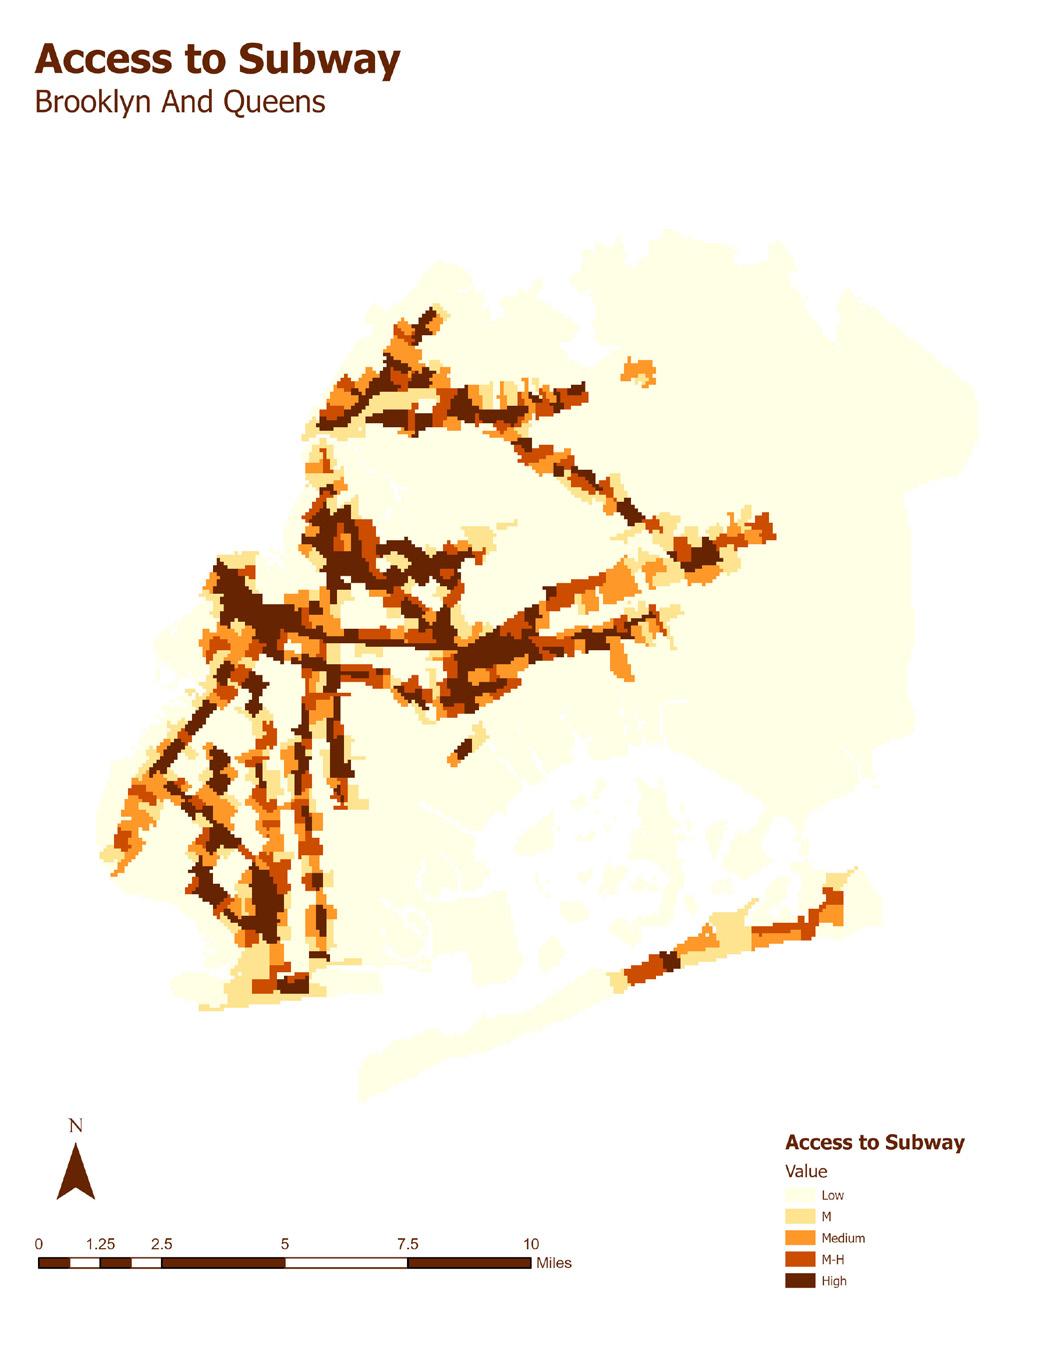
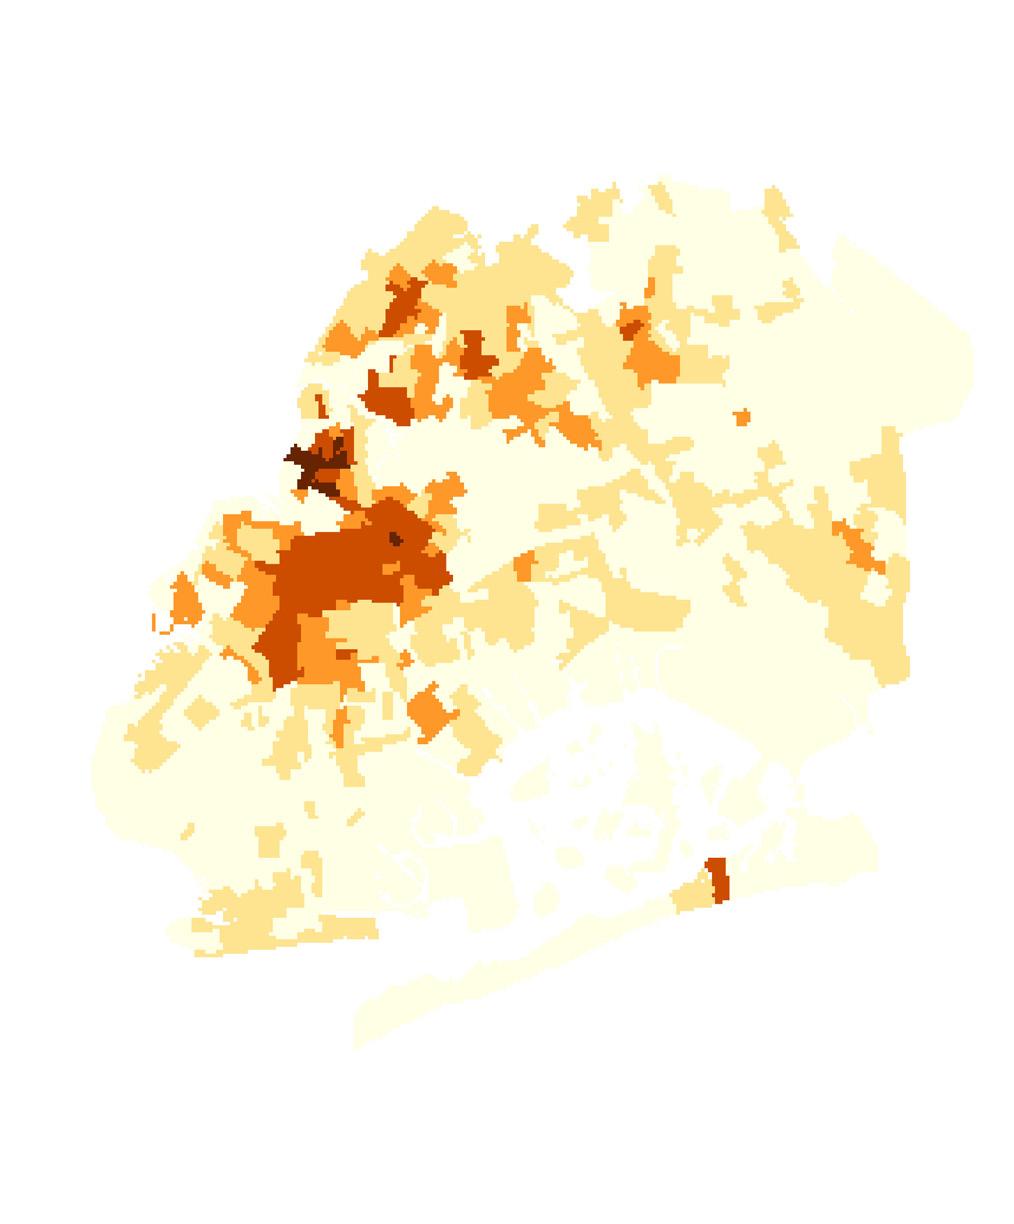
For our access layers – access to schools, parks, and public transit – we created a walkshed buffer around each amenity, and calculated the proportion of each census tract that was served by that amenity. By calculating the geometry of each census tract – with respect to our walkshed buffers – we were able to develop an accessibility index that estimates the percentage of households that were served by a particular amenity. This index was integrated into the MCDA.
Geographic Weighted Regression
Geographic Weighted Regression (GWR) is an extension of Ordinary Least Squares that allows us to measure the correlation between explanatory and dependent variables based on locality. The tool conducts a regression for each individual feature, incorporating the target features that fall within the bandwidth of the target location. In determining our bandwidth, we selected the “Number of Neighbors” parameter using the golden search method. This allows the neighborhood size – the search radius –to vary based on the density of points within that area. This was optimal for the purpose of our study because of the variation in the size of the census tracts.
When applying GWR to our analysis, we are comparing the Census Tract Impact Score from our Multi-Criteria Decision Analysis to the percentage of each Census Tract that is Low Density, Middle Density, and High Density, respectively, in an effort to understand where ADU conversions/implementations will be most impactful. Moving beyond our findings from the MCDA, the GWR allowed us to determine whether Missing Middle housing was inherently more suitable for ADU conversions. By incorporating housing typology into our analysis, we could determine whether housing density has a statistically significant correlation with the impact of ADUs. In other words, are ADUs more conducive for middle density housing, argued to be more flexible and less rigid than single family homes.

After creating a bivariate classification matrix examining the 3 ADU and AirBnB classifications, we focused on the relationship between ADU Classification 3 - lots that can accommodate 800 SqFT of additional residential FAR (the maximum footprint that New York City allows for ADUs) and AirBnB Classification 3 - AirBnBs that are registered with the Office of Special Enforcement and are operated by a host with only 1 listing.
We focused on this specific relationship because based on our research, these classifications are most honed in on typical property owners, and our research is focused on how these two typology of housing are linked by wealth generation. By narrowing down our ADU classification to only lots that accommodate the maximum footprint, we are isolating lots that provide the most return on investment for property owners who are considering constructing an ADU. Additionally, by narrowing down our AirBnB classification to only registered AirBnBs that are operated by a host with only 1 listing, we eliminating AirBnBs that are run by large developers and instead focusing on typical property owners.
High Density of Potential ADUs and AirBnBs in Astoria
High Density of AirBnBs in Bedford-Stuyvesant
High Density of Potential ADUs and AirBnBs in Flatbush
High Density of Potential ADUs in Bensonhust
As mentioned on page 10, we are most interested in census tracts that are classified with the brown quantile, as this indicates that there is a high density of both ADUs and AirBnBs. From this, we observed that neighborhoods such as Flatbush, Astoria, Brownsville, Jamaica, Cambria Gardens, Flushing, and more all had high densities of both potential ADUs and AirBnBs. Neighborhoods such as Bedford-Stuyvesant, or others closer in proximity to airports such as Jamaica, or Whitestone, had higher densities of AirBnBs. Meanwhile, many neighborhoods on the periphery of boroughs, such as Bensonhurst had large clusters of ADU Density - perhaps explainable by the popular semi-detached building typology that often includes garages in the backyards.
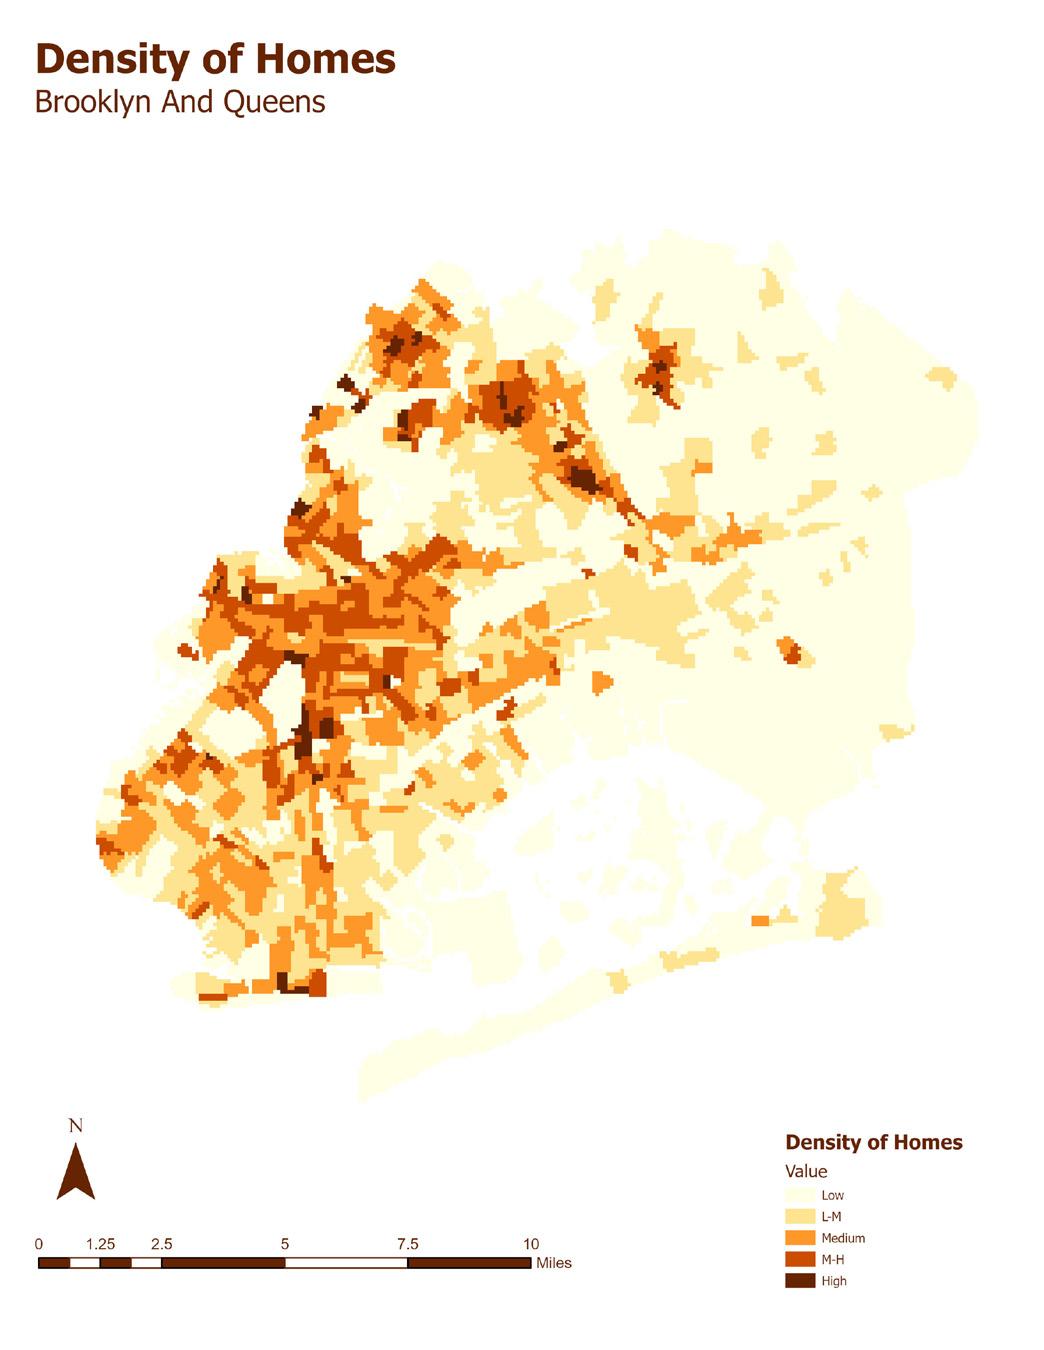
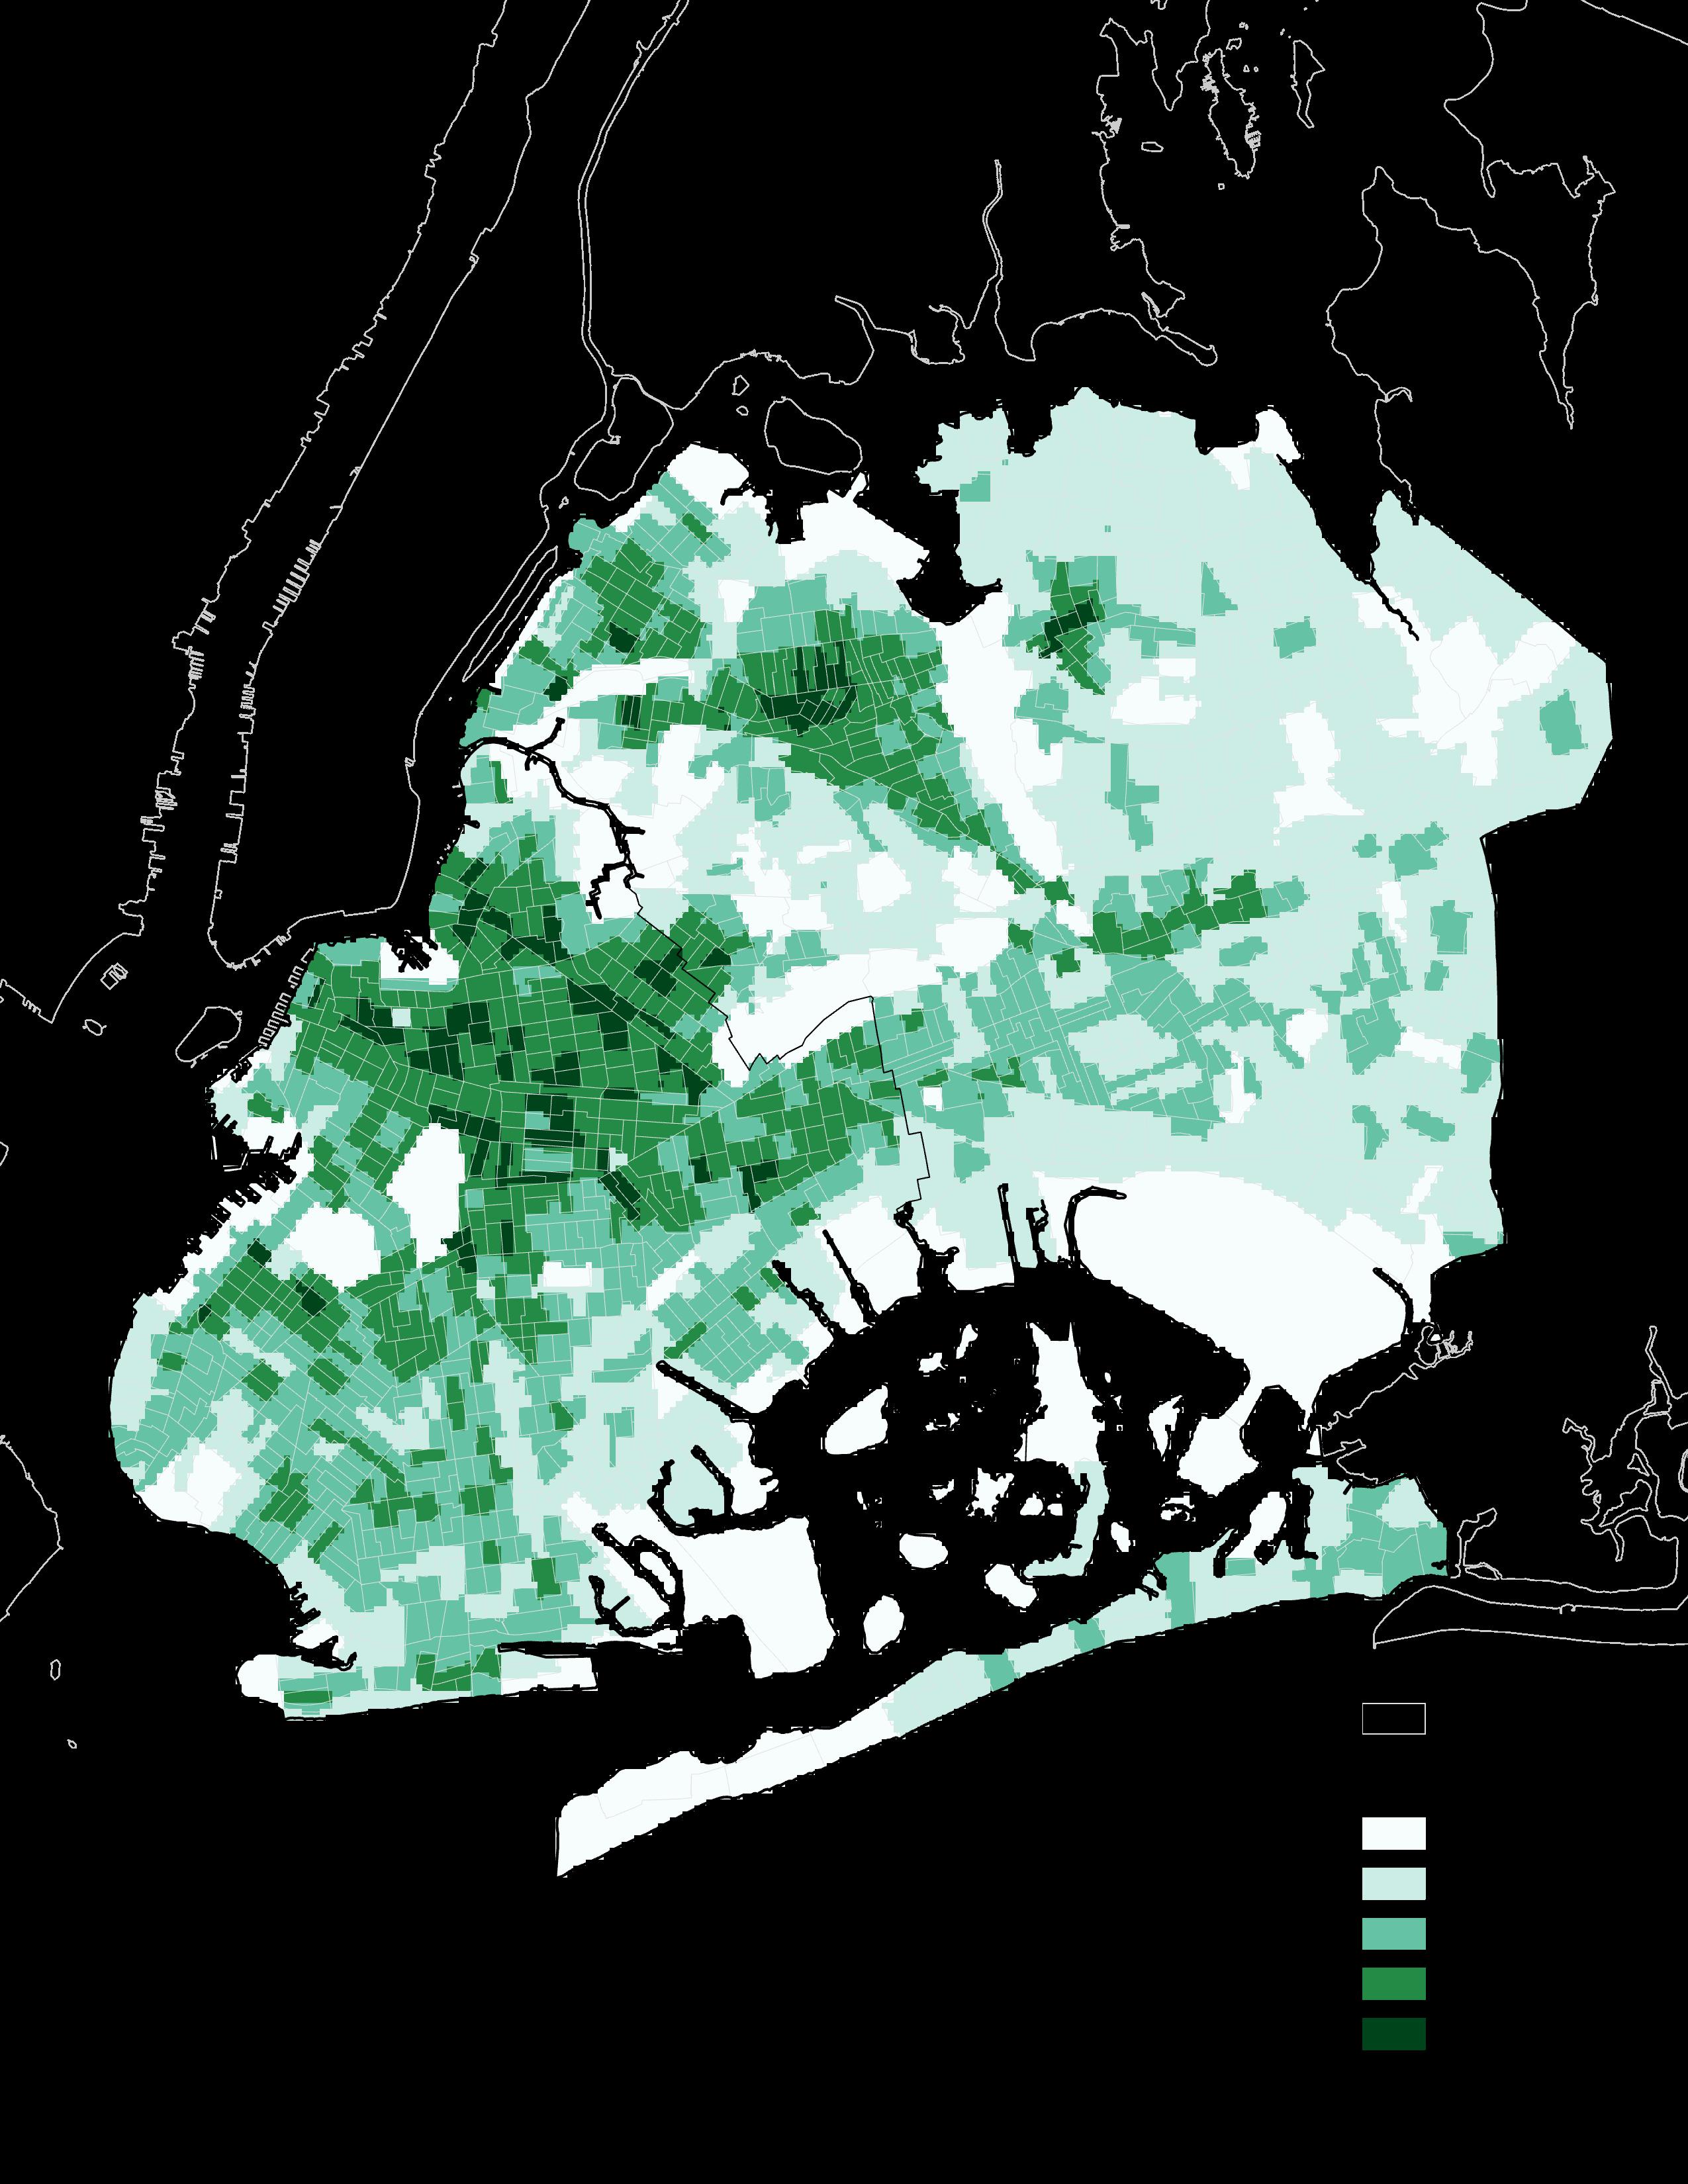
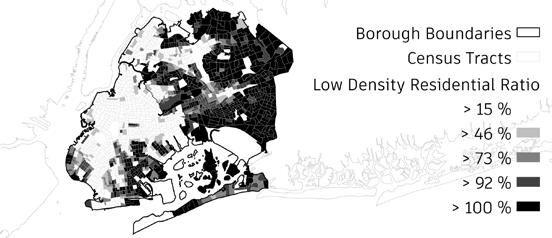
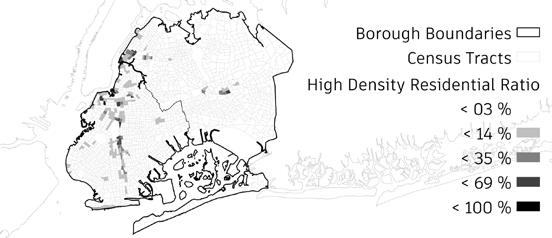
After classifying each lot, we conducted an analysis to visualize the distribution and prevalence of housing densities across Brooklyn and Queens. This step involved creating density maps that illustrated the spatial distribution of low, middle, and high-density residential ratios by census tract. These maps highlight how residential densities vary geographically and provide a detailed visual representation of the housing typology landscape. The insights derived from these maps were then utilized as the explanatory variable in our Geographic Weighted Regression, enabling us to further explore the spatial relationships between existing residential densities and potential impact from the legalization of ADUs, ultimately answering the “what areas” part of our research question.
Lot Level Classification:

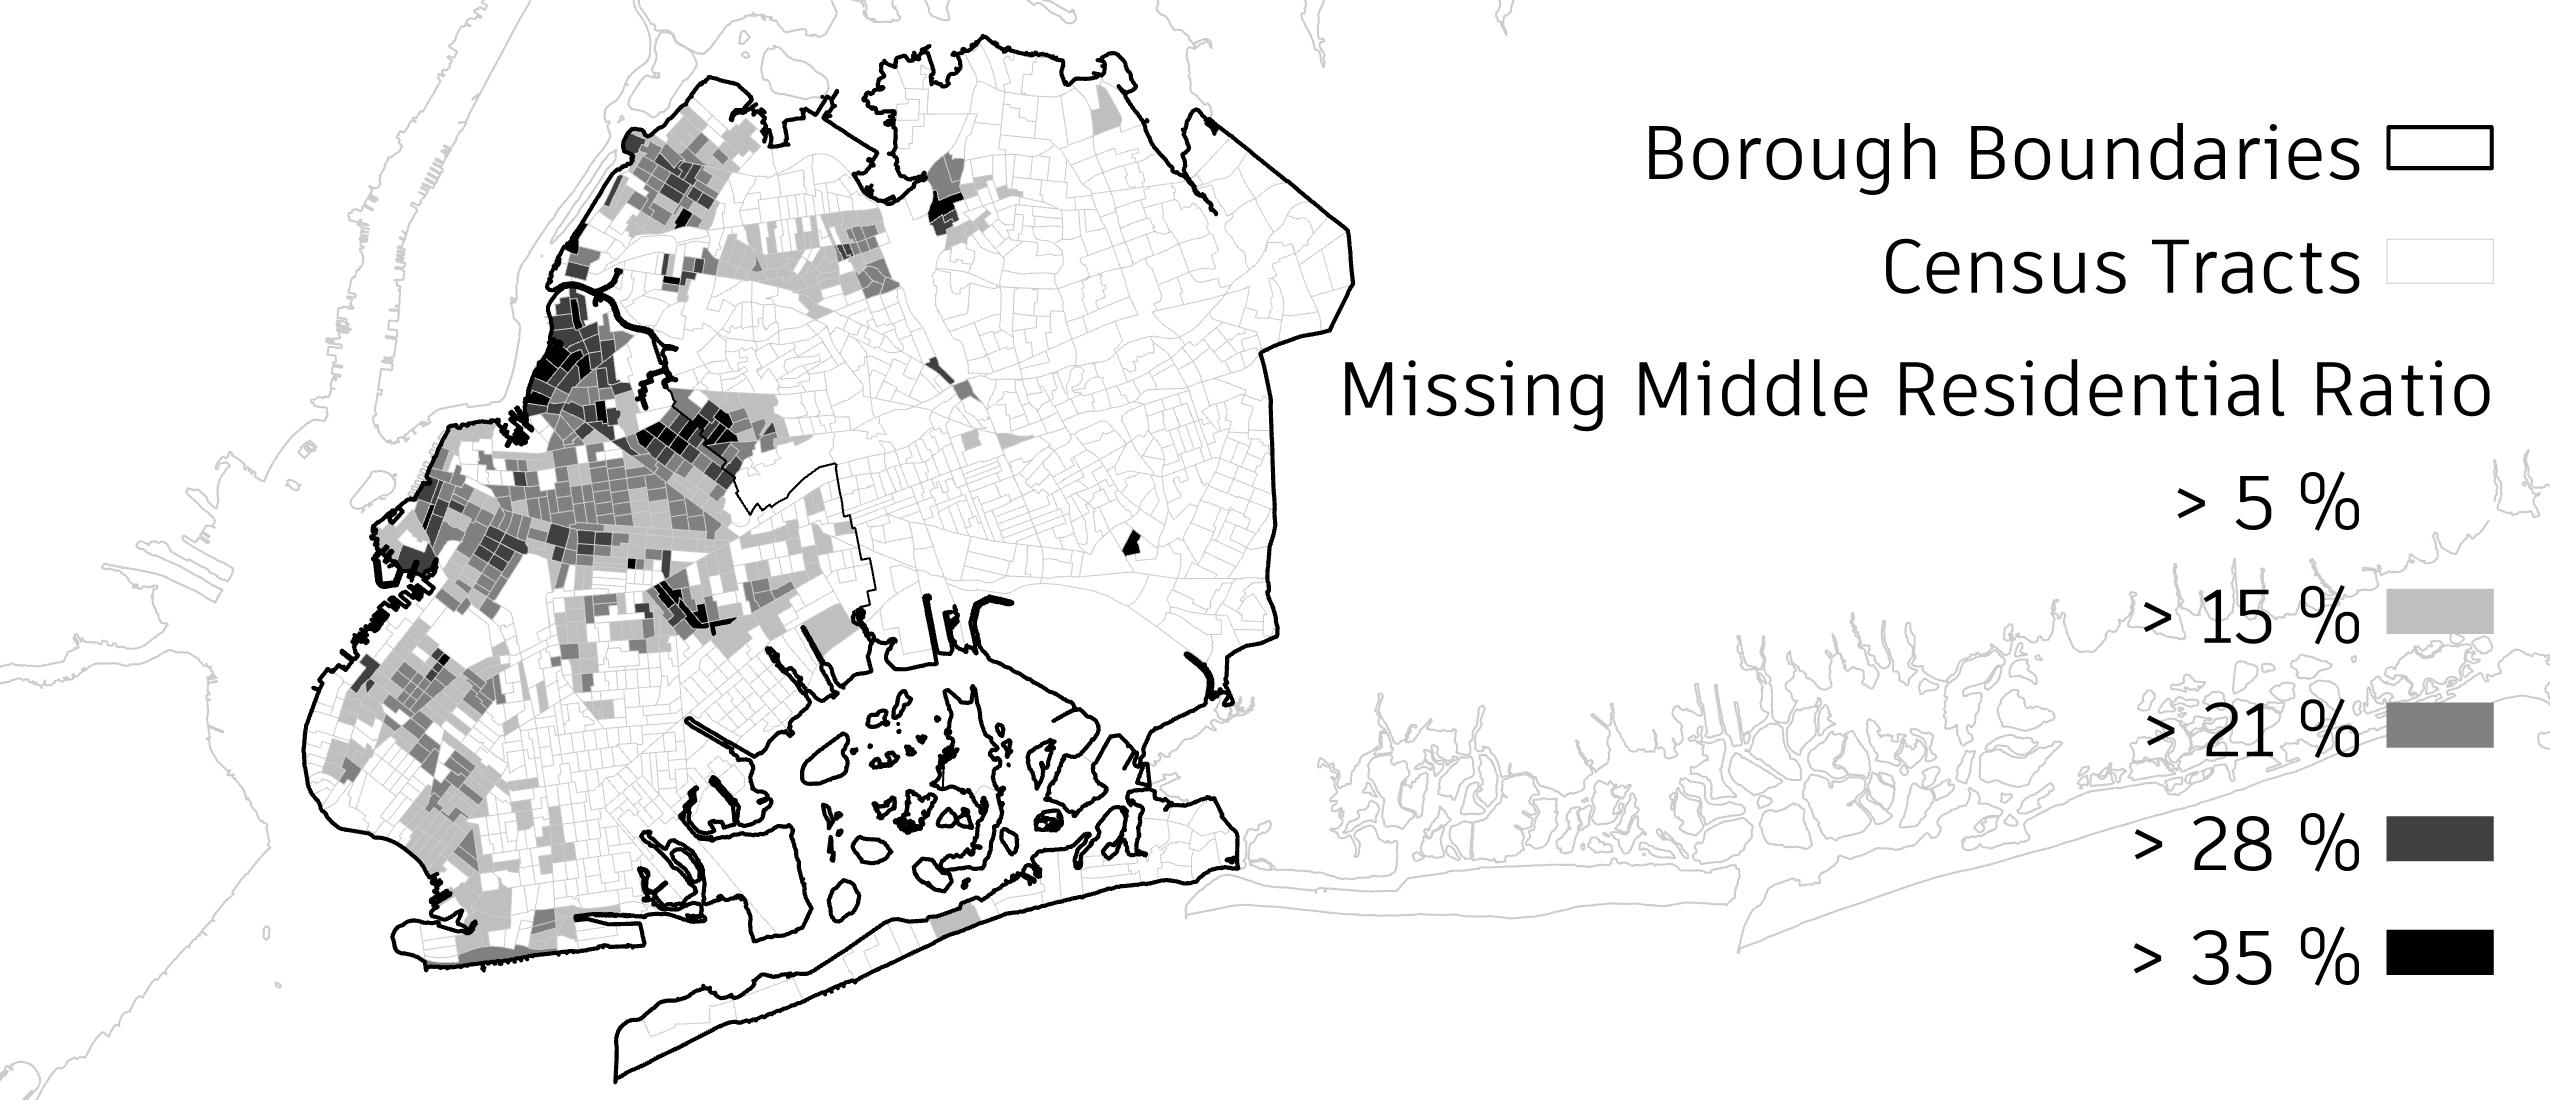
Census Tract Level Classification:
Unsurprisingly, a significant number of census tracts in Eastern Queens, particularly east of the Van Wyck Expressway, and in Southeast Brooklyn exhibit very high low-density residential ratios. This is expected, as these neighborhoods are located on the periphery of New York City, far from the urban core of Manhattan.
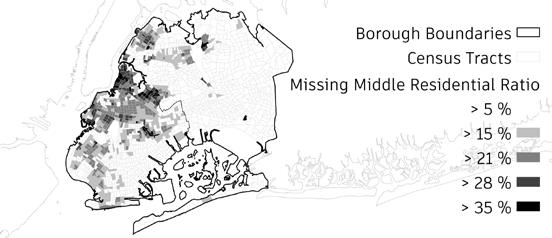
Neighborhoods in Northeastern Brooklyn and Queens, specifically Williamsburg, Greenpoint, and Astoria, have high middle density residential ratios. However, using the Jenks Natural Breaks method, a census tract only needs to have 35% of its residential units classified as middle density to be placed in the top quantile. In contrast, the top quantile for low density and high density classifications requires 100% of units to be low or high density, respectively. This disparity highlights the concept of how middle housing, often referred to as ‘missing middle’, is underrepresented in the urban housing landscape.
Surprisingly, very few census tracts exhibit high, high-density residential ratios. Among the few that do, Ocean Avenue in Southern Brooklyn stands out as a high-density corridor, along with pockets of Long Island City. This may be attributed to our definition of high density, which relies on New York City’s classifications of Floor Area Ratio (FAR) based on zoning designations. These designations predominantly identify high-density areas in Manhattan, rather than in Brooklyn and Queens.


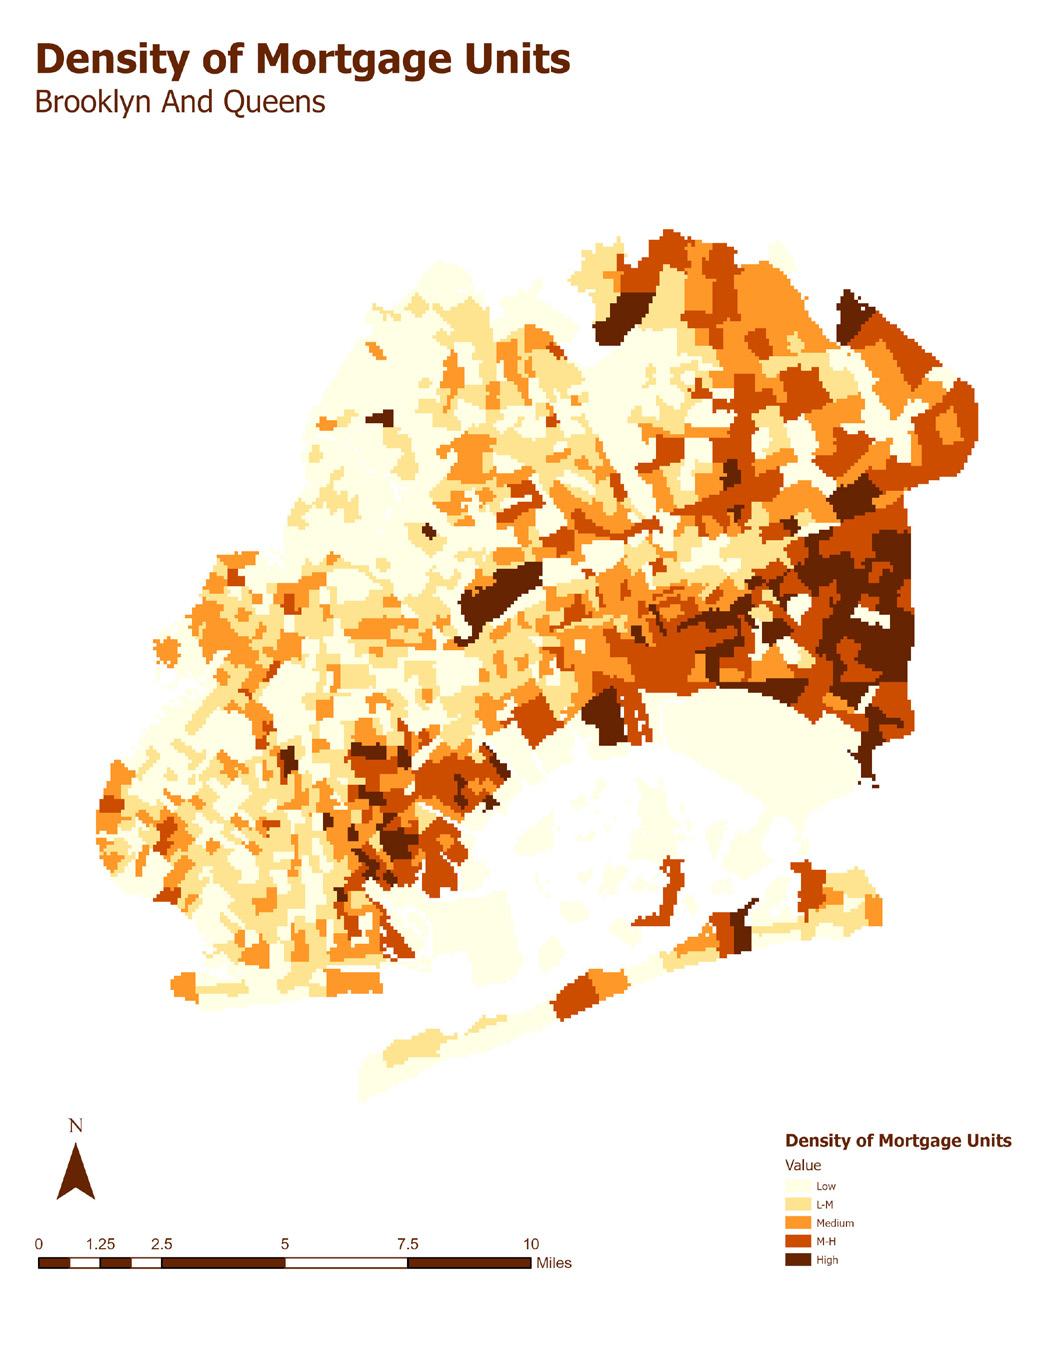
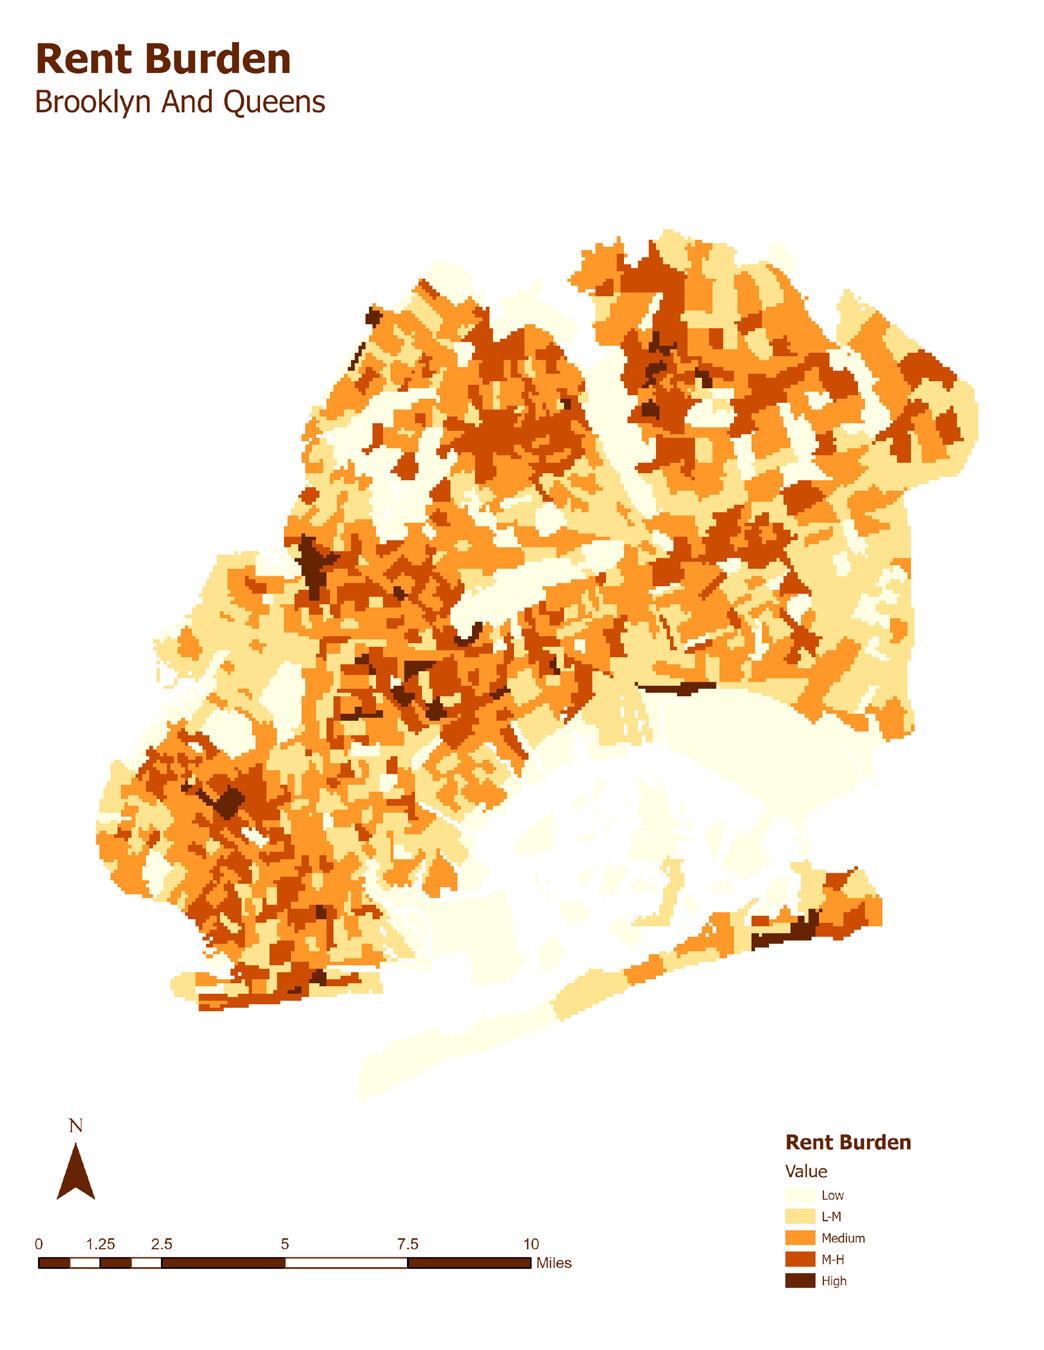
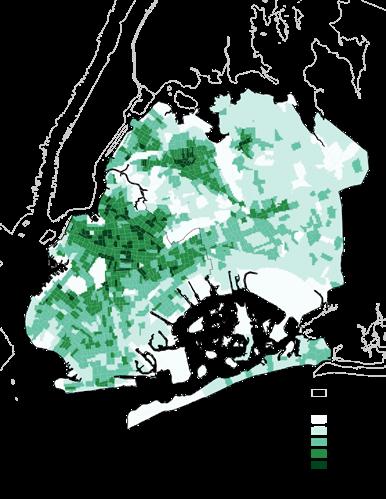
After preparing socio-economic, access, and housing data, we performed a weighted overlay that combined all of the layers into a raster impact score. This score answered our question: “Where would a transition from short-term rentals to longterm tenureship be most impactful?” Based on our weighting, areas that scored high on the impact scale were characterized by being rent burdened, densely populated, predominantly non-white, with a high incidence of home ownership and mortgages, presence of existing AirBnBs, potential for ADUs, and proximity to amenities.
As a result, we found that neighborhoods like Jackson Heights, Bushwick, Astoria, Flushing, Clinton Hill, Crown Heights, Bedford Stuyvesant, and Williamsburg would see the most significant impact from the simultaneous implementation of both Local Law 18 and the City of Yes for Housing.
Interestingly enough, neighborhoods on the periphery of Brooklyn and Queens did not score very high on our impact assessment. We believe this could be attributed to their lack of access to amenities, which is likely further constrained by restrictive zoning and land use policies.
Census Tract Variable MCDA Weight
Rent Burden Percentage
Population Density
Non White Density
Mortgage Density
AirBnB Density
Potential ADU Density
Housing Unit Density
Vacant Housing Unit Density
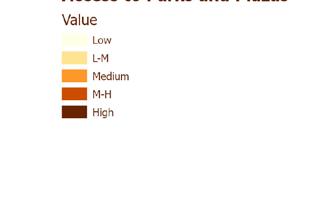
Subway Access* Health Care Access* Cultural Spaces Access* Parks and Plazas Access*
School Access*
School Access*
After conducting our density calculations and multi-criteria decision analysis to score impact, our Geographic Weighted Regression (GWR) presented mixed results when assessing the correlation between the two. One limitation of this analysis was the varying levels of statistical significance across different housing densities. This variation might reflect the diverse urban planning and housing policies across different census tracts, suggesting that localized factors significantly influence the outcomes. Such discrepancies highlight the need for nuanced interpretation of GWR results and possibly indicate that broader, more uniform policy applications may not be effective across all regions without adjustments tailored to specific local conditions.
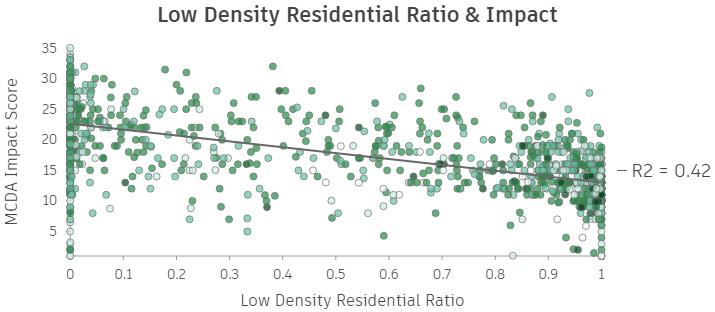
The only GWR that was statistically significant was the correlation between low density percentage and impact, with an R squared value of 0.42. This correlation is negative, meaning, as census tracts have more low density housing, the degree to which they may be impacted by the implementation of ADUs in their neighborhood would be lower. This is unsurprising, as low density neighborhoods are often racially homogenous and not as accessible to the amenities that our analysis included in our MCDA criteria.
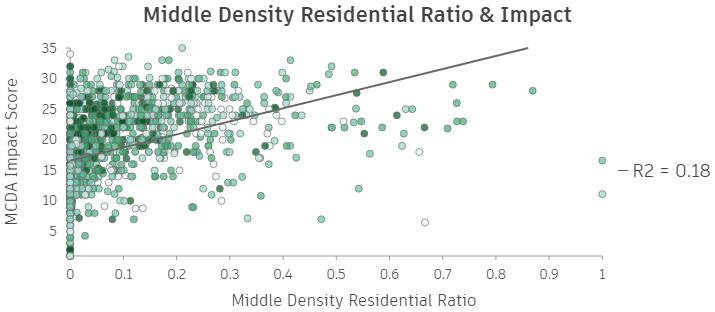
The proportion of middle density housing only revealed an R squared value of 0.18, with respect to our dependent variable of impact. This correlation is positive, meaning, as census tracts have more middle density housing, the degree to which the may be impacted by the implementation of ADUs in their neighborhood would be higher, but we can only say this with 18% confidence.
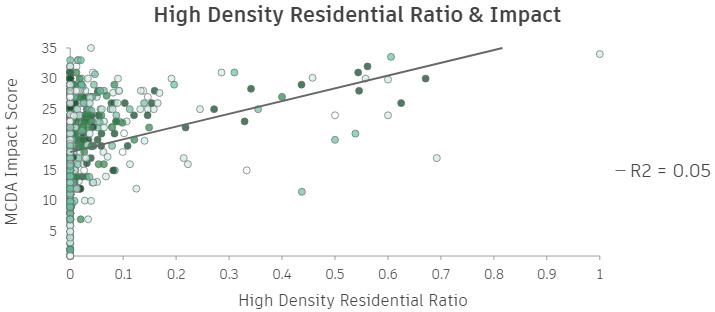
The proportion of high density housing only revealed an R squared value of .05, with respect to our dependent variable of impact. This correlation is positive, meaning, as census tracts have more high density housing, the degree to which the may be impacted by the implementation of ADUs in their neighborhood would be higher, but we can only say this with 5% confidence.
(low, middle, high)
Accessory Dwelling Units are becoming a useful tool for cities to increase the existing affordable housing supply without requiring the capital investment needed for other costly affordable housing initiatives, like LIHTC investments. ADUs are a form of incremental housing, allowing homeowners to build on existing properties and reap the benefits of these expansions. Residents can build on existing properties in situ, instead of developing affordable housing on vacant parcels.
As New York City gradually incorporates ADUs into the city’s broader housing market, it is crucial to understand which neighborhoods would be most impacted in legalizing these property-level conversions. This report could provide a framework for determining which neighborhoods stand to gain from this policy, both for homeowners hoping to build equity on their properties, and low-income residents seeking more affordable units. By legalizing ADUs, the city is essentially establishing a new category of housing – alleviating some of the burden on the Department of Housing Preservation and Development (HPD)– to meet the city’s affordable housing benchmarks.
In determining which neighborhoods would benefit from ADU implementation, HPD can strategically allocate financial resources to households that meet this criteria. We believe our findings provide a frame of reference for the criteria that should be considered when making these decisions. The crackdown on short term rentals like AirBnBs also provides an opportunity for mobilizing further conversions, since many homeowners are looking for alternative strategies for wealth accumulation. But it is crucial that the approval process is not purely based on the background of the applicant
but on the spatial implications that are imposed by secondary occupancy. As New York City begins to incentivize these ADU conversions, it should be intentional in approving selected applicants whose projects would help the surrounding community meet its housing needs.
United States Census Bureau, American Community Survey, 2022 https://data.census.gov/table/ACSDP5Y2022.DP04?t=Homeownership%20Rate&g=050XX00US36005$1400000,36047$1400000,36061$1400000,36081$1400000,36085$1400000. Accessed 18 February 2024.
AirBnB Data
“New York City.” Inside AirBnB, Inside AirBnB, 6 Feburary 2024, http://insideairbnb.com/new-yorkcity. Accessed 18 February 2024.
Property Data
Automated City Register Information System, New York City Department of Finance, 2024, https:// a836-acris.nyc.gov/CP/. Accessed 18 February 2024.
Map Pluto
“PLUTO and MapPLUTO.” NYC Planning, Department of City Planning (DCP), https://www.nyc.gov/ site/planning/data-maps/open-data/dwn-pluto-mappluto.page. Accessed 18 February 2024. Facilities Database
“Facilities Database (FacDB).” NYC Planning, Department of City Planning (DCP), August 2023, https://www.nyc.gov/site/planning/data-maps/open-data/dwn-selfac.page. Accessed 18 February 2024.
Income Data
“Income in the Past 12 Months (in 2022 Inflation-Adjusted Dollars).” United States Census Bureau, American Community Survey, 2022, https://data.census.gov/table/ACSST5Y2022.S1901?t=Income%20and%20Poverty&g=050XX00US36005$1400000,36047$1400000,36061$1400000,36081$1400000,36085$1400000. Accessed 18 February 2024.
Home Ownership Rate
“Homeownership Rate.” United States Census Bureau, American Community Survey, 2022, https://data.census.gov/table/ACSDP5Y2022.DP04?t=Homeownership%20Rate&g=050XX00US36005$1400000,36047$1400000,36061$1400000,36081$1400000,36085$1400000. Accessed 18 February 2024.
Median Gross Rent by Bedrooms
“Median Gross Rent by Bedrooms.” United States Census Bureau, American Community Survey, 2022, https://data.census.gov/table/ACSDT5Y2022.B25031?t=Renter%20Costs&g=050XX00US36005$1400000,36047$1400000,36061$1400000,36081$1400000,36085$1400000. Accessed 18 February 2024.
Financial Characteristics for Housing Units With a Mortgage
“Financial Characteristics for Housing Units With a Mortgage.” United States Census Bureau, American Community Survey, 2023, https://data.census.gov/table?t=Mortgage%20Costs&g=050XX-
00US36005$1400000,36047$1400000,36061$1400000,36081$1400000,36085$1400000. Accessed 18 February 2024.
Mortgage Status by Aggregate Real Estate Taxes Paid (Dollars)
“Mortgage Status by Aggregate Real Estate Taxes Paid (Dollars).” United States Census Bureau, American Community Survey, 2022, https://data.census.gov/table/ACSDT5Y2022.B25090?t=Real%20Estate%20Taxes&g=050XX00US36005$1400000,36047$1400000,36061$1400000,36081$1400000,36085$1400000. Accessed 18 February 2024.
Cartographic Boundary Files
“Cartographic Boundary Files - Shapefile.” U.S. Census Bureau, 8 October 2021, https://www.census.gov/geographies/mapping-files/time-series/geo/carto-boundary-file.html. Accessed 18 February 2024.
}
The socio demographic data is downloaded from the United States Census Bureau for the year 2022. Our Study area is limited to Brooklyn and Queens
Code
All the necessary libraries janitor for initial cleaning of the data sets. Dplyr for modifying the data sets, stringr for manipulating data with string values and readr to read and write data sets were loaded
library(janitor) library(dplyr) library(stringr) library(readr)
A function used to process the census data set was initially written where you feed in you raw data set. The function cleans data set in the following ways
The column names would be first cleaned getting rid of the raw data settings
Then the we remove all the columns with starting with the words margin_of_error
We remove unnecessary values from the raw data including 0,-,N-(X) and remove mathematical operations - and + assigned before or after the data set
We create a data column called geoid as a numeric value from the column geography removing 1400000US and retaining only the number
Finally we return the cleaned dataset for modifying it manually.
Census_clean <- function(dataset) {
# Clean column names
dataset <- dataset %>% clean_names()
# Remove columns with “margin_of_error” dataset <- dataset[, -grep(“margin_of_error”, names(dataset))]
# Replace specific values for (col in names(dataset)) { dataset[[col]] <- gsub(“[,\\+]”, “”, dataset[[col]]) dataset[[col]][dataset[[col]] %in% c(“0”, “-”, “N”, “(X)”)] <- “” }
# Create a new column ‘geoid’ with the numeric portion dataset$geoid <- as.numeric(sub(“^1400000US”, “”, dataset$geography)) return(dataset)
Income in the past 12 months (in 2022 inflated adjusted dollars) is first analyzed where we only
require a column called household median income and then converted all the values to numeric
# income
income <- read.csv(“G:/My Drive/MSUP/Spring2024/Advanced_Spatial_Analysis/ADUs/Data/Income/ACSST5Y2022.S1901-Data.csv”, skip = 1) income <- Census_clean(income)
income <- income %>%
select(geoid, estimate_households_median_income_dollars) %>%
rename(median_income= estimate_households_median_income_dollars) %>% mutate_all(as.numeric)
Means of transportation to work by tenure from which we isolated All the commuters transiting through public transit, excluding taxi cab
# Transit transit <- read.csv(“G:/My Drive/MSUP/Spring2024/Advanced_Spatial_Analysis/ADUs/Data/Trasit_To_wORK/ACSDT5Y2022.B08137-Data.csv”, skip = 1)
transit <- Census_clean(transit)
transit <- transit %>%
select(geoid,estimate_total_public_transportation_excluding_taxicab) %>%
rename(commuters_public_transit=estimate_total_public_transportation_excluding_taxicab) %>% mutate_all(as.numeric)
Race data contains column total population in total right population, from which we calculated the total non-whit population through subtraction and then compiled all the data
race <- read.csv(“G:/My Drive/MSUP/Spring2024/Advanced_Spatial_Analysis/ADUs/Data/race/ ACSDT5Y2022.B02001-Data.csv”, skip = 1)
race <- Census_clean(race)
race <- race %>%
select(geoid, estimate_total, estimate_total_white_alone) %>%
mutate_all(as.numeric) %>%
mutate(non_white= estimate_total-estimate_total_white_alone) %>%
rename(population = estimate_total, white_population= estimate_total_white_alone)
Then we calculated median gross rent by bedrooms from where we took the average rent paid
Code to Clean Up Census Data (continued)
by tenant in a month
rent <- read.csv(“G:/My Drive/MSUP/Spring2024/Advanced_Spatial_Analysis/ADUs/Data/Gross_ Rent_Bedroom/ACSDT5Y2022.B25031-Data.csv”, skip = 1)
rent <- Census_clean(rent)
rent <- rent %>%
select(geoid, estimate_median_gross_rent_total) %>% mutate_all(as.numeric) %>%
rename(rent=estimate_median_gross_rent_total)
We calculated the real estate taxes, paid from mortgage status by aggregate real estate taxes paid in dollars from where we obtained the real estate taxes column
realestatetaxes <- read.csv(“G:/My Drive/MSUP/Spring2024/Advanced_Spatial_Analysis/ADUs/ Data/Mortagage_Realestate/ACSDT5Y2022.B25090-Data.csv”, skip = 1)
realestatetaxes <- Census_clean(realestatetaxes)
realestatetaxes <- realestatetaxes %>%
select(geoid, estimate_aggregate_real_estate_taxes_paid_dollars) %>%
rename(real_estate_taxes=estimate_aggregate_real_estate_taxes_paid_dollars) %>% mutate_all(as.numeric)
The mortgage data from financial characteristics for housing units with a mortgage stable and then isolated the number of housing units with the mortgage
Mortgage <- read.csv(“G:/My Drive/MSUP/Spring2024/Advanced_Spatial_Analysis/ADUs/Data/ Financial_Mortgage/ACSST5Y2022.S2506-Data.csv”, skip = 1)
Mortgage <- Census_clean(Mortgage)
Mortgage <- Mortgage %>%
select(geoid, estimate_owner_occupied_housing_units_with_a_mortgage_owner_occupied_ housing_units_with_a_mortgage) %>%
rename(Homs_Mortgage=estimate_owner_occupied_housing_units_with_a_mortgage_owner_occupied_housing_units_with_a_mortgage) %>% mutate_all(as.numeric)
From the selected housing characteristics data, we have obtained total number of housing units, housing units that are vacant, Homeowner vacancy and rental vacancy Home vacancy and rental vacancy
housing_characterstics <-read.csv(“G:/My Drive/MSUP/Spring2024/Advanced_Spatial_Analysis/
ADUs/Data/Housing_Characterstics/ACSDP5Y2022.DP04-Data.csv”, skip = 1)
housing_characterstics <- Census_clean(housing_characterstics)
housing_characterstics <- housing_characterstics %>%
select(geoid, estimate_housing_occupancy_total_housing_units, estimate_housing_occupancy_total_housing_units_vacant_housing_units, estimate_housing_occupancy_total_housing_units_homeowner_vacancy_rate, estimate_housing_occupancy_total_housing_units_rental_vacancy_rate) %>%
rename(housing_units= estimate_housing_occupancy_total_housing_units, vacant_house_ units= estimate_housing_occupancy_total_housing_units_vacant_housing_units, homeowner_ vacancy = estimate_housing_occupancy_total_housing_units_homeowner_vacancy_rate, rental_vacancy = estimate_housing_occupancy_total_housing_units_rental_vacancy_rate) %>%
mutate_all(as.numeric)
Finally, we joined all the tables using in a joint from dplyr package by geoid then
Census_data <- race %>%
inner_join(Mortgage, by = “geoid”) %>%
inner_join(housing_characterstics, by = “geoid”) %>%
inner_join(realestatetaxes, by = “geoid”) %>%
inner_join(rent, by = “geoid”) %>%
inner_join(transit, by = “geoid”) %>%
inner_join(income, by= “geoid”)
We calculated the rent button by dividing the average for 12 months by the median income of household in percentage
Census_data <- Census_data %>%
mutate(rent_burden=rent/median_income) %>%
mutate(rent_burden=rent_burden*12) %>%
mutate(rent_burden=rent_burden*100)
Remove all the NAs so that the CSP is read as a new when imported into ArcGIS Pro
# Remove NAs and replace with blank spaces Census_data[is.na(Census_data)] <- “”
Finally, wrote the .csv to a file
# Export to CSV write_csv(Census_data, “G:/My Drive/MSUP/Spring2024/Advanced_Spatial_Analysis/ADUs/Data/ combined_census.csv”)