
22 minute read
Building Blocks


Value Analysis News
New Book Gives Many Answers to Your Questions in the New Era of Healthcare Reform
John L. Pritchard, publisher of The Journal of Healthcare Contracting, has written a new book called Muddy Waters: Making Sense of the Healthcare Supply Chain in the Era of Reform.
This book gives a brief history of supply chain management from the early 1950s right up to present day. It defines what is and what is not an integrated delivery network, how group purchasing organizations have evolved for the better, talks about the new trend of regional purchasing coalitions, and how hospitals will be aligning with their physicians to lower their costs and improve quality. It helps you decide if self-distribution and/or a service center model is right for you, and discusses how Accountable Care Organizations will change the face of healthcare.
It’s a quick read, but the book is packed with insightful, timely and predictive information that all supply chain/value analysis professionals need to know as they plan for their own supply chain department’s future. It’s a must read, as Pritchard says, “For those who want to understand the complexities in today’s fluctuating marketplace.” If you would like a copy of Pritchard’s book, it can be ordered at The Journal of Healthcare Contracting website for $21.50, plus a small charge for shipping and handling.
AHVAP Announces New Board Members for 2012-2013
The following board members have been elected by AHVAP for 2012–2013:
President-Elect:
Dee Donatelli, RN Senior Vice President, Hayes, Inc.
Treasurer:
Melanie Miller, RN, BSN Manager, Supply Chain Management, Cedars-Sinai Medical Center
President: Nila Getter, MS, RN, Nursing Product Manager, Kettering Health Network.
Secretary:
Mary (Beth) Potter, RN, CMRP, Director of Clinical Value Analysis, Iowa Health System
Central Director: Cindy Christofanelli, RN, Corporate Director Supply Chain Management, SSM Health Care
Eastern Director: Gloria Graham, RN, Clinical Materials Specialist, Cincinnati Children’s Hospital Medical Center
Western Director: Cheri Berri Lesh, RN, Value Analysis Coordinator, Group Health Cooperative
An Important and Timely Message from Robert T. Yokl on Why Utilization Management is More Important than Ever Before!
When I look at the Affordable Care Act’s new ValueBased Purchasing (VBP) Prospective Payment System that was implemented in October of 2012, I get the feeling that we in healthcare are rowing our boat in the wrong direction. This is because over a five-year period your reimbursement to fund this new VBP payment system, which includes a minuscule award of 1% for complying with 62 new quality measures, will be reduced about 7.25%


In addition, Medicare will reduce its DRG payments if your hospital readmission rate is 30 days or less for your patients with heart attacks, heart failure, and pneumonia if they exceed a preset threshold. By 2015, hospitals that don’t meet the government’s IT “meaningful use” criteria in delivering their patient care will face further reductions in their reimbursement. Top this off with a new mandate in 2015, which says that hospitals with high rates of selected hospitalacquired conditions will receive further payment reductions. If this wasn’t an actual fact, I would think it
was fiction!
What this means to your healthcare organization is that you will need to save even more money in your supply streams to offset these deep cuts, since NEW PRICE SAVINGS ARE A THING OF THE PAST. No longer can you count on price to put you into the next savings tier. Rather, the way of the future is utilization management, which can help you cut your supply chain expenses to the bone and find thousands, even millions, in hidden savings. The good news is that you have five years to do so. I would plan to target about 1.5% in utilization
“The prices of products, services and technology may be important, but reducing the utilization of supplies will have a much greater positive financial impact on a hospital’s bottom line.“ Anonymous
savings per year, starting now, so you can get ahead of the curve. To save less per year, as I see it, would be a real struggle to catch up at a later date. Plan now to save more, so you have less pain later. This way, you can make your job somewhat easier, even though you have a big mountain to climb.
And if you REALLY want to make your utilization job much easier, call us at 1-800-220-4274 and visit our website to see for yourself how our new Utilizer® Dashboard (all-in-one utilization management system) can help you reach new savings heights. We guarantee it within 90-days!
Feature Article
Reduce, Control and Eliminate Wasteful and Unnecessary Supply Utilization Practices
Go beyond price and standardization to save more in less time
Traditionally, healthcare organizations have focused their value analysis efforts on lowering the price and standardizing on the products, ser

vices and technologies that they are purchasing. This attitude has carried over to the evaluation of group purchasing contracts where price, standardization and suitability are the key factors in a hospital, system or IDN’s product, service or technology selection.
Yet, these tactics are only saving healthcare organizations 1%, 2% or 3% on their total supply expenses annually. This is a meager contribution to your healthcare organization’s bottom line, when you consider that by also attacking your utilization misalignments, you can save even more (7% to 15%) in less time. We like to call this line of attack closing the door on the “Supply Chain Triangle” where value analysis teams focus their efforts on price, standardization and utilization as a continuum, not as separate distinct events.
Utilization Management
Reduce Consumption
What typically isn’t understood in value analysis circles is that 79% of all new supply expense savings will be uncovered in utilization, not price or standardization. This is because we as an industry have rung the towel dry on price savings in the last few decades with our GPO and local contracts, and standardization has been substantially achieved on most commodity groups. There is nowhere else to go for savings!
This could be a shock to value analysis leaders and team members who haven’t thought about how products, services and technologies are deployed in their healthcare organization. Everything that may appear to be a routine clinical or operational supply chain practice, in actuality, can be very wasteful and inefficient.
Take, for instance, the practice of hospitals loading up

their patient rooms with boxes (100/box) of disposable floor examination gloves, which often results in glove waste because gloves become unusable if they fall on the floor. A better way to provide these gloves and solve this wasteful practice would be to either supply your nursing and ambulatory units with gloves packed 50 to a box or to purchase foolproof glove dispensing systems that are now on the market. In doing so, your healthcare organization can save up to 33% in this category of purchase alone.
Based on our 16 years of experience in supply utilization management, we have helped our clients uncover wasteful and inefficient practices in thousands of their supplies and purchase services; therefore, we can categorically state that utilization misalignments are epidemic in healthcare organizations today. It doesn’t need to be this way!
Utilization Management
Control Waste
Sixteen years ago, we stumbled on the realization that most of the savings (about 79%) we were identifying for our clients weren’t price or standardization, but utilization savings. That’s when we coined the term “Utilization Misalignments” to distinguish price-oriented savings from utilization or “in-use” savings. This was a new source of savings for clients who hadn’t realized these savings were available to them.
This was a big leap forward for us and our clients, since these new utilization savings represented 7% to 15% in savings and went far beyond the 1%, 2% or 3% savings they were receiving on price. We then realized that it wasn’t good enough to just uncover these utilization savings, but that we now needed to control them before they damaged our clients’ bottom line.
This was the genesis for developing the new tool that we called “Value Analysis Analytics” that identifies, manages and controls our clients’ utilization misalignments. It’s based on an Activity-Based Costing Model that had been successfully employed in the industry for many years.
“We coined the term “Utilization Misalignments“ to distinguish priceoriented savings from utilization or “inuse” savings. This was a new source of savings for clients who hadn’t realized Quite simply, this new tool enables
these savings were available to them.”
us to isolate our clients’ utilization misalignments from the thousands of products, services and technologies that they purchase annually. We can then quickly eliminate them with the assistance of our clients’ value analysis teams.
A good example of how our Value Analysis Analytics worked for one of our clients is that it identified that their anesthesia trays’ cost per surgical case (CMI adjusted) had jumped 27% over four quarters, while their surgical volume decreased by 2%. When our client’s supply chain manager researched this anomaly with his director of anesthesia, it was uncovered that one or two trays (10 trays to a case) were damaged>>
Utilization Management
and unusable when received from their supplier and his staff were promptly throwing them away. Once the supply chain director solved this quality issue, the utilization misalignment disappeared from our client’s radar screen and $17,926 in cost avoidance annually was achieved.
This is just one of numerous analytical techniques that you too can use to track, trend, and then measure your entire formulary of products, services and technologies to determine your favorable and unfavorable consumption patterns, quarter to quarter, to uncover anomalies that can’t be seen with the naked eye.
Eliminate Waste
The best technique we know of to eliminate wasteful, inefficient and unnecessary supply chain practices in a healthcare organization’s supply stream is to concentrate your value analysis efforts on what you are purchasing now vs. just eval

uating new group purchasing contracts or new purchase requests from your department heads and managers.
One of our clients accomplished this goal by making sure that he has at least three current product, service or technology investigations on his value analysis team’s agendas each month. The reason for this, as I discussed earlier, is that GPO contracts are only generating 1%, 2% or 3% savings (if that), whereas utilization studies generate 7% to 15% in new savings gains. New purchase requests usually cost your healthcare organizations money, so why are you rushing to approve these purchases? Let’s face it, very few are mission critical or an emergency!
The secret to managing this three-fold evaluation, selection and investigation process is to prioritize your agendas by estimating the potential savings and identifying the importance (1-10 with 10 being highest priority) of your agenda items as shown in the following example:
Utilization Management
Agenda Item
Oxisensors Exam Gloves Surgical Masks
I.V. Sets
Vacutainers
B.P. Cuffs Type
Current Current Request
GPO
GPO
Request Annual Spend
$220,395 $129,293 $14,982
$193,566
$26,777
$12,328 Est. Savings or
Increase ($77,296) ($12,989) $1,296
($5,299)
($1,962)
$4,523 Priority
10 10 7
6
5
4
The priority can be assigned by your value analysis manager or team leader based on a combination of factors: savings potential, urgency, or increased cost. Although the priority assigned is subjective, it will still be a good guide for your value analysis team to assist in directing their efforts to the highest priority (vs. lowest) agenda items first.
Another idea for eliminating waste is to re-specify the top 20% (in dollars) of the products, services and technologies that you are buying. This is accomplished through functional analysis. Meaning, you determine the primary, secondary and aesthetic functions that are absolutely required for each of these products, services and technologies, and that’s your new specifications. The reason this is important is because your customers don’t need everything they are requesting now –but they don’t know it.
A few years ago, we did a functional analysis study on one of our client’s top purchases, which happened to be a General Requisition Form, with an annual spend of $189,536. Since this was a form which had been used for years by the hospital on their nursing floors, we asked what its primary function or purpose was. We were told that it was once used for “Results Reporting”, but over the last few years it was exclusively used for “Test Requests”. We identified no secondary functions or purpose for this form.
Utilization Management
Our investigation pointed out that the General Requisition Form was now strictly employed for requesting tests (not results reporting), which clued us into the fact that this form was ripe for savings, now that the functions had changed.
The aesthetic features of the form were: pin feed, eight punched holes for filing in a patient’s chart, 8 1/2 x 11, two peel-off labels, hospital’s name imprinted, and green and red bars running down the sheet. We were told that the labels alone were one-third of the cost of the form, or $127.08 per case, and nursing rarely used more than one label.
With these facts in mind, and after consulting with the customers of this form (nursing, laboratory, environmental services, IT department and storeroom), we were able to write new functional specifications as follows: Blank, 8 1/2 x 11, continuous pin feed computer paper with one peel-off label. This exercise saved our client $67,107 without changing intent or reliability of the form.
The lesson here is that there are millions of dollars of savings at your hos
“The lesson here is that there are millions of dollars of savings at your hospital, system or IDN that can be achieved by re-specifying all of your top 100 or so products, services and technologies to reflect their true functionality today.”
pital, system or IDN that can be achieved by re-specifying all of your top 100 or so products, services and technologies to reflect their true functionality today.
Save More in Less Time
All of the examples we have depicted in this article actually enabled our clients to save more in less time. For instance, to identify the $67,107 General Requisition Form savings I just talked about, required about four to five hours of work to accomplish, including making the changes that were recommended. To rearrange your value >>>>>
Utilization Management
analysis agendas would take an hour or so the first time around, but would become second nature to you going forward.
The point here is that reducing, controlling and eliminating your wasteful and unnecessary supply utilization practices isn’t as time consuming as you might think. All you need to do is go beyond price and standardization to open up a whole new world of savings for your healthcare organization. It will take you less time, effort and resources than you might think and the rewards for doing so (double-digit savings and quality improvements) will be well worth your effort!
The Seven-Percent Savings Solution
Why do we continue to pursue 1%, 2% or 3% savings solutions (i.e., price), when a 7% savings solution (i.e., utilization) is just as easily obtainable? For instance, I know of healthcare organizations that have spent months to achieve a 3% savings on their cardiac rhythm management products, when a 7% to 15% savings was realizable in the same amount of time by also attacking their pacemaker and defibrillator utilization. Look at it this way—If you are already looking into price savings for any commodity group, why wouldn’t you utilize the same data to measure your utilization? This is analogous to changing your oil, but not replacing your oil filter at the same time. You are already under the hood of your car, so why not take a few more minutes and get the job done right. Since 79% of all new savings are in utilization, not price, it just makes good common sense to have a much more rational two-step process for any or all products, services or technologies that you are investigating for possible savings opportunities. The first step is to validate at what percentile you are with your prices. If you are at the 95 th percentile, forget chasing any more price concessions here, since you would just be spinning your wheels. A much more productive and profitable use of your time (step 2) is to investigate the utilization of the product, service or technology under investigation. For instance, if you find that you are at the 95 th percentile on price on your dressing kits, jump to step 2–utilization study. This would be conducted by calculating your cost per patient day (CMI adjusted) of your dressing kits and then benchmarking them against a peer hospital. If you find that you have a substantially higher cost per patient day than your peers, you will then want to observe how your customers are utilizing these dressing kits, since there is a 98.6% chance they are misusing or misapplying them, or you have a value mismatch in this commodity group. To summarize, price savings are still achievable on many commodities that you are buying today. However, if you are already at the 95 th percentile on your pricing on these commodities, you can better utilize your limited time and resources by perusing utilization savings, instead of price. That’s where your real, tangible and robust savings are hidden!
Best Practices
Turning Utilization

Best Practices Into a Major Advantage
Why best practices need to be understood and investigated
While presenting a supply utilization savings report to a large community hospital’s chief operating officer and her supply chain committee members, which outlined the savings opportunities that were available to them, I had an epiphany.
In addition to the savings opportunities, the report also included areas in which this hospital exceeded the benchmarks, and in many categories they were the best practice hospital. What got my attention was that the COO thought it was important that her hospital not only investigate the savings shown on the report, but to also explore what exactly the best practices were that her hospital was employing, in areas exceeding the benchmarks.
She thought that knowing they were a best practice hospital in many areas of operations was great, but she also wanted to investigate their best practices in detail, because no one ever seemed to know what they were actually doing to achieve this best-in-class status. She felt it was shortsighted of her hospital to not learn the ins and outs of their best practices and turn them into a major advantage. Therefore, the COO didn’t want her healthcare organization to lose the opportunity to translate their best practices into protocols, share them with other departments, and where possible, engineer them for other areas of hospital operations.
What really resonates with me about this conversation is that while in the search for utilization savings opportunities, we need to understand our hospital’s best practices and those of other healthcare organizations’ as well. I know this to be useful, since I often contact our client hospitals to discover how they were able to achieve their best practice status and then translate this information into protocols to be emulated. You should do the same!
Verifying Savings
Control and Verify Your Savings Before, During and After Implementation
Did you know that the word “savings” is the most misunderstood word in our supply chain business? We use it every day to describe cost reductions and cost avoidance, and then report it to our bosses as gospel, but do we really know what the word “savings” means?
When our CFO questions us on why he doesn’t see the millions of dollars we reported to him six months ago hitting his general ledger on a new I.V. contract….is this savings? Or, a department head isn’t seeing the effects of savings on a new waste management contract we signed three months ago…is this savings? Let’s face it, our industry has a challenge tracking savings and ensuring that it actually happened. That’s why you can’t call a savings a savings until it’s tracked, trended and validated as being a savings.
The biggest challenge we have found in getting savings right the first time is dedicating the necessary time to analyze and validate savings before, during, and after the implementation of a savings project. It does not matter what type of savings opportunity you are working on; there is a limit to the time you can expend on any savings

project. Generally, once you have met your savings goals you have to draw the line somewhere, right? You then move on to your next savings project. This is the conventional wisdom on this topic, but is it accurate?
Verifying Savings
The attitude, “our job is finished when we meet our savings goals” is a big reason why savings reporting is unreliable, understated, and untrustworthy at most healthcare organizations today. You see, usage patterns frequently change with new product introductions, so you can’t rely on historical purchases to estimate your savings. For instance, in the past you may have used 2-3 dressing trays per patient day but with the new dressing trays you are now using 5-8. Or, your nursing staff misapplies the product, ignores new policies, or skips training and your utilization hits the roof. Maybe, you didn’t get the savings you anticipated because your product failed and was replaced with a more expensive or feature-rich product that you really didn’t need or want or consider in your original VA Study. The list of missteps, mishaps, and misjudgments could be endless after you turn over the products to your customers, which could reduce the savings you worked so hard to put into place.
One permanent solution to this problem is to start tracking, trending and validating your savings compliance with a utilization management system. This system will automate your savings compliance and enable you to quickly see, or not see, the reductions or increases in your supply chain expenses. For example, if you implement a contract price savings of $150,000 in your general pacemaker implants, then your average cost per pacemaker should decrease correspondingly as shown below.
Figure 1: Change in Pacemaker Cost Over a Six-Month Period
WHEN EXPENSE METRIC
BEFORE Any Change Average Cost Per Pacemaker
PROJECTED Cost with New Pricing Actual –6 Months Into New Contract Average Cost Per Pacemaker
Average Cost Per Pacemaker
METRIC COST
$5,930
$4,645
$5,280
Verifying Savings
To demonstrate this concept (show in figure 1) you can see that this hospital did not yet achieve all of the savings in pacemakers (49% slippage in cost per implant, or $73,000 annualized) that they had planned, for these two reasons:
2. Their cardiologist’s choice of pacemakers could have skewed to more featurerich and more expensive pacemakers than was originally projected on the new contract.
They could have had more acute patients that required higher-end pacemakers or there could have been other factors driving the increases.
This hospital didn’t achieve the savings that they projected but they did have a utilization system (i.e. dashboard) to trend, track and then investigate why “This hospital did not yet achieve all of their savings estimates fell short of their the savings in pacemakers (49% slipsavings goal. The good news is that this page in cost per implant, or $73,000 annualized) that they planned for and hospital was only into the first six expected”. months of a two-year contract, which allowed them to reel in the costs as projected over time. If they did not have a utilization system in place, they may have lost the full $150K or more because they would have never known there was a problem, so they would have never acted to correct the utilization issues.
Don’t make the same mistake! Savings are only savings when they are tracked, trended, and validated before, during and after implementation. To assume that all “so called” savings are hitting your hospital’s bottom line is a luxury that none of us can afford in this new era of reform. We must be just like cost accountants: Assume nothing, verify everything with your own eyes!
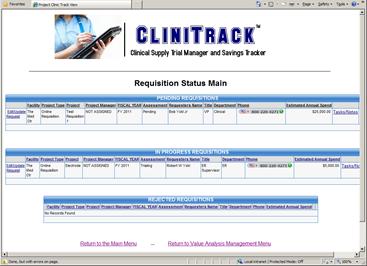
Requisition Manager: All of your new purchase requests will be completed online, numbered and automatically triaged to the appropriate responsible party for action. This eliminates the hassle of dealing with the hundreds of unwieldy and non-uniform (e-mail, fax and phone) new purchase requests that flow through your office annually.

Document Manager:
To ensure that your important documents are never lost or misplaced in your requisition to approval process, all relevant data will be automatically archived in the CliniTracK™ file repository until deemed appropriate to be removed. This will give you peace of mind knowing that all the critical data that you require to manage your VA studies will be at your fingertips when you need it.
Value Analysis Manager: All relevant value analysis team documents will be housed in this module. It will also contain our proven sixstep Value Analysis Funneling™ process to assist your VA team in the evaluation/selection of any and all products, services or technologies and clinical supply trials. Never miss a vital step in your value analysis process.
Clinical Evaluation Manager: This module will provide your clinical supply trial team with a step-by-step process to follow that will manage and control all aspects (project manager, trial location, length, training, cost/benefit analysis, survey forms, etc.) of your clinical supply trials. By following this embedded process, we can almost guarantee you that your clinical supply trials will be more consistent, credible and exacting.
If you are looking for an intuitive, uncomplicated yet complete system to manage and control your value analysis program, this just might be the solution for you. It will also ensure that you have complete documentation (from requisition to approval) to value justify all of your new purchases: No more lost documents, no
more unanswered questions, no more hassles or loose ends with your product, service & technology evaluations.
FREE 30-Day Trial
Click Here to Sign up

If you are one of the hundreds of supply chain managers who are dissatisfied with the time, lost opportunities and complexity of your current value analysis process, then you owe it to yourself to opt into our FREE “test drive” CliniTracK™ Value Analysis Management System to see for yourself if it is the right solution for you. All you need to do is go to our website www.clinitrackmanager.com to sign up for your FREE “test drive”. It’s just that simple! Best of all,
it only takes 38 minutes!
www.CliniTrackManager.com

