


DroneUp, Virginia Beach
Hilton Global Headquarters, McLean
Amazon Web Services, Fairfax County
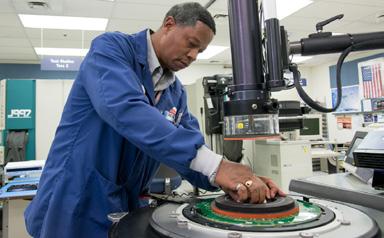
Somic America, Inc., Wythe County
Weidmüller Group, Chesterfield County


Cape Charles


William H. Hayter – Chair
Retired President & CEO, The First Bank & Trust Company
The Honorable Caren Merrick – Vice Chair
Secretary of Commerce and Trade, Commonwealth of Virginia Ex Officio Member
Nancy Howell Agee
President and CEO, Carilion Clinic and Chair, GO Virginia Ex Officio Member
Carrie Hileman Chenery Principal, Valley Pike Partners
Mimi Rainero Coles
Marketing & Business Development Vice President, Permatile Concrete Products Company
The Honorable Stephen E. Cummings
Secretary of Finance, Commonwealth of Virginia Ex Officio Member
Stephen A. Edwards CEO and Executive Director, The Port of Virginia Ex Officio Member
Richard “Rick” O. Harrell, III President (retired), R.O. Harrell, Inc.
John Hewa President and CEO, Rappahannock Electric Cooperative
April Kees Director, Virginia Senate Finance and Appropriations Committee Ex Officio Member
Pace Lochte
Assistant Vice President for Economic Development, University of Virginia
Anne Oman Director, Virginia House Appropriations Committee Ex Officio Member
Marianne Radcliff President, Kemper Consulting, Inc.
Nick Rush Agent, Krupin Partners LLC
William D. Sessoms, Jr. Executive Vice President, TowneBank
Steven David Stone Equity Principal, Offit Kurman
Learn more on the following pages:


Supply Chain Optimization Program Provides Lifeline to Virginia Businesses p. 30

Virginia Ramps Up Site Development Funding to Boost Project-Ready Sites Portfolio p. 34

A Deep Dive Into Opportunities in Southside and Southwest Virginia p. 42
The Virginia Economic Development Partnership (VEDP) is the state economic development authority for the Commonwealth of Virginia. Created in 1995, VEDP collaborates with local, regional, and state partners to encourage the expansion and diversification of Virginia’s economy. VEDP works to accomplish these objectives through a variety of activities, including marketing and lead generation; business retention, expansion, and attraction; trade development; business intelligence; competitive benchmarking; site development; performance-based incentives; and talent solutions.
Working closely with partners, VEDP has adopted five transformational goals for Virginia and VEDP that represent the central focus of its work:
1. Robust State Growth. Position Virginia to achieve a growth rate in employment and median earned income among that of the top 5–10 states in the United States.
2. Every Region Wins. Ensure that every region participates in the growth of the Commonwealth (i.e., all with positive growth in employment and median earned income).
3. Best State for Business. Restore Virginia to its previous position near the top of the national business climate rankings (i.e., average rank among the top 3–5 states).
4. Top State EDO. Reestablish and sustain VEDP as one of America’s most effective state economic development organizations.
5. Super Collaborator. Exhibit collaboration and coordination as hallmarks of VEDP (i.e., place a central focus on the “P” in VEDP).
Provides export development programs, services, and grants to help Virginia companies grow their international sales and optimize international supply chains
Provides customized recruitment and training solutions that give Virginia a competitive edge in securing business investment projects
Conducts in-depth analysis and creates tailored client materials that convey Virginia’s competitive advantages
Collaborates with partners to develop a portfolio of Virginia properties that meet the needs of companies
Reviews, vets, tracks, and coordinates VEDP’s performance-based incentive programs, along with incentive structuring for major projects
Provides a financial framework for VEDP to accomplish its mission through accounting, budgeting, and procurement
Markets the Commonwealth to raise awareness of Virginia’s advantages for business and to cultivate new leads
Collaborates with partners to implement lead generation and project management strategies
Leverages data to guide educational and workforce policy and practice on the availability, quality, and supply of talent in Virginia
Connects Virginia companies with workforce solutions and collaborates with partners to strengthen relationships with existing businesses
Develops strategies to improve the foundations for state, regional, and local economic growth
Oversees the budget, legislative, and policy development process; encourages collaboration and coordination among partners
Seeks to hire, retain, and develop the best and the brightest to accomplish VEDP’s mission and goals
Supports VEDP’s technology platforms, including a variety of custom tech solutions
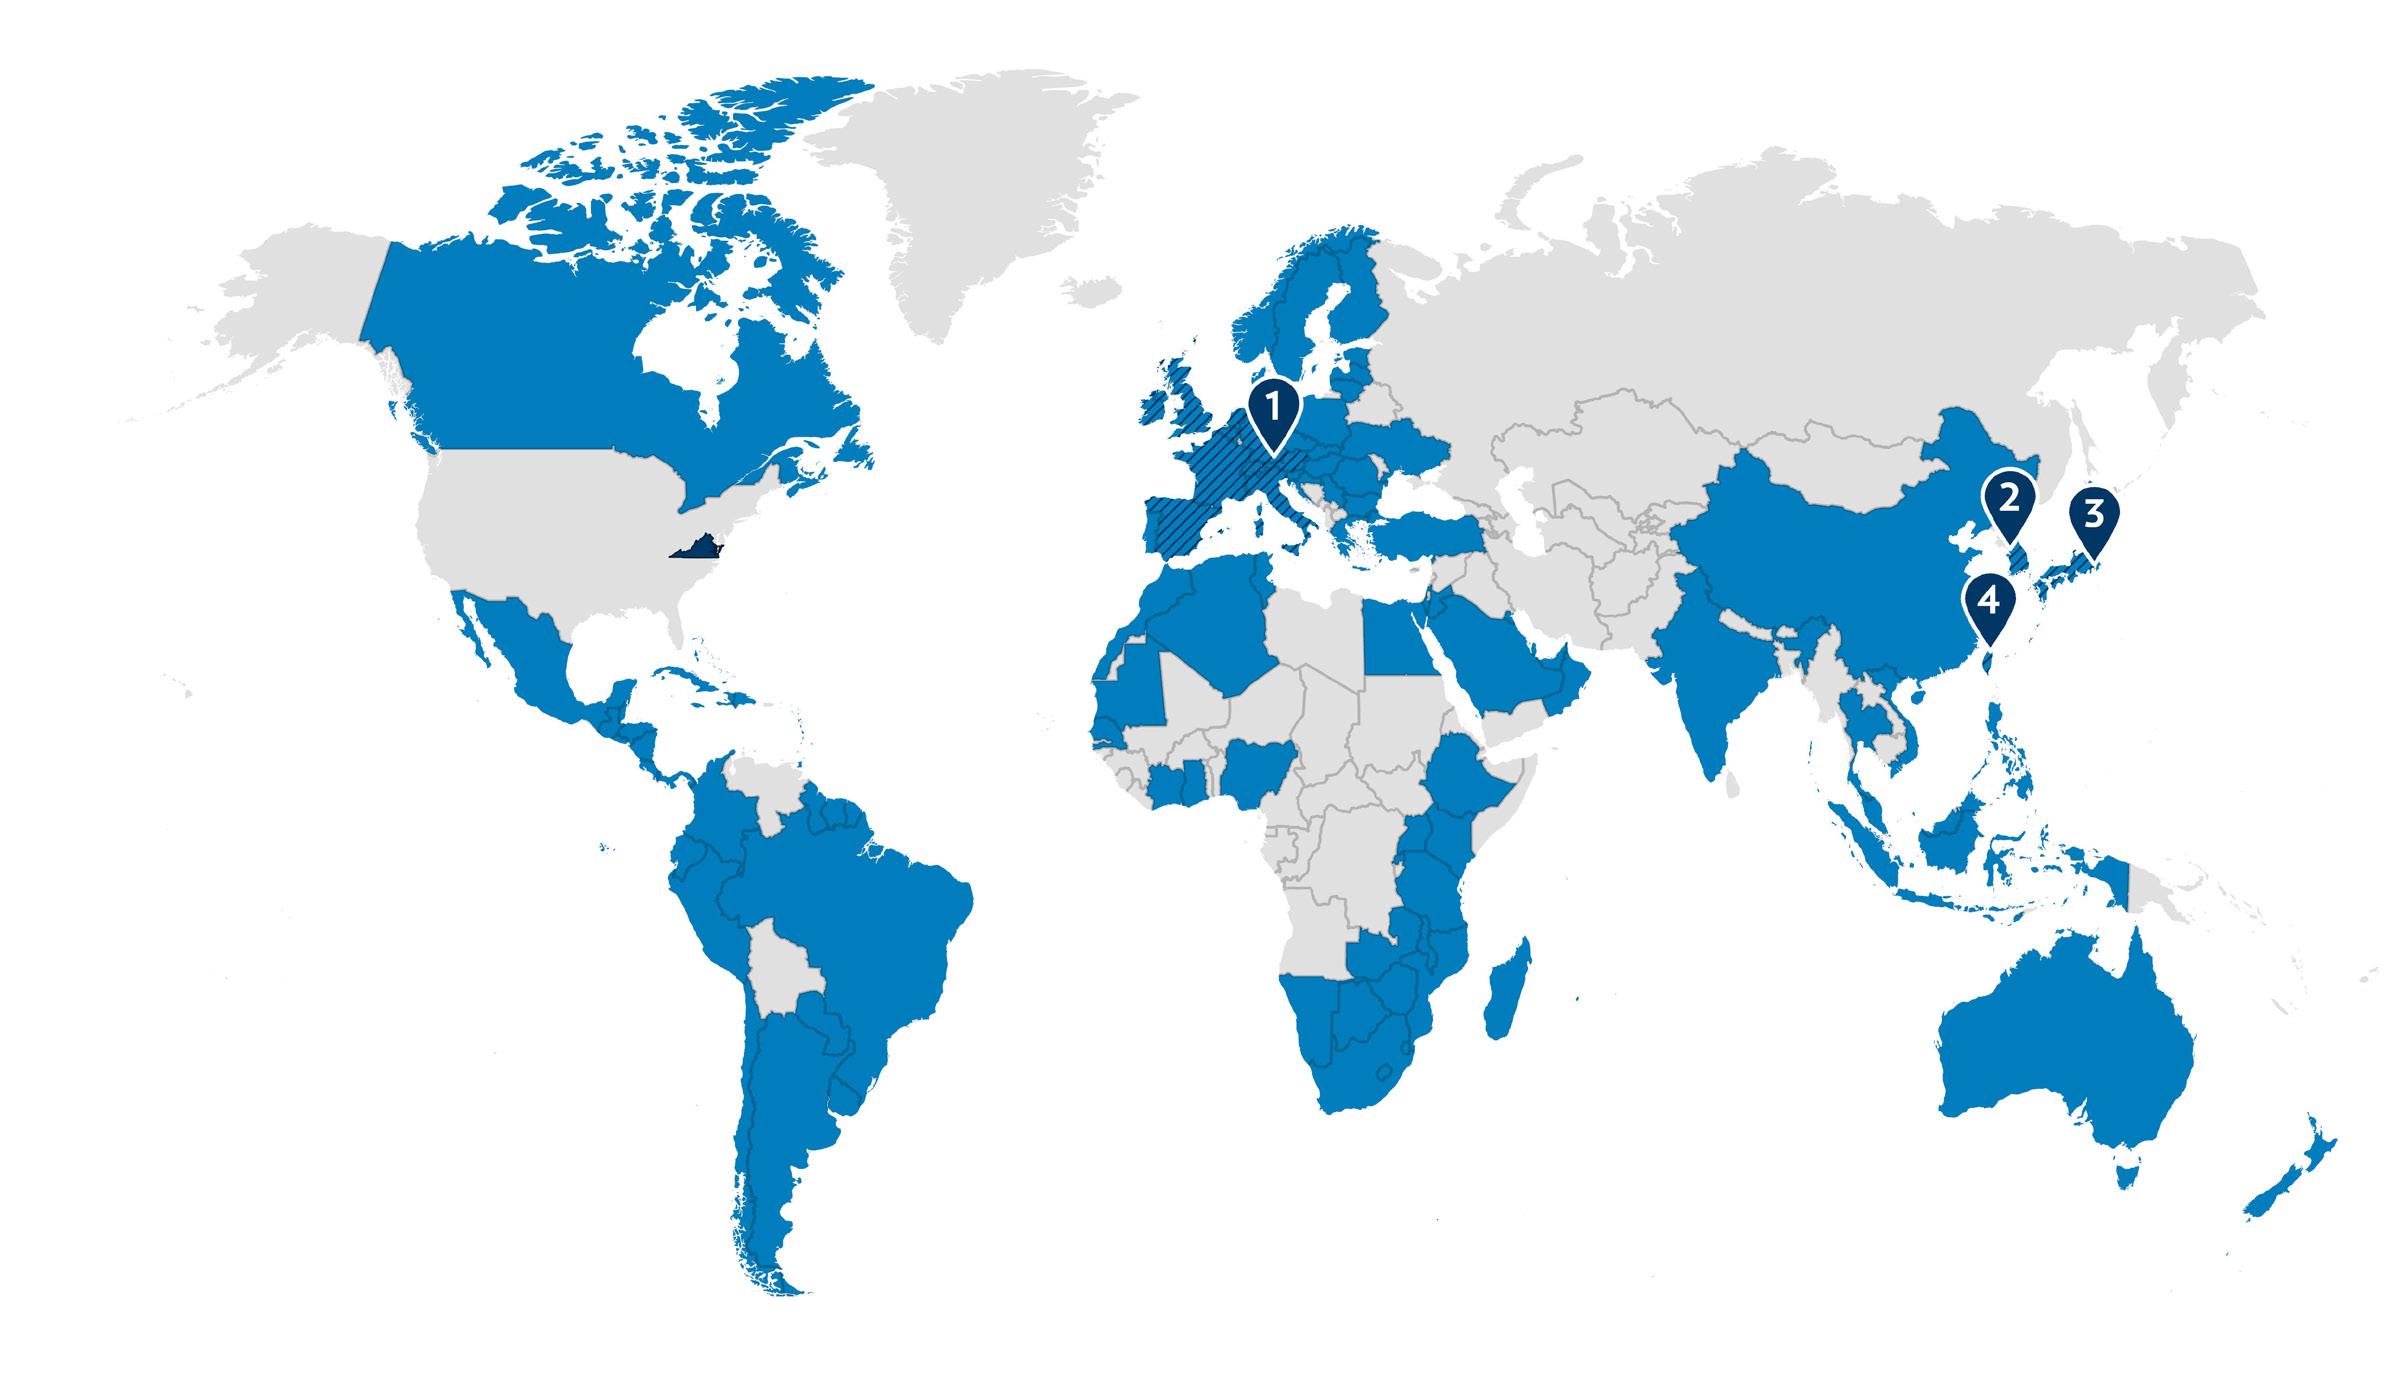


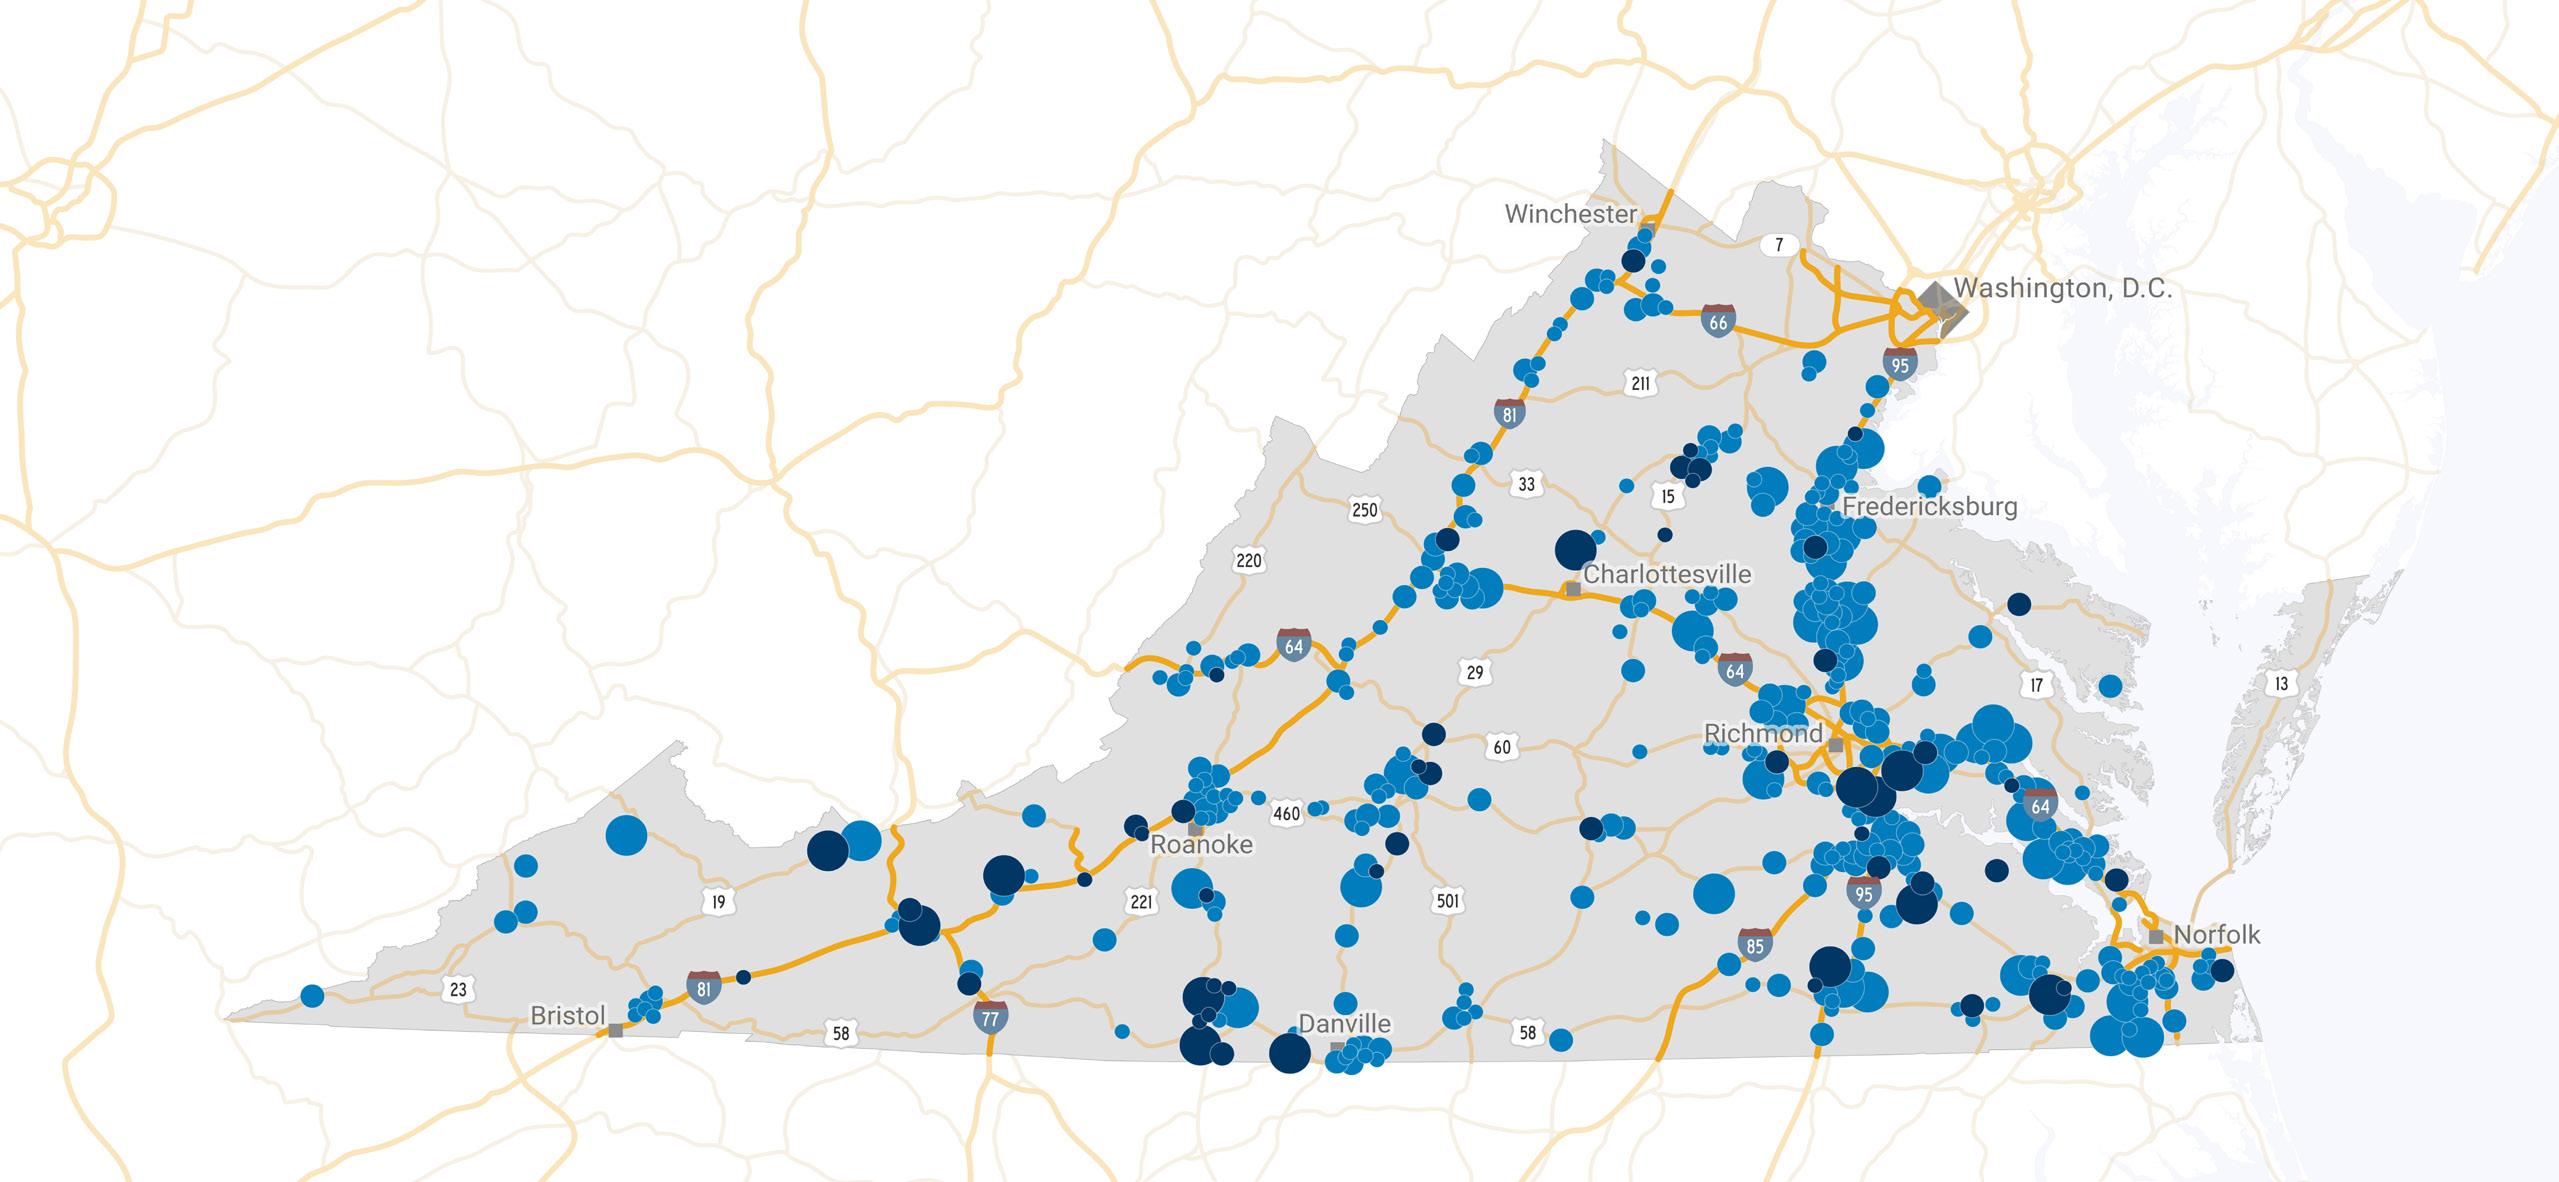
VEDP’s international business investment offices implement lead generation strategies to identify and convert high-potential foreign direct investment leads and prospects into project opportunities for Virginia. Korea


VEDP's network of international research consultants covers more than 123 countries around the world. These experts provide in-country market research for Virginia exporters, specific to the needs and opportunities for each company.
VEDP conducts its work in collaboration with hundreds of economic development partners. Core VEDP partners include the Governor and the Administration, Virginia General Assembly, other state agencies, 17 regional economic development organizations, and over 100 local economic development partners, utilities, railroads, and trade associations.


FY23 was a year of successes and new beginnings for VEDP, with Virginia securing the largest capital investment in state history, achieving a coveted workforce development milestone, and embarking upon an innovative, ambitious plan to strengthen the way the Commonwealth approaches economic development.
The historic investment came in January 2023, when Amazon Web Services (see page 50) announced plans to invest $35 billion and create at least 1,000 total new jobs by 2040 to establish multiple data center campuses across Virginia. Months later, as FY23 wrapped up in late June, the Virginia Talent Accelerator Program earned the top spot in the Business Facilities Customized Workforce Training ranking for 2023 (see page 26). All of this took place as VEDP began work on a major new initiative, the Innovative Framework for Economic Growth (see page 40), a new operating model to achieve nation-leading economic performance by leveraging a whole-ofgovernment approach and deeper collaboration with local and regional partners to accelerate Virginia’s core growth sectors: knowledge work, manufacturing, and logistics.
We continue to work collaboratively to position Virginia for a strong economic trajectory following the economic disruptions caused by the global pandemic. As FY23 drew to a close, Virginia posted a labor force participation rate of 66.6%, its highest mark since January 2013. VEDP and its partners are striving to maintain that momentum, drive robust job and wage growth, and leverage all
regions of the Commonwealth in continued economic progress.
This annual report details some of VEDP’s notable accomplishments in FY23, all of which were made possible by the great work and support of our local, regional, and state partners, including Gov. Glenn Youngkin, Secretary of Commerce and Trade Caren Merrick, the Virginia General Assembly, members and staff of the Major Employment and Investment (MEI) Project Approval Commission, The Port of Virginia, the Virginia Chamber of Commerce, the Virginia Economic Developers Association, county and city government leaders, and countless other state, local, and regional economic development partners.
Through a combination of leadership, dedicated staff work, and active support from our partners, VEDP and Virginia have made significant progress toward achieving each of our five transformational goals (see page 57) — despite much of the implementation period occurring against the backdrop of the COVID-19 pandemic. Nevertheless, there is much work left to do, and VEDP’s mission will be more important than ever in the coming years as Virginia works to achieve nation-leading economic growth with every region of the Commonwealth participating in that progress.
Thank you for your interest in VEDP and your support for economic development in Virginia. Together, we are positioning the Commonwealth for a healthy and vibrant economic future.
WILLIAM H. HAYTER Board Chair FY23
JASON EL KOUBI President and CEO

VEDP-assisted project announcements
89 PROJECTS
VEDP, in collaboration with its local, regional, and state partners, had a tremendous FY23. The year’s remarkable performance was highlighted by a recordbreaking $40.8 billion in new capital investment.
10,866 DIRECT JOBS
VEDP-generated leads
$40.8b CAPITAL INVESTMENT
228 LEADS CONVERTED 377 LEADS CREATED
64,000+ 29,000+ 1,400+ 377 124 40
Prospect calls completed by VEDP’s Call Center
Prospects targeted
Prospect meetings conducted by VEDP’s business managers
New leads generated for Virginia
Corporate prospects visited Virginia as a result of VEDP-generated leads
Project wins for Virginia from VEDP-generated leads
VEDP implements partner and client surveys to assist in evaluating project management effectiveness. The program received high approval in FY23.
Project management
Strongly Agree Agree Disagree
Overall average response that VEDP
167
Market research by VEDP staff and a network of incountry consultants helps Virginia exporters access opportunities and market information in more than 120 countries.
121
Trade missions and trade shows place Virginia exporters directly in front of potential international customers, including eight missions hosted by VEDP per year and participation in seven major international trade shows.
107
International Training Program provides access to training and courses on a wide variety of international trade topics such as international marketing, accounting, legal services, and more.
94
State Trade Expansion Program (STEP) offers grant funding for international travel and global marketing activities.
71
Trade Show Program (TSP) provides resources for Virginia exporters exhibiting individually at international trade shows.
61
Virginia Leaders in Export Trade (VALET) Program, a two-year export accelerator program, assists participating companies to develop and implement an international sales strategy utilizing the full range of VEDP’s export development resources.
60
Supply Chain Optimization Program (SCOP) helps companies evaluate and streamline their supply chain management and import processes through counseling, strategy development, and resources to improve performance and reduce costs.
60
Regional Export Program (REP) gives exporters access to a range of VEDP International Trade services and ongoing counseling to reach specific export goals in just one year.
28
Global Defense Program (GDP) is designed to meet the specific needs of exporters in the defense industry and provides participants with access to VEDP’s services to target one or two global markets over one year.
International Trade achieved exceptionally high scores for the quality of its programs and services in FY23.
99%
Companies that were “extremely likely” or “likely” to recommend VEDP’s export assistance programs to other Virginia companies
97%
Companies that rated the quality of VEDP International Trade’s export assistance as “excellent” or “above average”
99%
Companies that were “extremely likely” or “likely” to use VEDP International Trade for export assistance in the future
97%
Companies that say VEDP International Trade helped their company work toward achieving its strategic international goals
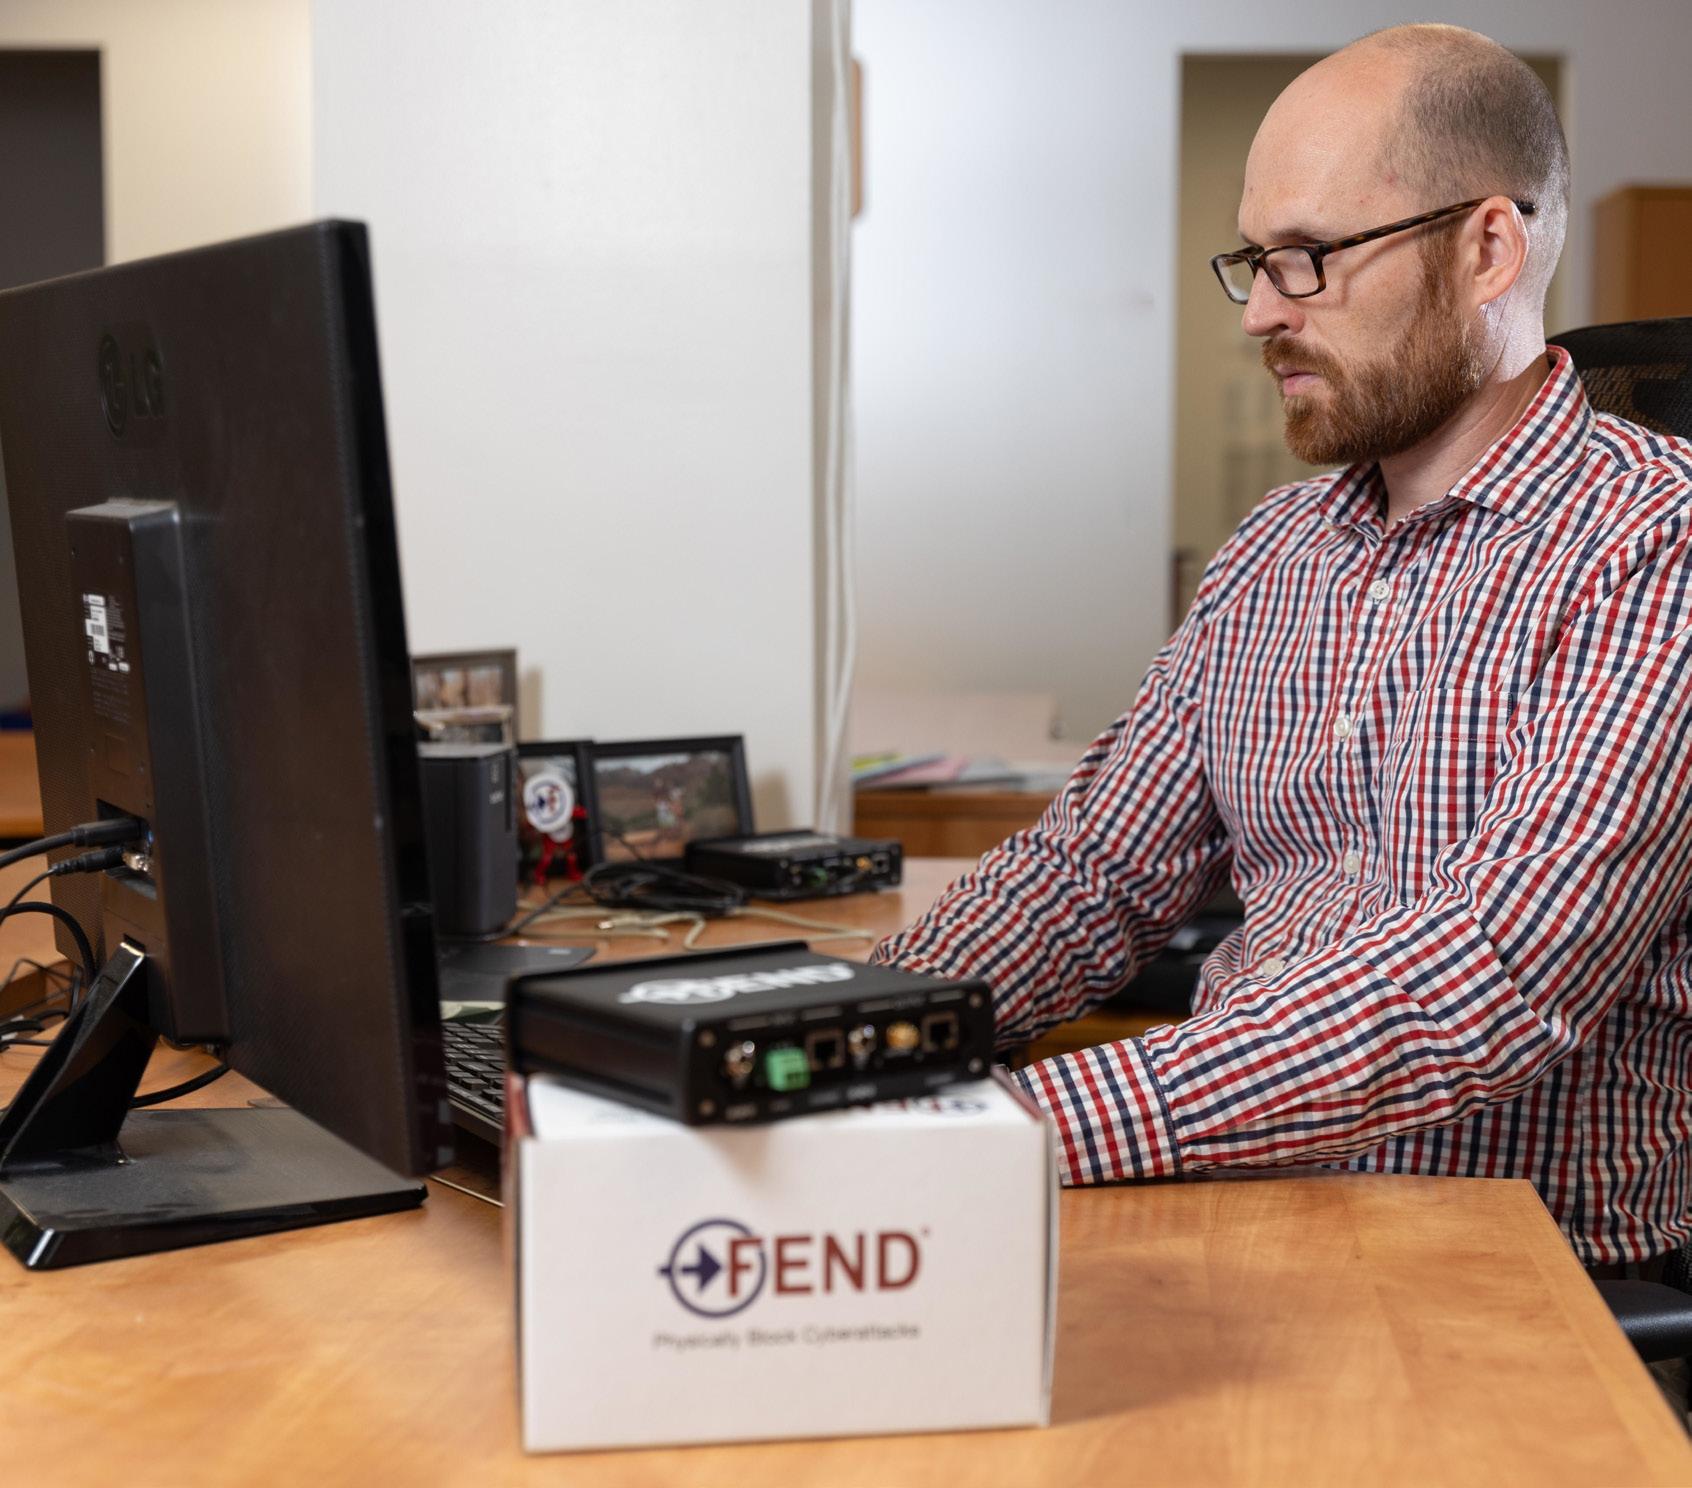
We were very nervous about the ability to meet orders, but now the nervousness is completely gone. We’ve got inventory, we can fill large orders now, and we know that if we get another set of large orders, we’ll be able to fill it.
COLIN DUNN CEO and Founder, Fend Inc.
In FY23, more than 480 Virginia companies utilized VEDP’s export assistance and supply chain optimization programs and services to expand their international sales and meet new customers overseas. These companies reported strong international sales numbers, attributing over $1.5 billion in new or existing sales to their work with VEDP. In total, over 13,000 jobs in the Commonwealth in FY23 can be attributed to the work of VEDP’s International Trade Division.
262
262
Client projects supported with the VJIP incentive
Client projects supported with the VJIP incentive 77
54%
Localities had a VJIP-supported project
Half of VEDP-assisted project wins supported by the VJIP incentive
54%
24
VEDP-assisted project wins supported by the VJIP incentive
$32.37
VEDP-assisted project wins led by the Talent Solutions regional team (projects representing 1,587 jobs and $248 million CapEx)
Average hourly wage for VJIP projects
4,873
Jobs supported by VJIP projects
$951 M
Capital investment for VJIP projects
100%
FY23 VJIP Client Satisfaction Survey respondents "strongly agree" or "agree" that VJIP contributed to their growth and success
VEDP’s Regional Talent Solutions and Business Outreach team meets with Virginia businesses in collaboration with our local and regional economic development partners to foster relationships with companies that drive Virginia’s economy and highlight existing business needs, particularly around talent. These efforts uncover challenges that might cause businesses to consider relocating, identify potential growth opportunities, and cultivate supplier ecosystems domestically and internationally. Workforce challenges (quantity, quality, and/or retention) were the dominant concern across all industries and in all regions.
415
Existing business outreach visits (61% manufacturing sector; 12% professional, scientific, and technical sector; 7% supply chain management sector (transportation, warehousing, and wholesale trade); 20% other)
552
Consultative services delivered, including 361 connections with partner organizations
69%
Businesses visited had an optimistic business outlook

Frank Williams joined Mack Trucks, Inc., in Roanoke County in 2020 as a product auditor after 20 years working mostly on his own at another auto manufacturer. That work history left him uncomfortable leading a team. In 2021, a member of Mack’s leadership team suggested he take a leadership course at Virginia Western Community College (VWCC) funded through the Virginia Jobs Investment Program. Frank was promoted to process quality associate in 2022 and continues to work toward his associate’s degree in mechatronics at VWCC.

FRANK WILLIAMS
Process Quality Associate, Mack Trucks Roanoke Valley Operations

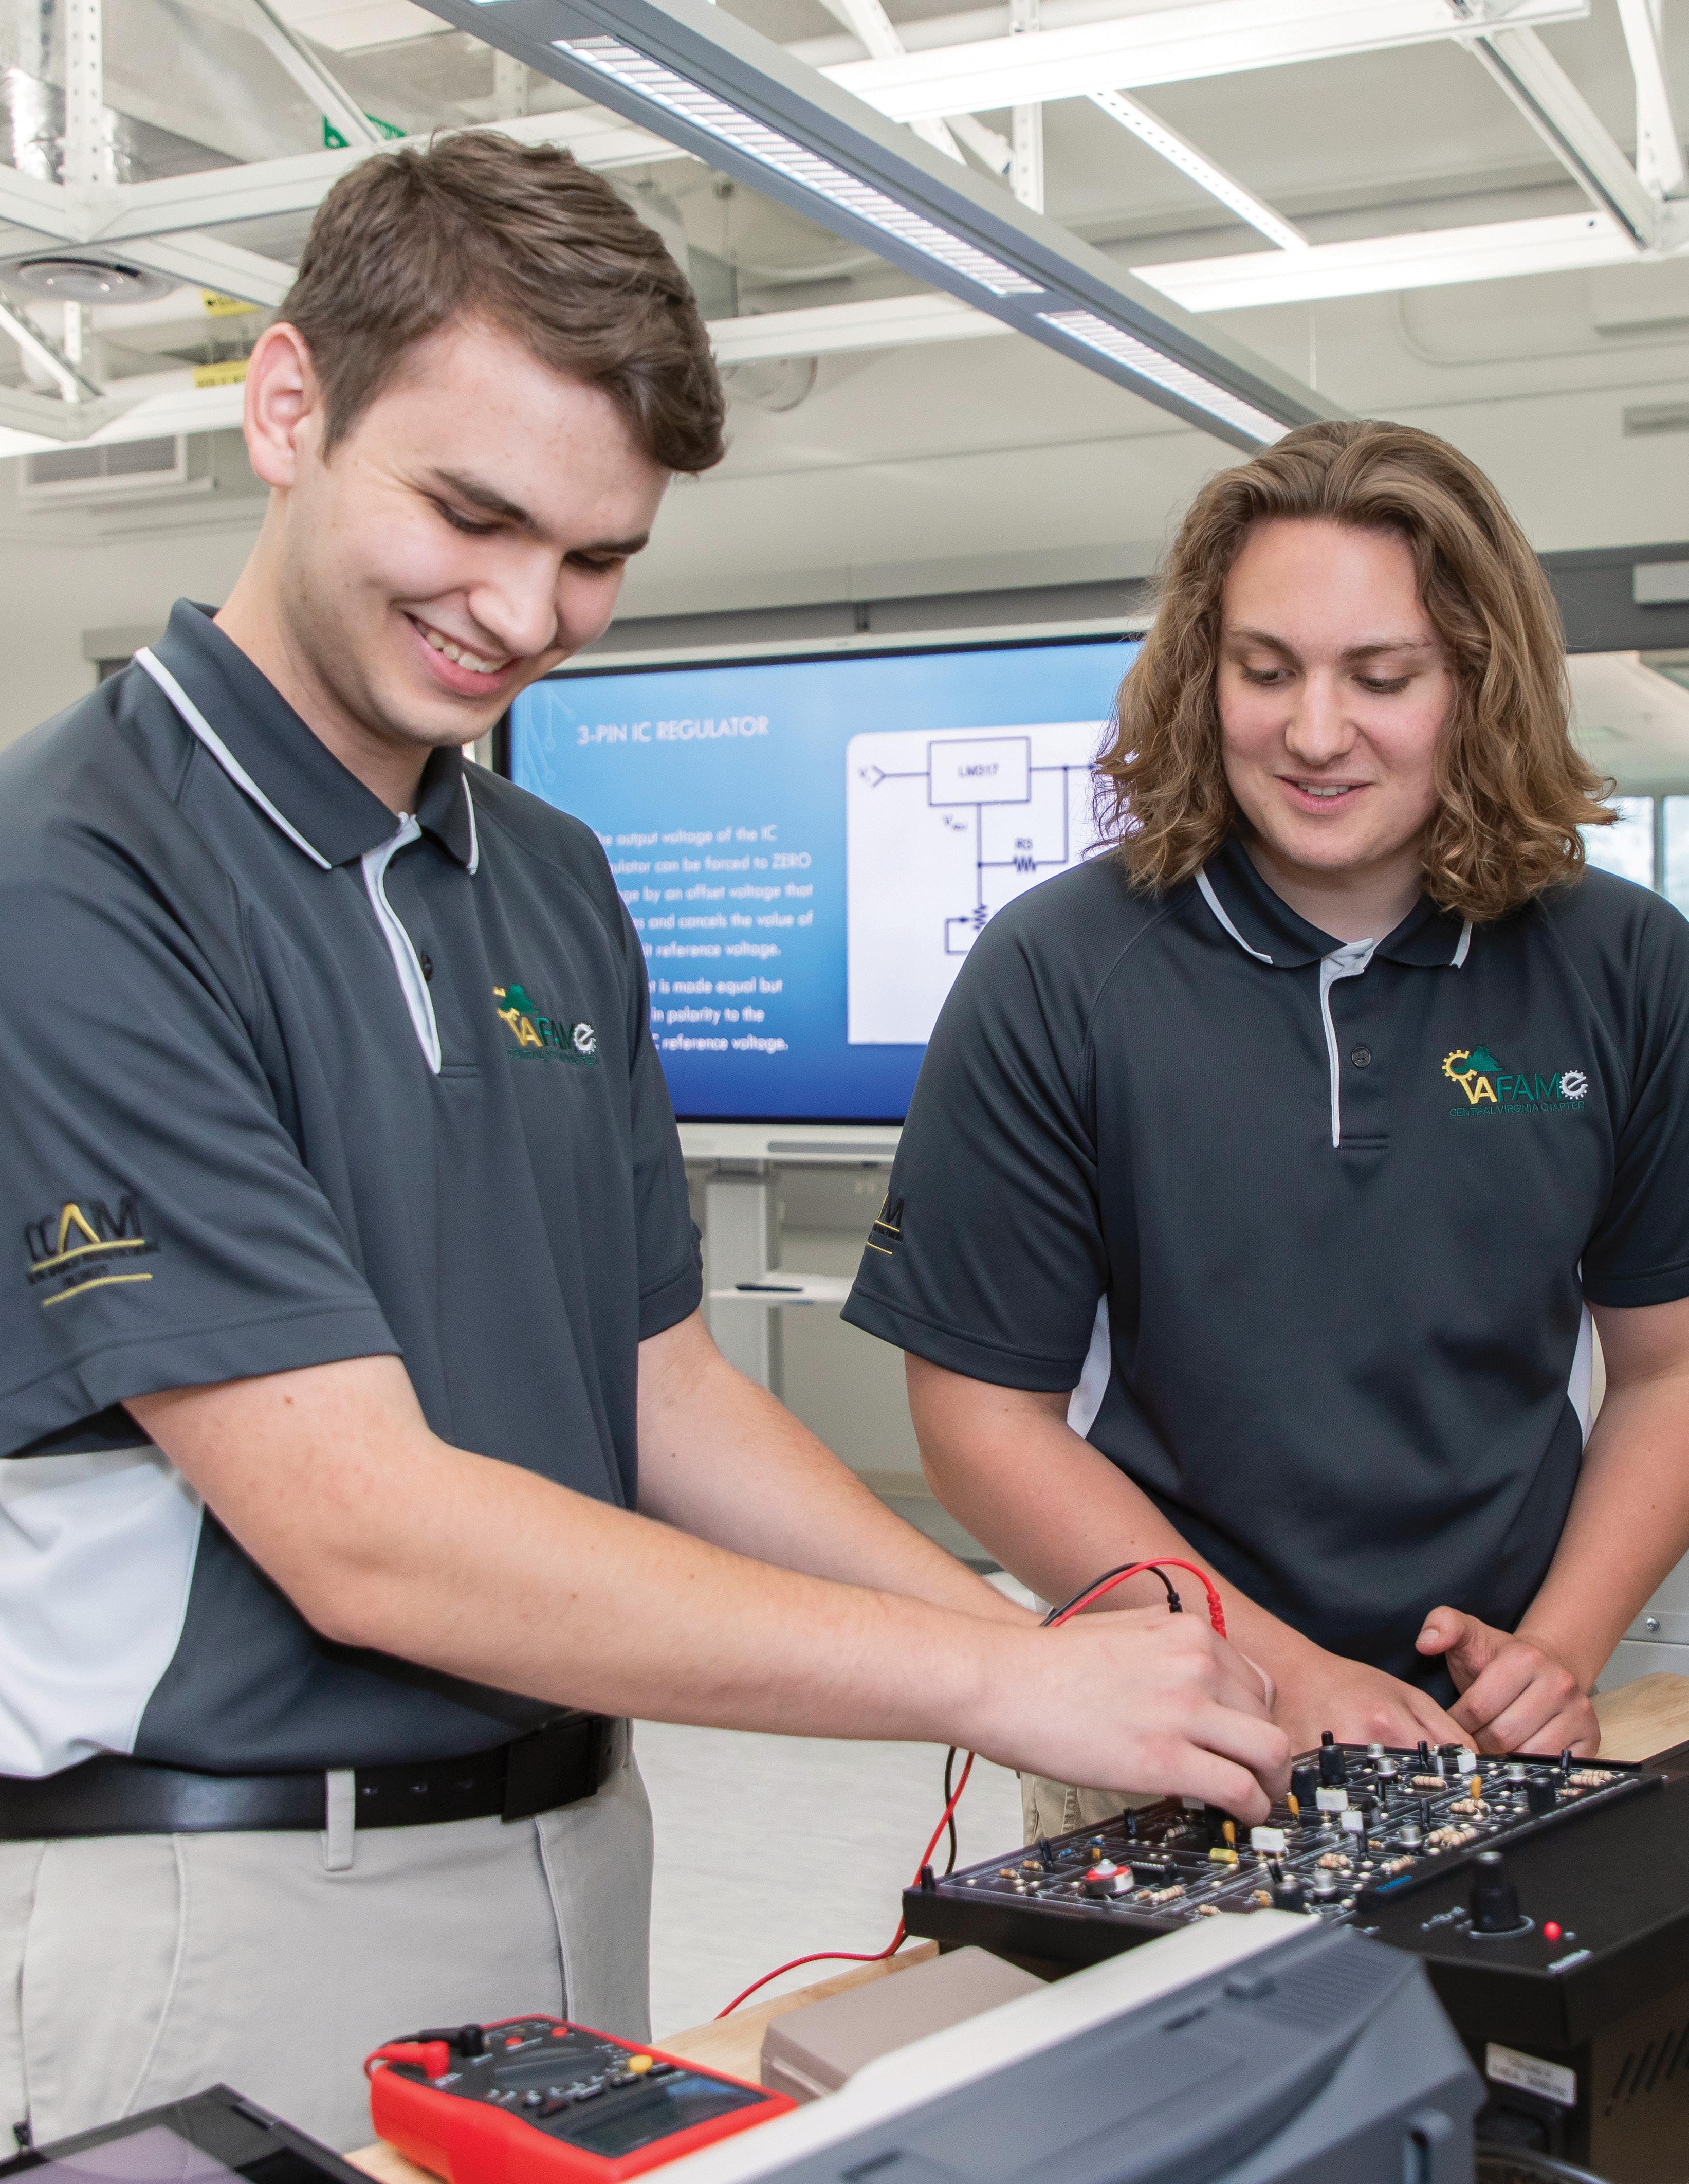
The Virginia Talent Accelerator Program accelerates facility startups and expansions by expediting recruiting and shortening the new-hire learning curve through highly customized services. The program’s innovative approach to supporting job creation projects earned Virginia the top spot in Business Facilities’ Customized Workforce Training rankings for 2023.
In FY23, the program helped the Commonwealth continue to capture the reshoring wave of manufacturing to the United States. Talent Accelerator projects from FY23 featured multiple electronics equipment manufacturers, part of the more than 11,000 jobs across Virginia that the program has helped secure since its launch in 2019.
Delta Star, Inc., the largest, American-owned medium transformer manufacturer in the United States and the premier manufacturer of mobile transformers in North America, will invest $30.2 million to expand its manufacturing and headquarters operation in the City of Lynchburg, creating 149 new jobs.
The Virginia Talent Accelerator Program also helped secure the expansion of German company Weidmüller Group, a provider of smart industrial connectivity products and solutions that connect and automate electrical power and signaling for components, machines, and installations worldwide, which will create more than 100 jobs in Chesterfield County. Another German company, Zollner Elektronik AG, one of the world’s largest manufacturing service providers for electronic and mechatronic components, will invest a combined $18 million to expand in Danville and Loudoun County, growing its market presence in the U.S. and creating 100 new jobs.
On all three projects, the Virginia Talent Accelerator Program’s work began immediately with the development of highly customized recruitment websites that feature the career and lifestyle opportunities unique to each company’s Virginia
location. The Talent Accelerator team also produced recruitment videos designed to give interested job candidates a peek inside each company, showcasing everything from their processes to what has inspired people to build a career there. This work was completed in the weeks between each company’s official commitment to Virginia and the Governor’s announcement. The Talent Accelerator’s signature best practice is to have all assets and a strategic ad campaign in place and ready to go live at the time of the announcement to leverage the publicity generated and capture talent for the future job openings.
The results have been impressive: the average response time between the public announcement and registration of the first applicant is 18 minutes. Delta Star, Weidmüller, and Zollner all saw hundreds of new applicants within a matter of weeks. This recruiting support is just the beginning. The Virginia Talent Accelerator Program will create training fully customized to each company’s unique processes, equipment, and procedures. Customized training for Delta Star will range from an overview of transformer assembly to 3D animations showing what happens deep inside a sealed transformer, all produced by the Talent Accelerator’s in-house team of illustrators. For Zollner, this can cover everything from multimeter calibration to the use of surface-mount technology in the production of printed circuit boards.
The Commonwealth of Virginia offers a unique set of advantages … along with exceptionally well-executed and supported workforce development and recruitment.
JASON GREENE CEO, Delta Star, Inc.

The LEGO Group is one of the high-profile clients of the Virginia Talent Accelerator Program, recently named the top customized workforce training program in the country by Business Facilities. Talent Accelerator services for the LEGO Group included a customized recruitment website that drew more than 3,000 job candidates within 36 hours and customized recruitment and training services delivered by Brightpoint Community College and the Community College Workforce Alliance.

KERRELL BRYANT
Senior Talent Consultant, The LEGO Group

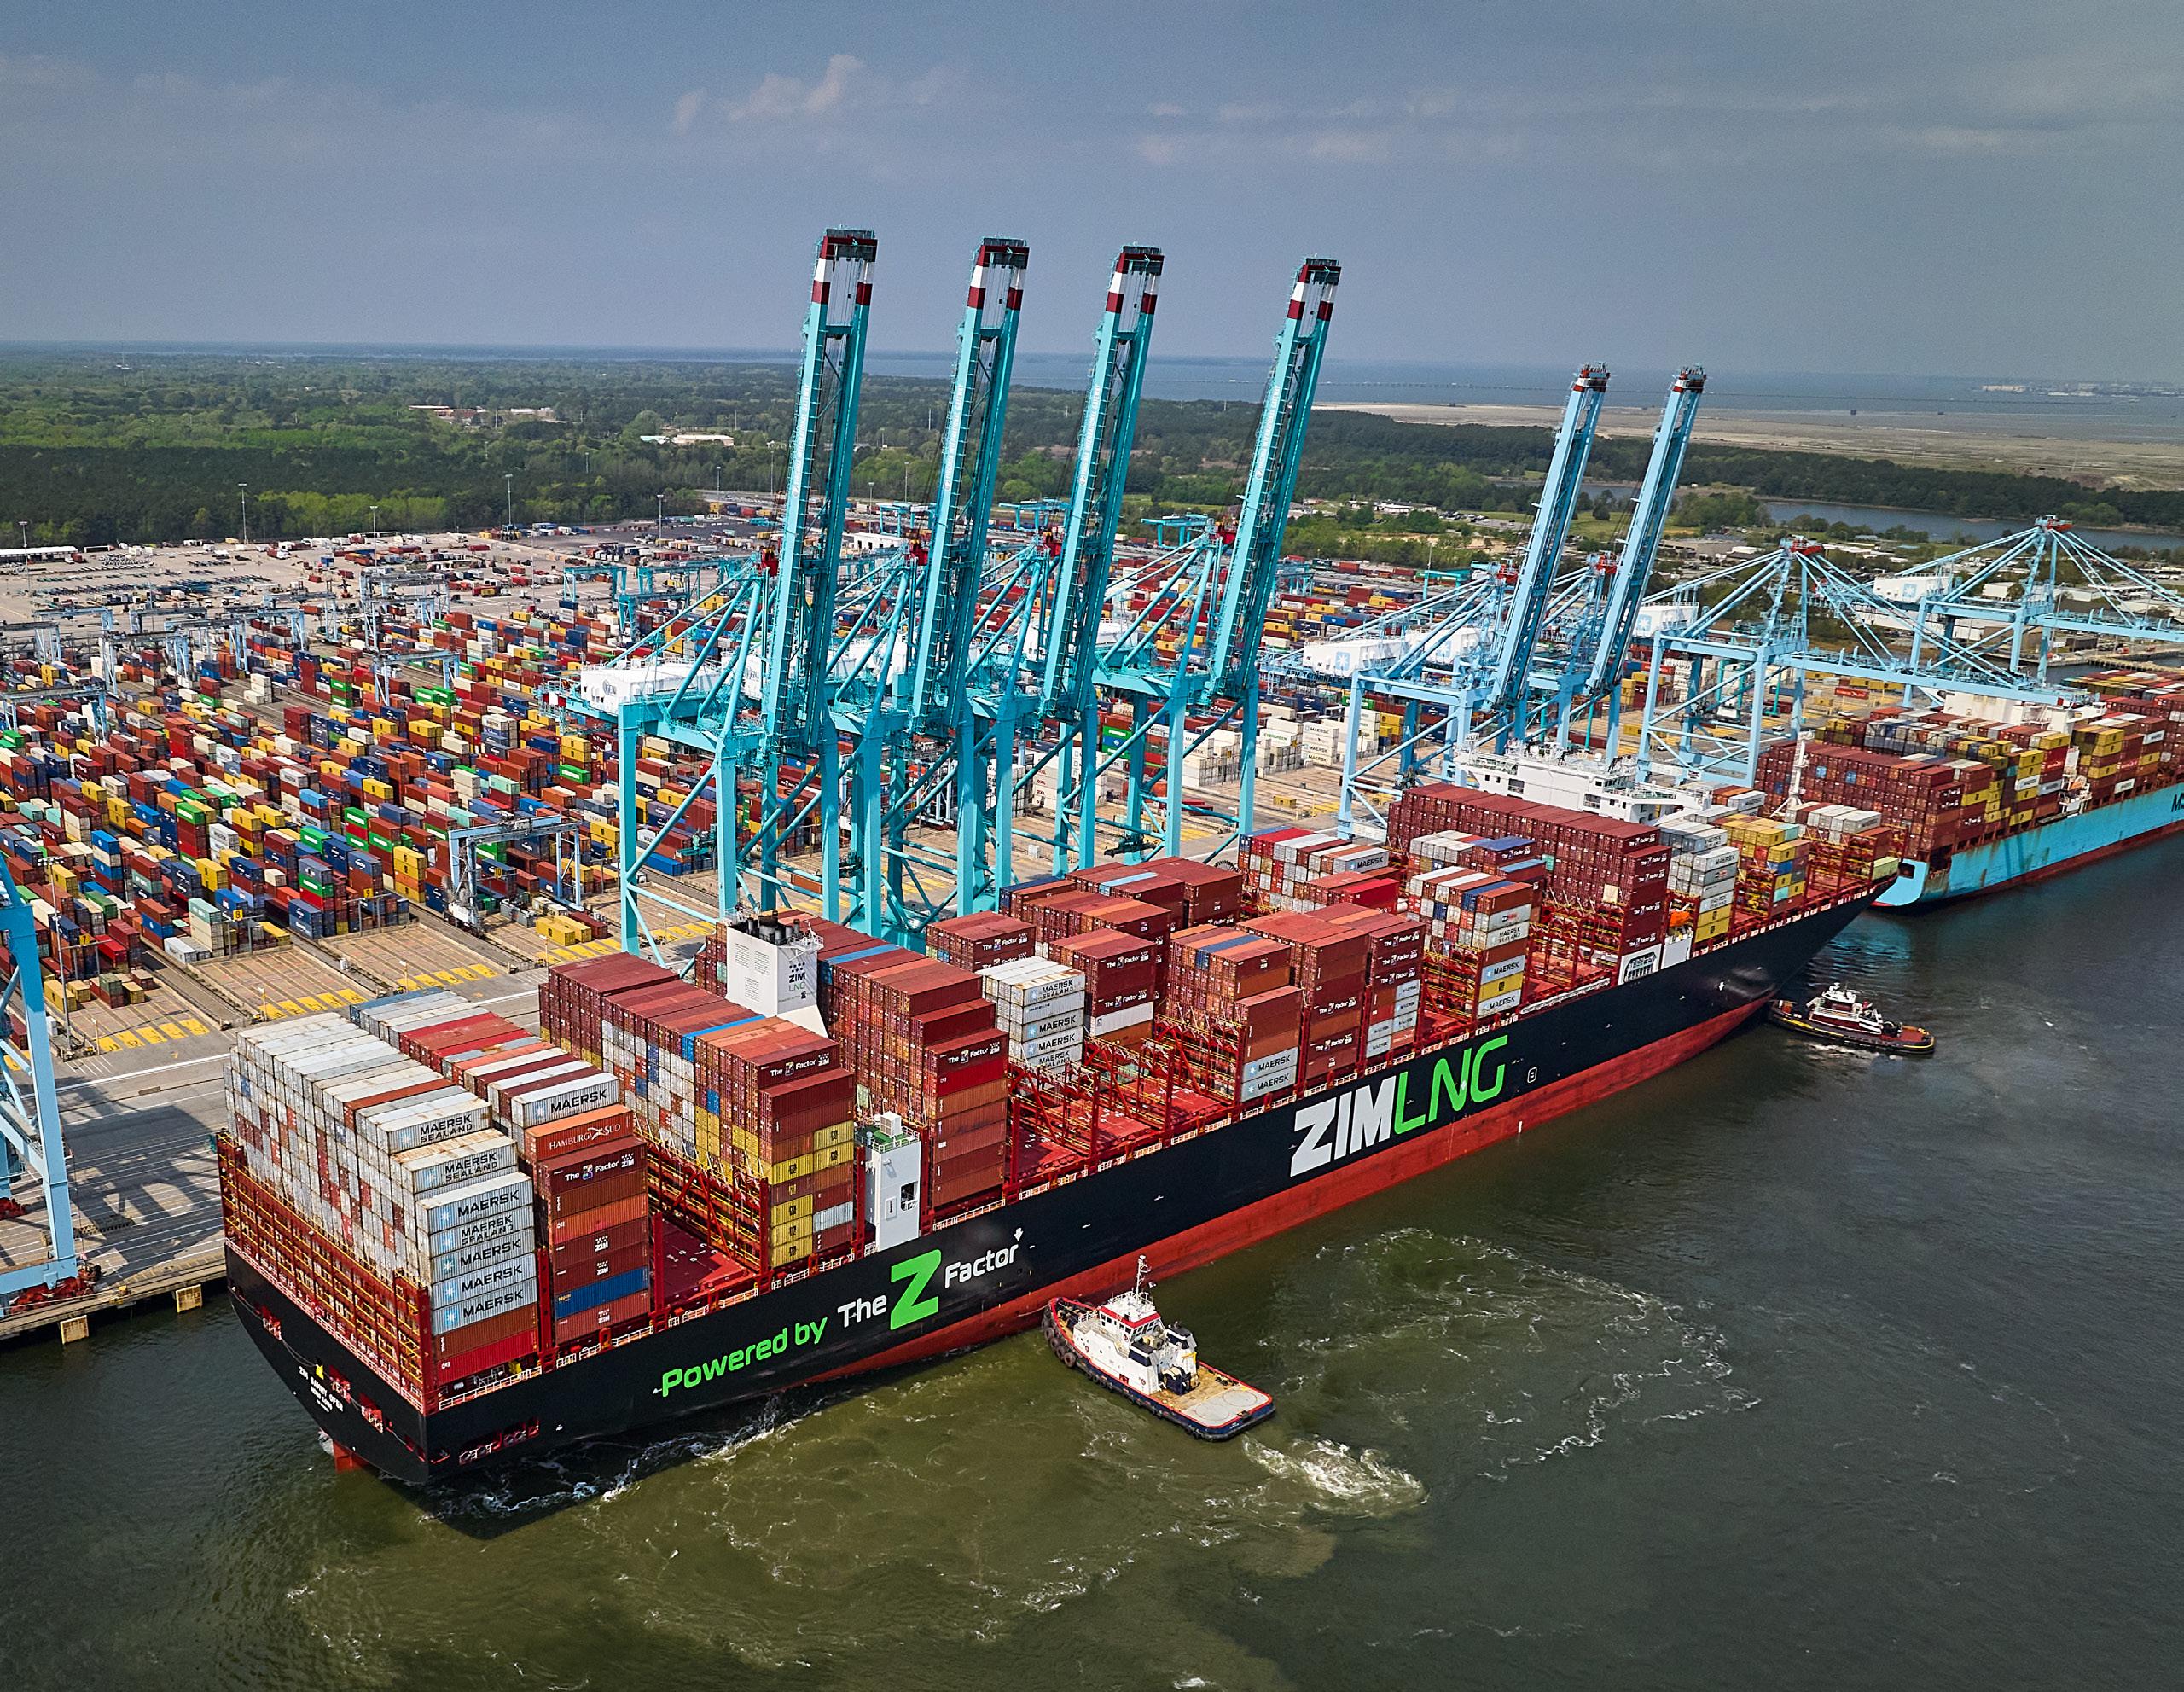
Two seemingly unrelated companies are proof of concept for a program with the potential to transform supply chain operations for Virginia companies. Fend Inc. is a small cybersecurity provider that ran into supply issues during the depths of the COVID-19 pandemic. Somic America is a large auto parts manufacturer that wanted to build supply chain resiliency in case of future disruptions.
Fend and Somic are two success stories from VEDP’s Supply Chain Optimization Program (SCOP), believed to be the country’s first state-led supply chain assistance program. SCOP is designed to help Virginia companies evaluate and streamline their supply chain management and import processes through counseling, strategy development, and resources to improve performance and reduce costs.
Based in Arlington County, Fend makes products that protect critical infrastructure from cyberattack. The company got through the early portions of the pandemic without major issues, but supply chain shortages eventually caught up to them as key components came into high demand from other companies in similar situations. As founder and CEO Colin Dunn put it, “Designs assume an infinite supply of everything you ever needed,” and the company suddenly needed to build resilience into its operations.
Somic, located at the intersection of Interstates 81 and 77 in Wythe County, depends on infrastructure and friction-free logistics operations to keep its products moving. Jeff Dunnack, the company’s general manager of supply chain management, helped keep the company moving during the pandemic and the associated freight and trucking backups, describing the effort as “fighting a losing battle,” and thought SCOP could provide an outside perspective on what the company could do better.
Through VEDP and SCOP, Somic engaged with a management consulting partner, which helped the company work with its suppliers to develop more meaningful key performance indicators. In addition
to the material changes based on the engagement, Somic has benefited from improved relationships with its suppliers as a result of the planning work done together.
Those improvements have resulted in quantifiable outcomes. In 2022, Somic missed a dozen shipments from suppliers. In the first half of 2023, the company reported just one missed shipment, the result of circumstances beyond the control of Somic or the supplier in question.
Fend, meanwhile, also benefited from increased transparency in its supplier relationships. SCOP helped leadership develop methods to get priority for components and expedite deliveries, but just as valuable, the company came away from the process with greater understanding of the nuance of the supply chains for its key components — and the company made it through the pandemic without having to turn down an order based on supply concerns. Taken together, Fend and Somic serve as proof of concept for how SCOP helps companies evaluate and streamline their supply chain management and import processes.
During COVID, we purposely built up our raw material inventory to try to protect us from missed shipments. Working with our suppliers through this program, we’ve been able to reduce that raw material inventory by 25%, which frees up cash, which makes everybody happy.
JEFF DUNNACK General Manager of Supply Chain Management, Somic America, Inc.


Anne Vaughan Designs in Floyd designs and creates handcrafted jewelry collections that can be found online at AnneVaughanDesigns.com as well as in unique boutiques and stores both in the United States and international markets.
Interested in growing their export sales through e-commerce channels, the company turned to VEDP International Trade for assistance in developing their international digital marketing strategy and updating their website to better target and convert international leads.

AARON VAUGHAN
Co-Founder, Anne Vaughan Designs
VEDP analysis showed that a lack of prepared sites cost Virginia more than 52,000 direct jobs and $120 billion in capital investment between 2016 and 2022. Industrial projects looking for sites larger than 250 acres represent the majority of potential industrial jobs and more than 75% of potential capital investment.
As of October 2022, just 9% of the properties in Virginia’s real estate portfolio were classified as Tier 4 (project ready) or above, with more than half of the Commonwealth’s sites classified as Tier 1 or 2 — years from potential consideration for economic development projects. In coordination with state, regional, and local partners, VEDP is accelerating its work to close that gap through targeted investments in Virginia’s sites inventory aimed at helping the Commonwealth compete for these projects.
In 2021, VEDP established the Real Estate Solutions Division to build on the progress made through Virginia’s first-in-the-country site characterization initiative, which evaluated more than 460 sites of 25 acres or more across the Commonwealth. This team analyzes, develops, and implements solutions to address the sites and buildings needs of economic development projects across Virginia.
The Real Estate Solutions Division also administers the Virginia Business Ready Sites Program (VBRSP), which helps characterize and develop sites to enhance the
Size and certification status of sites across Virginia
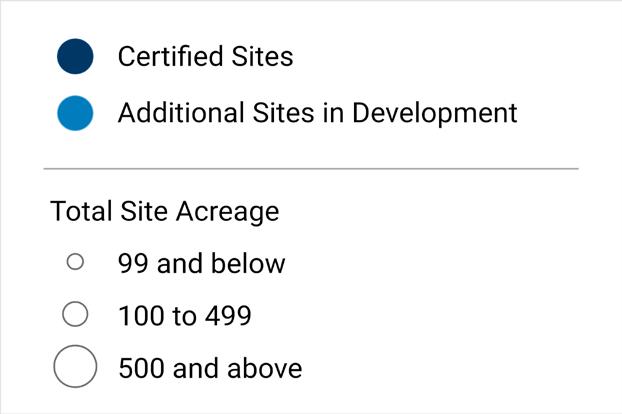
Commonwealth’s infrastructure with more competitive project-ready sites and attract new business and expansions. The program’s goal is to identify, assess, and improve the readiness of industrial sites with at least 100 contiguous, developable acres or 50 acres in the western part of the Commonwealth. Localities can apply for grants to assist with the costs associated with the initial assessment and the development required to increase a site’s current Tier designation level.
In January 2023, an unprecedented $90 million in VBRSP development grants was announced for 21 sites across Virginia. Thanks to the Governor, his administration, and General Assembly members making the investment a priority, the VBRSP is now strengthening the Commonwealth’s infrastructure and driving economic growth.
The VBRSP team is actively working to prepare these sites for future economic development projects. VEDP’s new Site Development Task Force, which includes government and utilities partners, complements VBRSP by coordinating other activities that are key to advancing sites to a project-ready stage. The Task Force will help fast-track development timelines and enhance Virginia’s portfolio of viable sites, helping the Commonwealth build on existing momentum and continue to make progress on site development.
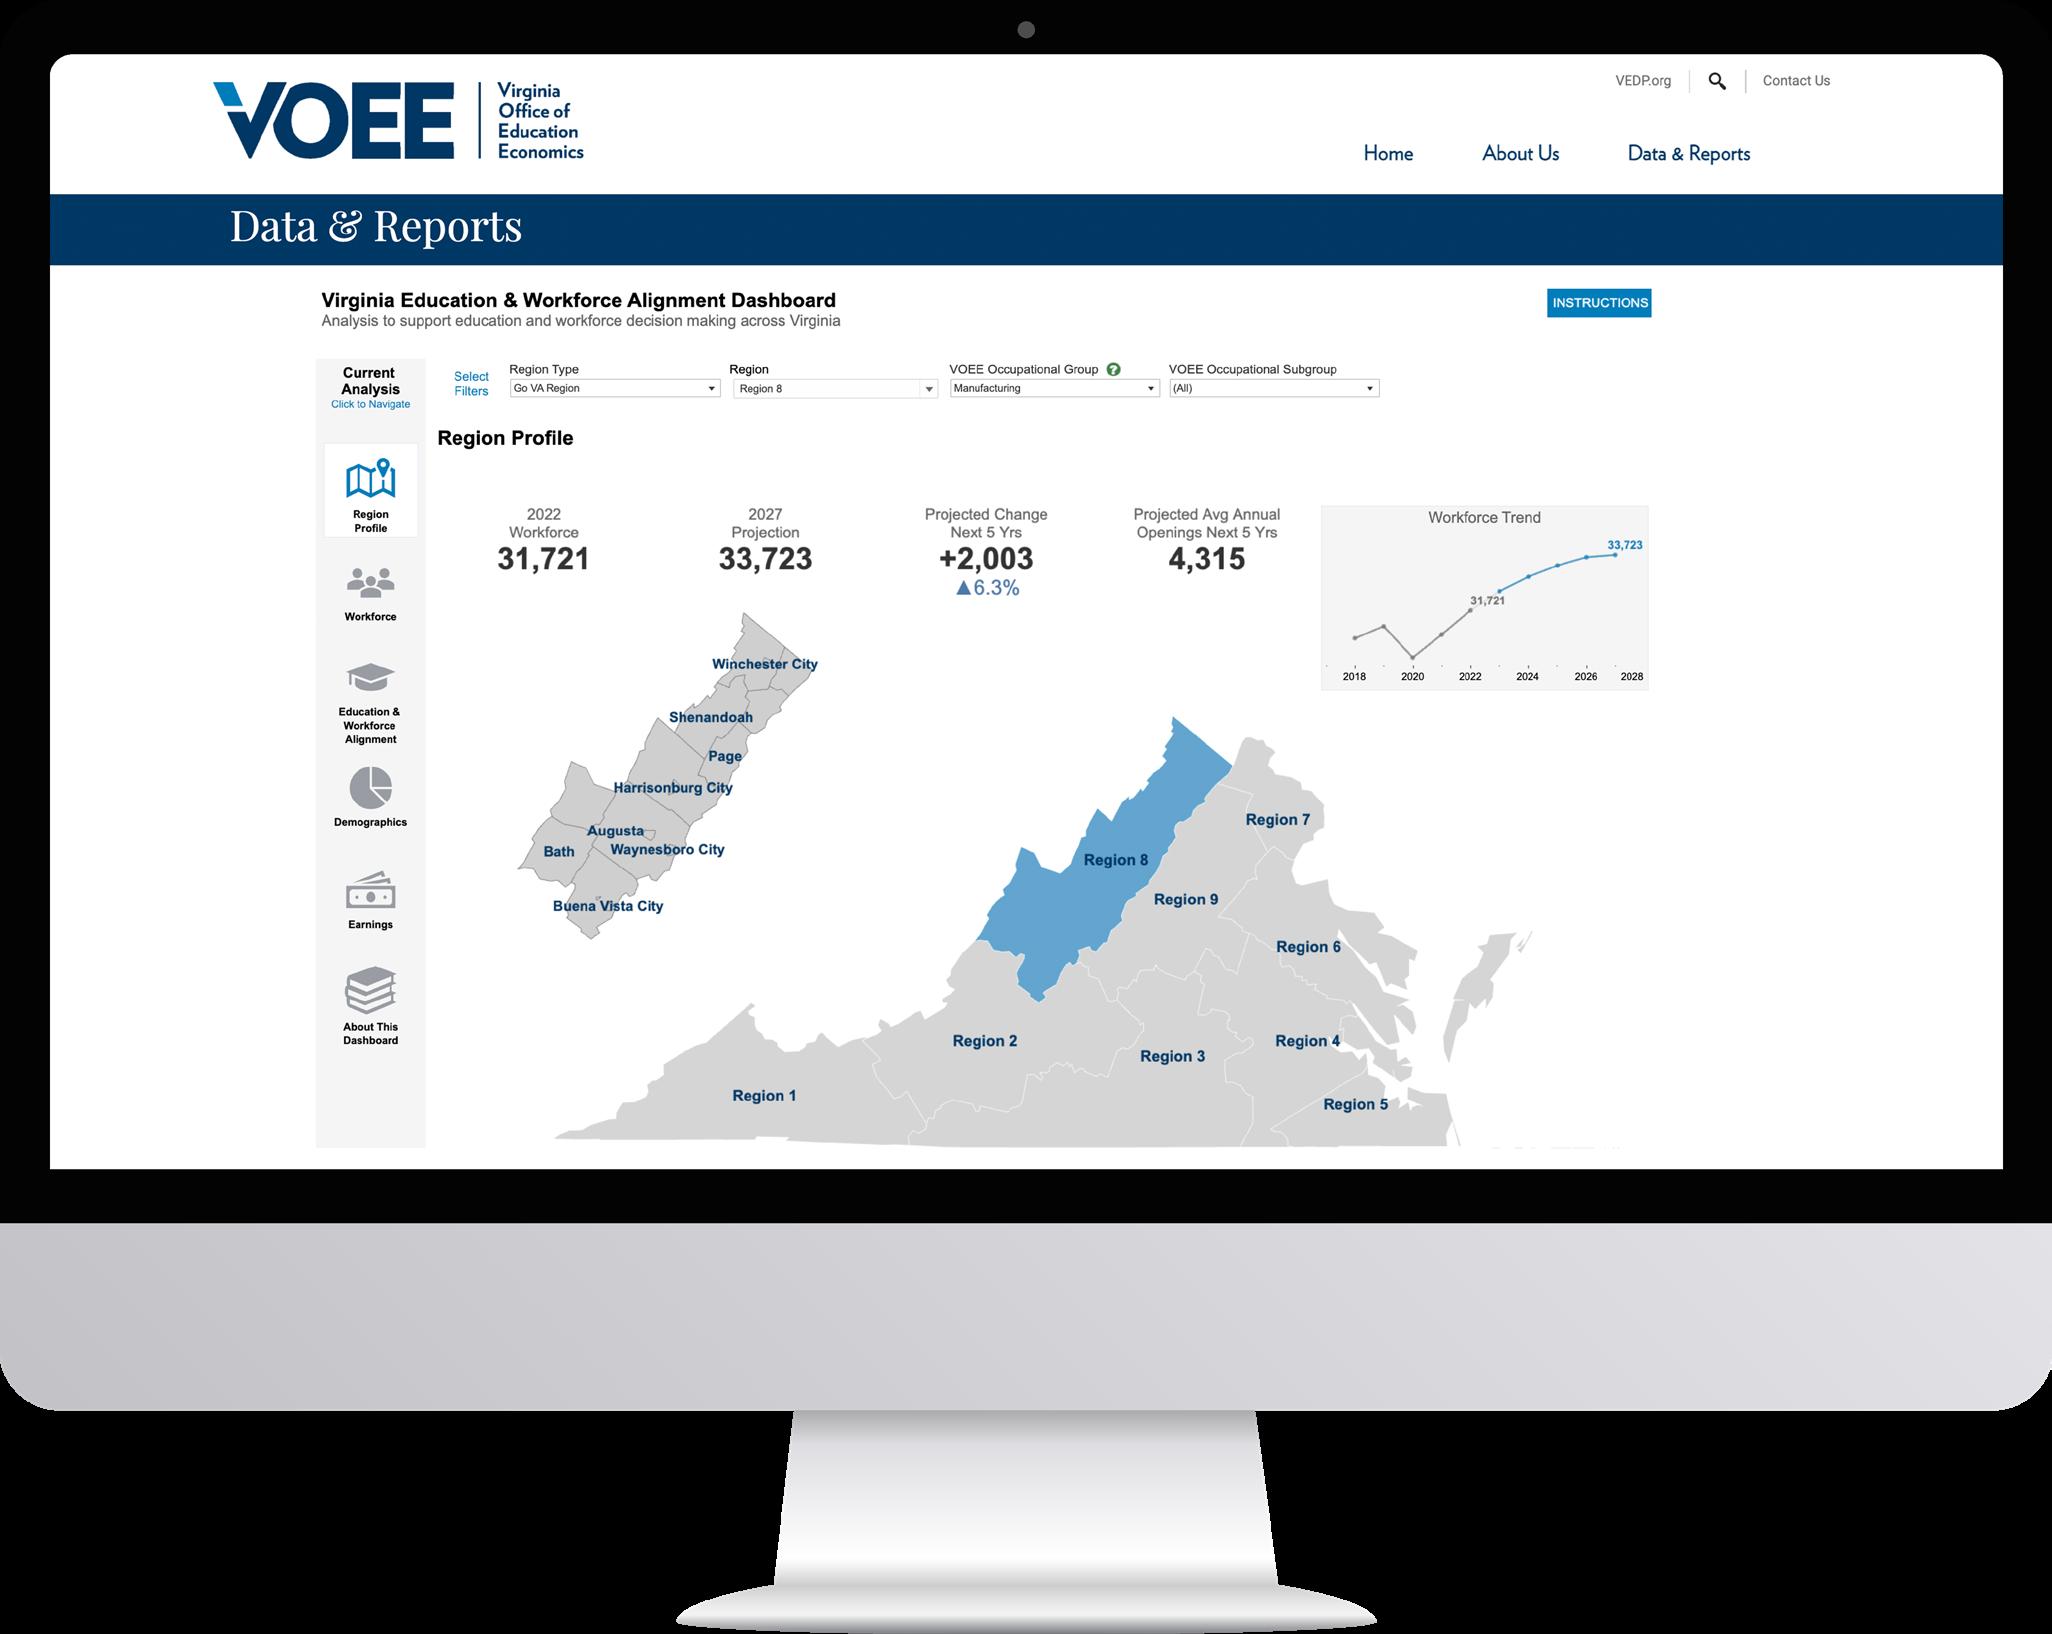
Virginia is developing groundbreaking insights in the connections between education and the labor market to unlock the potential of the Commonwealth’s workforce. The desire to improve employment outcomes for Virginians drove the creation of the Virginia Office of Education Economics (VOEE), established in 2021 to provide a unified, consistent source of information and analysis on linkages between education and employment outcomes. VOEE’s mission is to leverage data to inform educational programming, policy, and workforce partnerships across the Commonwealth.
In developing its priorities, VOEE realized that there was no one-stop shop for data on the intersections between education and employment. The first-ofits-kind Virginia Education and Workforce Alignment Dashboard was developed to provide that information and support the office’s mission. The dashboard, currently in the beta stage, aggregates data around state and regional workforce dynamics for key industries to help inform policy development and implementation related to talent development. The dashboard integrates data from multiple sources, including the State Council of Higher Education for Virginia, job postings, and other sources.


The dashboard allows users to specify their criteria by geographical area and various occupation categories, providing a holistic look at the workforce in a particular occupational group or career cluster. Users can further analyze the data through the lenses of educational programming, workforce projections and alignment, job postings, demographics, and graduate earnings, as well as focus on a specific occupation at the regional and state levels and assess supply, demand, and underlying workforce dynamics.
While the dashboard is not predictive, policymakers can use its insights to estimate whether the labor pool is likely to be sufficient to fill future needs and make informed decisions on how to manage the availability of qualified workers. The data can be used to evaluate funding streams and provide direction as to how various agencies and partnerships make new investments to prepare the future workforce, or to look closely at bigger-picture issues like the supply of education programs around a particular occupation, diversity in pre-career programs and how that affects the workforce, and whether a need exists to recruit more aggressively in a particular field.
Learn more at www.voee.org/data/


Virginia Post-Secondary Completion Dashboard
The Virginia Post-Secondary Completion Dashboard offers a comprehensive look at student enrollment and degree completion data from colleges and universities affiliated with the State Council of Higher Education for Virginia (SCHEV).
Education and Workforce Alignment Dashboard
The Education and Workforce Alignment Dashboard provides insights into how Virginia's higher education institutions align with job demands across different geographic regions. Users can view data through four regional lenses and choose from 120 VOEE occupational groups.
Job Posting Analytics Explorer
The Job Posting Analytics Explorer is a dashboard that provides users the ability to research the most recent 12 months of online job postings in a region based on a selected VOEE occupation group.
Jillian Ylagan studies computer science at Virginia Tech, helping to fill the talent pipeline in a growing field in Virginia and nationwide. Virginia Tech and the Commonwealth’s other higher education institutions benefit from Virginia’s $2 billion Tech Talent Investment Program, which provides funds for hiring new faculty members, upgrading equipment, labs, and facilities, and attracting diverse students.

JILLIAN YLAGAN
Computer Science Student, Virginia Tech

VEDP and its state, regional, and local partners are implementing a new operating model with the goal of cementing Virginia as a national leader in economic growth. The Innovative Framework for Economic Growth aims to accelerate growth across Virginia by building a model that leverages deep focus, expertise, and collaboration in Virginia’s core growth sectors (i.e., the sectors with the largest employment growth potential over the next several years) in order to attract and expand businesses across the Commonwealth.
This new model is grounded in the Strategic Plan for Economic Development of the Commonwealth, which includes five transformational goals that continue to guide all of VEDP’s work. The Innovative Framework is designed primarily to accomplish the first of those goals: Position Virginia to achieve a growth rate (measured by employment and earned income) among that of the top states in the country.
The Innovative Framework includes three key elements: (1) new dedicated teams at VEDP that provide capacity, expertise, and relationship management for each core growth sector, (2) a deep focus on sector-based ecosystem building activities within each sector to complement Virginia’s traditional strengths in economic development project management, and (3) collaboration across the Commonwealth to align these sectorfocused activities at the state, regional, and local levels for greater impact.
This whole-of-government alignment will enable VEDP, other state organizations, and local and regional partners to take a state-of-the-art approach to accelerate the economic growth of Virginia and all of its regions in these core growth sectors. As Virginia Economic Developers Association President Christina Winn said, “I’m excited for our regions and localities to flex their creative muscles, seizing opportunities to collaborate with industry and stakeholders in fresh, innovative ways.”
Evolving from a more generalist model, VEDP is establishing core sector teams that will provide dedicated focus on knowledge work, manufacturing, and logistics:
Knowledge Work
Business Services
Financial Services
Software & Cybersecurity
Aerospace & Defense Innovation
Manufacturing
Advanced Materials
Food Processing & Manufacturing
Biopharmaceuticals
By establishing these new sector teams, VEDP will be uniquely positioned to provide an in-depth understanding of industry and company needs and develop distinctive solutions that unlock the growth potential of Virginia and all of its regions. The sector teams will take a holistic and proactive approach that will include coordinating whole-of-government initiatives aligned with local and regional economic development partners to leverage ecosystem building (e.g., talent pipelines, infrastructure development, tax and regulatory policy) and develop a pipeline of leads in the core growth sectors.
The Innovative Framework for Economic Growth will complement VEDP’s continued commitment to excellence in other existing functions, including a focus on deal excellence and collaborative engagement with partners across the Commonwealth, to achieve transformational project wins and solidify Virginia’s advantages into the future.

In the 2022 Session, the Virginia General Assembly tasked the VEDP via House Bill 894 to determine whether barriers exist for infrastructure and supply chain investments in Southside and Southwest Virginia. The bill also requested a review of incentives that the Commonwealth and its localities should utilize or develop to retain businesses and promote new infrastructure and supply chain investment.
VEDP’s Economic Competitiveness team immediately got to work, leveraging data from a variety of sources and engaging with more than 50 partners — including local governments, economic developers, regional organizations, academic institutions, nonprofits, private sector companies, and state agencies — to identify existing barriers and provide recommendations on how to address those barriers.
Many of the challenges facing Southwest and Southside Virginia today stem from the decline of four key industries — furniture, textiles, tobacco, and mining. The region has seen a loss of production and employment over the last four decades, beginning in the 1980s. Across Southwest and Southside, over $2.2 billion in Gross Domestic Product (GDP) and 60,000 jobs disappeared from just those four industries alone. Due to the high concentration of these industries in the regions, their loss led to the general decline of the regional population and economies of Southwest and Southside Virginia.
VEDP’s review of barriers to infrastructure and supply chain investment in Southwest and Southside identified five core challenges:
■ Limited economic development staff
■ Lack of available workforce, driven by limited workforce development program capacity, lack of workforce housing, lack of childcare and healthcare facilities, and limited amenities to attract new talent
■ Limited portfolio of prepared sites and buildings
■ Remoteness from key infrastructure
■ Competitive business incentives
Based on extensive input received from community stakeholders, the report’s recommendations address these challenges and highlight priorities for supporting economic growth in Southwest and Southside Virginia, including:
■ Increase capacity in economic development
■ Expand the eligible workforce by supporting housing, childcare, healthcare, quality of life
■ Increase funding and programs related to site and building development
■ Accelerate the development of planned interstates, highways, and expressways
■ Establish new incentives targeting creation of manufacturing jobs
The Southside-Southwest Virginia Report can serve as a model for growth outside the regions and help accomplish Virginia’s goal of positioning all regions of the Commonwealth for sustained economic growth. Rural regions across Virginia are facing similar challenges, all of which can be addressed using this multi-pronged approach that combines efforts to address the underlying barriers and maximize economic growth in the Commonwealth.


Jasper Yeast in Loudoun County was founded by beer industry veterans to provide high-quality liquid yeast for craft beverage producers. The company enrolled in VEDP's Economic Gardening Program in an effort to enhance its marketing efforts and came away with contacts and tactics to support its marketing, lead generation, and future business.

Our goal was to find new ways to effectively target new and current customers. The Economic Gardening Program outlined unique ways we can improve our efforts online, through SEO optimization and strategies to direct more traffic to our website. They also provided research and insight on ways to make our in-person efforts more productive. We have started to implement these recommendations and are already seeing the benefits of these changes.
JASPER AKERBOOM, PH.D. Co-Owner, Jasper Yeast
Founded in 2014, Plenty Unlimited Inc. is an indoor vertical farming technology company capable of growing clean produce year-round, anywhere in the world. Plenty is changing the agriculture industry by taking the variables out of farming and using indoor technology to create peak season-quality produce with up to 350 times more yield per acre than conventional farms.
The controlled environment agriculture (CEA) industry has taken off in recent years, and Plenty began looking to expand its footprint to the East Coast, requiring ample space, a skilled workforce pipeline, and proximity to an agro-tech ecosystem to make it a reality. As the Plenty team searched for the next hub for hydroponics, the company narrowed its search to Virginia to plant its next campus.
After looking at five other states and considering a number of locations, in September 2022 Plenty selected Chesterfield County to establish the world’s largest indoor vertical farming campus — a $300 million investment that will create more than 300 full-time jobs. The Plenty Richmond Farm Campus marks the company’s expansion beyond the U.S. West Coast and aims to bring fresh, healthy produce to the East Coast year-round. Virginia’s successful bid centered on a large site near the thriving Richmond metro area, home to 33,000 local manufacturing workers and close to more than 20 colleges and universities that deliver top talent each year — and strong nearby infrastructure including Interstates 85 and 95 and The Port of Virginia’s Richmond Marine Terminal.
Plenty plans to complete its Richmond Farm Campus in multiple phases over the next six years, with recruiting and training support provided by the top-ranked Virginia Talent Accelerator Program. The first farm on this site, a dedicated Driscoll’s berry farm, will be the first to grow indoor, vertically farmed strawberries at scale. The campus is designed to grow more than 4 million pounds of strawberries annually, helping to meet increasing demand for flavorful, fresh berries in the Northeast, the largest berry consumption region in the U.S. Plenty broke ground in April 2023, and the first crop of Driscoll’s strawberries grown onsite will be available in 2024 at retailers throughout the Northeast.
CEA companies have called Virginia home for years, attracted to the Commonwealth's diverse ecosystem of partners and suppliers for food and beverage processors, numerous universities and research centers, and a notable abundance of natural resources. Virginia’s central East Coast position also enables companies to efficiently access major U.S. economic hubs. Located within a one-day drive of nearly half of the nation’s consumers, Virginia offers companies a single gateway into critical customer markets along the affluent Northeast corridor, across the high-growth Southeast, and throughout the Midwest.
Administration of Governor Glenn Youngkin • Chesterfield County • Greater Richmond Partnership • Virginia Community College System • Virginia Department of Agriculture and Consumer Services • Virginia Port Authority • Dominion Energy
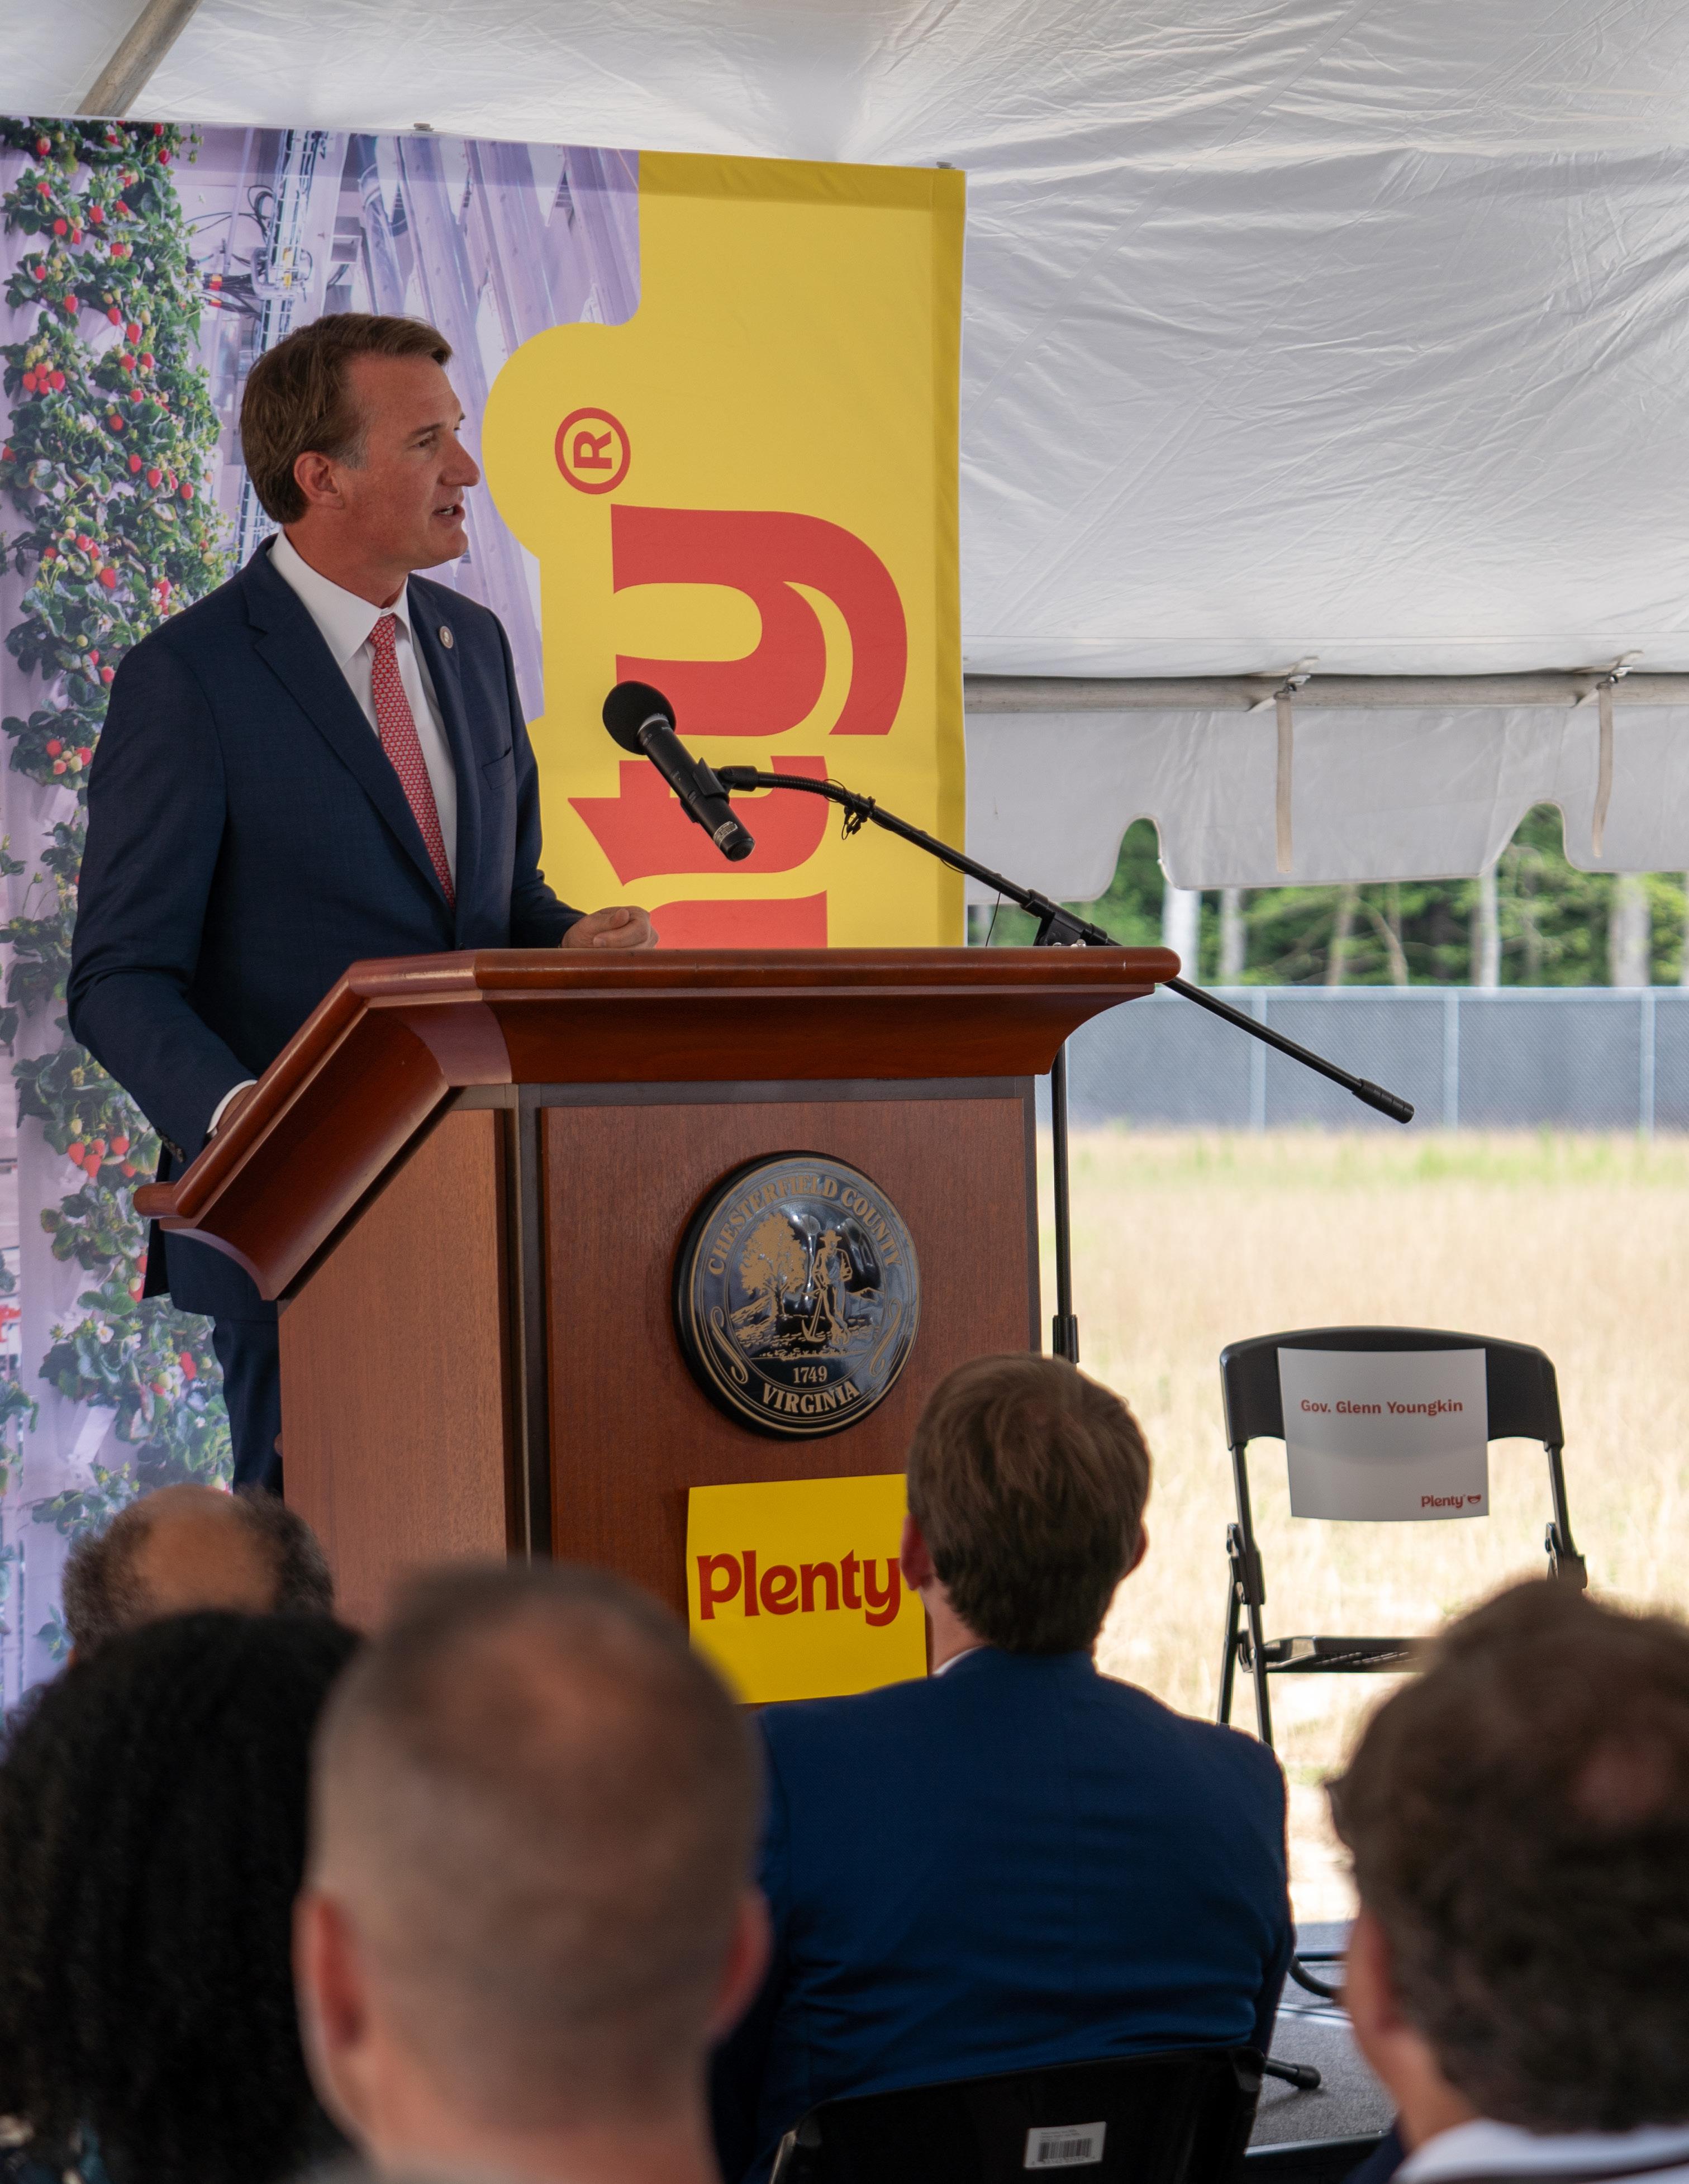
At Plenty, we’re on a mission to sustainably grow fresh food for everyone, everywhere. This campus will raise the bar on what indoor vertical farming can deliver. The scale and sophistication of what we’re building here in Virginia will make it possible to economically grow a variety of produce with superior quality and flavor. We look forward to continuing to work in close partnership with the government of Virginia as we endeavor to rewrite the rules of agriculture.
ARAMA KUKUTAI CEO, Plenty Unlimited Inc.

We started what is now the largest drone technology services company in the United States … and we celebrate further expansion and the opening of the world’s first and most advanced specialized drone pilot training facility. And we’ve done it all right here in Virginia.
TOM WALKER Founder and CEO, DroneUp
Virginia-born business DroneUp, LLC was founded by former U.S. Navy officer Tom Walker in 2016. The company works to make drone flight work for businesses through flight services, delivery services, and airspace management. What originally began as a web and mobile platform for on-demand drone pilot services has expanded into a multimillion-dollar operation that is the exclusive provider of drone services for Walmart. After establishing DroneUp's headquarters in Virginia Beach in 2016, Walker has kept his eyes on the skies looking for new ways to expand his business.
In 2019, DroneUp expanded its headquarters operation in Virginia Beach, creating 41 new jobs. One year later, during the height of the COVID-19 pandemic, the company partnered with Walmart to deliver COVID-19 test kits. The partnership was so successful that the retail giant invested in DroneUp to establish permanent last-mile drone delivery for a large portion of its product line. In 2021, DroneUp announced a multi-year commercial services agreement with Walmart to provide drone delivery services at 34 sites, providing the potential to reach 4 million U.S. households by the end of the year.
With exponential growth on the horizon, DroneUp needed to expand its physical footprint and its workforce, including building a talent pipeline of new employees such as drone pilots and engineers. The company’s existing headquarters in Virginia Beach was the right spot to launch this next phase of development, but the company also required a location for testing, training, and R&D for drone operators. Richard Bland College in Dinwiddie County had just the setup for the newest operation. DroneUp’s work complements Richard Bland’s ongoing efforts to develop a curriculum for an unmanned aviation program, so the school could begin training pilots right away while additional training center facilities were built. Every drone pilot hired would first need to come to Richard Bland College for a two-week course, and the college also offered dorm space for pilots coming in from all over the country for training.
In August 2022, DroneUp announced a total investment of $27.2 million to expand its headquarters in the city of Virginia Beach and establish a testing, training, and R&D center at Richard Bland. Virginia successfully competed with Arizona, New York, North Carolina, and Texas for the projects, which will create 655 total new jobs.
In addition to the headquarters facility and training center, DroneUp also announced plans to establish three drone hubs at Walmart locations in the Commonwealth as part of their commercial services agreement.
DroneUp’s expansion in Virginia Beach and new testing, training, and R&D center at Richard Bland is an exciting step forward for the unmanned systems industry in Virginia and serves as a model for higher education partnerships and economic development.
Administration of Governor Glenn Youngkin • City of Virginia Beach • Dinwiddie County • Hampton Roads Alliance • Richard Bland College • Virginia’s Gateway Region • Virginia Innovation Partnership Corporation • Virginia Tobacco Region Revitalization Commission
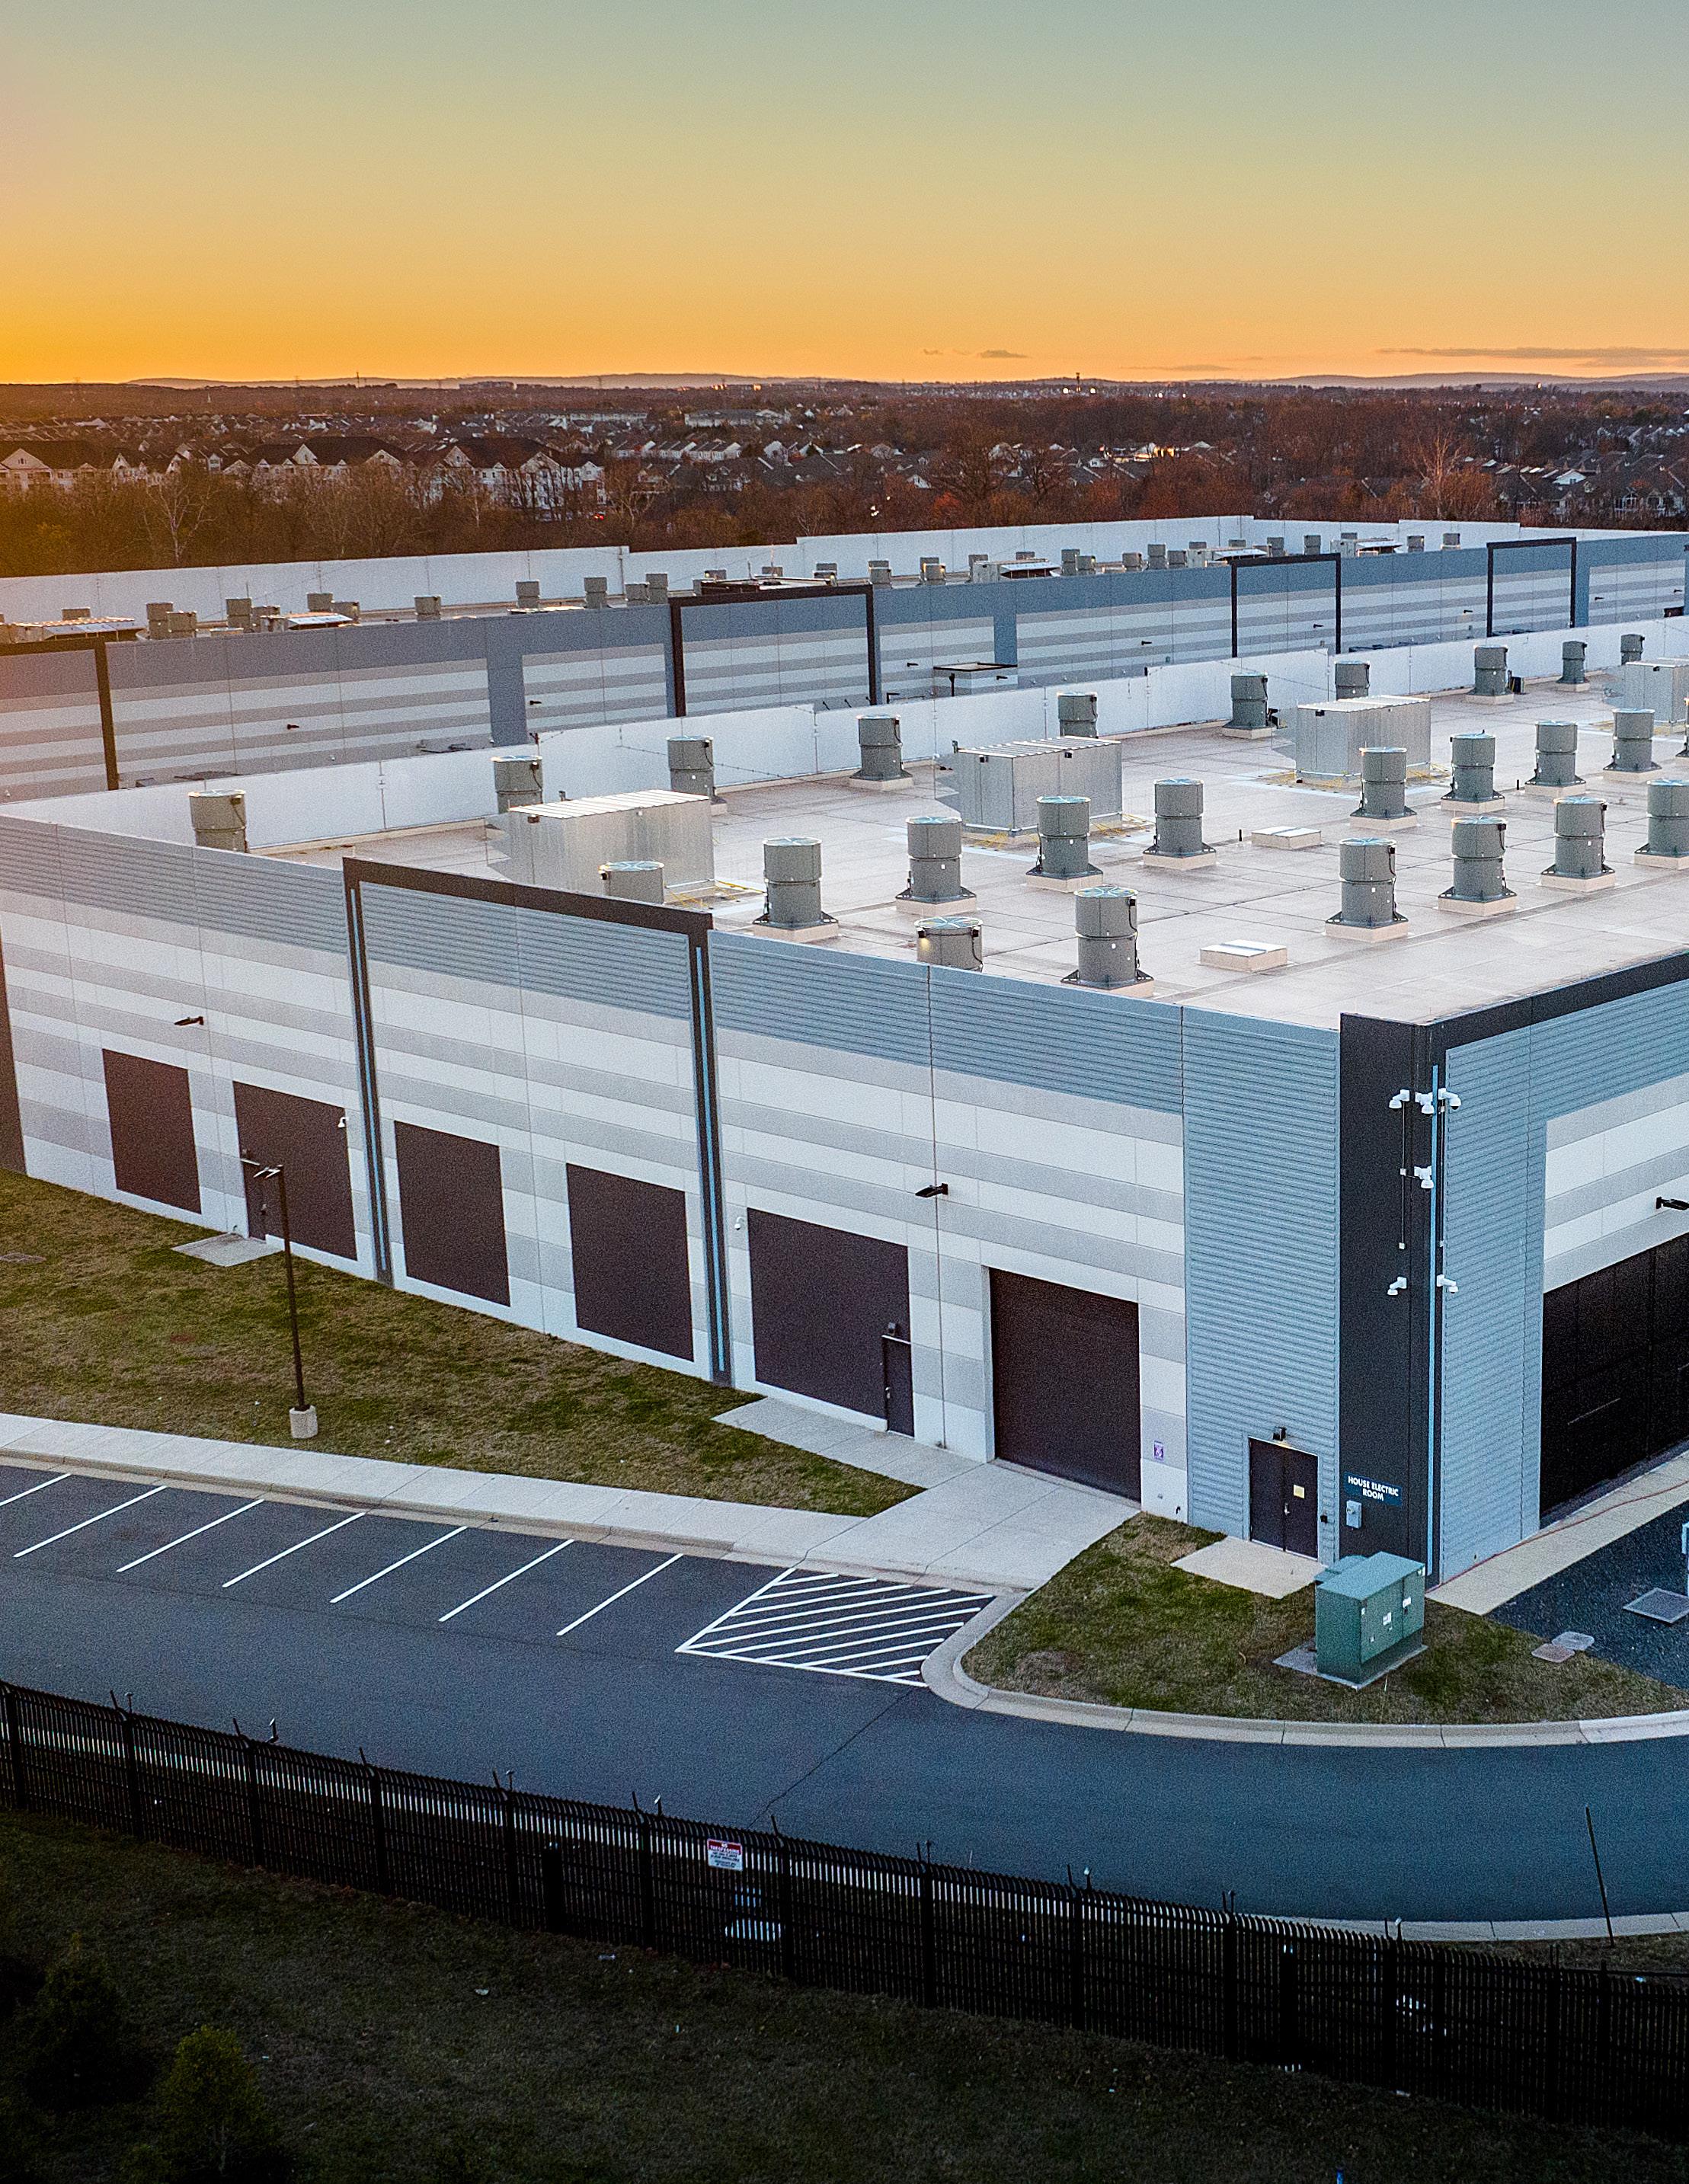
When Amazon Web Services (AWS) first established data centers and operations facilities in Virginia in 2006, no one imagined the company would one day announce the largest capital investment in the history of the Commonwealth.
Between 2011 and 2021, AWS invested more than $51.9 billion in Virginia and is among the largest private-sector employers in the Commonwealth, with over 8,700 full-time, well-paying jobs in corporate offices and data centers across Virginia. These roles include data center technicians, engineers, solutions architects, sales representatives, account managers, software development engineers, and cloud experts.
AWS continues to expand its massive cloud cluster in Northern Virginia, where it operates more than 50 data centers. The region is the largest single concentration of corporate data center infrastructure on Earth, housing the AWS US-East cloud region. In January 2023, Governor Glenn Youngkin announced that AWS would expand its footprint in Virginia, investing $35 billion by 2040 to establish multiple data center campuses across the Commonwealth.
VEDP worked with AWS for five years prior to the announcement to ensure Virginia could meet the company’s requirements for the major data center expansion. In the various iterations of the project, the needs shifted from 50-acre sites to multiple 1,000-acre campuses with 15-year development plans. The sites required access to high-voltage power lines and the ability to run fiber optic cables underground. Virginia delivered on every front.
VEDP’s consistent project management and willingness to adapt to the company’s shifting priorities and requirements was key to winning this project, as well as Virginia’s ability to assemble tracts of land that could deliver significant utility requirements. AWS also has more than a decade of first-hand knowledge of the Commonwealth’s industry strengths — including a world-class tech workforce.
The company’s planned investment will create at least 1,000 total new jobs across Virginia and a tremendous ripple effect for the Commonwealth’s economy for decades to come. The new campuses will also combine expandable capacity to position AWS for long-term growth in the Commonwealth.
Amazon Web Services’ legacy in Virginia is a testament to the success tech companies can find in the Commonwealth. Virginia continues to dominate the data center industry thanks to its infrastructure, competitive business costs, and workforce, and AWS is helping to lead the charge.
Administration of Governor Glenn Youngkin • Administration of former Governor Ralph Northam • Virginia Department of Environmental Quality • Virginia Department of Transportation • Virginia General Assembly and Major Employment and Investment (MEI) Project Approval Commission • Local Partners • Utility Partners

Virginia is a world leader in innovation and cloud computing, thanks to its investment in a robust, highly skilled workforce and emphasis on long-term public and private partnerships.
ROGER WEHNER Director of Economic Development, AWS

Our relationship with Virginia started with VIRginia International Raceway. The more our team worked with Connie Nyholm and VIR, the more apparent it was that Virginia and Halifax Country would be the ideal location for our new headquarters. The support the Governor’s office and Halifax County provide to motorsports businesses and the automotive industry is second to none.
ANTHONY D e MONTE CEO, Skip Barber Racing School

Skip Barber founded the racing school that bears his name in 1975 after retiring from his own driving career. Since that first class, the school has taught more than 400,000 students, many of whom have become racers and champions themselves. Famous alumni include racing stars as prominent as Danica Patrick and Marco Andretti, and more than one-third of the starting lineup in the 2022 Indy 500 were Skip Barber graduates. Today, the Skip Barber Racing School (SBRS) is the world’s largest automotive education and entertainment company, training the drivers of tomorrow on the finest tracks in the United States.
In November 2022, SBRS announced that it would invest $8.9 million to relocate its headquarters from Lakeville, Connecticut, and establish a performance driving school at VIRginia International Raceway (VIR) in Halifax County. VIR will build a 25,000-sq.-ft. facility within its Motorsport Technology Park to lease to SBRS. Virginia successfully competed with California and Texas for the project, which will create 24 new jobs. The project will be supported through grants from the Commonwealth’s Opportunity Fund and the Tobacco Region Opportunity Fund, and funding and services to support SBRS’s employee training activities will be provided through the Virginia Jobs Investment Program.
Southern Virginia has a rich history in auto racing. In addition to VIR, the region is home to Martinsville Speedway — the only track to host NASCAR Cup Series races every year since the division’s founding in 1949 — and numerous short tracks that have hosted local races for decades. Notable Southern Virginians in racing history include International Motorsports Hall of Famer Wendell Scott of Danville — the first Black driver to win a race at NASCAR’s highest level — and the Burton brothers, Ward and Jeff, who grew up in Halifax County before winning a combined 26 Cup Series races.
That cultural affinity for racing, along with SBRS’s relationship with VIR leadership, formed the basis of the company’s Virginia decision. Anthony DeMonte, the company’s CEO, cited support for the motorsports and automotive industries from the Commonwealth and Halifax County as a major factor in the decision, calling Virginia’s friendliness to those industries “second to none.”
KEY PARTNERS:
Administration of Governor Glenn Youngkin • Halifax County • Halifax County Industrial Development Authority • Southern Virginia Regional Alliance • Virginia Tobacco Region Revitalization Commission
Fourteen years after checking into Virginia, Hilton has solidified its commitment to the Commonwealth, making significant upgrades to the Fairfax County headquarters from which the company runs its global hospitality enterprise.
In 2009, Hilton relocated its global headquarters from California to Fairfax County, Virginia, creating 300 jobs and investing $17 million. In 2011, the company invested $1.8 million to expand its headquarters and relocate an additional 100 jobs in supply management to Fairfax County. Eleven years later, Hilton doubled down on its Fairfax headquarters, investing in significant upgrades to the facility and creating 350 new jobs by 2027.
Founded in 1919, Hilton is a leading global hospitality company with a portfolio of 22 world-class brands comprising nearly 7,300 properties and more than 1.1 million rooms in 123 countries and territories. Dedicated to fulfilling its founding vision to fill the earth with the light and warmth of hospitality, Hilton has welcomed over 3 billion guests in its 100+-year history, earned a top spot on Fortune's 100 Best Companies to Work For list, and been recognized as a global leader on the Dow Jones Sustainability Indices for six consecutive years.
Hilton originally selected Virginia for its headquarters relocation because the Commonwealth represented a central location for its global organization with strategic domestic and international access and significantly reduced operating costs in comparison to its prior location. For more than a decade, the company has continued to invest in the region because of the wealth of talent available in Northern Virginia, one of the most educated and diverse regions in the United States. The 2022 headquarters retention and expansion to create hundreds of additional jobs showcases Virginia’s ability to deliver a top-tier talent pipeline.
The COVID-19 pandemic had a significant impact on the hospitality industry, and Hilton was not immune. The company has since established a new vision, focusing on how technology can transform the hospitality industry. Virginia’s workforce is ready: Named the No. 2 Tech Talent Pipeline in the nation (Business Facilities, 2023), the Commonwealth is making investments to develop tech talent, STEM-oriented education programs and partnerships, and innovative tools to prepare its workforce, accelerating Hilton’s next steps into the future of hospitality.
Administration of Governor Glenn Youngkin • Fairfax County • Fairfax County Economic Development Authority

Northern Virginia has been Hilton’s home for more than a decade, and the region has played an instrumental role in helping us create the best, most inclusive home for our Team Members while also managing the demands of a global business ... We appreciate the continued support of the Commonwealth of Virginia in ensuring we continue to attract strong, diverse talent to our vibrant, growing region.
CHRIS NASSETTA President and CEO, Hilton
This section offers an update on the progress made by the Virginia Economic Development Partnership Authority (VEDP) in FY23 relative to VEDP’s Strategic, Operational, and Marketing Plans. These plans were previously submitted in accordance with Code and other requirements. Because most elements of these plans are treated with confidentiality and are exempted from mandatory disclosure provisions (Code of Virginia §2.2-3705.7. 33.), this progress report references specific elements of the plans without revealing information that is protected by the Code for competitive purposes.
The Strategic Plan for Economic Development of the Commonwealth of Virginia adopted by the VEDP Board in FY21 is a five-year plan (FY21-FY25) for which implementation began in January 2021.
With the support of the administration, the General Assembly, and hundreds of partners, much progress has been made in implementing many of the initiatives detailed in the Strategic Plan. Following are just a few examples (not comprehensive):
■ To accelerate progress toward achieving our transformational goals, VEDP launched the Innovative Framework for Economic Growth, a focused effort to cultivate core sectors through strategic engagement and ecosystem building.
■ Developed with strong VEDP support, the Youngkin administration unveiled Compete to Win, the Comprehensive Economic Development Policy for Virginia, outlining a vision to position Virginia as the best state for business and take job creation and investment to new heights.
■ With new state funding, VEDP awarded $90M in Virginia Business Ready Sites Program (VBRSP) grants to 21 site development projects across the Commonwealth, representing the largest investment grant round to date.
■ Working to advance priorities of Virginia’s rural regions, VEDP collaborated with partners to complete two General Assembly studies: the Inland Port Study and the Southside-Southwest Virginia Barriers to Infrastructure and Supply Chain Investment Study.
■ With continued state support, the Virginia Talent Accelerator Program affirmed its status as the national leader for customized talent solutions, ranking Virginia No. 1 in the U.S. for Customized Workforce Training in the 19th annual Business Facilities State Rankings Report.
■ Virginia continued its climb in national business climate rankings, achieving a No. 5 average rank across key outlets including CNBC, Site Selection, and Business Facilities
■ VEDP continued to grow its international trade capabilities, launching expanded training programs for Virginia businesses and implementing new tools to enhance access to trade program information.
■ VEDP established the Regional Talent Solutions Business Outreach division to engage key businesses across the Commonwealth and address their talent and growth needs; in its first year, the division made 415 visits to companies across all of Virginia’s regions.
■ Working in collaboration with state, regional, and local partners, VEDP supported nearly 20 federal grant applications; our recent efforts have contributed to a $52M grant for the Richmond-Petersburg Advanced Pharmaceutical Manufacturing Cluster, and a $23M grant in support of the Eastern Shore Rail Trail.
■ Working in collaboration with our state, regional, and local partners, VEDP-assisted projects resulted in over 10,800 announced jobs and $40.8B in capital investment.
Despite the strong progress that has been made on several fronts, many initiatives detailed in the Strategic Plan have not yet been implemented. Accordingly, while substantial progress has been made with respect to all five of the following transformational goals, Virginia has not yet fully achieved them.
The Strategic Plan includes five transformational goals, the achievement of which would require implementation of dozens of new initiatives over a period of years (multiple biennium budgets). The five transformational goals are outlined below, as well as a progress indicator rating the Commonwealth’s status in achieving each of these goals.:
1. Robust state job growth Position Virginia to achieve a growth rate in employment and median earned income among that of the top 5–10 states in the U.S.
2. Every region wins Ensure that every region participates in the growth of the Commonwealth (i.e., all with positive growth in employment and median earned income).
3. Best states for business Restore Virginia to its previous position near the top of the national business climate rankings (i.e., average rank among the top 3–5 states).
4. Top state EDO Reestablish and sustain VEDP as one of America's most effective state economic development organizations.
5. Super collaborator Exhibit collaboration and coordination as hallmarks of VEDP (i.e., place a central focus on the "P" in VEDP).
On track to achieve long-term goal
Not on track to achieve goal
Substantial progress has occurred, but not yet on track to fully achieve goal
Not started, or strategy shift under consideration
Some of the initiatives in the Strategic Plan require new funding to implement and, therefore, achievement of the five transformational goals will depend on resourcing levels.
The Strategic Plan provides for 35 detailed initiatives for phased implementation over a period of years (multiple biennium budgets). Some of the initiatives scheduled for implementation in FY23 were not funded, slowing progress toward achieving the transformational goals outlined in the Strategic Plan.
SP1 Build out the best turnkey, customized workforce recruitment and training incentive program in the U.S.
SP2 Invest in Virginia's pipeline of computer science talent through $1.1 billion Tech Talent Investment Program
SP3 Develop mechanisms to ensure sufficient supply of high-impact baccalaureate+ degrees in critical fields
SP4 Develop sub-baccalaureate talent pathways and signaling mechanisms to drive inclusive economic growth
SP5 Upgrade Virginia's labor market data infrastructure to empower data-driven decision-making
SP6 Work toward creating a comprehensive ecosystem for talent development and deployment
SP7 Strategically enhance Virginia's portfolio of development-ready sites
SP8 Develop a program to enhance Virginia's portfolio of project-ready buildings
SP9 Build a best-in-class Economic Competitiveness team within VEDP
SP10 Pursue a national rankings initiative to develop strategies and plans for marked improvement
SP11 Proactively address key elements of local and regional economic competitiveness
SP12 Assess Virginia's state/local tax burdens and propose targeted solutions to improve tax competitiveness
SP13 Conduct a review of Virginia's incentive portfolio to identify targeted competitiveness improvements
SP14 Pursue a focused economic development strategy sufficient to position rural Virginia for growth
SP15 Marshal the Commonwealth's full support behind expanding broadband access
Enhance VEDP's Capabilities
SP16 Adhere to protocols for alignment and coordination
SP17 Implement a talent management and organizational development program for VEDP
SP18 Implement a robust marketing, branding, and site consultant cultivation program for Virginia
SP19 Upgrade VEDP's lead generation capabilities
SP20 Implement a strategic site consultant cultivation program
SP21 Expand VEDP's Business Retention and Expansion (BRE) Program
SP22 Implement Virginia’s International Trade Plan in collaboration with internal and external stakeholders
SP23 Strengthen VEDP's approach to project management to communicate Virginia's total value proposition
SP24 Launch a Project Development and Special Opportunities Fund
SP25 Develop best-in-class incentives reporting and administration functions
SP26 Position Virginia to secure transformational economic development projects
SP27 In partnership with the Virginia Chamber, launch Team Virginia
SP28 Position Virginia to be one of America’s leading states for traded-sector tech growth
SP29 Collaborate with The Port of Virginia to enhance its economic development impact
SP30 Enhance the toolkits, strategies, and assets on hand to attract targeted firms
SP31 Implement the Rural and Small Metro Tech Centers Initiative
SP32 Support entrepreneurship and innovation ecosystem efforts
Position Virginia for Post-COVID Recovery
PC1 Explore opportunities to capture growth from teleworking trends
PC2 Explore opportunities to best position Virginia to thrive as supply chains adjust in the wake of COVID-19
PC3 Explore opportunities to best position Virginia to support workers' upgraded skills in response to COVID-19
VEDP’s Operational Plan outlines specific and incremental actions for VEDP staff to undertake within a fiscal year in order to ultimately achieve the transformational goals of the organization’s Strategic Plan. FY23’s Operational Plan covers the time period between July 1, 2022, and June 30, 2023. During the second half of FY23, VEDP also launched planning efforts for the new Innovative Framework for Economic Growth. Given its far-reaching implications for the organization, some major initiatives were modified and/or delayed until the Innovative Framework is fully implemented in FY24.
VEDP prioritized 11 major initiatives in its FY23 Operational Plan, as summarized below.
Major Initiative
Build out the best customized workforce recruitment and training incentive program in the U.S.
Develop long-term Real Estate Solutions strategy that includes execution of expanded VBRSP program and a regional ecosystem approach to site development
Expand Virginia exports and strengthen supply chains through implementation of high-priority elements of the International Trade Plan
Accelerate efforts toward achieving national leadership in tech sector growth across Virginia
Align and integrate VEDP’s business outreach activities to achieve increased coverage and impact
Support development of Governor’s Comprehensive Economic Development Policy to include analyzing the economic context
Build out VOEE's operating structure and execute on priority deliverables
Strengthen VEDP’s lead generation, project management capabilities, and related support functions (pending additional funding)
Enhance industry strategies by fully leveraging existing assets and developing new capabilities (pending additional funding)
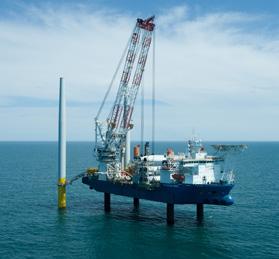
Launch an Offshore Wind Supply Chain Grant Program to establish an end-to-end supply chain of small businesses within the Commonwealth
Finalize comprehensive HR talent management strategy and launch priority components
Status
Goal achieved as planned
Partially completed Did not achieve goal
Change in approach/focus
VEDP executes a variety of marketing initiatives each year to build awareness among executives and site selection consultants of Virginia’s attractive business climate and many assets for businesses. Because business site-selection processes rely on both quantitative assessments as well as qualitative perceptions of regions and states, strategic marketing efforts can make a substantial impact on a state’s ability to attract investment. VEDP focuses its marketing efforts on eight key industry sectors and several related subsectors.
■ Implemented a targeted site selection consultant cultivation effort to raise awareness and improve perceptions of Virginia as a premier business destination among this highly valued influencer group.
■ In partnership with Team Virginia, hosted dozens of top site consultants in Virginia Beach for the Virginia Consultants Forum.
■ Published four editions of Virginia Economic Review, a quarterly magazine featuring Virginia’s assets and advantages for business, including rural Virginia, as well as interviews with national and in-state thought leaders.
■ Implemented a C-level testimonial campaign featuring companies located in Virginia.
■ Oversaw implementation of VEDP’s event marketing program.
■ Produced and maintained a high-quality web presence on VEDP.org, ExportVirginia.org, and VOEE.org.
■ Placed multiple, limited ad campaigns, as well as contributed content, to raise awareness and improve perceptions of Virginia as a business destination.
■ Created new brochures and website content for several industry sectors.
Note: To shield strategic initiatives from competitors, the update provided in this document is purposely high-level. Additional details about VEDP’s marketing and lead generation activities can be provided to in-state partners through in-person briefings.
In FY23, VEDP completed a major refresh of its value proposition materials — with deep dives on Virginia’s key industry sectors — to better position the Commonwealth. Consistently branded, the continued value proposition collateral and content provides comprehensive looks at the state’s assets and the advantages of a Virginia location. From brochures to web to branded collateral, these pivotal pieces help guide how the organization markets Virginia to prospects and target audiences.

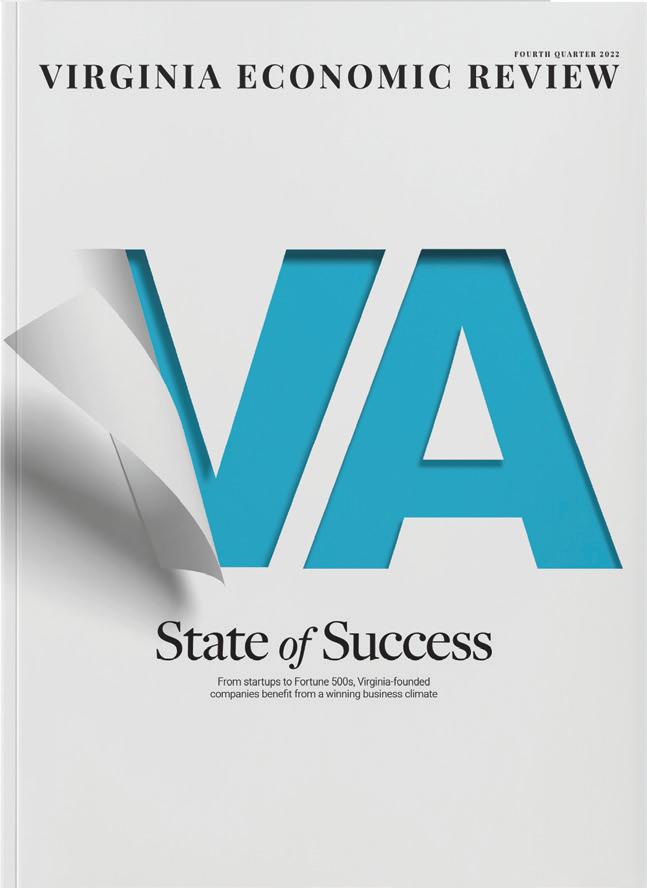
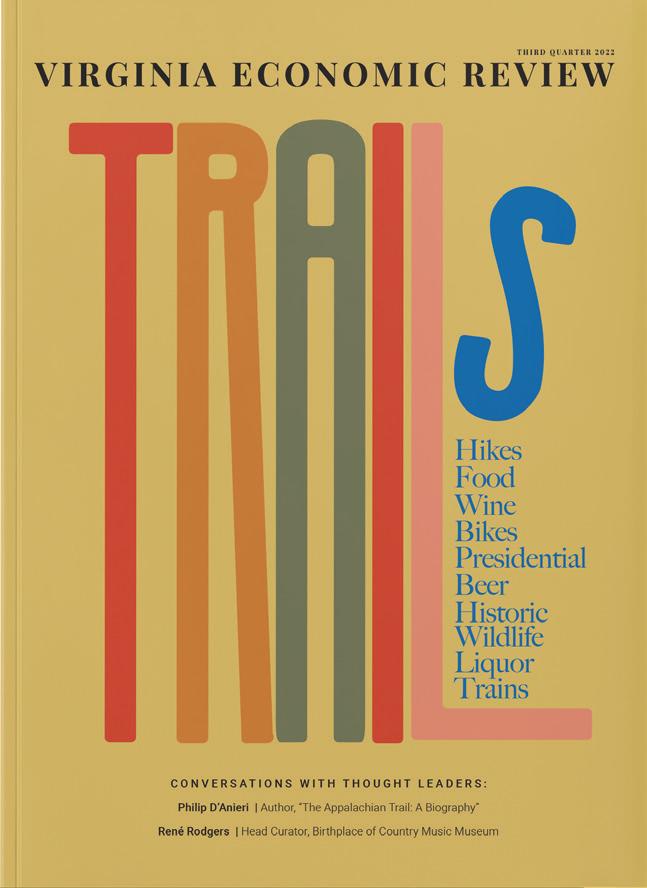
The third-quarter 2022 issue of Virginia Economic Review (pictured top right) featured every region of the Commonwealth in highlighting Virginia’s wide array of tourist trails, from recreational trails to historical tours, presidential sites, cultural trails, and food and beverage trails.
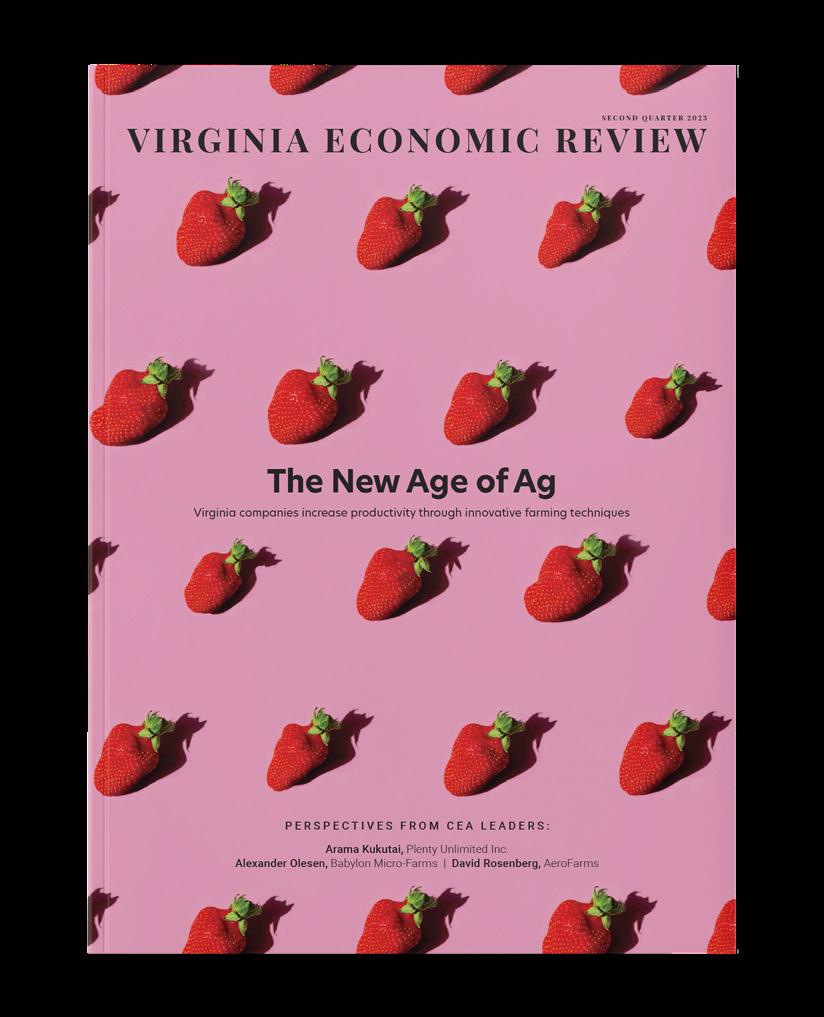
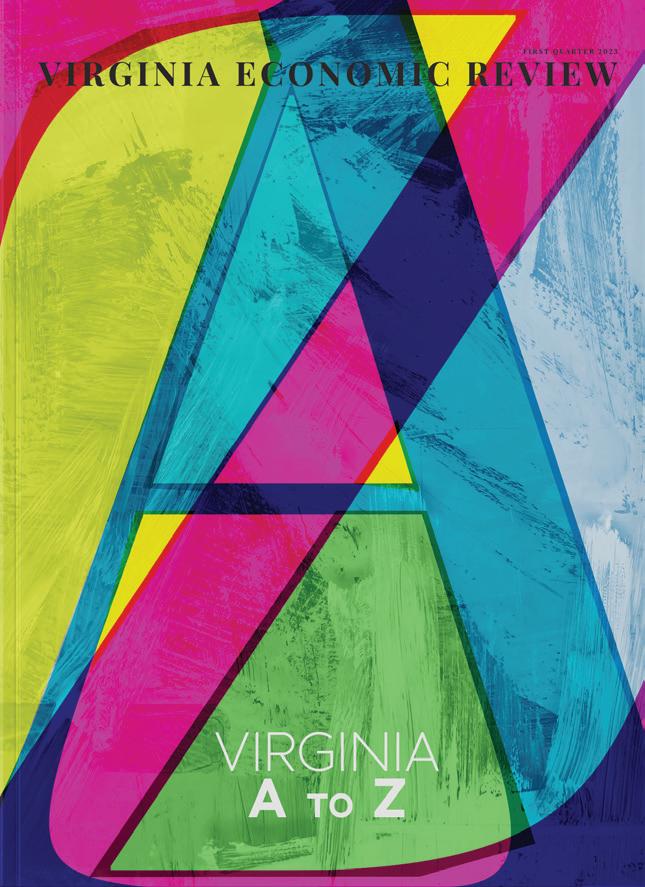
right (from top to bottom): Virginia Economic Review; Issues Q3 2022, Q4 2022, Q1 2023, and Q2 2023
VEDP balances its marketing efforts by highlighting all regions of Virginia (including rural areas and assets) through social media, Virginia Economic Review, site selection consultant and media familiarization tours, and inclusion of regional and local partners in lead generation events.
Most (59%) of the partner mentions in FY22 on VEDP’s X (formerly known as Twitter) account were of a rural locality or region.


Virginia Economic Development Partnership
Audited Basic Financial Statements
Fiscal Year 2023
Richmond, Virginia
As of June 30, 2023
Board of Directors
Bill Hayter, Chair
The Honorable Caren Merrick, Ex-Officio, Vice Chair
Nancy Howell Agee Pace Lochte
Carrie Hileman Chenery
C. Daniel Clemente
Mimi Coles
Marianne Radcliff
Nick Rush
Will Sessoms
Richard “Rick” O. Harrell, III Steven David Stone
John Hewa
The Honorable Stephen Cummings, Ex-Officio
April Kees, Ex-Officio
Anne Oman, Ex-Officio
Stephen Edwards, Ex-Officio
President and Chief Executive Officer
Jason R. El Koubi
The Virginia Economic Development Partnership (the Partnership) management offers the readers of the Partnership’s financial statements this narrative overview and analysis of its financial activities for the fiscal year ended June 30, 2023. We encourage the reader to consider this information presented here in conjunction with the financial statements and accompanying notes.
The government-wide financial statements are designed to provide readers with a broad overview of the Partnership in a manner similar to a private sector business.
The Statement of Net Position presents information on all of the Partnership’s assets and liabilities, with the difference between the two reported as net position. Over time, increases or decreases in net position may serve as a useful indicator of whether the financial position of the Partnership is improving or deteriorating.
The Statement of Activities presents information showing how the Partnership’s net position changed during the most recent fiscal year. All changes in net position are reported as soon as the underlying event giving rise to the change occurs, regardless of the timing of the related cash flows. Thus, revenues and expenses are reported in this statement for some items that will only result in cash flows in future fiscal periods. For example, expenses that are accrued for the net pension liability in the current period are expected to be paid with future funding appropriations from the Commonwealth of Virginia (COV).
A fund is a grouping of related accounts that is used to maintain control over resources that have been segregated for specific activities or objectives. The Partnership, like other political subdivisions of the COV, uses fund accounting to ensure and demonstrate compliance with finance-related legal requirements. The financial activities of the Partnership are reported in governmental funds.
Governmental
Governmental funds are used to account for essentially the same functions reported as governmental activities in the government-wide financial statements. However, unlike the government-wide financial statements, governmental fund financial statements focus on near-term inflows and outflows of spendable resources, as well as on balances of spendable resources available at the end of the fiscal year. Such information may be useful in evaluating the Partnership’s near-term financing requirements.
There are two reconciliations between the government-wide and the fund financial statements. The first is found on the Balance Sheet and explains the difference between the fund balance on the Balance Sheet and net position on the Statement of Net Position. The second is found on the Reconciliation of the Statement of Revenues, Expenditures, and Changes in Fund Balances of Governmental Funds to the Statement of Activities, which reconciles the difference between the net change in fund balances on the fund-based statement and the change in net position on the government-wide based statement. Both statements describe in sufficient detail the amounts and the reasons for those differences.
As noted earlier, net position may serve over time as a useful indicator of an organization’s financial position. At the close of the fiscal year ended June 30, 2023, the Partnership had a net position of $5,739,075 compared to a net position of $3,747,947 as of June 30, 2022. Following is an analysis of the changes in the net position of the Partnership.
*2022 amount for Capital assets, net of depreciation and amortization, Current and other liabilities, Noncurrent liabilities, Net investment in capital assets, and Total net position have been restated to include an additional year of lease term for a right to use
leased asset pursuant to GASB Statement 87, Leases (GASB 87). The impact on 2022 net
was a reduction of $6,837.
Total assets decreased this fiscal year by $183,638 when compared to last year due to a decrease of $2,322,462 in Capital assets, net of depreciation and amortization, offset by an increase of $2,138,824 in Current and other assets. The increase in Current and other assets consists of an increase in the Current asset, cash of $1,262,458 due to unspent FY2023 funding for the Talent Solutions – Talent Accelerator Program and the International Trade Plan, an increase of $829,850 in the Current asset, prepaid expenses due to the timing of various promotional activities, and an increase in Operating grants receivable of $114,749 due to the timing of reimbursement payments in connection with Federal and other grants. These increases were offset by a decrease of $52,795 in the Restricted net other postemployment asset recorded in compliance with GASB 75, Accounting and Financial Reporting for Postemployment Benefits Other Than Pension (GASB 75), related to the Partnership’s participation in the Virginia Retirement System Disability Insurance Program, as well as a decrease in other current assets of $15,438
The decrease of $2,322,462 in Capital assets, net of depreciation and amortization, is due primarily to the amortization of lease assets recorded in compliance with GASB 87, that requires the value of leases with non-cancellable terms in excess of twelve months be recorded on the statement of net position as a right to use intangible lease asset, as well as normal depreciation expense on leasehold improvements, furniture, and equipment at the Partnership’s James Center headquarters location. These decreases were offset by additional lease assets recorded related to the Partnership’s implementation of GASB Statement No. 96, Subscription-Based Information Technology Arrangements. The Partnership recorded $308,536 in additional lease assets along with the corresponding lease liability upon adoption of this new standard effective July 1, 2022 This increase in lease assets was offset by lease assets amortization of $102,333.
Deferred outflows of resources increased by $315,216 This increase is due primarily to changes in proportion and differences between employer contributions and proportionate share of contributions, and an increase in the Partnership’s FY2023 employer contributions subsequent to the measurement date related to the Partnership’s participation in the Virginia Retirement System pension and other postemployment benefit plans, recorded in compliance with GASB Statement No. 68, Accounting and Financial Reporting for Pensions (GASB 68) and GASB 75.
Total liabilities increased by $2,822,683 due to an increase in Current and other liabilities of $1,493,232. This increase is due primarily to an increase of $925,126 in Accounts payable related to the timing of payment transactions at the end of the fiscal year, as well as a net increase of $568,106 in other current liabilities. Non-current liabilities increased $1,329,451 due primarily to an increase of $3,664,620 related to the Partnership’s Net pension liability, offset by a decrease of $1,937,936 in Long-term lease liability related to payments on lease liabilities recorded in compliance with GASB 87 and GASB 96, along with a net decrease of $397,233 in other non-current liabilities.
Deferred inflows of resources decreased by $4,682,233. This decrease is due mainly to differences between projected and actual earnings on plan investments related to the Partnership’s participation in the Virginia Retirement System pension and other postemployment benefit plans, recorded in compliance with GASB 68 and GASB 75.
Net investment in capital assets consists primarily of right to use intangible lease assets, leasehold improvements, furniture, computers, and technology equipment used to deliver program services to clients, net of long-term lease liability The Partnership considers technology a vital asset in its efforts to market Virginia and will continue to invest in technology to ensure that its equipment and software are updated to take advantage of the latest data handling capabilities and increased processing speeds.
Restricted Net position represents the portion of fund balance related to the Restricted net other postemployment asset recorded in compliance with GASB 75 due to the Partnership’s participation in the Virginia Retirement System Disability Insurance Program. The remaining Net position balance of $3,632,129 is classified as unrestricted The Partnership has recorded $16,064,297 of net pension liability and net other postemployment benefits liabilities that are expected to be paid with future appropriations from the COV The Partnership’s Current and other assets exceed its Current and other liabilities by $16,552,863.
*2022 amount for International Trade Expenses has been restated to include an additional year of lease term for a right to use intangible leased asset pursuant to GASB 87. The impact on 2022 net position was a reduction of $6,837.
Net position for the Partnership increased by $1,991,128 during the current fiscal year The total revenues increase of $5,425,871 is due primarily to a $4,475,309 increase in General Fund appropriations from the COV related to funding for new and existing programs, including Talent Solutions – Talent Accelerator, and the International Trade Plan, along with an increase of $884,764 in other revenues related primarily to interest income on the Partnership’s cash deposits.
Total expenses for the Partnership increased by $9,609,456. This increase is due primarily to additional spending in Virginia Office of Education Economics (VOEE) related to two new grant programs in FY2023, continued expansion of the Talent Solutions – Talent Accelerator Program and the Business Investment division, as well as an increase in Administration related to an economic development strategy and roadmap project, and three economic development studies funded in the FY2023 COV appropriation.
The Partnership records all its financial activities in the General Fund, with the exception of International Trade and VOEE federal and other grant programs that are recorded in the Special Revenue Fund. The financial position of the Partnership improved by $1,026,205 in FY2023 primarily due to the increase in Cash and Prepaid expenses, offset by an increase in current liabilities, primarily in Accounts payable, resulting in a fund balance of $19,011,722 as of June 30, 2023. $2,419,339 of the fund balance consists of Prepaid expenses and Lease deposits and is nonspendable, with the remaining balance of $16,592,383 unassigned. The Special Revenue fund records revenues and expenditures related to federal and other grant programs and has a fund balance of $52,735 as of June 30, 2023. Expenses for the Special Revenue fund decreased from $1,420,877 in FY2022 to $1,342,305 in FY2023 due to the timing of payments for the VOEE Virginia Skills Initiative grant, National Governor’s Association grant, and the International Trade STEP grant.
The Statement of Revenues, Expenditures, and Changes in Fund Balance, Budget and Actual-Cash Basis is presented to provide information on the budget as originally prepared and the final budget on which the Partnership operated for the fiscal year. Also, the final budget is compared to the cash basis actual results by revenue source and expenditure activity. The Partnership’s budget, as originally prepared, included revenue provided by the COV of approximately $48.5 million. This amount was increased by $1.0 million for economic development opportunity project funding, as well as $1.5 million for the administration of new and expanding programs, offset by a $.5 million reduction for marketing and trade mission funding.
Actual expenditures were below the final budget by approximately $19.1 million for the fiscal year. This underspending was primarily in the Talent Solutions – Talent Accelerator Program, International Trade and Pass-through Payments.
The Partnership received additional FY2024 COV funding related to the expansion of VOEE. The Partnership will continue to seek funding for other important initiatives critical to its success during the FY2025 – FY2026 biennial budget cycle, including the Innovative Framework for Economic Growth, continued expansion of VOEE, expansion of Real Estate Solutions, and funding for the VEDP office in Taiwan.
The notes provide additional information that is essential to a full understanding of the data provided in the government-wide and fund financial statements. The notes describe the nature of the Partnership’s reporting entity and the relationship to the COV as a whole, the basis on which the financial statements were prepared, and the methods used for presentation. Further, the notes provide explanations of specific accounts with significant balances.
This financial report is designed to provide a general overview of the Partnership’s finances for all those with an interest. Questions concerning any of the information provided in this report or requests for additional financial information should be addressed to the President and Chief Executive Officer, Virginia Economic Development Partnership, P.O. Box 798, Richmond, Virginia, 23218-0798.
STATEMENT OF NET POSITION
As of June 30, 2023
OF ACTIVITIES
For the Fiscal Year Ended June 30, 2023
The accompanying notes are an integral part of the financial statements.
GOVERNMENTAL FUNDS
As of June 30, 2023
(Note 2)
and Fund Balances
Amounts reported for governmental activities in the statement of net position are different because:
Capital assets used in governmental activities are not financial resources and, therefore, are not reported in the funds.
Restricted net other postemployment asset is not a financial resource and, therefore, is not reported in the funds.
Deferred outflows and deferred inflows associated with pension and other postemployment benefit related costs are longterm in nature and, therefore, not reported in the funds.
Noncurrent liabilities (compensated absences, long-term lease liability, long-term SBITA liability, net pension liability and net other postemployment obligation) are not due and payable with current financial resources and, therefore, not reported in the funds.
The accompanying notes are an integral part of the financial statements.
ECONOMIC DEVELOPMENT PARTNERSHIP STATEMENT OF REVENUES, EXPENDITURES, AND CHANGES IN FUND BALANCES OF GOVERNMENTAL FUNDS
For the Fiscal Year Ended June 30, 2023
The accompanying notes are an integral part of the financial statements.
RECONCILIATION OF THE STATEMENT OF REVENUES, EXPENDITURES, AND CHANGES IN FUND BALANCES OF GOVERNMENTAL FUNDS TO THE STATEMENT OF ACTIVITIES
For the Fiscal Year Ended June 30, 2023
Amounts reported for governmental activities in the statement of activities are different because:
Net increase (decrease) in fund balance of the governmental funds 1,078,940 $ (2,322,462) 3,234,650
Governmental funds report capital outlays as expenditures. However, in the statement of activities the cost of those assets is allocated over their estimated useful lives and reported as depreciation and amortization expense. This is the amount by which depreciation and amortization expense exceeded capital outlays in the current period.
Some expenses reported in the statement of activities (compensated absences, long-term lease liability, long-term SBITA liability, net pension liability and net other post employment asset and obligation) do not require the use of current financial resources and, therefore, are not reported as expenditures in governmental funds
Increase in net position of governmental activities 1,991,128 $
The accompanying notes are an integral part of the financial statements.
STATEMENT OF REVENUES, EXPENDITURES, AND CHANGES IN FUND BALANCES
BUDGET AND ACTUAL - CASH BASIS
GENERAL AND SPECIAL REVENUE FUNDS For the Fiscal Year Ended June 30, 2023
Budgeted Amounts
Revenues
Expenditures
June 30, 2023 (Note 3)
The accompanying notes are an integral part of the financial statements.
AS OF JUNE 30, 2023
The Virginia Economic Development Partnership (the Partnership) was established on July 1, 1996, by Chapter 638 of the 1995 Acts of Assembly and operates as an authority in accordance with the provisions of Chapter 22 of Title 2.2 of the Code of Virginia. The Partnership’s major activities are to encourage, stimulate, and support the development and expansion of the economy of the Commonwealth.
The Partnership is a component unit of the Commonwealth of Virginia. A separate report is prepared for the Commonwealth of Virginia, which includes all agencies, boards, commissions, and authorities over which the Commonwealth exercises or has the ability to exercise oversight authority. The Partnership is an integral part of the reporting entity of the Commonwealth of Virginia; accordingly, the Partnership’s financial statements are included in the financial statements of the Commonwealth as a discretely presented component unit.
The accompanying financial statements have been prepared in accordance with generally accepted accounting principles. The Statement of Net Position and the Statement of Activities are referred to as “government-wide” financial statements and are reported using the economic resources measurement focus and the accrual basis of accounting Revenues are recorded when earned and expenses are recorded when a liability is incurred, regardless of the timing of related cash flows. Interfund activity and balances between the General Fund and Special Revenue Fund have been eliminated in the government-wide financial statements. The Statement of Activities shows the extent that direct expenses of governmental functions are offset by program revenues. In cases where certain indirect costs have been allocated to the various divisions by headcount, program expenses will include both direct and indirect costs. Program revenues include charges for services and operating grants. Charges for services are comprised primarily of participation fees, sponsorship fees, and shared mission reimbursements. Operating grants are grants awarded to the Partnership from the federal government and other sources. Net investment in capital assets consists of leasehold improvements, furniture, computers and peripheral technology equipment used to deliver program services to clients, as well as right to use intangible lease assets recorded in accordance with GASB 87, Leases (GASB 87), and right to use intangible subscription assets recorded in accordance with GASB 96, Subscription-Based Information Technology Arrangements (GASB 96). Restricted Net position represents the portion of fund balance related to the restricted net other postemployment asset recorded in compliance with GASB 75 due to the Partnership’s participation in the Virginia Retirement System Disability Insurance Program. The remaining Net position balance is classified as unrestricted.
The Balance Sheet and the Statement of Revenues, Expenditures, and Changes in Fund Balances are referred to as “governmental fund” financial statements and are reported using the current financial resources measurement focus and the modified accrual basis of accounting. Revenues are recognized as soon as they are both measurable and available. Revenues are considered available when they are collectible within the current period or soon enough thereafter to pay liabilities of the current period. For this purpose, the Partnership considers revenues to be available if they are collected within 60 days of the end of the current fiscal period. Expenditures generally are recorded when a liability is incurred, as in accrual accounting. However, debt service payments and expenditures related to compensated absences are only recorded when payment is due. The Partnership reports its activities in governmental funds. The general fund is used for its primary operating fund and accounts for all financial transactions not accounted for in the special revenue funds. The special revenue fund is used to account for grant revenues and related expenditures for operating grants awarded to the Partnership by the federal government and other sources. Both the General Fund and Special Revenue Fund are reported as major governmental funds.
Fund balances for the Partnership’s governmental funds financial statements are classified in accordance with Governmental Accounting Standards Board (GASB) Statement No. 54, “Fund Balance Reporting and Governmental Fund Type Definitions.” Fund balances are classified as restricted, committed or assigned if the related resources reported in governmental funds have either externally or internally imposed restrictions on their usage. Nonspendable fund balances represent assets such as prepaid expenses and lease deposits that are unavailable to be spent on future operations. The unassigned fund balances represents the remainder of the fund balances funds.
Operating grants receivable represents the amount due from the federal government for grants that are funded based on reimbursement of expenses paid by the Partnership.
The Partnership’s prepaid expenses include amounts paid for promotional activities, other services and portions of insurance premiums for which the economic benefits had not been received as of June 30, 2023.
Capital assets are defined by the Partnership as those assets with an initial, individual cost of more than $5,000 and an estimated useful life in excess of two years. Such assets are recorded at historical cost or estimated historical cost. Donated capital assets are reported at acquisition value, measured at estimated market value at the date of donation. Capital assets are comprised of leasehold improvements, furniture, and equipment. The cost of normal maintenance and repairs that do not add to the value of the asset or materially extend asset lives are not capitalized.
Capital assets are depreciated using the straight-line method over useful lives of five to ten years.
The Partnership adopted GASB 87 on July 1, 2021. Beginning adjustments to record right to use intangible lease assets (lease asset) and lease liabilities had no effect on beginning net position. For new or modified contracts, the Partnership determines whether the contract is a lease. If the lease contains a non-cancellable term in excess of 12 months (including any options to extend or terminate the lease when exercise is reasonably certain), the Partnership records a lease asset and lease liability. The lease liability is measured at the present value of payments expected to be made during the lease term, and then is reduced by the principal portion of lease payments made. Lease payments are apportioned between interest expense and principal based on an amortization schedule. The lease asset is measured as the initial amount of the lease liability, adjusted for lease payments made at or before the lease commencement date, plus certain initial direct costs, then amortized on a straight line basis over a period that is the shorter of the lease term or the useful life of the asset. The Partnership reports lease assets with a present value of $50,000 or greater and an expected useful life of more than one year.
The Partnership is a lessee for non-cancellable leases of certain office space. The Partnership has recorded a lease liability and lease asset on the Statement of Net Position. Leases with an initial, non-cancellable term of 12 months or less are not recorded on the Statement of Net Position and expense is recognized as incurred over the lease term.
Key estimates and judgments related to leases include how the Partnership determines (1) the discount rate it uses to discount the expected lease payments to present value, (2) lease term, and (3) lease payments. GASB 87 requires a lessee to discount its unpaid lease payments using the interest rate implicit in the lease or, if that rate cannot be determined, its incremental borrowing rate. Since the Partnership cannot determine the interest rate implicit in its leases, the Partnership uses its estimated incremental borrowing rate as the discount rate for its leases.
The lease term for all the Partnership’s leases includes the noncancellable period of the lease plus any additional periods covered by either the Partnership’s option to extend the lease that the Partnership is reasonably certain to exercise, or an option to extend the lease controlled by the lessor.
The Partnership monitors changes in circumstances that would require remeasurement of its leases and will remeasure the lease asset and liability if certain changes occur that are expected to significantly affect the amount of the lease liability.
The Partnership adopted GASB 96 on July 1, 2022. Beginning adjustments to record right to use intangible subscription-based information technology arrangement (SBITA) assets and SBITA liabilities had no effect on beginning net position. For new or modified contracts, the Partnership determines whether the contract is a SBITA. If the SBITA contains a noncancellable term in excess of 12 months (including any options to extend or terminate the lease when exercise is reasonably certain), the Partnership records a SBITA asset and SBITA liability. The SBITA liability is measured at the present value of payments expected to be made during the SBITA term, and then is reduced by the principal portion of SBITA payments made. SBITA payments are apportioned between interest expense and principal based on an amortization schedule. The SBITA asset is measured as the initial amount of the SBITA
liability, adjusted for SBITA payments made at or before the SBITA commencement date, plus certain initial direct costs, then amortized on a straight line basis over a period that is the SBITA term. The Partnership reports SBITA assets with a present value of $50,000 or greater and a subscription term of more than one year.
The Partnership has recorded a SBITA liability and SBITA asset on the Statement of Net Position. SBITAs with an initial, non-cancellable term of 12 months or less are not recorded on the Statement of Net Position and expense is recognized as incurred over the subscription term.
Key estimates and judgments related to SBITAs include how the Partnership determines (1) the discount rate it uses to discount the expected SBITA payments to present value, (2) SBITA term, and (3) SBITA payments. GASB 96 requires a subscriber to discount its unpaid SBITA payments using the interest rate implicit in the agreement or, if that rate cannot be determined, its incremental borrowing rate. Since the Partnership cannot determine the interest rate implicit in its SBITAs, the Partnership uses its estimated incremental borrowing rate as the discount rate for its SBITAs.
The subscription term for all the Partnership’s SBITAs includes the noncancellable period of the SBITA plus any additional periods covered by the Partnership’s option to extend the SBITA that the Partnership is reasonably certain to exercise.
The Partnership monitors changes in circumstances that would require remeasurement of its SBITAs and will remeasure the SBITA asset and liability if certain changes occur that are expected to significantly affect the amount of the SBITA liability.
Unearned revenue includes amounts received for sponsorship and participation fees at June 30, 2023, for various events to be held in the next fiscal period.
Compensated absences represent the amounts of vacation, sick, and compensatory leave earned by the Partnership employees, but not taken at June 30, 2023. Compensated absences were calculated in accordance with GASB Statement No. 16, “Accounting for Compensated Absences.” This statement requires the accrual of Social Security and Medicare taxes to be paid by the Partnership on all accrued compensated absences.
The Virginia Retirement System (VRS) State Employee Retirement Plan is a single employer pension plan that is treated like a cost-sharing plan. For purposes of measuring the net pension liability, deferred outflows of resources and deferred inflows of resources related to pensions, and pension expense, information about the fiduciary net position of the VRS State Employee Retirement Plan; and the additions to/deductions from the VRS State Employee Retirement Plan’s fiduciary net position have been determined on the same basis as they were reported by VRS. For this purpose, benefit payments (including refunds of employee contributions) are recognized when due and payable in accordance with the benefit terms. Investments are reported at fair value.
The VRS State Employee Health Insurance Credit Program is a single employer plan that is presented as a multiple-employer, cost-sharing plan. The State Employee Health Insurance Credit Program was established pursuant to §51.1-1400 et seq. of the Code of Virginia, as amended, and which provides the authority under which benefit terms are established or may be amended. The State Employee Health Insurance Credit Program is a defined benefit plan that provides a credit toward the cost of health insurance coverage for retired state employees. For purposes of measuring the net State Employee Health Insurance Credit Program OPEB liability, deferred outflows of resources and deferred inflows of resources related to the State Employee Health Insurance Credit Program OPEB, and the State Employee Health Insurance Credit Program OPEB expense, information about the fiduciary net position of the VRS State Employee Health Insurance Credit Program; and the additions to/deductions from the VRS State Employee Health Insurance Credit Program’s fiduciary net position have been determined on the same basis as they were reported by VRS. For this purpose, benefit payments are recognized when due and payable in accordance with the benefit terms. Investments are reported at fair value.
The VRS Group Life Insurance Program is a multiple employer, cost-sharing plan. It provides coverage to state employees, teachers, and employees of participating political subdivisions. The Group Life Insurance Program was established pursuant to §51.1-500 et seq. of the Code of Virginia, as amended, and which provides the authority under which benefit terms are established or may be amended. The Group Life Insurance Program is a defined benefit plan that provides a basic group life insurance benefit for employees of participating employers. For purposes of measuring the net Group Life Insurance Program OPEB liability, deferred outflows of resources and deferred inflows of resources related to the Group Life Insurance Program OPEB, and Group Life Insurance OPEB expense, information about the fiduciary net position of the VRS Group Life Insurance Program OPEB and the additions to/deductions from the VRS Group Life Insurance Program OPEB’s net fiduciary position have been determined on the same basis as they were reported by VRS. In addition, benefit payments are recognized when due and payable in accordance with the benefit terms. Investments are reported at fair value.
The VRS Disability Insurance Program (Virginia Sickness and Disability Program) is a single employer plan that is presented as a multiple-employer, cost-sharing plan. The Disability Insurance Program was established pursuant to §51.1-1100 et seq. of the Code of Virginia, as amended, and which provides the authority under which benefit terms are established or may be amended. The Disability Insurance Program is a managed care program that provides sick, family and personal leave and short-term and long-term disability benefits for state employees. For purposes of measuring the net Disability Insurance Program OPEB asset, deferred outflows of resources and deferred inflows of resources related to the Disability Insurance Program OPEB, and Disability Insurance Program OPEB expense, information about the fiduciary net position of the VRS Disability Insurance Program OPEB Plan and the additions to/deductions from the VRS Disability Insurance Program OPEB Plan’s net fiduciary position have been determined on the same basis as they were reported by VRS. In addition, benefit
payments are recognized when due and payable in accordance with the benefit terms. Investments are reported at fair value.
The Commonwealth of Virginia State Health Plans Program for Pre-Medicare Retirees (PreMedicare Retiree Healthcare Plan) is a single-employer defined benefit OPEB plan that is treated like a cost-sharing plan for financial reporting purposes. This program was established by Title 2.2, Chapter 28 of the Code of Virginia for retirees who are not yet eligible to participate in Medicare. It is the same health insurance program offered to active employees and managed by the Virginia Department of Human Resource Management. After retirement, the Partnership no longer subsidizes the retiree’s premium; however, since both active employees and retirees are included in the same pool for purposes of determining health insurance rates, retiree rates are effectively lower than what might otherwise be available outside of this benefit.
Deferred outflows of resources are defined as the consumption of net assets applicable to a future reporting period. The deferred outflows of resources have a positive effect on net position similar to assets.
Deferred inflows of resources are defined as the acquisition of net assets applicable to a future reporting period. The deferred inflows of resources have a negative effect on net position similar to liabilities.
The Partnership’s budget was primarily established by the Appropriation Act as enacted by the General Assembly of Virginia for the fiscal year ended June 30, 2023, which is the first year of the biennium ended June 30, 2024. No payments were made to the Partnership out of the state treasury except in pursuance of appropriations made by law. Payments from the state treasury were deposited into Partnership bank accounts in accordance with the provisions of Chapter 22 of Title 2.2 of the Code of Virginia and expended for purposes as stated in those provisions. The budget is prepared on the cash basis. The budget is prepared collectively to include both the General Fund and Special Revenue Fund
The fiscal year ended June 30, 2022 has been restated to include an additional year of lease term for a right to use intangible leased asset pursuant to GASB 87. The restatement is as follows:
Net Position June 30, 2022 $ 3,754,784 Right to use intangible lease assets 69,808
Long-term lease liability, current (2,222)
Long-term lease liability, noncurrent (74,423)
Adjusted Net Position June 30, 2022 $ 3,747,947
Cash and cash equivalents represent deposits not with the Treasurer of Virginia and cash in the Local Government Investment Pool (LGIP) with the Treasurer of Virginia. As of June 30, 2023, the Partnership’s deposits with the LGIP were $18,351,267 and the Partnership’s deposits not with the Treasurer of Virginia were $155,639. Cash on deposit is held in demand deposit accounts maintained for operating and payroll costs and is covered by federal depository insurance and carry no significant risk. Cash on deposit includes a deposit in European Union Euros used to pay the Partnership’s international vendors and is valued in U.S. dollars at cost. As of June 30, 2023, the Partnership’s holding in European Union Euros was valued at $26,469. The LGIP funds are held in pooled accounts, are considered cash equivalents and, accordingly, also carry no significant risk as defined by Statement 40 of the Governmental Accounting Standards Board. The LGIP enables governmental entities to maximize their return on investments by providing for a State administered fund where monies can be commingled for investment purposes in order to realize the economies of large-scale investing and professional funds management. The LGIP is managed in accordance with the requirements of Governmental Accounting Standards Board (GASB) Statement No. 79. The LGIP is in compliance with all of the standards of GASB Statement No. 79 and elects to report its investments for financial reporting at amortized cost. Participants in the LGIP should also report their investments in the LGIP at amortized cost. The LGIP is rated AAAm by Standard & Poor’s rating service. The Partnership deposits are secured in accordance with the provisions of the Virginia Security for Public Deposit Act § 2.2-4400 of the Code of Virginia
The accompanying Statement of Revenues, Expenditures, and Changes in Fund Balances - Budget and Actual - Cash Basis – General and Special Revenue Funds presents comparisons of the legally adopted budget prepared on the cash basis with actual data prepared on the cash basis. To enhance this comparison, actual data on the cash basis is reconciled to actual data on the GAAP basis as follows:
Total all Funds
Fund balance, cash basis, June 30, 2023 $ 18,341,653
Add: Prepaid expenses and other accrued receivables 2,620,937
Less: Accrued expenses and unearned revenues (1,950,868)
Fund balance, GAAP basis, June 30, 2023 $ 19,011,722
The original appropriation from the General Fund of the Commonwealth has been adjusted as follows:
Chapter 2 $ 48,504,192
5. LEASE DEPOSITS
The Partnership maintains offices in Virginia Beach, Virginia, Munich, Germany, and Tokyo, Japan. Each landlord requires a lease deposit as part of the lease agreement for those locations. The Virginia Beach lease deposit is held in U.S. dollars in a noninterest-bearing account and is valued at $400. The Munich lease deposit is held in a noninterest-bearing account in the amount of 3,720 European Union Euros and was valued at $4,254 at June 30, 2023. The Tokyo lease deposit is held in a noninterest-bearing account in the amount of 930,000 Japanese Yen and was valued at $8,593 at June 30, 2023.
Capital asset activity for the fiscal year ended June 30, 2023, was as follows: Capital Assets Being Depreciated or Amortized
improvements,
Less accumulated depreciation and amortization for:
Capital assets, net of accumulated depreciation and amortization $
*Capital Asset beginning balances as of July 1, 2022, have been restated to include additional year of lease term for a right to use intangible leased asset pursuant to GASB 87. In addition, Capital Asset beginning balances as of July 1, 2022 have been restated to record right to use intangible SBITA assets pursuant to GASB 96. In 2023, the Partnership recognized the value of subscription-based information technology arrangements under long-term contracts per implementation of GASB 96. These assets were previously accounted for as operating expenditures over the subscription terms and not recognized on the financial statements.
The Partnership is committed under leases for various office space through October 2030. A summary of changes in long-term lease liability for the fiscal year ended June 30, 2023 follows:
July 1, 2022* Increases Decreases June 30, 2023
$ 18,673,861 $ 76,541 $ 1,895,236 $ 16,855,166 Due Within One Year (2,003,117) Due in More Than One Year $ 14,852,049
Future principal and interest payments related to the long-term lease liability as of June 30, 2023 are as follows:
*Long-Term Lease Liability beginning balances as of July 1, 2022, have been restated to include additional year of lease term for a lease liability pursuant to GASB 87.
As a result of adopting GASB 96, the Partnership recognized SBITA liabilities of $308,536 with a corresponding right to use intangible SBITA asset for the same amount. A summary of changes in long-term SBITA liability for the fiscal year ended June 30, 2023 follows:
308,536
2023
Due Within One Year (207,397)
Due in More Than One Year $ -
Future principal and interest payments related to the long-term SBITA liability as of June 30, 2023 are as follows:
Compensated absences activity for the fiscal year ended June 30, 2023, was as follows:
1, 2022
30, 2023
$ 1,272,442 $ 1,258,260 $ 938,905 $ 1,591,797
Due Within One Year (1,085,085)
Due in More Than One Year $ 506,712
General Information about the Pension Plan
Plan Description
All Partnership full-time, salaried permanent employees are automatically covered by the VRS State Employee Retirement Plan upon employment. This plan is administered by the Virginia Retirement System (the System) along with plans for other employer groups in the Commonwealth of Virginia. Members earn one month of service credit for each month they are employed and for which they and their employer pay contributions to VRS. Members are eligible to purchase prior service, based on specific criteria as defined in the Code of Virginia, as amended. Eligible prior service that may be purchased includes prior public service, active military service, certain periods of leave, and previously refunded service.
The System administers three different benefit structures for covered employees in the VRS State Employee Retirement Plan – Plan 1, Plan 2, and Hybrid. Each of these benefit structures has different eligibility criteria. The specific information for each plan and the eligibility for covered groups within each plan are set out in the table below:
About Plan 1
Plan 1 is a defined benefit plan. The retirement benefit is based on a member’s age, service credit and average final compensation at retirement using a formula.
About Plan 2
Same as Plan 1.
The Hybrid Retirement Plan combines the features of a defined benefit plan and a defined contribution plan.
• The defined benefit is based on a member’s age, service credit and average final compensation at retirement using a formula.
• The benefit from the defined contribution component of the plan depends on the member and employer contributions made to the plan and the investment performance of those contributions.
• In addition to the monthly benefit payment payable from the defined benefit plan at retirement, a member may start receiving distributions from the balance in the defined contribution account, reflecting the contributions, investment gains or losses, and any required fees.
Employees are in Plan 1 if their membership date is before July 1, 2010, and they were vested as of January 1, 2013, and they have not taken a refund.
Employees are in Plan 2 if their membership date is from July 1, 2010, to December 31, 2013, and they have not taken a refund, or their membership date is prior to July 1, 2010, and they were not vested as of January 1, 2013.
Employees are in the Hybrid Retirement Plan if their membership date is on or after January 1, 2014. This includes:
• Full-time permanent, salaried state employees.*
• Members in Plan 1 or Plan 2 who elected to opt into the plan during the election window held January 1April 30, 2014; the plan’s effective date for opt-in members was July 1, 2014
Some employees are not eligible to participate in the Hybrid Retirement Plan. They include:
• Members of the Virginia Law Officers’ Retirement System (VaLORS)
Hybrid Opt-In Election
VRS Plan 1 members were allowed to make an irrevocable decision to opt into the Hybrid Retirement Plan during a special election window held January 1 through April 30, 2014.
The Hybrid Retirement Plan’s effective date for eligible Plan 1 members who opted in was July 1, 2014.
If eligible deferred members returned to work during the election window, they were also eligible to opt into the Hybrid Retirement Plan.
Hybrid Opt-In Election
Same as Plan 1.
Those employees eligible for an optional retirement plan (ORP) must elect the ORP plan or the Hybrid Retirement Plan. If these members have prior service under Plan 1 or Plan 2, they are not eligible to elect the Hybrid Retirement Plan and must select Plan 1 or Plan (as applicable) or ORP.
State employees, excluding state elected officials, and optional retirement plan participants, contribute 5% of their compensation each month to their member contribution account through a pre-tax salary reduction. Member contributions are tax-deferred until they are withdrawn as part of a retirement benefit or as a refund. The employer makes a separate actuarially determined contribution to VRS for all covered employees. VRS invests both member and employer contributions to provide funding for the future benefit payments.
Service credit includes active service. Members earn service credit for each month they are employed in a covered position. It also may include credit for prior service the member has purchased or additional service credit the member was granted. A member’s total service credit is one of the factors used to determine their eligibility for retirement and to calculate their retirement benefit. It also may count toward eligibility for the health insurance credit in retirement, if the employer offers the health insurance credit.
Same as Plan 1.
A member’s retirement benefit is funded through mandatory and voluntary contributions made by the member and the employer to both the defined benefit and the defined contribution components of the plan. Mandatory contributions are based on a percentage of the employee’s creditable compensation and are required from both the member and the employer. Additionally, members may choose to make voluntary contributions to the defined contribution component of the plan, and the employer is required to match those voluntary contributions according to specified percentages.
Same as Plan 1.
Under the defined benefit component of the plan, service credit includes active service. Members earn service credit for each month they are employed in a covered position. It also may include credit for prior service the member has purchased or additional service credit the member was granted.
Defined Benefit Component:
A member’s total service credit is one of the factors used to determine their eligibility for retirement and to calculate their retirement benefit. It also may count toward eligibility for the health insurance credit in retirement, if the employer offers the health insurance credit.
Under the defined contribution component, service credit is used to determine vesting for the employer contribution portion of the plan.
Vesting is the minimum length of service a member needs to qualify for a future retirement benefit. Members become vested when they have at least five years (60 months) of service credit. Vesting means members are eligible to qualify for retirement if they meet the age and service requirements for their plan.
Members also must be vested to receive a full refund of their member contribution account balance if they leave employment and request a refund.
Same as Plan 1.
Defined Benefit Component:
Defined benefit vesting is the minimum length of service a member needs to qualify for a future retirement benefit. Members are vested under the defined benefit component of the Hybrid Retirement Plan when they reach five years (60 months) of service credit. Plan 1 or Plan 2 members with at least five years (60 months) of service credit who opted into the Hybrid Retirement Plan remain vested in the defined benefit component.
Vesting
Members are always 100% vested in the contributions that they make.
Vesting Defined Contributions Component:
Defined contribution vesting refers to the minimum length of service a member needs to be eligible to withdraw the employer contributions from the defined contribution component of the plan.
Members are always 100% vested in the contributions that they make.
Upon retirement or leaving covered employment, a member is eligible to withdraw a percentage of employer contributions to the defined contribution component of the plan, based on service.
• After two years, a member is 50% vested and may withdraw 50% of employer contributions.
• After three years, a member is 75% vested and may withdraw 75% of employer contributions.
• After four or more years, a member is 100% vested and may withdraw 100% of employer contributions.
Distributions not required, except as governed by law.
Calculating the Benefit
The basic benefit is determined using the average final compensation, service credit and plan multiplier. An early retirement reduction is applied to this amount if the member is retiring with a reduced benefit. In cases where the member has elected an optional form of retirement payment, an option factor specific to the option chosen is then applied.
A member’s average final compensation is the average of their 36 consecutive months of highest compensation as a covered employee.
The retirement multiplier is a factor used in the formula to determine a final retirement benefit. The retirement multiplier for non-hazardous duty members is 1.70%
Calculating the Benefit
See definition under Plan 1.
Calculating the Benefit
Defined Benefit Component:
See definition under Plan 1.
Defined Contribution Component:
The benefit is based on contributions made by the member and any matching contributions made by the employer, plus net investment earnings on those contributions.
A member’s average final compensation is the average of their 60 consecutive months of highest compensation as a covered employee.
Same as Plan 1 for service earned, purchased or granted prior to January 1, 2013. For non-hazardous duty members the retirement multiplier is 1.65% for service credit earned, purchased, or granted on or after January 1, 2013.
Average Final Compensation
Same as Plan 2. It is used in the retirement formula for the defined benefit component of the plan.
Service Retirement Multiplier
Defined Benefit Component:
The retirement multiplier for the defined benefit component is 1.00%.
For members who opted into the Hybrid Retirement Plan from Plan 1 or Plan 2, the applicable multipliers for those plans will be used to calculate the retirement benefit for service credited in those plans.
Defined Contribution Component:
Not applicable.
Normal Retirement Age
Age 65.
Earliest Unreduced Retirement Eligibility
Age 65 with at least five years (60 months) of service credit or at age 50 with at least 30 years of service credit.
Normal Retirement Age
Normal Social Security retirement age.
Normal Retirement Age
Defined Benefit Component: Same as Plan 2.
Defined Contribution Component:
Members are eligible to receive distributions upon leaving employment, subject to restrictions.
Earliest Reduced Retirement Eligibility
Age 55 with at least five years (60 months) of service credit or age 50 with at least 10 years of creditable service.
Earliest Unreduced Retirement Eligibility
Normal Social Security retirement age with at least five years (60 months) of service credit or when their age and service equal 90.
Earliest Unreduced Retirement Eligibility
Defined Benefit Component: Same as Plan 2.
Defined Contribution Component:
Members are eligible to receive distributions upon leaving employment, subject to restrictions.
Earliest Reduced Retirement Eligibility
Age 60 with at least five years (60 months) of service credit.
Earliest Reduced Retirement Eligibility
Defined Benefit Component: Same as Plan 2.
Defined Contribution Component:
Members are eligible to receive distributions upon leaving employment, subject to restrictions.
Cost-of-Living Adjustment (COLA) in Retirement
The Cost-of-Living Adjustment (COLA) matches the first 3% increase in the Consumer Price Index for all Urban Consumers (CPI-U) and half of any additional increase (up to 4%) up to a maximum COLA of 5%.
Eligibility:
For members who retire with an unreduced benefit or with a reduced benefit with at least 20 years of service credit, the COLA will go into effect on July 1 after one full calendar year from the retirement date.
For members who retire with a reduced benefit and who have less than 20 years of service credit, the COLA will go into effect on July 1 after one calendar year following the unreduced retirement eligibility date.
Exceptions to COLA Effective Dates:
The COLA is effective July 1 following one full calendar year (January 1 to December 31) under any of the following circumstances:
• The member is within five years of qualifying for an unreduced retirement benefit as of January 1, 2013.
• The member retires on disability.
Cost-of-Living Adjustment (COLA) in Retirement
The Cost-of-Living Adjustment (COLA) matches the first 2% increase in the CPI-U and half of any additional increase (up to 2%), for a maximum COLA of 3%.
Eligibility:
Same as Plan 1.
Cost-of-Living Adjustment (COLA) in Retirement
Defined Benefit Component: Same as Plan 2.
Defined Contribution Component: Not applicable.
Eligibility:
Same as Plan 1 and Plan 2.
Exceptions to COLA Effective Dates:
Same as Plan 1.
Exceptions to COLA Effective Dates:
Same as Plan 1 and Plan 2.
Cost-of-Living Adjustment (COLA) in Retirement
Exceptions to COLA Effective Dates:
• The member retires directly from short-term or long-term disability.
• The member is involuntarily separated from employment for causes other than job performance or misconduct and is eligible to retire under the Workforce Transition Act or the Transitional Benefits Program.
• The member dies in service and the member’s survivor or beneficiary is eligible for a monthly death-in-service benefit.
The COLA will go into effect on July 1 following one full calendar year (January 1 to December 31) from the date the monthly benefit begins.
Disability Coverage
For members who are eligible to be considered for disability retirement and retire on disability, the retirement multiplier is 1.70% on all service, regardless of when it was earned, purchased or granted.
For members who are eligible to be considered for disability retirement and retire on disability, the retirement multiplier is 1.65% on all service, regardless of when it was earned, purchased or granted.
State employees (including Plan 1 and Plan 2 opt-ins) participating in the Hybrid Retirement Plan are covered under the Virginia Sickness and Disability Program (VSDP), and are not eligible for disability retirement.
Disability Coverage
Most state employees are covered under the Virginia Sickness and Disability Program (VSDP), and are not eligible for disability retirement.
VSDP members are subject to a one-year waiting period before becoming eligible for non-workrelated disability benefits.
Members may be eligible to purchase service from previous public employment, active duty military service, an eligible period of leave or VRS refunded service as service credit in their Plan. Prior service credit counts toward vesting, eligibility for retirement and the health insurance credit. Only active members are eligible to purchase prior service. Members also may be eligible to purchase periods of leave without pay.
Disability Coverage
Most state employees are covered under the Virginia Sickness and Disability Program (VSDP), and are not eligible for disability retirement.
VSDP members are subject to a one-year waiting period before becoming eligible for non-workrelated disability benefits.
Same as Plan 1.
Disability Coverage
Hybrid members (including Plan 1 and Plan 2 opt-ins) covered under VSDP are subject to a oneyear waiting period before becoming eligible for non-workrelated disability benefits.
Purchase of Prior Service
Defined Benefit Component:
Same as Plan 1, with the following exception:
• Hybrid Retirement Plan members are ineligible for ported service.
Defined Contribution Component:
Not applicable.
The contribution requirement for active employees is governed by §51.1-145 of the Code of Virginia, as amended, but may be impacted as a result of funding provided to the Partnership by the Virginia General Assembly. Employees are required to contribute 5.00% of their compensation toward their retirement. The Partnership’s contractually required contribution rate for the year ended June 30, 2023, was 14.46% of covered employee compensation for employees in the VRS State Employee Retirement Plan. This rate was based on an actuarially determined rate from an actuarial valuation as of June 30, 2021. The actuarially determined rate, when combined with employee contributions, was expected to finance the costs of benefits earned by employees during the year, with an additional amount to finance any unfunded accrued liability. Contributions from the Partnership to the VRS State Employee Retirement Plan were $2,444,199 and $2,075,923 for the years ended June 30, 2023 and June 30, 2022, respectively.
In June 2022, the Commonwealth made a special contribution of approximately $219.1 million to the VRS State plan. This special payment was authorized by Chapter 1 of the 2022 Appropriation Act, and is classified as special employer contributions.
At June 30, 2023, the Partnership reported a liability of $13,177,756 for its proportionate share of the VRS State Employee Retirement Plan Net Pension. The Net Pension Liability was measured as of June 30, 2022, and the total pension liability used to calculate the Net Pension Liability was determined by an actuarial valuation performed as of June 30, 2021, and rolled forward to the measurement date of June 30, 2022. The Partnership’s proportion of the Net Pension Liability was based on the Partnership’s actuarially determined employer contributions to the pension plan for the year ended June 30, 2022, relative to the total of the actuarially determined employer contributions for all participating employers. At June 30, 2022, the Partnership’s proportion of the VRS State Employee Retirement Plan was 0.29036% as compared to 0.26227% at June 30, 2021.
For the year ended June 30, 2023, the Partnership recognized pension expense of $2,130,940 for the VRS State Employee Retirement Plan. Since there was a change in proportionate share between June 30, 2021, and June 30, 2022, a portion of the pension expense was related to deferred amounts from changes in proportion and differences between employer contributions and the proportionate share of employer contributions.
At June 30, 2023, the Partnership reported deferred outflows of resources and deferred inflows of resources related to pensions from the following sources:
Differences between expected and actual experience $ - $ 871,609
Net difference between projected and actual earnings on pension plan investments - 1,920,667 Change in assumptions 528,706Changes in proportion and differences between employer contributions and proportionate share of contributions
Employer contribution subsequent to the measurement date
$2,444,199 reported as deferred outflows of resources related to pensions resulting from the Partnership’s contributions subsequent to the measurement date will be recognized as a reduction of the Net Pension Liability in the Fiscal Year ending June 30, 2024. Other amounts reported as deferred outflows of resources and deferred inflows of resources related to pensions will be recognized in pension expense in future reporting periods as follows:
FY 2024 $ 252,970
FY 2025 $ (222,274)
FY 2026 $ (1,203,855)
FY 2027 $ 908,480
FY 2028 $ -
The total pension liability for the VRS State Employee Retirement Plan was based on an actuarial valuation as of June 30, 2021, using the Entry Age Normal actuarial cost method and the following assumptions, applied to all periods included in the measurement and rolled forward to the measurement date of June 30, 2022.
Investment rate of return 6.75%, net of pension plan investment expenses, including inflation
Mortality rates:
Pre-Retirement:
Pub-2010 Amount Weighted General Employee Rates projected generationally; females set forward 2 years
Post-Retirement:
Pub-2010 Amount Weighted General Healthy Retiree Rates projected generationally; 110% of rates for females
Post-Disablement:
Pub-2010 Amount Weighted General Disabled Rates projected generationally; males and females set forward 3 years
Beneficiaries and Survivors:
Pub-2010 Amount Weighted General Contingent Annuitant Rates projected generationally; 110% of rates for males and females
Mortality Improvement:
Rates projected generationally with Modified MP-2020 Improvement Scale that is 75% of the MP-2020 rates
The actuarial assumptions used in the June 30, 2021 valuation were based on the results of an actuarial experience study for the period from July 1, 2016 through June 30, 2020, except the change in the discount rate, which was based on VRS Board action effective as of July 1, 2019. Changes to the actuarial assumptions as a result of the experience study and VRS Board action are as follows:
Mortality Rates (Pre-retirement, post-retirement healthy, and disabled)
Retirement Rates
Withdrawal Rates
Disability Rates
Salary Scale
Line of Duty Disability
Discount Rate
Update to PUB2010 public sector mortality tables. For future mortality improvements, replace load with a modified Mortality Improvement Scale MP2020
Adjusted rates to better fit experience for Plan 1; set separate rates based on experience for Plan 2/Hybrid; changed final retirement ages from 75 to 80 for all
Adjusted rates to better fit experience at each year age and service through 9 years of service
No change
No change
No change
No change
The net pension liability (NPL) is calculated separately for each plan and represents that particular plan’s total pension liability determined in accordance with GASB Statement No. 67, less that plan’s fiduciary net position. As of June 30, 2022, NPL amounts for the VRS State Employee Retirement Plan are as follows (amounts expressed in thousands):
State Employee Retirement Plan
Total Pension Liability $ 27,117,746 Plan Fiduciary Net Position 22,579,326
Employers’ Net Pension Liability (Asset) $ 4,538,420
Plan Fiduciary Net Position as a Percentage of the Total Pension Liability 83.26%
The total pension liability is calculated by the System’s actuary, and each plan’s fiduciary net position is reported in the System’s financial statements. The net pension liability is disclosed in accordance with the requirements of GASB Statement No. 67 in the System’s notes to the financial statements and required supplementary information.
The long-term expected rate of return on pension System investments was determined using a log-normal distribution analysis in which best-estimate ranges of expected future real rates of return (expected returns, net of pension System investment expense and inflation) are developed for each major asset class. These ranges are combined to produce the long-term expected rate of return by weighting the expected future real rates of return by the target asset allocation percentage and by adding expected inflation. The target asset allocation and best estimate of arithmetic real rates of return for each major class are summarized in the following table:
(Strategy)
* The above allocation provides a one-year expected return of 7.83%. However, one-year returns do not take into account the volatility present in each of the asset classes. In setting the long-term expected return for the System, stochastic projections are employed to model future returns under various economic conditions. These results provide a range of returns over various time periods that ultimately provide a median return of 6.72%, including expected inflation of 2.50%.
On October 10, 2019, the VRS Board elected a long-term rate of return of 6.75%, which was roughly at the 40th percentile of expected long-term results of the VRS fund asset allocation at that time, providing a median return of 7.11%, including expected inflation of 2.50%.
The discount rate used to measure the total pension liability was 6.75%. The projection of cash flows used to determine the discount rate assumed that System member contributions will be made per the VRS Statutes and the employer contributions will be made in accordance with the VRS funding policy at rates equal to the difference between actuarially determined contribution rates adopted by the VRS Board of Trustees and the member rate. Through the fiscal year ending June 30, 2022, the rate contributed by the state agency for the VRS State Employee Retirement Plan will be subject to the portion of the VRS Board-certified rates that are funded by the Virginia General Assembly, which was 100% of the actuarially determined contribution rate. From July 1, 2022, on, all agencies are assumed to continue to contribute 100% of the actuarially determined contribution rates. Based on those assumptions, the pension plan’s fiduciary net
position was projected to be available to make all projected future benefit payments of current active and inactive employees. Therefore, the long-term expected rate of return was applied to all periods of projected benefit payments to determine the total pension liability.
The following presents the Partnership’s proportionate share of the VRS State Employee Retirement Plan net pension liability using the discount rate of 6.75%, as well as what the Partnership’s proportionate share of the net pension liability would be if it were calculated using a discount rate that is one percentage point lower (5.75%) or one percentage point higher (7.75%) than the current rate:
Partnership’s proportionate share of the VRS State Employee Retirement Plan Net Pension Liability $
Detailed information about the VRS State Employee Retirement Plan’s Fiduciary Net Position is available in the separately issued VRS 2022 Annual Report. A copy of the 2022 VRS Annual Report may be downloaded from the VRS website at varetire.org/pdf/ publications/2022-annual-report.pdf, or by writing to the System’s Chief Financial Officer at P.O. Box 2500, Richmond, VA 23218-2500.
General Information about the State Employee Health Insurance Credit Program
Plan Description
All Partnership full-time, salaried permanent employees are automatically covered by the VRS State Employee Health Insurance Credit Program. This plan is administered by the Virginia Retirement System (the System), along with pension and other OPEB plans, for public employer groups in the Commonwealth of Virginia. Members earn one month of service credit toward the benefit for each month they are employed and for which the Partnership pays contributions to VRS. The health insurance credit is a tax-free reimbursement in an amount set by the General Assembly for each year of service credit against qualified health insurance premiums retirees pay for single coverage, excluding any portion covering the spouse or dependents. The credit cannot exceed the amount of the premiums and ends upon the retiree’s death.
The specific information about the State Health Insurance Credit Program OPEB, including eligibility, coverage and benefits is set out in the table below:
The State Employee Retiree Health Insurance Credit Program was established January 1, 1990 for retired state employees covered under VRS, SPORS, VaLORS and JRS who retire with at least 15 years of service credit.
Eligible employees are enrolled automatically upon employment. They include:
• Full-time and part-time permanent salaried state employees covered under VRS, SPORS, VaLORS and JRS.
The State Employee Retiree Health Insurance Credit Program provides the following benefits for eligible employees:
• At Retirement – For state employees who retire, the monthly benefit is $4.00 per year of service per month with no cap on the benefit amount.
• Disability Retirement – For state employees, other than state police officers, who retire on disability or go on long-term disability under the Virginia Sickness and Disability Program (VSDP), the monthly benefit is $120.00 or $4.00 per year of service, whichever is higher.
For state police officer employees with a non-work-related disability who retire on disability or go on long-term disability under the Virginia Sickness and Disability Program (VSDP) the monthly benefit is $120.00 or $4.00 per year of service, whichever is higher.
For state police officers with a work-related disability, there is no benefit provided under the State Employee Retiree Health Insurance Credit Program if the premiums are being paid under the Virginia Line of Duty Act. However, they may receive the credit for premiums paid for other qualified health plans.
• The monthly Health Insurance Credit benefit cannot exceed the individual’s premium amount.
• Employees who retire after being on long-term disability under VSDP must have at least 15 years of service credit to qualify for the Health Insurance Credit as a retiree.
The contribution requirement for active employees is governed by §51.1-1400(D) of the Code of Virginia, as amended, but may be impacted as a result of funding provided to the Partnership by the Virginia General Assembly. The Partnership’s contractually required employer contribution rate for the year ended June 30, 2023 was 1.12% of covered employee compensation for employees in the VRS State Employee Health Insurance Credit Program. This rate was based on an actuarially determined rate from an actuarial valuation as of June 30, 2021. The actuarially determined rate was expected to finance the costs of benefits earned by employees during the year, with an additional amount to finance any unfunded accrued liability. Contributions from the Partnership to the VRS State Employee Health Insurance Credit Program were $189,824 and $161,461 for the years ended June 30, 2023 and June 30, 2022, respectively.
In June 2022, the Commonwealth made a special contribution of approximately $8.5 million which was applied to the Health Insurance Credit Plan for state employees. This special payment was authorized by a budget amendment included in Chapter 1 of the 2022 Appropriation Act.
State Employee Health Insurance Credit Program OPEB Liabilities, State Employee Health Insurance Credit Program OPEB Expense, and Deferred Outflows of Resources and Deferred Inflows of Resources Related to State Employee Health Insurance Credit Program OPEB
At June 30, 2023, the Partnership reported a liability of $1,558,558 for its proportionate share of the VRS State Employee Health Insurance Credit Program Net OPEB Liability. The Net VRS State Employee Health Insurance Credit Program OPEB Liability was measured as of June 30, 2022 and the total VRS State Employee Health Insurance Credit Program OPEB Liability used to calculate the Net VRS State Employee Health Insurance Credit Program OPEB Liability was determined by an actuarial valuation performed as of June 30, 2021, and rolled forward to the measurement date of June 30, 2022. The Partnership’s proportion of the Net VRS State Employee Health Insurance Credit Program OPEB Liability was based on the Partnership’s actuarially determined employer contributions to the VRS State Employee Health Insurance Credit Program OPEB plan for the year ended June 30, 2022 relative to the total of the actuarially determined employer contributions for all participating employers. At June 30, 2022, the Partnership’s proportion of the VRS State Employee Health Insurance Credit Program was 0.19026% as compared to 0.17065% at June 30, 2021.
For the year ended June 30, 2023, the Partnership recognized VRS State Employee Health Insurance Credit Program OPEB expense of $230,486. Since there was a change in proportionate share between measurement dates, a portion of the VRS State Employee Health Insurance Credit Program Net OPEB expense was related to deferred amounts from changes in proportionate share and differences between actual and expected contributions.
At June 30, 2023, the Partnership reported deferred outflows of resources and deferred inflows of resources related to the VRS State Employee Health Insurance Credit Program OPEB from the following sources:
$189,824 reported as deferred outflows of resources related to the State Employee HIC OPEB resulting from the Partnership’s contributions subsequent to the measurement date will be recognized as a reduction of the Net State Employee HIC OPEB Liability in the Fiscal Year ending June 30, 2024. Other amounts reported as deferred outflows of resources and deferred inflows of resources related to the State Employee HIC OPEB will be recognized in the State Employee HIC OPEB expense in future reporting periods as follows:
Year Ended June 30
FY 2024 $ 91,131
FY 2025 $ 72,247
FY 2026 $ 61,654
FY 2027 $ 46,016
FY 2028 $ 22,141 Thereafter $ 652
The total State Employee HIC OPEB liability for the VRS State Employee Health Insurance Credit Program was based on an actuarial valuation as of June 30, 2021, using the Entry Age Normal actuarial cost method and the following assumptions, applied to all periods included in the measurement and rolled forward to the measurement date of June 30, 2022.
Investment rate of return 6.75%, net of plan investment expenses, including inflation
Mortality rates – General State Employees
Pre-Retirement:
Pub-2010 Amount Weighted General Employee Rates projected generationally; females set forward 2 years
Post-Retirement:
Pub-2010 Amount Weighted General Healthy Retiree Rates projected generationally; 110% of rates for females
Post-Disablement:
Pub-2010 Amount Weighted General Disabled Rates projected generationally; males and females set forward 3 years
Beneficiaries and Survivors:
Pub-2010 Amount Weighted General Contingent Annuitant Rates projected generationally; 110% of rates for males and females
Mortality Improvement Scale:
Rates projected generationally with Modified MP-2020 Improvement Scale that is 75% of the MP-2020 rates
The actuarial assumptions used in the June 30, 2021 valuation were based on the results of an actuarial experience study for the period from July 1, 2016 through June 30, 2020, except the change in the discount rate, which was based on VRS Board action effective as of July 1, 2019. Changes to the actuarial assumptions as a result of the experience study and VRS Board action are as follows:
Mortality Rates (Pre-retirement, post-retirement healthy, and disabled)
Retirement Rates
Withdrawal Rates
Disability Rates
Salary Scale
Line of Duty Disability
Discount Rate
Pre-Retirement:
Update to PUB2010 public sector mortality tables. For future mortality improvements, replace load with a modified Mortality Improvement Scale MP2020
Adjusted rates to better fit experience for Plan 1; set separate rates based on experience for Plan2/Hybrid; changed final retirement age from 75 to 80 for all
Adjusted rates to better fit experience at each year age and service through 9 years of service
No change
No change
No change
No change
Pub-2010 Amount Weighted Safety Employee Rates projected generationally; 95% of rates for males; 105% of rates for females set forward 2 years
Post-Retirement:
Pub-2010 Amount Weighted Safety Healthy Retiree Rates projected generationally; 110% of rates for males; 105% of rates for females set forward 3 years
Post-Disablement:
Pub-2010 Amount Weighted General Disabled Rates projected generationally; 95% of rates for males set back 3 years; 90% of rates for females set back 3 years
Beneficiaries and Survivors:
Pub-2010 Amount Weighted Safety Contingent Annuitant Rates projected generationally; 110% of rates for males and females set forward 2 years
Mortality Improvement Scale:
Rates projected generationally with Modified MP-2020 Improvement Scale that is 75% of the MP-2020 rates
The actuarial assumptions used in the June 30, 2021 valuation were based on the results of an actuarial experience study for the period from July 1, 2016 through June 30, 2020, except the change in the discount rate, which was based on VRS Board action effective as of July 1, 2019. Changes to the actuarial assumptions as a result of the experience study and VRS Board action are as follows:
Mortality Rates (Pre-retirement, post-retirement healthy, and disabled)
Retirement Rates
Withdrawal Rates
Disability Rates
Salary Scale
Line of Duty Disability
Discount Rate
Pre-Retirement:
Update to PUB2010 public sector mortality tables. For future mortality improvements, replace load with a modified Mortality Improvement Scale MP2020
Increased rates for ages 55 to 61, 63, and 64 with 26 or more years of service; changed final retirement age from 65 to 70
Decreased rate for 0 years of service and increased rates for 1 to 6 years of service
No change
No change
No change
No change
Pub-2010 Amount Weighted Safety Employee Rates projected generationally; 95% of rates for males; 105% of rates for females set forward 2 years
Post-Retirement:
Pub-2010 Amount Weighted Safety Healthy Retiree Rates projected generationally; 110% of rates for males; 105% of rates for females set forward 3 years
Post-Disablement:
Pub-2010 Amount Weighted General Disabled Rates projected generationally; 95% of rates for males set back 3 years; 90% of rates for females set back 3 years
Beneficiaries and Survivors:
Pub-2010 Amount Weighted Safety Contingent Annuitant Rates projected generationally; 110% of rates for males and females set forward 2 years
Mortality Improvement Scale:
Rates projected generationally with Modified MP-2020 Improvement Scale that is 75% of the MP-2020 rates
The actuarial assumptions used in the June 30, 2021 valuation were based on the results of an actuarial experience study for the period from July 1, 2016 through June 30, 2020, except the change in the discount rate, which was based on VRS Board action effective as of July 1, 2019. Changes to the actuarial assumptions as a result of the experience study and VRS Board actions are as follows:
Mortality Rates (Pre-retirement, post-retirement healthy, and disabled)
Retirement Rates
Withdrawal Rates
Disability Rates
Salary Scale
Line of Duty Disability
Discount Rate
Pre-Retirement:
Update to PUB2010 public sector mortality tables. For future mortality improvements, replace load with a modified Mortality Improvement Scale MP2020
Increased rates at some younger ages, decreased at age 62, and changed final retirement age from 65 to 70
Adjusted rates to better fit experience at each year age and service through 9 years of service
No change
No change
No change
No change
Pub-2010 Amount Weighted General Employee Rates projected generationally; males set forward 2 years
Post-Retirement:
Pub-2010 Amount Weighted General Healthy Retiree Rates projected generationally; 95% of rates for males and females set back 2 years
Post-Disablement:
Pub-2010 Amount Weighted General Disabled Rated projected generationally
Beneficiaries and Survivors:
Pub-2010 Amount Weighted Safety Contingent Annuitant Rates projected generationally
Mortality Improvement Scale:
Rates projected generationally with Modified MP-2020 Improvement Scale that is 75% of the MP-2020 rates
The actuarial assumptions used in the June 30, 2021 valuation were based on the results of an actuarial experience study for the period from July 1, 2016 through June 30, 2020, except the change in the discount rate, which was based on VRS Board action effective as of July 1, 2019. Changes to the actuarial assumptions as a result of the experience study and VRS Board action are as follows:
Mortality Rates (Pre-retirement, post-retirement healthy, and disabled)
Retirement Rates
Withdrawal Rates
Disability Rates
Salary Scale
Discount Rate
Review separately from State employees because exhibit fewer deaths. Update to PUB2010 public sector mortality tables. For future mortality improvements, replace load with a modified Mortality Improvement Scale MP-2020
Decreased rates for ages 60-66 and 70-72
No change
No change
Reduce increases across all ages by 0.50%
No change
The net OPEB liability (NOL) for the State Employee Health Insurance Credit Program represents the program’s total OPEB liability determined in accordance with GASB Statement No. 74, less the associated fiduciary net position. As of June 30, 2022, NOL amounts for the VRS State Employee Health Insurance Credit Program are as follows (amounts expressed in thousands):
The total State Employee HIC OPEB liability is calculated by the System’s actuary, and the plan’s fiduciary net position is reported in the System’s financial statements. The net State Employee HIC OPEB liability is disclosed in accordance with the requirements of GASB Statement No. 74 in the System’s notes to the financial statements and required supplementary information.
The long-term expected rate of return on VRS System investments was determined using a log-normal distribution analysis in which best-estimate ranges of expected future real rates of return (expected returns, net of VRS System investment expense and inflation) are developed for each major asset class. These ranges are combined to produce the long-term expected rate of return by weighting the expected future real rates of return by the target asset allocation percentage and by adding expected inflation. The target asset allocation and best estimate of arithmetic real rates of return for each major class are summarized in the following table:
* The above allocation provides a one-year return of 7.83%. However, one-year returns do not take into account the volatility present in each of the asset classes. In setting the long-term expected return for the System, stochastic projections are employed to model future returns under various economic conditions. These results provide a range of returns over various time periods that ultimately provide a median return of 6.72%, including expected inflation of 2.50%.
On October 10, 2019, the VRS Board elected a long-term rate of 6.75% which is roughly at the 40th percentile of expected long-term results of the VRS fund asset allocation at that time, providing a median return of 7.11%, including expected inflation of 2.50% asset allocation.
The discount rate used to measure the total State Employee HIC OPEB was 6.75%. The projection of cash flows used to determine the discount rate assumed that employer contributions will be made in accordance with the VRS funding policy at rates equal to the actuarially determined contribution rates adopted by the VRS Board of Trustees. Through the fiscal year ending June 30, 2022, the rate contributed by the Partnership for the VRS State Employee Health Insurance Credit Program will be subject to the portion of the VRS Board-certified rates that are funded by the Virginia General Assembly, which was 100% of the actuarially determined contribution rate. From July 1, 2022 on, all agencies are assumed to continue to contribute 100% of the actuarially determined contribution rates. Based on those assumptions, the State Employee HIC OPEB plan’s fiduciary net position was projected to be available to make all projected future benefit payments of current active and inactive employees. Therefore, the long-term expected rate of return was applied to all periods of projected benefit payments to determine the total State Employee HIC OPEB liability.
The following presents the Partnership’s proportionate share of the VRS State Employee Health Insurance Credit Program net NIC OPEB liability using the discount rate of 6.75%, as well as what the Partnership’s proportionate share of the net HIC OPEB liability would be if it were calculated using a discount rate that is one percentage point lower (5.75%) or one percentage point higher (7.75%) than the current rate:
Partnership’s proportionate share of the VRS State Employee HIC OPEB Plan Net HIC OPEB Liability
1,750,127 $ 1,558,558 $ 1,394,090
Detailed information about the VRS State Employee Health Insurance Credit Program’s Fiduciary Net Position is available in the separately issued VRS 2022 Annual Comprehensive Financial Report (Annual Report). A copy of the 2022 VRS Annual Report may be downloaded from the VRS website at: https://www.varetire.org/pdf/publications/2022-annual-report.pdf or by writing to the System’s Chief Financial Officer at P.O. Box 2500, Richmond, VA, 23218-2500.
General Information about the Group Life Insurance Program
Plan Description
All full-time, salaried permanent employees of the state agencies, teachers and employees of participating political subdivisions are automatically covered by the VRS Group Life Insurance Program upon employment. This plan is administered by the Virginia Retirement System (the System), along with pensions and other OPEB plans, for public employer groups in the Commonwealth of Virginia.
In addition to the Basic Group Life Insurance benefit, members are also eligible to elect additional coverage for themselves as well as a spouse or dependent children through the Optional Group Life Insurance Program. For members who elect the optional group life insurance coverage, the insurer bills employers directly for the premiums. Employers deduct these premiums from members’ paychecks and pay the premiums to the insurer. Since this is a separate and fully insured program, it is not included as part of the Group Life Insurance Program OPEB.
The specific information for the Group Life Insurance Program OPEB, including eligibility, coverage and benefits is set out in the table below:
The Group Life Insurance Program was established July 1, 1960, for state employees, teachers and employees of political subdivisions that elect the program, including the following employers that do not participate in VRS for retirement:
• City of Richmond
• City of Portsmouth
• City of Roanoke
• City of Norfolk
• Roanoke City School Board
Basic group life insurance coverage is automatic upon employment. Coverage ends for employees who leave their position before retirement eligibility or who take a refund of their accumulated retirement member contributions and accrued interest.
The benefits payable under the Group Life Insurance Program have several components.
• Natural Death Benefit – The natural death benefit is equal to the employee’s covered compensation rounded to the next highest thousand and then doubled.
• Accidental Death Benefit – The accidental death benefit is double the natural death benefit.
• Other Benefit Provisions – In addition to the basic natural and accidental death benefits, the program provides additional benefits provided under specific circumstances. These include:
o Accidental dismemberment benefit
o Seatbelt benefit
o Repatriation benefit
o Felonious assault benefit
o Accelerated death benefit option
The benefit amounts provided to members covered under the Group Life Insurance Program are subject to a reduction factor. The benefit amount reduces by 25% on January 1 following one calendar year of separation. The benefit amount reduces by an additional 25% on each subsequent January 1 until it reaches 25% of its original value.
For covered members with at least 30 years of service credit, there is a minimum benefit payable under the Group Life Insurance Program. The minimum benefit was set at $8,000 by statute in 2015. This will be increased annually based on the VRS Plan 2 cost-of-living adjustment calculation. The minimum benefit adjusted for the COLA was $8,984 as of June 30, 2023.
The contribution requirements for the Group Life Insurance Program are governed by §51.1-506 and §51.1508 of the Code of Virginia, as amended, but may be impacted as a result of funding provided to the Partnership by the Virginia General Assembly. The total rate for the Group Life Insurance Program was 1.34% of covered employee compensation. This was allocated into an employee and an employer component using a 60/40 split. The employee component was 0.80% (1.34% X 60%) and the employer component was 0.54% (1.34% X 40%). Employers may elect to pay all or part of the employee contribution, however the employer must pay all of the employer contribution. The Partnership’s contractually required employer contribution rate for the year ended June 30, 2023 was 0.54% of covered employee compensation. This rate was based on an actuarially determined rate from an actuarial valuation as of June 30, 2021. The actuarially determined rate, when combined with employee contributions, was expected to finance the costs of benefits payable during the year, with an additional amount to finance any unfunded accrued liability. Contributions from the Partnership to the Group Life Insurance Program were $91,547 and $78,144 for the years ended June 30, 2023 and June 30, 2022, respectively.
In June 2022, the Commonwealth made a special contribution of approximately $30.4 million to the Group Life Insurance plan. This special payment was authorized by a Budget Amendment included in Chapter 1 of the 2022 Appropriation Act.
Group Life Insurance Program OPEB Liabilities, Group Life Insurance Program OPEB Expense, and Deferred Outflows of Resources and Deferred Inflows of Resources Related to the Group Life Insurance Program OPEB
At June 30, 2023, the Partnership reported a liability of $801,085 for its proportionate share of the Net Group Life Insurance Program OPEB Liability. The Net Group Life Insurance Program OPEB Liability was measured as of June 30, 2022 and the total Group Life Insurance Program OPEB Liability used to calculate the Net Group Life Insurance OPEB Liability was determined by an actuarial valuation performed as of June 30, 2021, and rolled forward to the measurement date of June 30, 2022. The Partnership’s proportion of the Net Group Life Insurance Program OPEB Liability was based on the Partnership’s actuarially determined employer contributions to the Group Life Insurance Program for the year ended June 30, 2022, relative to the total of the actuarially determined employer contributions for all participating employers. At June 30, 2022, the Partnership’s proportion was 0.06653 % as compared to 0. 05958% at June 30, 2021.
For the year ended June 30, 2023, the Partnership recognized Group Life Insurance Program OPEB expense of $84,581. Since there was a change in proportionate share between measurement dates, a portion of the Group Life Insurance Program OPEB expense was related to deferred amounts from changes in proportion.
At June 30, 2023, the Partnership reported deferred outflows of resources and deferred inflows of resources related to the Group Life Insurance Program OPEB from the following sources:
difference between projected and actual earnings on
contribution subsequent to the measurement date
$91,547 reported as deferred outflows of resources related to the Group Life Insurance Program OPEB resulting from the Partnership’s contributions subsequent to the measurement date will be recognized as a reduction of the Net Group Life Insurance Program OPEB Liability in the Fiscal Year ending June 30, 2024. Other amounts reported as deferred outflows of resources and deferred inflows of resources related to the Group Life Insurance Program OPEB will be recognized in the Group Life Insurance Program OPEB expense in future reporting periods as follows:
Year Ended June 30
The total Group Life Insurance Program OPEB liability was based on an actuarial valuation as of June 30, 2021, using the Entry Age Normal actuarial cost method and the following assumptions, applied to all periods included in the measurement and rolled forward to the measurement date of June 30, 2022.
of return 6.75%, net of plan investment expenses, including inflation
Pre-Retirement:
Pub-2010 Amount Weighted General Employee Rates projected generationally; females set forward 2 years
Post-Retirement:
Pub-2010 Amount Weighted General Healthy Retiree Rates projected generationally; 110% of rates for females
Post-Disablement:
Pub-2010 Amount Weighted General Disabled Rates projected generationally; males and females set forward 3 years
Beneficiaries and Survivors:
Pub-2010 Amount Weighted General Contingent Annuitant Rates projected generationally; 110% of rates for males and females
Mortality Improvement Scale:
Rates projected generationally with Modified MP-2020 Improvement Scale that is 75% of the MP2020 rates
The actuarial assumptions used in the June 30, 2021 valuation were based on the results of an actuarial experience study for the period from July 1, 2016 through June 30, 2020, except the change in the discount rate, which was based on VRS Board action effective as of July 1, 2019. Changes to the actuarial assumptions as a result of the experience study and VRS Board action are as follows:
Mortality Rates (Pre-retirement, post-retirement healthy, and disabled)
Retirement Rates
Withdrawal Rates
Disability Rates
Salary Scale
Line of Duty Disability
Discount Rate
Update to PUB2010 public sector mortality tables. For future mortality improvements, replace load with a modified Mortality Improvement Scale MP2020
Adjusted rates to better fit experience for Plan 1; set separate rates based on experience for Plan 2/Hybrid; changed final retirement age from 75 to 80 for all
Adjusted rates to better fit experience at each year age and service through 9 years of service
No change
No change
No change
No change
Pre-Retirement:
Pub-2010 Amount Weighted Teachers Employee Rates projected generationally; 110% of rates for males
Post-Retirement:
Pub-2010 Amount Weighted Teachers Healthy Retiree Rates projected generationally; males set forward 1 year; 105% of rates for females
Post-Disablement:
Pub-2010 Amount Weighted Teachers Disabled Rates projected generationally; 110% of rates for males and females
Beneficiaries and Survivors:
Pub-2010 Amount Weighted Teachers Contingent Annuitant Rates projected generationally
Mortality Improvement Scale:
Rates projected generationally with Modified MP-2020 Improvement Scale that is 75% of the MP2020 rates
The actuarial assumptions used in the June 30, 2021 valuation were based on the results of an actuarial experience study for the period from July 1, 2016 through June 30, 2020, except the change in the discount rate, which was based on VRS Board action effective as of July 1, 2019. Changes to the actuarial assumptions as a result of the experience study and VRS Board action are as follows:
Mortality Rates (Pre-retirement, post-retirement healthy, and disabled)
Retirement Rates
Withdrawal Rates
Update to PUB2010 public sector mortality tables. For future mortality improvements, replace load with a modified Mortality Improvement Scale MP2020
Adjusted rates to better fit experience for Plan 1; set separate rates based on experience for Plan2/Hybrid; changed final retirement age from 75 to 80 for all
Adjusted rates to better fit experience at each year age and service through 9 years of service
Disability Rates No change
Salary Scale No change
Discount Rate No change
Pre-Retirement:
Pub-2010 Amount Weighted Safety Employee Rates projected generationally; 95% of rates for males; 105% of rates for females set forward 2 years
Post-Retirement:
Pub-2010 Amount Weighted Safety Healthy Retiree Rates projected generationally; 110% of rates for males; 105% of rates for females set forward 3 years
Post-Disablement:
Pub-2010 Amount Weighted General Disabled Rates projected generationally; 95% of rates for males set back 3 years; 90% of rates for females set back 3 years
Beneficiaries and Survivors:
Pub-2010 Amount Weighted Safety Contingent Annuitant Rates projected generationally; 110% of rates for males and females set forward 2 years
Mortality Improvement Scale:
Rates projected generationally with Modified MP-2020 Improvement Scale that is 75% of the MP2020 rates
The actuarial assumptions used in the June 30, 2021 valuation were based on the results of an actuarial experience study for the period from July 1, 2016 through June 30, 2020, except the change in the discount rate, which was based on VRS Board action effective as of July 1, 2019. Changes to the actuarial assumptions as a result of the experience study and VRS Board action are as follows:
Mortality Rates (Pre-retirement, post-retirement healthy, and disabled)
Retirement Rates
Withdrawal Rates
Disability Rates
Salary Scale
Line of Duty Disability
Discount Rate
Mortality rates – VaLORS Employees
Pre-Retirement:
Update to PUB2010 public sector mortality tables. For future mortality improvements, replace load with a modified Mortality Improvement Scale MP2020
Increased rates for ages 55 to 61, 63, and 64 with 26 or more years of service; changed final retirement age from 65 to 70
Decreased rate for 0 years of service and increased rates for 1 to 6 years of service
No change
No change
No change
No change
Pub-2010 Amount Weighted Safety Employee Rates projected generationally; 95% of rates for males; 105% of rates for females set forward 2 years
Post-Retirement:
Pub-2010 Amount Weighted Safety Healthy Retiree Rates projected generationally; 110% of rates for males; 105% of rates for females set forward 3 years
Post-Disablement:
Pub-2010 Amount Weighted General Disabled Rates projected generationally; 95% of rates for males set back 3 years; 90% of rates for females set back 3 years
Beneficiaries and Survivors:
Pub-2010 Amount Weighted Safety Contingent Annuitant Rates projected generationally; 110% of rates for males and females set forward 2 years
Mortality Improvement Scale:
Rates projected generationally with Modified MP-2020 Improvement Scale that is 75% of the MP2020 rates
The actuarial assumptions used in the June 30, 2021 valuation were based on the results of an actuarial experience study for the period from July 1, 2016 through June 30, 2020, except the change in the discount rate, which was based on VRS Board action effective as of July 1, 2019. Changes to the actuarial assumptions as a result of the experience study and VRS Board action are as follows:
Mortality Rates (Pre-retirement, post-retirement healthy, and disabled)
Retirement Rates
Withdrawal Rates
Disability Rates
Salary Scale
Line of Duty Disability
Discount Rate
Mortality rates – JRS Employees
Pre-Retirement:
Update to PUB2010 public sector mortality tables. For future mortality improvements, replace load with a modified Mortality Improvement Scale MP2020
Increased rates a some younger ages, decreased at age 62, and changed final retirement age from 65 to 70
Adjusted rates to better fit experience at each year age and service through 9 years of service
No change
No change
No change
No change
Pub-2010 Amount Weighted General Employee Rates projected generationally; males set forward 2 years
Post-Retirement:
Pub-2010 Amount Weighted General Healthy Retiree Rates projected generationally; 95% of rates for males and females set back 2 years
Post-Disablement:
Pub-2010 Amount Weighted General Disabled Rates projected generationally
Beneficiaries and Survivors:
Pub-2010 Amount Weighted Safety Contingent Annuitant Rates projected generationally
Mortality Improvement Scale:
Rates projected generationally with Modified MP-2020 Improvement Scale that is 75% of the MP2020 rates
The actuarial assumptions used in the June 30, 2021 valuation were based on the results of an actuarial experience study for the period from July 1, 2016 through June 30, 2020, except the change in the discount rate, which was based on VRS Board action effective as of July 1, 2019. Changes to the actuarial assumptions as a result of the experience study and VRS Board action are as follows:
Mortality Rates (Pre-retirement, post-retirement healthy, and disabled)
Retirement Rates
Withdrawal Rates
Disability Rates
Salary Scale
Discount Rate
Review separately from State employees because exhibit fewer deaths. Update to PUB2010 public sector mortality tables. For future mortality improvements, replace load with a modified Mortality Improvement Scale MP-2020
Decreased rates for ages 60-66 and 70-72
No change
No change
Reduce increases across all ages by 0.50%
No change
Pre-Retirement:
Pub-2010 Amount Weighted Safety Employee Rates projected generationally; males set forward 2 years; 105% of rates for females set forward 3 years
Post-Retirement:
Pub-2010 Amount Weighted Safety Healthy Retiree Rates projected generationally; 95% of rates for males set forward 2 years; 95% of rates for females set forward 1 year
Post-Disablement:
Pub-2010 Amount Weighted General Disabled Rated projected generationally; 110% of rates for males set forward 3 years; 110% of rates for females set forward 2 years
Beneficiaries and Survivors:
Pub-2010 Amount Weighted Safety Contingent Annuitant Rates projected generationally
Mortality Improvement Scale:
Rates projected generationally with Modified MP-2020 Improvement Scale that is 75% of the MP2020 rates
The actuarial assumptions used in the June 30, 2021 valuation were based on the results of an actuarial experience study for the period from July 1, 2016 through June 30, 2020, except the change in the discount rate, which was based on VRS Board action effective as of July 1, 2019. Changes to the actuarial assumptions as a result of the experience study and VRS Board action are as follows:
Mortality Rates (Pre-retirement, post-retirement healthy, and disabled)
Retirement Rates
Withdrawal Rates
Disability Rates
Salary Scale
Line of Duty Disability
Discount Rate
Update to PUB2010 public sector mortality tables. For future mortality improvements, replace load with a modified Mortality Improvement Scale MP2020
Adjusted rates to better fit experience for Plan 1; set separate rates based on experience for Plan2/Hybrid; changed final retirement age from 75 to 80 for all
Adjusted rates to better fit experience at each age and service decrement through 9 years of service
No change
No change
No change
No change
Pre-Retirement:
Pub-2010 Amount Weighted Safety Employee Rates projected generationally; males set forward 2 years; 105% of rates for females set forward 3 years
Post-Retirement:
Pub-2010 Amount Weighted Safety Healthy Retiree Rates projected generationally; 95% of rates for males set forward 2 years; 95% of rates for females set forward 1 year
Post-Disablement:
Pub-2010 Amount Weighted General Disabled Rates projected generationally; 110% of rates for males set forward 3 years; 110% of rates for females set forward 2 years
Beneficiaries and Survivors:
Pub-2010 Amount Weighted Safety Contingent Annuitant Rates projected generationally
Mortality Improvement Scale:
Rates projected generationally with Modified MP-2020 Improvement Scale that is 75% of the MP2020 rates
The actuarial assumptions used in the June 30, 2021 valuation were based on the results of an actuarial experience study for the period from July 1, 2016 through June 30, 2020, except the change in the discount rate, which was based on VRS Board action effective as of July 1, 2019. Changes to the actuarial assumptions as a result of the experience study and VRS Board action are as follows:
Mortality Rates (Pre-retirement, post-retirement healthy, and disabled)
Retirement Rates
Withdrawal Rates
Disability Rates
Salary Scale
Line of Duty Disability
Discount Rate
Update to PUB2010 public sector mortality tables. For future mortality improvements, replace load with a modified Mortality Improvement Scale MP2020
Adjusted rates to better fit experience for Plan 1; set separate rates based on experience for Plan2/Hybrid; changed final retirement age from 75 to 80 for all
Adjusted rates to better fit experience at each age and service decrement through 9 years of service
No change
No change
No change
No change
Pre-Retirement:
Pub-2010 Amount Weighted Safety Employee Rates projected generationally; 95% of rates for males; 105% of rates for females set forward 2 years
Post-Retirement:
Pub-2010 Amount Weighted Safety Healthy Retiree Rates projected generationally; 110% of rates for males; 105% of rates for females set forward 3 years
Post-Disablement:
Pub-2010 Amount Weighted General Disabled Rates projected generationally; 95% of rates for males set back 3 years; 90% of rates for females set back 3 years
Beneficiaries and Survivors:
Pub-2010 Amount Weighted Safety Contingent Annuitant Rates projected generationally; 110% of rates for males and females set forward 2 years
Mortality Improvement Scale:
Rates projected generationally with Modified MP-2020 Improvement Scale that is 75% of the MP2020 rates
The actuarial assumptions used in the June 30, 2021 valuation were based on the results of an actuarial experience study for the period from July 1, 2016 through June 30, 2020, except the change in the discount rate, which was based on VRS Board action effective July 1, 2019. Changes to the actuarial assumptions as a result of the experience study and VRS Board action are as follows:
Mortality Rates (Pre-retirement, post-retirement healthy, and disabled)
Update to PUB2010 public sector mortality tables. Increased disability life expectancy. For future mortality improvements, replace load with a modified Mortality Improvement Scale MP-2020
Retirement Rates Adjusted rates to better fit experience and changed final retirement age from 65 to 70
Withdrawal Rates
Decreased rates
Disability Rates No change
Salary Scale
Line of Duty Disability
Discount Rate
No change
No change
No change
Pre-Retirement:
Pub-2010 Amount Weighted Safety Employee Rates projected generationally; 95% of rates for males; 105% of rates for females set forward 2 years
Post-Retirement:
Pub-2010 Amount Weighted Safety Healthy Retiree Rates projected generationally; 110% of rates for males; 105% of rates for females set forward 3 years
Post-Disablement:
Pub-2010 Amount Weighted General Disabled Rates projected generationally; 95% of rates for males set back 3 years; 90% of rates for females set back 3 years
Beneficiaries and Survivors:
Pub-2010 Amount Weighted Safety Contingent Annuitant Rates projected generationally; 110% of rates for males and females set forward 2 years
Mortality Improvement Scale:
Rates projected generationally with Modified MP-2020 Improvement Scale that is 75% of the MP2020 rates
The actuarial assumptions used in the June 30, 2021 valuation were based on the results of an actuarial experience study for the period from July 1, 2016 through June 30, 2020, except the change in the discount rate, which was based on VRS Board action effective as of July 1, 2019. Changes to the actuarial assumptions as a result of the experience study and VRS Board action are as follows:
Mortality Rates (Pre-retirement, post-retirement healthy, and disabled)
Retirement Rates
Withdrawal Rates
Disability Rates
Salary Scale
Line of Duty Disability
Discount Rate
Update to PUB2010 public sector mortality tables. Increased disability life expectancy. For future mortality improvements, replace load with a modified Mortality Improvement Scale MP-2020
Adjusted rates to better fit experience and changed final retirement age from 65 to 70
Decreased rates and changed from rates based on age and service to rates based on service only to better fit experience and to be more consistent with Locals Top 10 Hazardous Duty
No change
No change
No change
No change
The net OPEB liability (NOL) for the Group Life Insurance Program represents the program’s total OPEB liability determined in accordance with GASB Statement No. 74, less the associated fiduciary net position. As of the Measurement Date of June 30, 2022, NOL amounts for the Group Life Insurance Program are as follows (amounts expressed in thousands):
Group Life Insurance OPEB Program
Total Group Life Insurance Program OPEB Liability
$ 3,672,085
Plan Fiduciary Net Position 2,467,989
Group Life Insurance Program Net OPEB Liability (Asset)
$ 1,204,096
Plan Fiduciary Net Position as a Percentage of the Total Group Life Insurance Program OPEB Liability 67.21%
The total Group Life Insurance Program OPEB liability is calculated by the System’s actuary, and each plan’s fiduciary net position is reported in the System’s financial statements. The net Group Life Insurance Program OPEB liability is disclosed in accordance with the requirements of GASB Statement No. 74 in the System’s notes to the financial statements and required supplementary information.
The long-term expected rate of return on the System’s investments was determined using a log-normal distribution analysis in which best-estimate ranges of expected future real rates of return (expected returns, net of System’s investment expense and inflation) are developed for each major asset class. These ranges are combined to produce the long-term expected rate of return by weighting the expected future real rates of return by the target asset allocation percentage and by adding expected inflation. The target asset allocation and best estimate of arithmetic real rates of return for each major class are summarized in the following table:
* The above allocation provides a one-year return of 7.83%. However, one-year returns do not take into account the volatility present in each of the asset classes. In setting the long-term expected return for the System, stochastic projections are employed to model future returns under various economic conditions. These results provide a range of returns over various time periods that ultimately provide a median return of 6.72%, including expected inflation of 2.50%.
On October 10, 2019, the VRS Board elected a long-term rate of 6.75%, which is roughly at the 40th percentile of expected long-term results of the VRS fund asset allocation at that time, providing a median return of 7.11%, including expected inflation of 2.50%.
The discount rate used to measure the total Group Life Insurance Program OPEB liability was 6.75%. The projection of cash flows used to determine the discount rate assumed that employer contributions will be made in accordance with the VRS funding policy and at rates equal to the actuarially determined contribution rates adopted by the VRS Board of Trustees. Through the fiscal year ending June 30, 2022, the rate contributed by the Partnership for the Group Life Insurance Program OPEB will be subject to the portion of the VRS Board-certified rates that are funded by the Virginia General Assembly which was 100% of the actuarially determined contribution rate. From July 1, 2022 on, employers are assumed to continue to contribute 100% of the actuarially determined contribution rates. Based on those assumptions, the Group Life Insurance Program OPEB’s fiduciary net position was projected to be available to make all projected future benefit payments of eligible employees. Therefore, the long-term expected rate of return was applied to all periods of projected benefit payments to determine the total Group Life Insurance Program OPEB liability.
The following presents the Partnership’s proportionate share of the net Group Life Insurance Program OPEB liability using the discount rate of 6.75%, as well as what the Partnership’s proportionate share of the net Group Life Insurance Program OPEB liability would be if it were calculated using a discount rate that is one percentage point lower (5.75%) or one percentage point higher (7.75%) than the current rate:
Partnership’s proportionate share of the Group Life Insurance Program Net OPEB Liability
Detailed information about the Group Life Insurance Program’s Fiduciary Net Position is available in the separately issued VRS 2022 Annual Comprehensive Financial Report (Annual Report). A copy of the 2022 VRS Annual Report may be downloaded from the VRS website at: https://www.varetire.org/pdf/publications/2022-annual-report.pdf or by writing to the System’s Chief Financial Officer at P.O. Box 2500, Richmond, VA, 23218-2500.
General Information about the VRS Disability Insurance Program
Plan Description
All Partnership full-time and part-time permanent salaried employees who are covered under the Virginia Retirement System (VRS) hired on or after January 1, 1999 are automatically covered by the Disability Insurance Program (VSDP) upon employment. The Disability Insurance Program also covers state employees hired before January 1, 1999 who elected to transfer to VSDP rather than retain their eligibility to be considered for disability retirement. This plan is administered by the Virginia Retirement System (the System), along with pensions and other OPEB plans, for public employer groups in the Commonwealth of Virginia.
The specific information for the Disability Insurance Program OPEB, including eligibility, coverage and benefits is set out in the table below:
The Virginia Sickness and Disability Program, also known as the Disability Insurance Trust Fund, was established January 1, 1999 to provide short-term and long-term disability benefits for non-work-related and work-related disabilities.
Eligible employees are enrolled automatically upon employment. They include:
• Full-time and part-time permanent salaried state employees covered under VRS.
• State employees hired before January 1, 1999, who elected to transfer to VSDP rather than retain their eligibility to be considered for VRS disability retirement.
• Public college and university faculty members who elect the VRS defined benefit plan. They may participate in VSDP or their institution’s disability program, if offered. If the institution does not offer the program or the faculty member does not make an election, he or she is enrolled in VSDP.
The Virginia Sickness and Disability Program provides the following benefits for eligible employees:
• Leave – Sick, family and personal leave. Eligible leave benefits are paid by the employer.
• Short-Term Disability – The program provides a short-term disability benefit beginning after a seven-calendar-day waiting period for the first day of disability. The benefit provides income replacement beginning at 100% of the employee’s pre-disability income, reducing to 80% and then 60% based on the period of the disability and the length of service of the employee. Shortterm disability benefits are paid by the employer.
• Long-Term Disability – The program provides a long-term disability benefit beginning after 125 workdays of short-term disability and continuing until the employee reaches his or her normal retirement age. The benefit provides income replacement of 60% of the employee’s predisability income. If an employee becomes disabled within five years of his or her normal retirement age, the employee will receive up to five years of VSDP benefits, provided he or she remains medically eligible. Long-term disability benefits are paid for by the Virginia Disability Insurance Program (VSDP) OPEB Plan.
• Income Replacement Adjustment – The program provides for an income replacement adjustment to 80% for catastrophic conditions.
• VSDP Long-Term Care Plan – The program also includes a self-funded long-term care plan that assists with the cost of covered long-term care services.
Disability Insurance Program (VSDP) Plan Notes:
• Employees hired or rehired on or after July 1, 2009, must satisfy eligibility periods before becoming eligible for non-work-related short-term disability benefits and certain incomereplacement levels.
• A state employee who is approved for VSDP benefits on or after the date that is five years prior to his or her normal retirement date is eligible for up to five years of VSDP benefits.
• Employees on work-related short-term disability receiving only a workers’ compensation payment may be eligible to purchase service credit for this period if retirement contributions are not being withheld from the workers’ compensation payment. The rate will be based on 5.00% of the employee’s compensation.
• During periods an employee receives long-term disability (LTD) benefits, the LTD benefit may be increased annually by an amount recommended by the actuary and approved by the Board.
o Plan 1 employees vested as of 1/1/2013 – 100% of the VRS Plan 1 COLA (The first 3% increase in the Consumer Price Index for all Urban Consumers (CIP-U) and half of any additional increase (up to 4%) up to a maximum COLA of 5%).
o Plan 1 employees non-vested as of 1/1/2013, Plan 2 and Hybrid Plan employees – 100% of the VRS Plan 2 and Hybrid COLA (The first 2% increase in the Consumer Price Index for all Urban Consumers (CPI-U) and half of any additional increase (up to 2%) up to a maximum COLA of 3%).
• For participating full-time employees taking service retirement, the creditable compensation may be increased annually by an amount recommended by the actuary and approved by the Board, from the date of the commencement of the disability to the date of retirement.
o 100% of the increase in the pay over the previous plan year for continuing VSDP members in the State Plan, with a maximum COLA of 4.00%.
• For participating full-time employees receiving supplemental (work-related) disability benefits, the creditable compensation may be increased annually by an amount recommended by the actuary and approved by the Board, from the date of the commencement of the disability to the date of retirement.
o 100% of the increase in the pay over the previous plan year for continuing VSDP members in the State Plan, with a maximum COLA of 4.00%.
The contribution requirements for the Disability Insurance Program are governed by §51.1-1140 of the Code of Virginia, as amended, but may be impacted as a result of funding provided to the Partnership by the Virginia General Assembly. The Partnership’s contractually required employer contribution rate for the Disability Insurance Program for the year ended June 30, 2023 was 0.61% of covered employee compensation. This rate was based on an actuarially determined rate from an actuarial valuation as of June 30, 2021. The actuarially determined rate was expected to finance the costs of benefits payable during the year, with an adjustment to amortize the accrued OPEB assets. Contributions from the Partnership to the
Disability Insurance Program were $101,060 and $85,751 for the years ended June 30, 2023 and June 30, 2022, respectively.
At June 30, 2023, the Partnership reported an asset of $901,425 for its proportionate share of the Net VSDP OPEB Asset. The Net VSDP OPEB Asset was measured as of June 30, 2022 and the total VSDP OPEB Liability used to calculate the Net VRS VSDP OPEB Asset was determined by an actuarial valuation as of June 30, 2021 and rolled forward to the measurement date of June 30, 2022. The Partnership’s proportion of the Net VSDP OPEB Asset was based on the Partnership’s actuarially determined employer contributions to the VSDP OPEB plan for the year ended June 30, 2022 relative to the total of the actuarially determined employer contributions for all participating employers. At June 30, 2022, the Partnership’s proportion was 0.30541% as compared to 0.27681% at June 30, 2021.
For the year ended June 30, 2023, the Partnership recognized VSDP OPEB expense of ($22,794). Since there was a change in proportionate share between measurement dates, a portion of the VSDP OPEB expense was related to deferred amounts from changes in proportion.
At June 30, 2023, the Partnership reported deferred outflows of resources and deferred inflows of resources related to the VSDP OPEB from the following sources:
and actual
$101,060 reported as deferred outflows of resources related to the VSDP OPEB resulting from the Partnership’s contributions subsequent to the measurement date will be recognized as a reduction of the Net VSDP OPEB Asset in the Fiscal Year ending June 30, 2024. Other amounts reported as deferred outflows of resources and deferred inflows of resources related to the VSDP OPEB will be recognized in VSDP OPEB expense in future reporting periods as follows:
Year Ended June 30
FY 2024 $ (70,796)
FY 2025 $ (68,734)
FY 2026 $ (73,828)
FY 2027 $ (15,476)
FY 2028 $ (10,411) Thereafter $ (1,375)
The total VSDP OPEB liability was based on an actuarial valuation as of June 30, 2021, using the Entry Age Normal actuarial cost method and the following assumptions, applied to all periods included in the measurement and rolled forward to the measurement date of June 30, 2022.
Investment rate of return
Pre-Retirement:
6.75%, net of plan investment expenses, including inflation
Pub-2010 Amount Weighted General Employee Rates projected generationally; females set forward 2 years
Post-Retirement:
Pub-2010 Amount Weighted General Healthy Retiree Rates projected generationally; 110% of rates for females
Post-Disablement:
Pub-2010 Amount Weighted General Disabled Rates projected generationally; males and females set forward 3 years
Beneficiaries and Survivors:
Pub-2010 Amount Weighted General Contingent Annuitant Rates projected generationally; 110% of rates for males and females
Mortality Improvement Scale: Rates projected generationally with Modified MP-2020 Improvement Scale that is 75% of the MP-2020 rates
The actuarial assumptions used in the June 30, 2021 valuation were based on the results of an actuarial experience study for the period from July 1, 2016 through June 30, 2020, except the change in the discount rate, which was based on VRS Board action effective as of July 1, 2019. Changes to the actuarial assumptions as a result of the experience study and VRS Board action are as follows:
Mortality Rates (Pre-retirement, post-retirement healthy, and disabled)
Retirement Rates
Withdrawal Rates
Disability Rates
Salary Scale
Line of Duty Disability
Discount Rate
Pre-Retirement:
Update to PUB2010 public sector mortality tables. For future mortality improvements, replace load with a modified Mortality Improvement Scale MP2020
Adjusted rates to better fit experience for Plan 1; set separate rates based on experience for Plan 2/Hybrid; changed final retirement age from 75 to 80 for all
Adjusted rates to better fit experience at each year age and service through 9 years of service
No change
No change
No change
No change
Pub-2010 Amount Weighted Safety Employee Rates projected generationally; 95% of rates for males; 105% of rates for females set forward 2 years
Post-Retirement:
Pub-2010 Amount Weighted Safety Healthy Retiree Rates projected generationally; 110% of rates for males; 105% of rates for females set forward 3 years
Post-Disablement:
Pub-2010 Amount Weighted General Disabled Rates projected generationally; 95% of rates for males set back 3 years; 90% of rates for females set back 3 years
Beneficiaries and Survivors:
Pub-2010 Amount Weighted General Contingent Annuitant Rates projected generationally; 110% of rates for males and females set forward 2 years
Mortality Improvement Scale:
Rates projected generationally with Modified MP-2020 Improvement Scale that is 75% of the MP-2020 rates
The actuarial assumptions used in the June 30, 2021 valuation were based on the results of an actuarial experience study for the period from July 1, 2016 through June 30, 2020, except the change in the discount rate, which was based on VRS Board action effective as of July 1, 2019. Changes to the actuarial assumptions as a result of the experience study and VRS Board action are as follows:
Mortality Rates (Pre-retirement, post-retirement healthy, and disabled)
Retirement Rates
Withdrawal Rates
Disability Rates
Salary Scale
Line of Duty Disability
Discount Rate
Pre-Retirement:
Update to PUB2010 public sector mortality tables. Increased disability life expectancy. For future mortality improvements, replace load with a modified Mortality Improvement Scale MP-2020
Increased rates for ages 55 to 61, 63, and 64 with 26 or more years of service and changed final retirement age from 65 to 70
Decreased rate for 0 years of service and increased rates for 1 to 6 years of service
No change
No change
No change
No change
Pub-2010 Amount Weighted Safety Employee Rates projected generationally; 95% of rates for males; 105% of rates for females set forward 2 years
Post-Retirement:
Pub-2010 Amount Weighted Safety Healthy Retiree Rates projected generationally; 110% of rates for males; 105% of rates for females set forward 3 years
Post-Disablement:
Pub-2010 Amount Weighted General Disabled Rates projected generationally; 95% of rates for males set back 3 years; 90% of rates for females set back 3 years
Beneficiaries and Survivors:
Pub-2010 Amount Weighted Safety Contingent Annuitant Rates projected generationally; 110% of rates for males and females set forward 2 years
Mortality Improvement Scale:
Rates projected generationally with Modified MP-2020 Improvement Scale that is 75% of the MP-2020 rates
The actuarial assumptions used in the June 30, 2021 valuation were based on the results of an actuarial experience study for the period from July 1, 2016 through June 30, 2020, except the change in the discount rate, which was based on VRS Board action effective as of July 1, 2019. Changes to the actuarial assumptions as a result of the experience study and VRS Board action are as follows:
Mortality Rates (Pre-retirement, post-retirement healthy, and disabled)
Retirement Rates
Withdrawal Rates
Disability Rates
Salary Scale
Line of Duty Disability
Discount Rate
Update to PUB2010 public sector mortality tables. Increased disability life expectancy. For future mortality improvements, replace load with a modified Mortality Improvement Scale MP-2020
Increased rates at some younger ages, decreased at age 62, and changed final retirement age from 65 to 70
Adjusted rates to better fit experience at each age and service decrement through 9 years of service
No change
No change
No change
No change
The net OPEB asset (NOA) for the VSDP represents the program’s total OPEB liability determined in accordance with GASB Statement No. 74, less the associated fiduciary net position. As of the Measurement Date of June 30, 2022, NOA amounts for the VSDP are as follows (amounts expressed in thousands):
Virginia Sickness and Disability Program
Total VSDP OPEB Liability
$307,764 Plan Fiduciary Net Position 602,916
Employers’ Net OPEB Liability (Asset)
Plan Fiduciary Net Position as a Percentage of the Total VSDP OPEB Liability
($295,152)
The total VSDP OPEB liability is calculated by the System’s actuary, and each plan’s fiduciary net position is reported in the System’s financial statements. The net OPEB asset is disclosed in accordance with the requirements of GASB Statement No. 74 in the System’s notes to the financial statements and required supplementary information.
The long-term expected rate of return on System investments was determined using a log-normal distribution analysis in which best-estimate ranges of expected future real rates of return (expected returns, net of VRS System investment expense and inflation) are developed for each major asset class. These ranges are combined to produce the long-term expected rate of return by weighting the expected future real rates of return by the target asset allocation percentage and by adding expected inflation. The target asset allocation and best estimate of arithmetic real rates of return for each major class are summarized in the following table:
* The above allocation provides a one-year return of 7.83%. However, one-year returns do not take into account the volatility present in each of the asset classes. In setting the long-term expected return for the System, stochastic projections are employed to model future returns under various economic conditions. These results provide a range of returns over various time periods that ultimately provide a median return of 6.72%, including expected inflation of 2.50%.
On October 10, 2019, the VRS Board elected a long-term rate of 6.75%, which was roughly at the 40th percentile of expected long-term results of the VRS fund asset allocation at that time, providing a median return of 7.11%, including expected inflation of 2.50%.
The discount rate used to measure the total VSDP OPEB liability was 6.75%. The projection of cash flows used to determine the discount rate assumed that employer contributions will be made per the VRS Statutes and that they will be made in accordance with the VRS funding policy and at rates equal to the actuarially determined rates adopted by the VRS Board of Trustees. Through the fiscal year ending June 30, 2022, the rate contributed by the Partnership to the VSDP OPEB Program will be subject to the portion of the VRS Board-certified rates that are funded by the Virginia General Assembly which was 100% of the actuarially determined contribution rate. From July 1, 2022 on, participating employers are assumed to continue to contribute 100% of the actuarially determined contribution rates. Based on those assumptions, the VSDP OPEB Program’s fiduciary net position was projected to be available to make all projected future benefit payments of current active and inactive employees. Therefore, the long-term expected rate of return was applied to all periods of projected benefit payments to determine the total VSDP OPEB liability.
The following presents the Partnership’s proportionate share of the net VSDP OPEB asset using the discount rate of 6.75%, as well as what the Partnership’s proportionate share of the net VSDP OPEB asset would be if it were calculated using a discount rate that is one percentage point lower (5.75%) or one percentage point higher (7.75%) than the current rate:
Partnership’s proportionate share of the total VSDP Net OPEB Asset $ 829,681 $ 901,425 $ 964,463
Detailed information about the VSDP Fiduciary Net Position is available in the separately issued VRS 2022 Annual Comprehensive Financial Report (Annual Report). A copy of the 2022 VRS Annual Report may be downloaded from the VRS website at: https://www.varetire.org/pdf/publications/2022-annual- report.pdf or by writing to the System’s Chief Financial Officer at P.O. Box 2500, Richmond, VA, 23218- 2500.
General Information about the Commonwealth of Virginia State Health Plans Program for Pre-Medicare Retirees
Plan Description
The Commonwealth provides a healthcare plan established by Title 2.2, Chapter 28 of the Code of Virginia for retirees who are not yet eligible to participate in Medicare.
Following are eligibility requirements for Virginia Retirement System (VRS) retirees:
• You are a retiring state employee who is eligible for a monthly retirement benefit from VRS, and
• You start receiving (do not defer) your retirement benefit immediately upon retirement*, and
• Your last employer before retirement was the Commonwealth of Virginia, and
• You were eligible for (even if you were not enrolled) coverage as an active employee in the State Health Benefits Program until your retirement date (not including Extended Coverage/COBRA), and
• You enroll no later than 31 days from your retirement date.
*For VRS retirees, this means that your employing agency reported a retirement contribution or leave without pay status for retirement in the month immediately prior to your retirement date. Some faculty members may also be eligible if they are paid on an alternate pay cycle but maintain eligibility for active coverage until their retirement date.
Effective January 1, 2017**, following are eligibility requirements for Optional Retirement Plan retirees:
• You are a terminating state employee who participates in one of the qualified Optional Retirement Plans, and
• Your last employer before termination was the Commonwealth of Virginia, and
• You were eligible for (even if you were not enrolled) coverage in the State Employee Health Benefits Program for active employees at the time of your termination, and
• You meet the age and service requirements for an immediate retirement benefit under the non-ORP Virginia Retirement System plan that you would have been eligible for on your date of hire had you not elected the ORP, and
• You enroll in the State Retiree Health Benefits Program no later than 31 days for the date you lose coverage (or lose eligibility for coverage) in the State Health Benefits Program for active employees due to your termination of employment.
**This change applies to ORP terminations effective January 1, 2017 or later. Eligibility for those who terminated employment prior to January 1 should be determined based on the policy in place at the time of their termination.
The employer does not pay a portion of the retirees’ healthcare premium; however, since both active employees and retirees are included in the same pool for purposes of determining health insurance rates, this generally results in a higher rate for active employees. Therefore, the employer effectively subsidizes the costs of the participating retirees’ healthcare through payment of the employer’s portion of the premiums for active employees.
This fund is reported as part of the Commonwealth’s Healthcare Internal Service Fund. Benefit payments are recognized when due and payable in accordance with the benefit terms. Pre-Medicare Retiree Healthcare is a single-employer defined benefit OPEB plan that is treated like a cost-sharing plan for financial reporting purposes and is administered by the Department of Human Resource Management. There were approximately 3,647 retirees and 92,839 active employees in the program as of June 30, 2022. There are no inactive employees entitled to future benefits who are not currently receiving benefits. There are no assets accumulated in a trust to pay benefits.
Pre-Medicare Retiree Healthcare OPEB Liabilities, OPEB Expense, and Deferred Outflows of Resources and Deferred Inflows of Resources
At June 30, 2023, the Partnership reported a liability of $591,583 for its proportionate share of the collective total PreMedicare Retiree Healthcare OPEB liability of $363.4 million. The Pre-Medicare Retiree Healthcare OPEB liability was measured as of June 30, 2022 and was determined by an actuarial valuation as of June 30, 2022. The Partnership’s proportion of the Pre-Medicare Retiree Healthcare OPEB liability was based on the Partnership’s calculated healthcare premium contributions, to include the December premium holiday amounts, as a percentage of the total employer’s calculated healthcare premium contributions for all participating employers. At June 30, 2022, the Partnership’s proportion was 0.16278% as compared to 0.14837% at June 30, 2021. For the year ended June 30, 2023, the Partnership recognized Pre-Medicare Retiree Healthcare OPEB expense of ($229,491).
At June 30, 2023, the Partnership reported deferred outflows of resources and deferred inflows of resources related to PreMedicare Retiree Healthcare from the following sources:
associated with transactions subsequent to the measurement date
$64,685 reported as deferred outflows of resources related to the Pre-Medicare Retiree Healthcare OPEB resulting from amounts associated with transactions subsequent to the measurement date will be recognized as a reduction of the total OPEB Liability in the fiscal year ending June 30, 2023. Other amounts reported as deferred outflows of resources and deferred inflows of resources related to the Pre-Medicare Retiree Healthcare OPEB will be recognized in the Pre-Medicare Retiree Healthcare OPEB expense as follows:
Year Ended June 30
FY 2024 $ (250,896)
FY 2025 $ (153,763)
FY 2026 $ (47,606)
FY 2027 $ (11,959)
FY 2028 $ (2,867) Thereafter $ -
The following presents the Partnership’s proportionate share of the Pre-Medicare Retiree Healthcare OPEB liability using the discount rate of 3.54%, as well as what the Partnership’s proportionate share of the PreMedicare Retiree Healthcare OPEB liability would be if it were calculated using a discount rate that is one percentage point lower (2.54%) or one percentage point higher (4.54%) than the current rate:
Partnership’s proportionate share of the OPEB
The following presents the Partnership’s proportionate share of the Pre-Medicare Retiree Healthcare OPEB liability using a healthcare cost trend of 8.00% decreasing to 4.50%, as well as what the Partnership’s proportionate share of the Pre-Medicare Retiree Healthcare OPEB liability would be if it were calculated using a healthcare cost trend rate that is one percentage point lower (7.00% decreasing to 3.50%) or one percentage point higher (9.00% decreasing to 5.50%) than the current rate:
1.00% Decrease 7.00% decreasing to 3.50% Trend Rate 8.00% decreasing to 4.50% 1.00% Increase 9.00% decreasing to 5.50%
Partnership’s proportionate share of the OPEB Liability $ 538,568 $ 591,583 $ 652,630
The total Pre-Medicare Retiree Healthcare OPEB liability was based on an actuarial valuation with a valuation date of June 30, 2022. The Department of Human Resource Management selected the economic, demographic and healthcare claim cost assumptions. The actuary provided guidance with respect to these assumptions. Initial healthcare costs trend rates used were 8.00 percent for medical and pharmacy and 4.0 percent for dental. The ultimate trend rates used were 4.50 percent for medical and pharmacy and 4.0 percent for dental.
Valuation Date
Actuarially determined contribution rates are calculated as of June 30, one year prior to the end of the fiscal year in which contributions are reported.
Measurement Date June 30, 2022 (one year prior to the end of the fiscal year)
Actuarial Cost Method
Amortization Method
Entry Age Normal
Level dollar, Closed
Effective Amortization Period 5.86 years
Discount Rate 3.54%
Projected Salary Increases
Medical Trend Under 65
5.35% to 3.50% based on years of service from 1 year to 20 years or more
Medical & Rx: 8.00% to 4.50%
Dental: 4.00%
Year of Ultimate Trend 2033
Mortality
Mortality rates vary by participant status and gender
Pre-Retirement:
Pub-2010 Benefits Weighted General Employee Rates projected generationally with a Modified MP-2021 Improvement Scale; females set forward 2 years
Post-Retirement:
Pub-2010 Benefits Weighted General Healthy Retiree Rates projected generationally with a Modified MP-2021 Improvement Scale; 110% of rates for females
Post-Disablement:
Pub-2010 Benefits Weighted General Disabled Rates projected generationally with a Modified MP-2021 Improvement Scale; males and females set forward 3 years
Beneficiaries and Survivors:
Pub-2010 Amount Weighted Safety Contingent Annuitant Rates projected generationally with a Modified MP-2021 Improvement Scale; 110% of rates for males and females
The discount rate was based on the Bond Buyers GO 20 Municipal Bond Index as of the measurement date which is June 30, 2022.
The following actuarial assumptions were updated since the June 30, 2021 valuation based on recent experience:
Retiree Participation
Reduced the rate from 40% to 35%
Retiree participation was based on a blend of recent experience and the prior year assumptions.
The trend rates were updated based on economic conditions as of June 30, 2022. Additionally, the discount rate was increased from 2.16% to 3.54% based on the Bond Buyers GO 20 Municipal Bond index as of June 30, 2023.
There were no plan changes in the valuation since the prior year.
Employees of the Partnership may participate in the Commonwealth’s Deferred Compensation Plan. Participating employees can contribute to the plan each pay period with the Partnership matching up to $20 per pay period. The dollar amount of the match can change depending on the funding available in the Partnership’s budget. The Deferred Compensation Plan is a qualified defined contribution plan under Section 401(a) of the Internal Revenue Code. Employer contributions under the Deferred Compensation Plan were $35,991 for the year ended June 30, 2023.
The Partnership is exposed to various risks of loss related to torts; theft, damage, or destruction of assets; errors and omissions; non-performance of duty; injuries to employees; and natural disasters. The Partnership is insured for these risks through commercial insurance policies. Further, the Partnership is insured for workers compensation and for loss from employee actions by an insurance policy issued by the Chubb Group and the Great Northern Insurance Company. Policy coverage for loss from employee actions is $50,000 per year with a $1,000 deductible for each loss.
The Partnership participates in the state health care insurance plan maintained by the Commonwealth of Virginia, which is administered by DHRM. The Partnership pays premiums to DHRM for health insurance coverage. Information relating to the Commonwealth's insurance plan is available at the statewide level in the Commonwealth of Virginia's Annual Comprehensive Financial Report.
Schedule of Employer's Share of Net Pension Liability
VRS State Employee Retirement Plan
For the Measurement Dates of June 30, 2014 through 2022
Employer’s Proportion of the Net Pension Liability (Asset)
Employer’s Proportionate Share of the Net Pension Liability (Asset)
Employer’s Covered Payroll
Employer’s Proportionate Share of the Net Pension Liability (Asset) as a Percentage of its Covered Payroll
Schedule is intended to show information for 10 years. Since 2022 is the ninth year for this presentation, there are only nine years available. However, additional years will be included as they become available.
Required Supplementary Information
Schedule of Employer Contributions
VRS State Employee Retirement Plan
For the Years Ended June 30, 2014 through 2023
Notes to Required Supplementary Information for the Year Ended June 30, 2023
Changes of benefit terms – There have been no actuarially material changes to the System benefit provisions since the prior actuarial valuation.
Changes of assumptions – The actuarial assumptions used in the June 30, 2021 valuation were based on the results of an actuarial experience study for the period from July 1, 2016 through June 30, 2020, except the change in the discount rate, which was based on VRS Board action effective as of July 1, 2019. Changes to the actuarial assumptions for the VRS State Employee Retirement Plan as a result of the experience study and VRS Board action are as follows:
Mortality Rates (Pre-retirement, post-retirement healthy, and disabled)
Retirement Rates
Withdrawal Rates
Update to PUB2010 public sector mortality tables. For future mortality improvements, replace load with a modified Mortality Improvement Scale MP-2020
Adjusted rates to better fit experience for Plan 1; set separate rates based on experience for Plan 2/Hybrid; changed final retirement ages from 75 to 80 for all
Adjusted rates to better fit experience at each year age and service through 9 years of service
Schedule of Employer's Share of Net OPEB Liability Health Insurance Credit Program (HIC) For the Measurement Dates of June 30, 2017 through 2022
Employer’s Proportion of the Net HIC OPEB Liability (Asset)
Employer’s Proportionate Share of the Net HIC OPEB Liability (Asset)
Employer’s Covered Payroll
Employer’s Proportionate Share of the Net HIC OPEB Liability (Asset) as a Percentage of its Covered Payroll
Schedule is intended to show information for 10 years. Since 2022 is the sixth year for this presentation, there are only six years available. However, additional years will be included as they become available.
Required Supplementary Information
Schedule of Employer Contributions Health Insurance Credit Program (HIC)
For the Years Ended June 30, 2014 through 2023
Changes of benefit terms – There have been no actuarially material changes to the System benefit provisions since the prior actuarial valuation.
Changes of assumptions – The actuarial assumptions used in the June 30, 2021 valuation were based on the results of an actuarial experience study for the period from July 1, 2016 through June 30, 2020, except the change in the discount rate, which was based on VRS Board action effective as of July 1, 2019. Changes to the actuarial assumptions as a result of the experience study and VRS Board action are as follows:
General State Employees:
Mortality Rates (Pre-retirement, post-retirement healthy, and disabled)
Retirement Rates
Withdrawal Rates
Disability Rates
Update to PUB2010 public sector mortality tables. For future mortality improvements, replace load with a modified Mortality Improvement Scale MP-2020
Adjusted rates to better fit experience for Plan 1; set separate rates based on experience for Plan2/Hybrid; changed final retirement age from 75 to 80 for all
Adjusted rates to better fit experience at each year age and service through 9 years of service
No change
Salary Scale No change
Line of Duty Disability No change
Discount Rate No change
SPORS Employees:
Mortality Rates (Pre-retirement, post-retirement healthy, and disabled)
Retirement Rates
Withdrawal Rates
Update to PUB2010 public sector mortality tables. For future mortality improvements, replace load with a modified Mortality Improvement Scale MP-2020
Increased rates for ages 55 to 61, 63, and 64 with 26 or more years of service; changed final retirement age from 65 to 70
Decreased rate for 0 years of service and increased rates for 1 to 6 years of service
Disability Rates No change
Salary Scale No change
Line of Duty Disability No change
Discount Rate No change
Notes to Required Supplementary Information for the Year Ended June 30, 2023
VaLORS Employees:
Mortality Rates (Pre-retirement, post-retirement healthy, and disabled)
Retirement Rates
Withdrawal Rates
Disability Rates
Salary Scale
Line of Duty Disability
JRS Employees:
Mortality Rates (Pre-retirement, post-retirement healthy, and disabled)
Update to PUB2010 public sector mortality tables. For future mortality improvements, replace load with a modified Mortality Improvement Scale MP-2020
Increased rates at some younger ages, decreased at age 62, and changed final retirement age from 65 to 70
Adjusted rates to better fit experience at each year age and service through 9 years of service
change
change
change
Review separately from State employees because exhibit fewer deaths. Update to PUB2010 public sector mortality tables. For future mortality improvements, replace load with a modified Mortality Improvement Scale MP-2020
Retirement Rates
Decreased rates for ages 60-66 and 70-72
Withdrawal Rates No change
Disability
Schedule of Employer’s Share of Net OPEB Liability
Group Life Insurance Program (GLI)
For the Measurement Dates of June 30, 2017 through 2022
Employer’s Proportion of the Net GLI OPEB Liability (Asset)
Employer’s Proportionate Share of the Net GLI OPEB Liability (Asset)
Employer’s Covered Payroll
Employer’s Proportionate Share of the Net GLI OPEB Liability (Asset) as a Percentage of its Covered Payroll
Schedule is intended to show information for 10 years. Since 2022 is the sixth year for this presentation, there are only six years available. However, additional years will be included as they become available.
Required Supplementary Information
Schedule of Employer Contributions
Group Life Insurance Program
For the Years Ended June 30, 2014 through 2023
Changes of benefit terms – There have been no actuarially material changes to the System benefit provisions since the prior actuarial valuation.
Changes of assumptions – The actuarial assumptions used in the June 30, 2021 valuation were based on the results of an actuarial experience study for the period from July 1, 2016 through June 30, 2020, except the change in the discount rate, which was based on VRS Board action effective as of July 1, 2019. Changes to the actuarial assumptions as a result of the experience study and VRS Board action are as follows:
Mortality Rates (Pre-retirement, post-retirement healthy, and disabled)
Retirement Rates
Withdrawal Rates
Disability Rates
Update to PUB2010 public sector mortality tables. For future mortality improvements, replace load with a modified Mortality Improvement Scale MP-2020
Adjusted rates to better fit experience for Plan 1; set separate rates based on experience for Plan 2/Hybrid; changed final retirement age from 75 to 80 for all
Adjusted rates to better fit experience at each year age and service through 9 years of service
No change
Salary Scale No change
Line of Duty Disability No change
Discount Rate No change
Teachers:
Mortality Rates (Pre-retirement, post-retirement healthy, and disabled)
Retirement Rates
Withdrawal Rates
Disability Rates
Update to PUB2010 public sector mortality tables. For future mortality improvements, replace load with a modified Mortality Improvement Scale MP-2020
Adjusted rates to better fit experience for Plan 1; set separate rates based on experience for Plan2/Hybrid; changed final retirement age from 75 to 80 for all
Adjusted rates to better fit experience at each year age and service through 9 years of service
No change
Salary Scale No change
Discount Rate No change
Notes to Required Supplementary Information for the Year Ended June 30, 2023
SPORS Employees:
Mortality Rates (Pre-retirement, post-retirement healthy, and disabled)
Retirement Rates
Withdrawal Rates
Disability Rates
Salary Scale
Line of Duty
Discount Rate
VaLORS Employees:
Mortality Rates (Pre-retirement, post-retirement healthy, and disabled)
Retirement Rates
Withdrawal Rates
Disability Rates
Salary Scale
Discount
JRS Employees:
Mortality Rates (Pre-retirement, post-retirement healthy, and disabled)
Update to PUB2010 public sector mortality tables. For future mortality improvements, replace load with a modified Mortality Improvement Scale MP-2020
Increased rates for ages 55 to 61, 63, and 64 with 26 or more years of service; changed final retirement age from 65 to 70
Decreased rate for 0 years of service and increased rates for 1 to 6 years of service
change
change
change
change
Update to PUB2010 public sector mortality tables. For future mortality improvements, replace load with a modified Mortality Improvement Scale MP-2020
Increased rates at some younger ages, decreased at age 62, and changed final retirement age from 65 to 70
Adjusted rates to better fit experience at each year age and service through 9 years of service
change
change
Retirement Rates
Review separately from State employees because exhibit fewer deaths. Update to PUB2010 public sector mortality tables. For future mortality improvements, replace load with a modified Mortality Improvement Scale MP-2020
Decreased rates for ages 60-66 and 70-72
Withdrawal Rates No change
Disability Rates No change
Salary Scale
change
Notes to Required Supplementary Information for the Year Ended June 30, 2023
Mortality Rates (Pre-retirement, post-retirement healthy, and disabled)
Retirement Rates
Withdrawal Rates
Disability Rates
Salary Scale
Line of Duty Disability
Update to PUB2010 public sector mortality tables. For future mortality improvements, replace load with a modified Mortality Improvement Scale MP-2020
Adjusted rates to better fit experience for Plan 1; set separate rates based on experience for Plan2/Hybrid; changed final retirement age from 75 to 80 for all
Adjusted rates to better fit experience at each age and service decrement through 9 years of service
change
change
change Discount Rate
change
Mortality Rates (Pre-retirement, post-retirement healthy, and disabled)
Retirement Rates
Withdrawal Rates
Disability Rates
Salary Scale
Line of Duty Disability
Discount Rate
Update to PUB2010 public sector mortality tables. For future mortality improvements, replace load with a modified Mortality Improvement Scale MP-2020
Adjusted rates to better fit experience for Plan 1; set separate rates based on experience for Plan2/Hybrid; changed final retirement age from 75 to 80 for all
Adjusted rates to better fit experience at each age and service decrement through 9 years of service
change
change
change
change
Notes to Required Supplementary Information for the Year Ended June 30, 2023
Largest Ten Locality Employers – Hazardous Duty Employees:
Mortality Rates (Pre-retirement, post-retirement healthy, and disabled)
Retirement Rates
Withdrawal Rates
Update to PUB2010 public sector mortality tables. Increased disability life expectancy. For future mortality improvements, replace load with a modified Mortality Improvement Scale MP-2020
Adjusted rates to better fit experience and changed final retirement age from 65 to 70
Decreased rates
Disability Rates No change
Salary Scale
change
Line of Duty Disability No change
Discount Rate No change
Non-Largest Ten Locality Employers – Hazardous Duty Employees:
Mortality Rates (Pre-retirement, post-retirement healthy, and disabled)
Retirement Rates
Withdrawal Rates
Update to PUB2010 public sector mortality tables. Increased disability life expectancy. For future mortality improvements, replace load with a modified Mortality Improvement Scale MP-2020
Adjusted rates to better fit experience and changed final retirement age from 65 to 70
Decreased rates and changed from rates based on age and service to rates based on service only to better fit experience and to be more consistent with Locals Top 10 Hazardous Duty
Disability Rates No change
Salary Scale
Line of Duty Disability
Discount Rate
change
change
change
Schedule of Employer’s Share of Net OPEB Asset Disability Insurance Program (VSDP) For the Measurement Dates of June 30, 2017 through 2022
Employer’s Proportion of the Net VSDP OPEB Asset
Employer’s Proportionate Share of the Net VSDP OPEB Asset
Employer’s Covered Payroll
Employer’s Proportionate
Schedule is intended to show information for 10 years. Since 2022 is the sixth year for this presentation, there are only six years available. However, additional years will be included as they become available.
Required Supplementary Information
Schedule of Employer Contributions
Disability Insurance Program (VSDP)
For the Years Ended June 30, 2014 through 2023 Date Contractually
Notes to Required Supplementary Information for the Year Ended June 30, 2023
Changes of benefit terms – There have been no actuarially material changes to the System benefit provisions since the prior actuarial valuation.
Changes of assumptions – The actuarial assumptions used in the June 30, 2021 valuation were based on the results of an actuarial experience study for the period from July 1, 2016 through June 30, 2020, except the change in the discount rate, which was based on VRS Board action effective as of July 1, 2019. Changes to the actuarial assumptions as a result of the experience study and VRS Board action are as follows:
General State Employees:
Mortality Rates (Pre-retirement, post-retirement healthy, and disabled)
Retirement Rates
Withdrawal Rates
Disability Rates
Update to PUB2010 public sector mortality tables. For future mortality improvements, replace load with a modified Mortality Improvement Scale MP-2020
Adjusted rates to better fit experience for Plan 1; set separate rates based on experience for Plan 2/Hybrid; changed final retirement age from 75 to 80 for all
Adjusted rates to better fit experience at each year age and service through 9 years of service
No change
Salary Scale No change
Line of Duty Disability No change
Discount Rate No change
SPORS Employees:
Mortality Rates (Pre-retirement, post-retirement healthy, and disabled)
Retirement Rates
Withdrawal Rates
Disability Rates
Update to PUB2010 public sector mortality tables. Increased disability life expectancy. For future mortality improvements, replace load with a modified Mortality Improvement Scale MP-2020
Increased rates for ages 55 to 61, 63, and 64 with 26 or more years of service and changed final retirement age from 65 to 70
Decreased rate for 0 years of service and increased rates for 1 to 6 years of service
No change
Salary Scale No change
Line of Duty Disability No change
Discount Rate
No change
Notes to Required Supplementary Information for the Year Ended June 30, 2023
VaLORS Employees:
Mortality Rates (Pre-retirement, post-retirement healthy, and disabled)
Retirement Rates
Withdrawal Rates
Disability Rates
Salary Scale
Line of Duty Disability
Discount Rate
Update to PUB2010 public sector mortality tables. Increased disability life expectancy. For future mortality improvements, replace load with a modified Mortality Improvement Scale MP-2020
Increased rates at some younger ages, decreased at age 62, and changed final retirement age from 65 to 70
Adjusted rates to better fit experience at each year age and service through 9 years of service
No change
No change
No change
No change
Schedule of Employer’s Share of Total OPEB Liability
Pre-Medicare Retiree Healthcare Program
For the Measurement Dates of June 30, 2017 through 2022
Employer’s Proportion of the collective total OPEB Liability
Employer’s Proportionate Share of the collective total OPEB Liability
Employer’s CoveredEmployee Payroll
Employer’s Proportionate Share of the collective total OPEB liability as a Percentage of its CoveredEmployee Payroll
Schedule is intended to show information for 10 years. Since 2022 is the sixth year for this presentation, only six years of data is available. However, additional years will be included as they become available.
Notes to Required Supplementary Information for the Year Ended June 30, 2022
There are no assets accumulated in a trust to pay related benefits.
Changes of benefit terms – There have been no changes to the benefit provisions since the prior actuarial valuation.
Changes of assumptions – The following actuarial assumptions were updated since the June 30, 2021 valuation based on recent experience:
Retiree Participation Reduced the rate from 40% to 35%
Retiree participation was based on a blend of recent experience and the prior year assumptions.
The trend rates were updated based on economic conditions as of June 30, 2022. Additionally, the discount rate was decreased from 2.16% to 3.54% based on the Bond Buyers GO 20 Municipal Bond index as of June 30, 2023.

June 3, 2024
The Honorable Glenn Youngkin
Governor of Virginia
Joint Legislative Audit and Review Commission
Board of Directors
Virginia Economic Development Partnership
Jason El Koubi, President and CEO
Virginia Economic Development Partnership
Opinions
We have audited the financial statements of the governmental activities and each major fund of the Virginia Economic Development Partnership (Partnership), a component unit of the Commonwealth of Virginia, as of and for the year ended June 30, 2023, and the related notes to the financial statements, which collectively comprise the Partnership’s basic financial statements as listed in the table of contents.
In our opinion, the accompanying financial statements referred to above present fairly, in all material respects, the respective financial position of the governmental activities and each major fund of the Partnership as of June 30, 2023, and the respective changes in financial position and the budgetary comparison for the General Fund and Special Revenue Fund for the year then ended, in accordance with accounting principles generally accepted in the United States of America.
www.apa.virginia.gov | (804) 225-3350 | reports@apa.virginia.gov
We conducted our audit in accordance with auditing standards generally accepted in the United States of America (GAAS) and the standards applicable to financial audits contained in Government Auditing Standards issued by the Comptroller General of the United States (Government Auditing Standards). Our responsibilities under those standards are further described in the Auditor’s Responsibilities for the Audit of the Financial Statements section of our report. We are required to be independent of the Partnership, and to meet our other ethical responsibilities, in accordance with the relevant ethical requirements relating to our audit. We believe that the audit evidence we have obtained is sufficient and appropriate to provide a basis for our audit opinions.
As discussed in Notes 1.G., 6, 7 and 8 of the accompanying financial statements, for the year ended June 30, 2023, the Partnership implemented Governmental Accounting Standards Board Statement No. 96, Subscription-Based Information Technology Arrangements, related to accounting and financial reporting for subscription liabilities and right-to-use subscription assets. Our opinions are not modified with respect to this matter.
As discussed in Notes 1.Q., 6 and 7 of the accompanying financial statements, the fiscal year 2022 financial statements have been restated to correct a misstatement. Our opinions are not modified with respect to this matter.
Management is responsible for the preparation and fair presentation of the financial statements in accordance with accounting principles generally accepted in the United States of America, and for the design, implementation, and maintenance of internal control relevant to the preparation and fair presentation of financial statements that are free from material misstatement, whether due to fraud or error.
In preparing the financial statements, management is required to evaluate whether there are conditions or events, considered in the aggregate, that raise substantial doubt about the Partnership’s ability to continue as a going concern for twelve months beyond the financial statement date, including any currently known information that may raise substantial doubt shortly thereafter.
Our objectives are to obtain reasonable assurance about whether the financial statements as a whole are free from material misstatement, whether due to fraud or error, and to issue an auditor’s report that includes our opinions. Reasonable assurance is a high level of assurance but is not absolute
assurance and therefore is not a guarantee that an audit conducted in accordance with GAAS and Government Auditing Standards will always detect a material misstatement when it exists. The risk of not detecting a material misstatement resulting from fraud is higher than for one resulting from error, as fraud may involve collusion, forgery, intentional omissions, misrepresentations, or the override of internal control. Misstatements are considered material if there is a substantial likelihood that, individually or in the aggregate, they would influence the judgment made by a reasonable user based on the financial statements.
In performing an audit in accordance with GAAS and Government Auditing Standards, we:
• Exercise professional judgment and maintain professional skepticism throughout the audit.
• Identify and assess the risks of material misstatement of the financial statements, whether due to fraud or error, and design and perform audit procedures responsive to those risks. Such procedures include examining, on a test basis, evidence regarding the amounts and disclosures in the financial statements.
• Obtain an understanding of internal control relevant to the audit in order to design audit procedures that are appropriate in the circumstances, but not for the purpose of expressing an opinion on the effectiveness of the Partnership’s internal control. Accordingly, no such opinion is expressed.
• Evaluate the appropriateness of accounting policies used and the reasonableness of significant accounting estimates made by management, as well as evaluate the overall presentation of the financial statements.
• Conclude whether, in our judgement, there are conditions or events, considered in the aggregate, that raise substantial doubt about the Partnership’s ability to continue as a going concern for a reasonable period of time.
We are required to communicate with those charged with governance regarding, among other matters, the planned scope and timing of the audit, significant audit findings, and certain internal control-related matters that we identified during the audit.
Accounting principles generally accepted in the United States of America require that the following be presented to supplement the basic financial statements: Management’s Discussion and Analysis on pages 3 through 7; the Schedule of Employer’s Share of Net Pension Liability, the Schedule of Employer Contributions, and the Notes to Required Supplementary Information on pages 78 through 80; the Schedule of Employer’s Share of Net OPEB Liability, the Schedule of Employer’s Share of Net OPEB Asset, the Schedule of Employer Contributions, and the Notes to Required Supplementary Information for the Health Insurance Credit, Group Life Insurance, and Disability Insurance programs on pages 81 through 94; the Schedule of Employer’s Share of Total OPEB Liability and the Notes to Required
Supplementary Information for the Pre-Medicare Retiree Healthcare program on pages 95 through 96. Such information is the responsibility of management and, although not a part of the basic financial statements, is required by the Governmental Accounting Standards Board who considers it to be an essential part of financial reporting for placing the basic financial statements in an appropriate operational, economic, or historical context. We have applied certain limited procedures to the required supplementary information in accordance with auditing standards generally accepted in the United States of America, which consisted of inquiries of management about the methods of preparing the information and comparing the information for consistency with management’s responses to our inquiries, the basic financial statements, and other knowledge we obtained during our audit of the basic financial statements. We do not express an opinion or provide any assurance on the information because the limited procedures do not provide us with sufficient evidence to express an opinion or provide any assurance.
Management is responsible for the other information included in the annual report. The other information comprises the sections titled Who We Are, Our Partners, Leadership Message, Impact Metrics, Features, Project Case Studies, and Progress Reports, but does not include the basic financial statements and our auditor’s report thereon. Our opinions on the basic financial statements do not cover the other information, and we do not express an opinion or any form of assurance thereon.
In connection with our audit of the basic financial statements, our responsibility is to read the other information and consider whether a material inconsistency exists between the other information and the basic financial statements, or the other information otherwise appears to be materially misstated. If, based on the work performed, we conclude that an uncorrected material misstatement of the other information exists, we are required to describe it in our report.
In accordance with Government Auditing Standards, we have also issued our report dated June 3, 2024, on our consideration of the Partnership’s internal control over financial reporting and on our tests of its compliance with certain provisions of laws, regulations, contracts, grant agreements, and other matters. The purpose of that report is to describe the scope of our testing of internal control over financial reporting and compliance and the results of that testing, and not to provide an opinion on the effectiveness of internal control over financial reporting or on compliance. That report is an integral part of an audit performed in accordance with Government Auditing Standards in considering the Partnership’s internal control over financial reporting and compliance.
Staci A. Henshaw AUDITOR OF PUBLIC ACCOUNTS
LCW/clj

The Virginia Economic Development Partnership’s team of dedicated and knowledgeable professionals is committed to Virginia’s economic success, and connects industry-leading businesses to the resources they need to make relocations and expansions successful. From site selection, customized research, cost analysis, and coordination with public and private partners, to discretionary incentives and workforce solutions, VEDP’s services are tailored to companies’ unique requirements.
To learn more about VEDP’s expertise and resources, visit VEDP.org.