The Corcoran Report
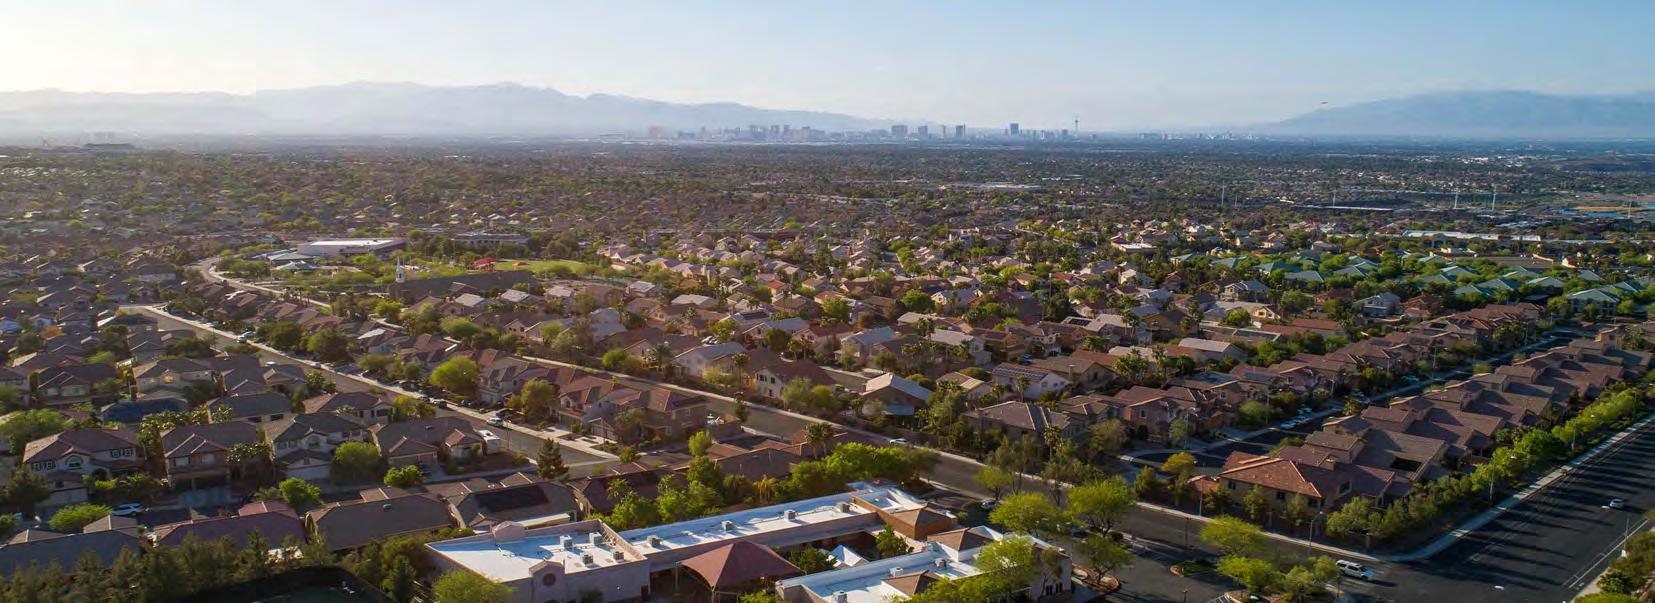
3Q | 2022 | HENDERSON

HENDERSON
Overview
Total Sold 1,347
-88.0% YEAR OVER YEAR
Total properties sold for Henderson changed -88.0% year-over-year to 1,347.
Highest Sale $7.0M
-42.9% YEAR OVER YEAR
The highest sale price in Henderson changed -42.9% year-over-year to $7.0M.
Days on Market 26
44.4% YEAR OVER YEAR
Average days on market for Henderson changed 44.4% to 26 days.
Lowest Sale $105K
54.4% YEAR OVER YEAR
The lowest sale price in Henderson changed 54.4% year-over-year to $105K.
Median Price
$475K
6.7% YEAR OVER YEAR
Median price in Henderson changed 6.7% year-over-year to $475K.
Average Price $568K
49.5% YEAR OVER YEAR
Average price in Henderson changed 49.5% year-over-year to $568K.
3Q2022 | HENDERSON

3Q2022 | ASCAYA | HENDERSON • Ascaya sales changed by -66.7% year-over-year. • The highest sale price changed by -33.3% year-over-year, while the lowest sale price changed 218.2% year-over-year. • Average days on market for Ascaya changed 336.4% to 96 days. • Ascaya average price changed 21.4% year-over-year, and the median price changed 52.2% year-over-year. Total Properties Sold 1 -66.7% YEAR OVER YEAR Average Price $7.0M 21.4% YEAR OVER YEAR Highest Sale $7.0M -33.3% YEAR OVER YEAR Median Price $7.0M 52.2% YEAR OVER YEAR Lowest Sale $7.0M 218.2% YEAR OVER YEAR Days on Market 96 336.4% YEAR OVER YEAR Ascaya
Country Club
highest sale price
sale price
year-over-year,
year-over-year.
3Q2022 | ANTHEM COUNTRY CLUB | HENDERSON • Anthem
sales changed by -39.5% year-over-year. • The
changed by 31.7%
while the lowest
changed -11.2%
• Average days on market for Anthem Country Club changed 82.4% to 31 days. • Anthem Country Club average price changed 12.2% year-over-year, and the median price changed 6.3% year-over-year. Total Properties Sold 23 -39.5% YEAR OVER YEAR Average Price $1.6M 12.2% YEAR OVER YEAR Highest Sale $5.4M 31.7% YEAR OVER YEAR Median Price $1.3M 6.3% YEAR OVER YEAR Lowest Sale $475K -11.2% YEAR OVER YEAR Days on Market 31 82.4% YEAR OVER YEAR Anthem Country Club
sale

year-over-year,
year-over-year.
3Q2022 | THE FOUNTAINS | HENDERSON • The Fountains sales changed by -78.6% year-over-year. • The highest
price changed by -84.5%
while the lowest sale price changed 4.4%
• Average days on market for The Fountains changed -37.2% to 27 days. • The Fountains average price changed -49.9% year-over-year, and the median price changed -29.0% year-over-year. Total Properties Sold 3 -78.6% YEAR OVER YEAR Average Price $1.5M -49.9% YEAR OVER YEAR Highest Sale $1.9M -84.5% YEAR OVER YEAR Median Price $1.5M -29.0% YEAR OVER YEAR Lowest Sale $1.2M 4.4% YEAR OVER YEAR Days on Market 27 -37.2% YEAR OVER YEAR The Fountains
MacDonald
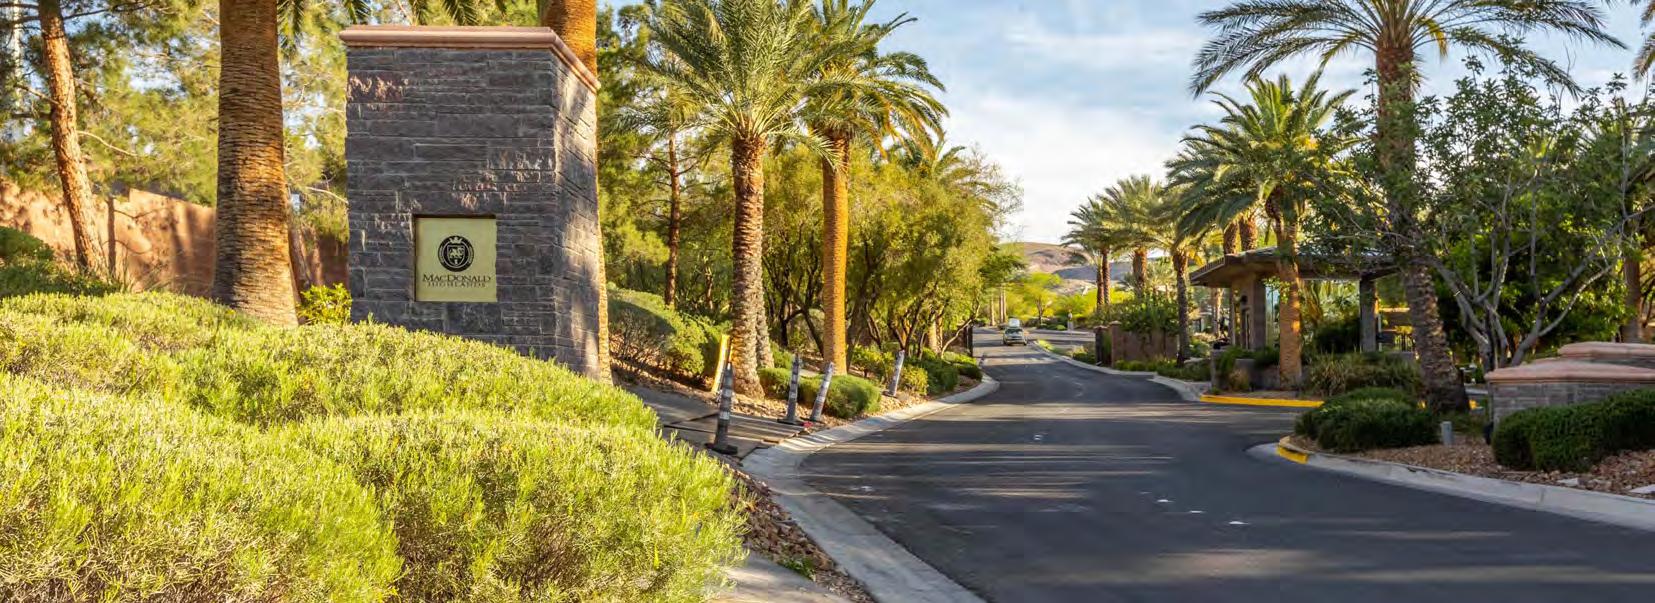
3Q2022 | MACDONALD HIGHLANDS | HENDERSON • MacDonald Highlands sales changed by -35.7% year-over-year. • The highest sale price changed by -57.1% year-over-year, while the lowest sale price changed -3.2% year-over-year. • Average days on market for MacDonald Highlands changed 118.6% to 94 days. • MacDonald Highlands average price changed -22.1% year-overyear, and the median price changed 0.6% year-over-year. Total Properties Sold 9 -35.7% YEAR OVER YEAR Average Price $2.4M -22.1% YEAR OVER YEAR Highest Sale $5.3M -57.1% YEAR OVER YEAR Median Price $2.2M 0.6% YEAR OVER YEAR Lowest Sale $1.1M -3.2% YEAR OVER YEAR Days on Market 94 118.6% YEAR OVER YEAR
Highlands

3Q2022 | LAKE LAS VEGAS | HENDERSON • Lake Las Vegas sales changed by -37.5% year-over-year. • The highest sale price changed by -56.7% year-over-year, while the lowest sale price changed 3.4% year-over-year. • Average days on market for Lake Las Vegas changed -7.5% to 37 days. • Lake Las Vegas average price changed -9.4% year-over-year, and the median price changed 1.0% year-over-year. Total Properties Sold 20 -37.5% YEAR OVER YEAR Average Price $908K -9.4% YEAR OVER YEAR Highest Sale $1.6M -56.7% YEAR OVER YEAR Median Price $795K 1.0% YEAR OVER YEAR Lowest Sale $508K 3.4% YEAR OVER YEAR Days on Market 37 -7.5% YEAR OVER YEAR Lake Las Vegas

3Q2022 | SEVEN HILLS | HENDERSON • Seven Hills sales changed by -46.2% year-over-year. • The highest sale price changed by -54.2% year-over-year, while the lowest sale price changed 239.9% year-over-year. • Average days on market for Seven Hills changed 82.9% to 64 days. • Seven Hills average price changed 0.2% year-over-year, and the median price changed 68.8% year-over-year. Total Properties Sold 7 -46.2% YEAR OVER YEAR Average Price $2.2M 0.2% YEAR OVER YEAR Highest Sale $3.2M -54.2% YEAR OVER YEAR Median Price $2.6M 68.8% YEAR OVER YEAR Lowest Sale $2.6M 239.9% YEAR OVER YEAR Days on Market 64 82.9% YEAR OVER YEAR Seven Hills
Methodology
The Corcoran Report offers current and valuable information regarding the local market. Each region reported on is broken down by neighborhood and contains specific details and insights related to that market.
METRICS
TOTAL PROPERTIES SOLD is the total number of properties that closed within the quarter reported.
HIGHEST SALE is the highest priced property that was sold in the area being reported on during the quarter reported.
LOWEST SALE is the lowest priced property that was sold in the area being reported on during the quarter reported.
AVERAGE PRICE is the price calculated by dividing the combined prices of properties by the amount of sold properties in that same area.
DISCLAIMER
MEDIAN PRICE is the middle or midpoint price where half of sales fall below and half fall above this number.
DAYS ON MARKET averages how long a unit takes to sell and is calculated from subtracting the list date from the date of close.
SOURCE
Figures in this report are based on publicly reported closed sales information via the Multiple Listing Service.
©2022 Corcoran Global Living. 1980 Festival Plaza Drive, Suite 460, Las Vegas, NV 89135. CA DRE# 02109201; NV B.1000747; OH REC.2021004219. All rights reserved. Corcoran® and the Corcoran Logo are registered service marks owned by Corcoran Group LLC. Corcoran Global Living fully supports the principles of the Fair Housing Act and the Equal Opportunity Act. Each franchise is independently owned and operated. Real estate agents affiliated with Corcoran Global Living are independent contractors and are not employees of Corcoran Global Living. Each office is independently owned and operated. All material presented herein is intended for information purposes only and has been compiled from sources deemed reliable. Based on information from Multiple Listing Servic. All data, including all measurements and calculations of area, is obtained from various sources and has not been, and will not be, verified by broker or MLS. All information should be independently reviewed and verified for accuracy. Properties may or may not be listed by the office/agent presenting the information. Though information is believed to be correct, it is presented subject to errors, omissions, changes or withdrawal notice.

